Abstract
Sodium chloride is a chemical compound that has been encountered by people for thousands of years, and plays a significant role in their lives. The aim of this article is to provide a comprehensive review of table salt from the perspective of health, food technology, and cultural heritage. The article discusses salt extraction and production, its composition and consumption, and its effects on the human body. The authors draw attention to new trends, such as the use of micronized salt, microencapsulated salt, and salt with colors and shapes that differ from those of typical table salt. Scientific studies on the presence of undesirable substances and the use of salt additives were reviewed. The role of salt in dairy, meat, and bakery technology was illustrated. Gaps in research on salt were highlighted. In the last part, all types of salt with geographical indications are shown. The paper suggests that producers with a long tradition in the salt sector should apply for the European geographical indications to enhance their national and cultural heritage and promote their region. The review highlights the need for further research on all aspects discussed.
1. Introduction
Over centuries, salt has transformed from a luxury good to a cheap, common product. In ancient times, it was a key commodity that often determined survival. Salt was used by humans to preserve food and as an additive to dishes. The expansion of salt utilization occurred only in the past two hundred years. The use of salt as a raw material in various industries has changed the structure of its use [1]. The chemical industry primarily utilizes salt for synthesizing chlorine, sodium hydroxide, sodium carbonate, hydrochloric acid, and various chlorides, along with other chemical substances. On a global scale, the consumption of salt for this purpose exceeds 60% of its production. Various industries, including refining, textiles, tanning, dyeing, paper, pharmaceuticals, cosmetics, metallurgy, and agriculture, utilize salt in smaller doses [2]. In countries with negative temperatures, salt is used to remove snow and ice from road surfaces [3]. In the United States, approximately 41% of total salt consumption is used for road de-icing, while only 4% is used for food processing [4].
The World Health Organization (WHO) recommends that adults consume less than 5 g of salt (less than 2 g of sodium) per day [5]. The 2013 WHO plan assumed a 30% reduction in salt consumption by the population over 12 years (by 2025). By the middle of that period, in 2019, no country had achieved the target level. Actions to reduce salt consumption are multifaceted. They include collaboration with the food industry, consumer education, changes to labeling systems, and salt taxes [6]. Data collected by Jeanke et al. [7] indicate that salt content can be reduced in two food products without significantly impacting consumer acceptability. These are bread and processed meat, where reductions of approximately 40% and 60%, respectively, are possible. No such clear results were obtained for other products. The study by Bobowski et al. [8] demonstrates that individuals with high hedonistic sensitivity struggle to adapt to the taste of products with reduced salt content.
Research conducted by Denver et al. [9] shows that salt is not as important to Danish consumers as other dietary recommendations, such as consuming vegetables and whole grains, and limiting sugar and fat intake. Salt content is a secondary factor when choosing products.
Salt has also found other uses as a medicinal agent. The most commonly used salt treatments include baths (with a recommended NaCl concentration of 1.5–6.0%), inhalation therapies (with a concentration of 0.3 to 3.0%), and speleotherapy [10]. Crenotherapy (drinking mineral waters) is seen less frequently compared to other methods. Natural brines are classified as therapeutic mineral waters, distinguished by their chemical and microbiological purity, as well as the inherent variability in their physical and chemical characteristics. These are underground waters with a total mineralization of at least 35 g/L, the main components of which are chloride and sodium ions. Water with a NaCl concentration of >1.5% is called brine, while below this value, salt water [11]. A salt concentration in water of 1.0–1.5% stimulates intestinal peristalsis and the secretion of digestive juices. The effectiveness of brines in therapy relies on their enhanced composition of bioelements (biophilic elements), particularly calcium, iodine, bromine, magnesium, boron, potassium, and lithium [12].
The aim of this article was to describe salt from various perspectives, with a particular focus on its effects in food. Economic, chemical, and nutritional aspects were discussed. A separate chapter was devoted to bread, meat, and dairy products, as they constitute the main sources of salt in the human diet in many countries [13]. Moreover, new risks associated with salt consumption and new trends in science and practice related to salt are described. The research gaps were identified, and the potential benefits of further research in this area were highlighted.
2. Salt Mining and Production
One of the oldest rock salt mines in the world was discovered in Azerbaijan (in Duzdagi). Scientists have proven that salt has been mined there since 5000 BC [14]. One of the oldest active salt mines is located in Poland. It is “Wieliczka”. Its exploitation on an industrial scale (using mining methods) lasted from the 1380s to 1996. Currently, salt is obtained in this plant exclusively from the evaporation of brine from mine waters [15].
Worldwide salt production exceeds 270 million tons per year (Table 1). Salt is obtained in the following ways:

Table 1.
List of countries with the largest salt production in 2023, by the United States National Minerals Information Center.
- From seawater, salt lakes, and their sediments (solar salt/pan salt);
- From brine (tunnels are drilled, water is added, the brine is pumped out, and then dried)—brine salt;
- From underground mines (rock salt).
The leading salt-producing countries are China, the United States, India, and Germany. Most of the salt is obtained from seawater, by evaporation. About one-sixth of its global production comes from underground mines, and the main producers are the United States, Canada, Germany, Pakistan, Belarus, and Italy [16].
In 1900 and 1905, India was the leader in salt production, generating 1.0 million tons and 1.2 million tons of salt, respectively [17].
A characteristic feature of mines is their longevity. The age of mines often exceeds 100 years. The Heilbronn mine (Germany) is one of the oldest active salt mines in Europe. Its construction began in 1881, and mining began on 4 December 1885. In 1984, the mine was merged with the neighboring Kochendorf mine. Since then, the mine has been the main German producer of rock salt and evaporated salt [18].
One of the recently opened mines in Europe is the Bądzów salt mine “KGHM Polska Miedź SA” (in Poland). The mine has been granted a concession to extract rock salt for 50 years, i.e., until 2063. Urbański and Gawlik described the characteristics of this mine and the modern equipment used to extract rock salt deposits [19].
Rock salt is transparent. There are, however, exceptions to this general rule. Pink salt is mined in Pakistan (commonly known as “Himalayan salt”) and also in Poland, in Kłodawa. The pink hue is caused by a small amount of iron oxide impurities present in the salt (Figure 1a). Another case is the blue-tinted salt from Iran (“Persian salt”) and from Poland, shown in Figure 1b (both pink and blue salts occur in the Kłodawa mine, also).
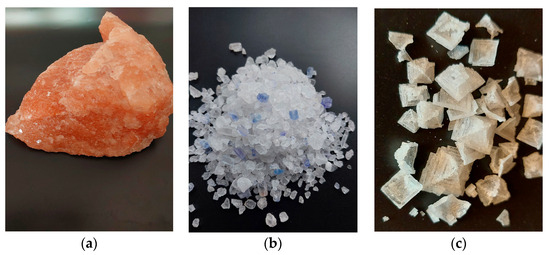
Figure 1.
(a–c) Different colors and shapes of salt (S. Chudy).
Disturbances in the crystal lattice give the impression of a color ranging from blue to navy blue. This was first described by the Polish researcher Kreutz. During the studies of salts from Stassfurt, Hallstadt, Hallein, and various samples from Kałuża, he found that blue salt does not contain any additives and its color is due to an optical effect [20]. Nassau identified different categories of imperfections related to color centers in ionic crystals [21]. A considerable number of researchers are still engaged in efforts to provide a more comprehensive analysis of electron anomalies occurring in salt [22,23]. The color and shape of salt crystals also depend on the conditions of purification and drying. Sodium chloride crystals, which grow very rapidly from a highly supersaturated solution, form a pyramidal form—a hopper crystal (Figure 1c). Such pyramids consist of a series of connected miniature cubic crystals [24].
A relatively new trend in food technology is the use of micronized salt (powdered salt, ground salt). The micronization process involves crushing salt particles (usually mechanically). So far, this process has most often been used in the pharmacy. Depending on the device and the process parameters used, very fine (10–100 µm), superfine (1–10 µm), and ultrafine (0.1–1 µm) particles can be obtained [25]. Micronized salt is available on the market, but there is no clear definition that specifies the maximum sizes of particles in such salt. In scientific studies [26,27], to obtain micronized salt, scientists used 60-mesh sieves. The size of the sieved crystals was less than 250 µm.
Micronized salt allows for a reduction in the amount of salt in a finished product. The dose of micronized salt compared to table salt can be reduced by up to half while still achieving a comparable saltiness. Araújo et al. [26] produced a fresh sausage with 50% less salt that was not sensorially different from traditional sausage.
Therefore, micronized salt can be used to produce products with reduced salt contents, which is currently a strong trend.
Fan et al. [28] presented a proposal for a low-sodium “micronized salt composite” technology. It was developed by integrating whey protein isolate, milk fat, and micronized NaCl. The new product was additionally characterized by greater resistance to clumping.
The methods of obtaining salt influence its composition (quantity and quality of impurities).
3. Salt Composition
Rock salt is a sedimentary rock, and its composition depends mainly on geological factors. Comparative studies of Polish and Himalayan salts have shown that salts of both types have an almost identical proportion of insoluble matter. Polish rock salt is characterized by a purity of 98.9% (1.1% of the insoluble part), and Himalayan salt is characterized by a purity of 98.8% (1.2% of the insoluble part). Salts of both types have a comparable chemical composition. Polish rock salt is richer in elements such as calcium, chromium, manganese, cobalt, strontium, rubidium, and barium. In contrast, Himalayan salt offers higher levels of potassium, magnesium, iron, copper, zinc, arsenic, selenium, and lead. Both types of salt have an almost identical content of rare-earth elements [29].
Jaworska and Niedzielski [30] analyzed six types of salt from six different countries. A high or the highest content of Mg, K, S, Si, Fe, Al, and Cr ions was recorded in the sea salt from France, which is produced from the water of the Atlantic Ocean. The daily intake of sea salt from France can provide about 10% of the daily magnesium requirement and about 2% of the iron requirement. Dead Sea salt can provide just under 10% of the daily manganese requirement. Table salt is the main source of sodium and chloride ions. Considering the daily level of salt consumption of about 5 g, it is not a key source of other essential macro- and microelements in the human diet.
The intentional addition of certain chemicals to table salt includes potassium ferrocyanide, potassium iodide, or iodate, as well as fluoride. Salt has hygroscopic properties, and in highly humid of air (75% and above), it binds water from the air and starts to clump. To reduce this phenomenon, some manufacturers add anti-caking (anti-agglomerating) substances to salt, e.g., potassium ferrocyanide (E536) in amounts of up to 8 mg/kg. However, the scientific literature indicates the harmfulness of this additive. The study by Basu and co-workers [31] demonstrated that potassium ferrocyanide exhibits toxic effects on cells and genetic material at concentrations ranging from 0 to 10 mM, while sodium ferrocyanide is not harmful to genetic material.
Table 2 lists salt additives (with anti-caking properties) that are suitable for salt, according to Codex Alimentraius [32].
Table 2.
Salt additives.
Due to the general deficiency of iodine in food—apart from in certain areas with significant seaweed intake and iodine-rich water—the iodization of salt becomes necessary for adequate human development. Currently, almost 90% of the global population uses iodized salt [33]. The EU does not have a single standard for all member states regarding salt iodization. In the 124 countries where iodization is mandatory, national standards apply. These standards specify the compounds to be used and their amounts [34]. The 2014 WHO guidelines recommend potassium iodate or potassium iodide as iodine compounds for salt fortification [35]. Polish rules specify that for every 100 g of table salt, there should be 2.3 ± 0.77 mg of iodine present. This amount is equivalent to 30 ± 10 mg of potassium iodide or 39.0 ± 13 mg of potassium iodate per kilogram of salt [36]. Potassium iodate (KIO3) is more stable than iodide (KI) and is more commonly used by manufacturers. Potassium iodide oxidizes to iodine, which is lost from the product through volatilization. Some countries allow the use of compounds other than those recommended by the WHO [34]. In Latvia, four compounds are permitted—sodium iodide (NaI), potassium iodide (KI), sodium iodate (NaIO3), and potassium iodate (KIO3) [37].
Potassium iodide is effective for the prophylaxis of iodine deficiency [38]. Scientists from the Medical University of Łódź (Poland) have proven that potassium iodide, used in doses generally recommended for iodine prophylaxis, increases the concentration of iodine in the thyroid gland, which can prevent its oxidative damage. Research indicates that potassium iodate lacks any direct positive impact on thyroid membrane lipids, and its effectiveness in iodine prophylaxis is not indisputable [39].
Iodine overdose has a toxic effect on the body. A concentration of KIO3 solution between 187 and 470 mg/kg body weight can damage eye cells [40]. The opposite conclusions resulted from the experience of Li et al. [41]. They proved (in an experiment on rats) that the body can utilize high doses of KIO3 ingested through the digestive tract.
An in-depth, detailed study is needed in the context of substances added to salt. Further steps may be needed to verify and amend regulations in this area.
Salt can also be fluoridated. In order to prevent tooth decay, the first attempts to add this element to salt appeared in Switzerland in 1956. After 26 years, the possibility of using it as an additive to salt was officially announced. In Switzerland, 85% of the salt used is fluoridated, and in Germany, 67%. The fluoridation of salt is the most cost-effective approach to prevent cavities in teeth [42].
In Latvia, fluoridated salt, sodium fluoride (NaF) or potassium fluoride (KF) is permitted. The fluoride ion content should be in the range of 90–295 mg/kg [37]. Also in France, fluoridated salt is authorized (at a concentration of 250 mg KF/kg) [43].
Salt used in the food industry can be encapsulated (Figure 2). Encapsulation is a technique by which a given substance or mixture of substances (core) is coated or entrapped within another material (shell/capsule). The choice of encapsulation material is crucial and depends on factors like the release mechanism, compatibility with the core material, and cost. Various techniques can be employed to encapsulate salt, depending on the desired properties of the final product and the application. Some common methods include coating with fats or waxes. Molten fats or waxes are used to coat salt crystals, creating a barrier that melts upon heating, e.g., carnauba wax and hydrogenated vegetable oils [44].
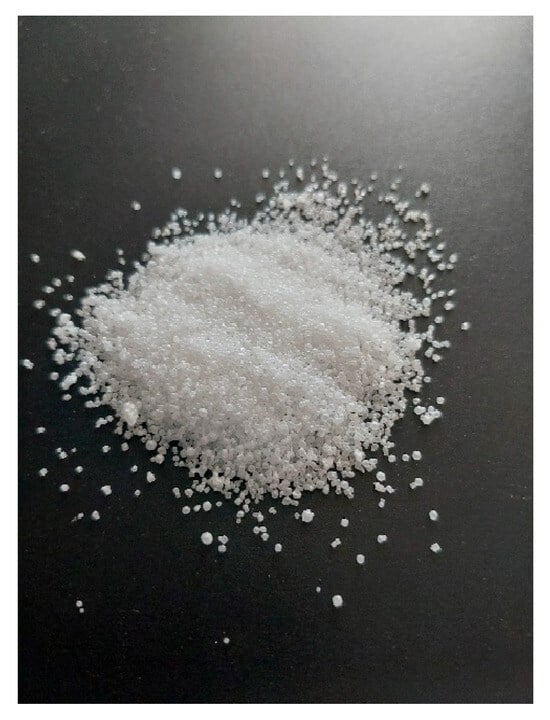
Figure 2.
Encapsulated salt (S. Chudy).
Salt can initiate the emergence of problems related to the loss of meat juiciness. Adding salt at the initial stage of heat treatment can lead to the dehydration of the meat, which will make it dry and hard. This effect of salt is caused by its loosening effect on the tissue structure of the meat. The solution to this problem may be the use of encapsulated salt. The core of such a capsule does not come into direct contact with the meat, and the shell, made of a properly selected material, liquefies at a specific temperature. Encapsulating salt offers several key advantages, such as controlled release, the prevention of premature reactions, improved texture and appearance, and flavor enhancement, or masking. The coating on encapsulated salt can be engineered to release the salt precisely when needed. This could be triggered by specific conditions like heat, moisture, or pressure, or designed to release over a set period. Encapsulation keeps salt from interacting with other ingredients too soon. For instance, in food, it stops salt from drawing out moisture prematurely, leading to a juicier end product and preventing undesirable reactions with other components. By controlling when and where salt dissolves, encapsulation can enhance the texture of food and prevent surface discoloration. A great example is how encapsulated cooking salt prevents meat from drying out. Regular salt pulls moisture from meat, making it tough and less succulent as it penetrates the tissue [45]. The encapsulating material can enable the gradual release of salt flavor, offering a better taste experience. Sometimes, the encapsulation material itself can even add to the overall flavor profile [46].
In recent years, scientists have been adding vitamins and minerals to salt in their research experiments, such as folic acid, iron, zinc, cobalamin (vitamin B12), and other microelements. Many studies have aimed to develop salt fortification methods, test the stability of added compounds, and assess the sensory acceptability of salt. Such studies are carried out on supplementing microelement deficiencies by salt intake in some regions of the world (e.g., India) in the future [47,48].
Some elements, such as lead, cadmium, or mercury, are highly undesirable in food products due to their toxicity and strong mutagenic or carcinogenic effects. The maximum permissible contents of these elements in food products were established. For salt, they are Pb—1 mg/kg, Cd—0.5 mg/kg, and Hg—0.1 mg/kg [49]. Jaworska and Niedzielski [30] determined the contents of Pb ions in salt from Peru (salt from an inland water reservoir) at 1.70 mg/kg. This value exceeded the established upper limit of the presence of this metal in salt by as much as 70%.
Salts from Europe, Asia, and America were checked for lead content by Salvo et al. [50]. In all the samples tested, the lead level exceeded the standards. The lowest content of it was found in smoked salt (5.24 ± 0.28 mg/kg), and the highest was in Persian blue salt (9.24 ± 0.42 mg/kg).
In recent years, researchers have also been checking the levels of nano- (particles ˂ 1 µm) and micro- (particles ˂ 5 mm) plastics in salts [51,52]. Regardless of the type of salt origin (including rock salt), microplastics were present in it. They get into the final product during the extraction and packaging processes. Developing methods to remove microplastics from salt or methods for “clean” production and packaging seems to be one of the most important needs. There are probably no more microplastic-free foods. They are present even in fruits and vegetables [53]. Their daily intake, as reported by Lehel and Murphy [54], has a potential carcinogenic effect, and disrupts the work of the liver and endocrine glands. Microplastics may contribute to the accelerated extinction of species, a process that is currently being observed [55]. Consequently, it is necessary to inform the public about the need to limit the use of plastic packaging, especially single-use packaging, as well as to promote the segregation and processing of waste and the development of technologies for removing contaminants from food [56].
The composition of salt, especially the sodium content and any additives (unintentional and intentional), has a direct impact on its effects on human health.
4. Salt Consumption and Body Reaction to Intake
In the past, salt consumption was very high in some regions. As Ritz cites, ancient Roman patricians consumed about 25 g of salt per day. However, not all of this salt was consumed. Some of it was lost in the water used for cooking. In 18th-century France, daily salt intake varied from 13 to 15 g depending on the region. Scandinavian countries exhibited a much higher use of salt. In Sweden during the 16th century, individuals consumed nearly 100 g of salt each day, primarily sourced from preserved fish and cured meats [57].
The share of direct salt consumption in relation to salt production is 12% and 19% in Poland and worldwide, respectively. Global salt consumption in this context is overstated by underdeveloped countries, where salt is used practically 100% for food purposes [58]. According to data included in publications from the years 2010–2021, in many countries (n = 52), men consume more salt than women. Salt intake ranges from 5.39 to 18.51 g per day for men and from 4.27 to 16.14 g per day for women. It is noted that the lowest salt intake is in Northwestern European countries, while the highest is in Eastern European and Central Asian countries. Malta, Cyprus, and Estonia are the countries with the lowest average daily salt intakes in Europe—4.92 g, 5.19 g, and 5.21 g per person, respectively. The highest salt intakes are observed in Kazakhstan and Kyrgyzstan—17.24 g/person, and the Russian Federation—14.87 g/person [59].
A low level of salt intake may help people taking antihypertensive medications discontinue or reduce their intake. However, there are doubts about the beneficial effects of reducing sodium intake on overall health [60]. In patients with mild to moderate hypertension and high dietary sodium intake, a diet with no added salt decreases systolic and diastolic blood pressure [61]. In healthy people, a low-sodium diet may cause insulin resistance [62].
Salt plays many very important roles in our bodies. Sodium is responsible for maintaining the proper volume and pressure of blood and the acid–base balance, and for transporting amino acids, sugars, and vitamins in tissues. Sodium ions are also necessary for the proper functioning of nerve and muscle cells, including the heart muscle, and for activating some enzymes. Sodium participates in the absorption of ingredients in the small intestine and kidneys.
The level of sodium (and potassium) ions inside the cell is lower compared to the level in the fluid outside the cell. Due to differences in ion levels between the cell and the surrounding fluid, these elements constantly move towards the region where their ion concentration is lower. As they move across the membrane, they perform the passive transfer of fluids and substances [63]. Hurley and Johnson also showed that sodium deficiency has a broad range of effects on the psyche. Sodium deficiency has negative effects on cognitive function and may induce fatigue and depressive-like symptoms [64].
Almost all sodium ion excretion (about 90%) is managed by the kidneys. The rest exits the body through feces and the secretions of sweat glands. The thyroid gland regulates sodium metabolism. If this gland is underactive, it results in the accumulation of metal ions within cells, while the heightened activity of the gland boosts sodium excretion [63].
In the human body, sodium and chlorine occur in ionic form. Their normal levels are Na+ 135–145 mmol/L blood serum and Cl− 96–106 mmol/L blood serum. Sodium and chlorine work together to regulate the distribution of water and the acid–base balance [65]. The right level of chlorine in the human body is responsible for maintaining the right ratio of cations to anions in body fluids, which determines the pH of the blood and the correct course of all life processes. Chlorine, similar to sodium and potassium, helps control the balance of body fluids and electrolytes, ensuring proper hydration within the cells. It is vital for the absorption of vitamin B12 [66]. Furthermore, chlorine triggers saliva digestive enzymes, and is involved in creating hydrochloric acid in the stomach. The production of hydrochloric acid in the stomach depends on protons and chloride, but the processes and means of controlling how it is secreted in the stomach are still not well understood [67].
Until recently, the prevailing theory was that the body regulates the constant pressure of sodium ions in the blood by increasing or decreasing the total body water. A group of researchers from Germany (Heer et al.) studying healthy people did not observe an increase in the total amount of fluid in the body, or an increase in body weight with an increase in salt intake. The researchers proved that an increase in salt intake does not cause water storage in the body, but only its displacement [68].
Rabelink and Rotmans [69] proposed a model for a new explanation of Na+ balance. According to them, excess ions may be stored in the interstitium of the skin. There, sodium ions can accumulate and be released if the sodium supply is too low.
The pathophysiology of particular diseases may result from unknown causes related to the inability to store excess sodium. In 2009, Heer et al. [70] asked questions that still have no answer, concerning how much sodium the body can store, and whether there are genetic obstacles that may lead to the inability to store osmotically inactive sodium.
It should be noted that salt consumption depends largely on its presence in products and ready-made meals.
5. Salt in Food
Salt is one of the most commonly used ingredients in the food sector due to its properties and low cost. It is a flavor enhancer because of its effect on various biochemical mechanisms. It reduces or increases the enzymatic activity of some enzymes responsible for the development of various organoleptic parameters [71]. Table 3 lists selected products and their average salt contents.
Table 3.
Average salt contents in dairy, cereal, seafood, and meat products (%).
Salt improves the foaming properties of protein preparations, and stabilizes foams and gels (Table 4). This is exploited in confectionery (production of foams, ice cream). Inyang and Iduh [76] studied the effects of salt concentration (from 0.0% to 5.5%) on the volume and stability of sesame protein concentrate foam. The highest foam volume and stability were obtained after adding a salt solution at concentrations of 5.5% and 2.8%, respectively.
An increase in the volume of egg white protein foam and a reduction in whipping time with the increase in the amount of added salt were observed by Raikos et al. [77]. Salt causes a decrease in the surface tension of egg whites [78]. The physical properties of protein or protein–fat foams (Table 4) are very widely described (depending on temperature, pH, whipping time, and salt and sugar concentration), but the descriptions of the actions of salt in these systems are still based on hypotheses [79].
Table 4.
The effect of NaCl on the properties of protein products [80].
Table 4.
The effect of NaCl on the properties of protein products [80].
| Product | Properties | Acting | Concentration of NaCl |
|---|---|---|---|
| Blood cell protein powder | solubility | decries | 0–0.4 M; (pH = 3) |
| The sunflower protein | solubility c | increase | 0.1 M; (pH = 4–7) |
| Rice protein | solubility | increase | 0.1 M; (pH = 2/4.5/9 |
| decrease | 1.0 M; (pH = 2/4.5/9) | ||
| WPI gels | water retention | increase | 0.1 M; (pH = 7.5–9.5) |
| Pea and lentil globulins | solubility | increase | 0.1–0.5% |
| Blood globin powder | water holding capacity | decrease | ˃0.2 M |
| Canned frankfurters | water and fat binding | increase | 5% in product |
| Rice protein concentrate | foaming capacity | increase | 0.1 M |
| decrease | 1.0 M | ||
| Myosin gel (from broiler muscle) | strength | increase | 0.2–0.6 M |
| Non-heated myofibrils | extractability of proteins | increase | 0.1–0.6 M |
| Whey gel | hardness | increase (maximum at) | 200 mM NaCI and 10 mM CaCl2 |
In water solutions, protein molecules become surrounded by water (hydration occurs). This phenomenon is possible due to the presence of polar groups in protein amino acid chains, such as carboxyl and amino groups (which interact with water via hydrogen bonds), and the polar properties of water. A sol is formed. Adding a high amount of salt to the protein solution causes the water envelope around the protein to disappear (salting out). Water molecules begin to surround the Na and Cl ions. The solution becomes denser. The protein’s solubility decreases, and a gel forms. This is a reversible coagulation process. At low salt concentrations, protein molecules become surrounded by salt ions, and these then become surrounded by water ions (salting in). An increase in protein solubility is observed. The selection of proteins and their processing conditions (temperature, salt concentration) are of key importance in modeling food matrices, as shown by Mańko-Jurkowska and Domian [81].
The influence of salt in food processing has been selectively described and explained. Furthermore, no studies have been conducted on the behavior of salt in foams depending on the system (dispersed medium (different types of gas)/dispersing medium (different types of liquid)).
5.1. Salt in Dairy
In dairy technology, and especially in cheese production, sodium chloride plays an important role. There are three techniques for salting cheese, namely, adding salt to the cheese grains, rubbing the formed cheese, and soaking the cheese in brine. The amount of salt added depends on the type of cheese and its size. The salt level has a major impact on the taste of cheese, its composition, and the biochemical changes during cheese maturation. The salt level affects the rheology of cheese, as well as its textural properties and production efficiency. Salt controls microbiological and enzymatic activity, and indirectly affects the aroma of cheese. The aroma components are additionally related to lactose metabolism, changes in milk fat, and casein (formation of peptides, free amino acids, and free fatty acids).
NaCl affects calcium levels, paracasein hydration or aggregation, the water-holding capacity of the casein matrix, and serum separation. The preservative effect of the salt is related to its water activity-lowering mechanism. Some water in cheese is contained within its structure and is not accessible to microorganisms [82,83].
The main function of salt is to control the moisture in cheese. Higher salt concentrations on the cheese surface cause whey to be removed and a rind to form (which is desirable). Salt determines water availability, thus influencing the growth and activity of microorganisms during cheese ripening, pH changes, enzyme activity, and the hydration of casein. A low NaCl content (5–6%, w/w) produces a softer product, which customers often associate with an unripe, inexpensive product. Increased water availability leads to more intense microbial growth, and the hydrated protein matrix is more susceptible to enzymatic hydrolysis. Therefore, it is difficult to produce low-salt cheese comparable in texture, taste, and aroma to traditional/classic cheese [84].
Salt is also added to butter. Laikoja et al. [85] evaluated the quality of salted (2%) and unsalted sweet cream butter produced in a continuous butter machine and stored at different storage temperatures for different time periods (−20 °C/24 weeks, +5 °C/12 weeks, +20 °C/8 weeks). There were significant differences between salted and unsalted butter samples in fat quality during the whole storage period, but only at −20 °C. Salted butter had a higher peroxidative value.
El Sadek et al. [86] analyzed salted and unsalted butters stored at +5 °C. The butters were made from creams with an acidity of 0.15% and 0.25%. Unsalted butters showed a better storage quality than salted butters. Unsalted butters made from sweet cream and from acid cream were stored without undesirable tastes, respectively, 120 and 150 days. Salted butters retained their initial quality up to 105 and 120 days for those made from sweet and acid cream, respectively. Regarding the acceleration of fat oxidation, some authors (after Loftus-Hijls and Conochie, 1940) have blamed this on chlorine, which forms in a reaction of hydroperoxides and hydrogen and chloride ions—R-O-O-H + 2Cl− + 2H+ → Cl2 + H2O + R-O-H—and which induces the further oxidation of the fat.
Fitzgerald and Buckley [87] tested cheeses with salt substitutes. They found that adding MgCl2, KCl, or CaCl2 to cheese at an equivalent level to NaCl produced extremely unacceptable cheeses, often characterized by a bitter taste, metallic flavor, and crumbly body. Ganesan et al. [88] also observed that consumer preference scores decreased with reductions in salt for cheddar and low-moisture, part-skimmed mozzarella.
5.2. Salt in Meat
Meat salting is a method of preserving food that has been known since prehistoric times. After the introduction and popularization of cooling and freezing, it lost its importance as a preserving procedure [89]. Currently, salting, together with the addition of nitrates (III) and (V) and other ingredients (a process called curing), is used mainly to develop the desired and lasting red color and characteristic tastiness of meat, and not to increase its durability. However, to this day, salted cattle meat is an important component of the diet of some South American countries. Currently, the term “curing” refers to the effect of a curing mixture—nitrates (III or V) and NaCl—on meat. Nitrate (III) curing mixture, commonly known as curing salt, is made up of a combination of sodium chloride and sodium nitrate (III), which is the same as NaNO2 or E250. Nitrate (V) curing mixture is a mixture of sodium chloride and potassium nitrate (V)/KNO3/E 252/saltpeter. Typically, the curing mixture’s composition includes 99.4% sodium chloride and 0.6% sodium nitrate [90]. According to the applicable EU regulations, nitrate (V) can only be used in the production of cold cuts that have not undergone heat treatment [91].
The basic phenomenon occurring during curing is the process of diffusion caused by the difference in osmotic pressure between the brine and the content of the muscle tissue cells. Diffusion is possible due to the semi-permeable nature of the protein–lipid cell membranes, which allow the penetration of small ions and retain colloidal substances. In the curing process, the main role is played by Na+ and Cl− ions. Other inorganic substances occur in small amounts compared to sodium chloride [92]. Therefore, the phenomena occurring during curing can be presented in a very simplified way as reactions occurring between a salt solution, e.g., NaR, located in the muscle tissues, and brine, separated from each other by a membrane that is permeable to ions of Na+ and Cl− and retains R ions, symbolizing protein anions. The rate of diffusion is not constant. It depends on the kind of meat, the ratio of connective tissue to muscle, the amount of fat, the state of post-mortem changes, and the sizes of meat elements [93]. External factors, such as temperature, concentration, and degree of salt contamination, also have a significant impact. The effect of temperature is only visible on the rate of salt penetration, but it has no significant effect on the degree of salt saturation of the product. Salting with pure sodium chloride takes less time than using table salt containing impurities of other salts, such as CaCl2, CaSO4, MgCl2, and MgSO4. Salt penetration is mostly inhibited by CaCl2 through its effects on meat proteins [94]. In the process of salt’s penetration into the product, three phases can be distinguished, as follows:
- In the first period, osmosis, i.e., water penetration through membranes into a solution with a higher concentration, has an advantage over salt diffusion into the meat. As a result, there is a loss of mass of the raw material and a decrease in the difference in concentrations in the laminar layer on the surface of contact between the raw material and the brine. During this period, salt penetrates mainly into the outer layers of the meat. After the concentrations in the outer layers and the surrounding solution have equalized, further salt penetration takes place slowly as diffusion occurs. During this period, at low salt concentrations (up to 7%), proteins dissolve and pass into the brine;
- In the second phase, the same processes occur, but the increased salt concentration causes the denaturation and coagulation of proteins [94];
- In the third phase, the process is established. Part of the salt is bound to proteins, and the protein complexes formed cause the osmotic pressure in the tissues to become slightly higher than that of the brine. This results in the re-penetration of some water into the meat and an increase in the mass of the cured raw materials [95].
Sodium chloride is a bacteriostatic agent. Its action consists of increasing the osmotic pressure of the environment, which entails a decrease in water activity below the level that allows the growth of most bacteria. The greatest durability is achieved by meat when the salt concentration in the final product is 9–11% and the water content is 50–55%. Then, the salt concentration in the water phase of the product is close to saturation. In the case of salted bacon, on the other hand, the salt content in the outer layers is 5–8%, and due to the low water content (below 10%), 1/3–1/2 of the salt remains in solid form.
The sensitivity of microorganisms to salt varies greatly. Some bacteria cannot develop at a concentration of 2% salt, while others, as well as yeasts and molds, can withstand high concentrations, even saturation. Depending on the sensitivity of microorganisms to sodium chloride contained in the medium, they are divided into non-halophilic (halophobic and halotolerant) and halophilic [96].
In meat products, the textural effect of salt is based on increasing the electrostatic charge of the protein and facilitating the transition to dissociated, more soluble forms. Features such as the ability to bind water, i.e., protein swelling, fat emulsification, the amount of forced and thermal leakage, and water absorption, are significantly related to the salt content in the product. In meat processing, sodium chloride influences the formation of technological benefits, such as increasing water absorption and improving gelling and emulsifying properties [97]. The reasons for inhibiting the growth of microorganisms by sodium chloride include, among others, increasing the osmotic pressure and plasmolysis of microbial cells, direct toxic effect on microbial cells, reducing the solubility of oxygen in liquid environments, and weakening the activity of intracellular proteolytic enzymes [98,99]. When sodium nitrate (III) is added in addition to salt during the meat curing process, the growth of Clostridium botulinum and other pathogens, such as Salmonella and Staphylococcus aureus, is inhibited [100].
Steen analyzed liver paste with liver/fat ratios of 35/35 and 20/50, and with two salt levels of 0.0% and 1.8%. The addition of salt resulted in a reduction in the fat droplet size, which was also evident in the increased stability of the emulsion and notably in the enhanced fat-binding characteristics of liver paste, creating a firmer and less easily spreadable product. It was noted that the presence of salt increases the availability of proteins that can serve as emulsifiers and aid in gel formation [101].
The water-binding capacity, i.e., protein swelling, fat emulsification, forced and thermal leakage, and water absorption, is significantly related to the salt content of the product [102]. Salting alters the physical properties of meat. The improved water binding capacity is mainly due to the presence of Cl− ions. They modify proteins into dissociated, and therefore more soluble, forms. Furthermore, ionic strength and pH can cause conformational modifications to the protein structure, exposing hydrophobic residues and affecting the hydrophobicity of protein surfaces [103]. This protein behavior is exploited to create protein-stabilized oil-in-water emulsions. The hydrophobicity of proteins prevents the agglomeration of fat globules, for example, in the production of hot dog sausages.
The production of homogenized meat products begins with the pre-grinding phase (particle size reduction). Grinding is necessary to break down the muscle membranes and sarcolemma. This process releases the myofibrillar proteins to allow them to swell. After grinding, salt is added, increasing the binding capacity. The addition of salt increases the net negative charge of proteins and shifts their isoelectric point (to a lower pH). Water then penetrates between the myofibrillar proteins.
It is also theorized that salt causes the repulsion of peptide chains in myofibrillar protein, allowing water to enter this space (increasing water absorption) [104].
One method for improving the water-holding capacity of meat is to process it immediately after slaughter. The benefits of “warm meat” (non-refrigeration) processing result from the specific effect of salt on the contraction process of muscle fibers. Salt added in an amount of 2–3% to meat obtained immediately after slaughter blocks the formation of bridges between myosin and actin, and significantly slows the conversion of glycogen to lactic acid. It contributes to the increased water absorption of the meat. This effect is maintained even when the salted meat is frozen or freeze-dried [105].
5.3. Salt in Bakery
The way salt works in another branch of the food industry, baking, is also interesting. Bread is a staple food product that provides the body with about 25% of its daily salt intake [106]. The addition of salt affects not only the taste of the bread made from wheat flour, but is also a fundamental ingredient in bread making, impacting dough rheology, gluten development, and overall bread quality. Understanding its specific effects on gluten proteins, dough fermentation, and starch viscosity is crucial for optimizing baking processes. The farinograph (Figure 3) is a tool used for measuring the properties of a wheat dough.
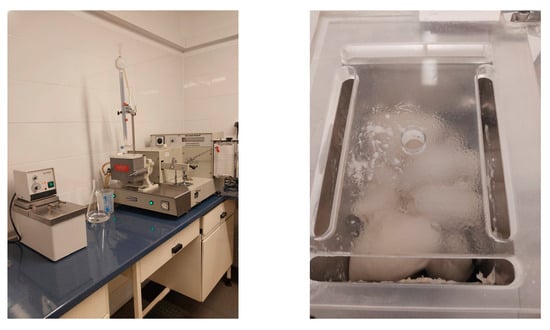
Figure 3.
Farinograph and dough mixing during analysis (S. Chudy).
How salt influences the rheological characteristics of wheat dough was demonstrated in the experiment. A mixture of wheat flour (300 g) along with varying amounts of salt (ranging from 0.0% to 2.5%) and water was combined in a farinograph mixer (Brabender OHG, Duisburg, Germany). Water was added to achieve a dough consistency of 500 Brabender Units (BU). The parameters assessed included water absorption (amount of water absorbed by 100 g of flour), dough development time (time to reach maximum dough consistency—500 BU), dough stability (time dough remains at maximum consistency), degree of softening (reduction in dough consistency), and the farinograph quality number (FQN—length of the horizontal segment between points 500 BU and 470 BU on the farinogram graph). The analysis was carried out according to the AACC International Method 54-21.02 [107].
In the conducted studies, it was found that the addition of salt at the amount of 1.5% did not significantly affect the water absorption of flour, nor the development time, stability time, or softening of the dough (Table 5).
Table 5.
Farinographic characteristics of wheat dough without and with salt addition *.
However, when the amount of salt was 2.5%, the rheological properties of the dough improved. The water absorption of the flour and degree of dough softening decreased. The dough development and stability times were extended. The Farinograph Quality Number increased. The interaction of salt ions with wheat gluten proteins reduces the water-binding capacity of gluten, changing the physical state of the protein molecules. It is believed that sodium chloride masks the repulsive effect of molecular charges by interacting with the polar groups of proteins [108].
The effects of different salt concentrations on dough rheology, gluten secondary structure, zeta potential, and gliadin to glutenin ratios were investigated by Chen et al. [109]. The key finding was that salt increased macromolecular gluten aggregation, reduced free sulfhydryl (SH) content and strengthened the beta-sheet structure of gluten, which resulted in improved dough rheological properties. The presence of salt in dough affects the hydration of gluten proteins [110]. Sodium ions (Na+) can neutralize charges on proteins, reducing repulsive forces [111]. In this way, they promote molecular interactions and gluten aggregation [109]. Anions (Cl−) are generally more effective at associating with proteins and screening electrostatic repulsion at specific binding sites than cations. Anions can bind directly to the polar nitrogen atoms of positively charged amino acid residues and through anion–amide interactions with gluten proteins, influencing their structure [112]. NaCl strengthens inter-protein hydrogen bonds and hydrophobic interactions. Kuang and Xu [113] stated that the loss of repulsive forces allowed proteins to form intermolecular hydrogen bonds, resulting in aggregation. Studies suggest that high salt levels induce stronger gluten interactions via SH cross-linking [109]. The interaction of Na+ and Cl− ions with gluten proteins is a complex process that significantly impacts the functional and rheological properties of dough. This primarily occurs through the shielding of electrostatic charges, the influence on hydration, and the strengthening of key non-covalent bonds, such as hydrogen bonds. As a result, the gluten network becomes stronger and more ordered (fibrous structure), and exhibits increased molecular rigidity, which manifests as improved rheological parameters, although gluten network formation is simultaneously delayed. These mechanisms are crucial to the quality of the final baked product [109].
Salt in bread dough enhances product flavor, strengthens the gluten network, increases the dough mixing time to increase protein–protein interactions, and acts as a preservative by decreasing water activity and prolonging shelf life. Lower salt concentrations in the dough lead to more interactions between protein and water, creating a less robust gluten network. In the absence of sufficient salt, the gluten network will not develop properly, increasing yeast activity, which ultimately results in bread that is lacking in quality regarding its texture, size, taste, and appearance [114]. Salt-free dough is not very elastic, ferments unevenly throughout the mass, sticks when processed, and is unstable. Bread without salt has a smaller volume and is harder to keep fresh. The crust is crumbly and pale, the flesh is unevenly porous, and the bread tastes bland [115].
Salt affects yeast fermentation in the dough. It typically decreases the total CO2 production while increasing the retention coefficient. Salt inhibits yeast activity, which is important for controlling gas production during bread-making [116].
The addition of salt can modulate the pasting properties of the wheat flour. It was observed that salt influences the amylolytic activity in flour. It was also stated that the addition of salt increases peak viscosity and falling number values [94].
The pasting properties of wheat flour slurries with the addition of salt (0.0–2.5% related to flour) were analyzed in the RVA Tec Master (Perten Instruments, Hägersten, Stockholm, Sweden), in accordance with the standard AACC International Method 76-21.01 [117]. Flour (3.5 g) and unsalted or salted water (25 mL) were mixed in the RVA container. The salt contents in the analyzed samples were 0.0%, 1.5%, and 2.5% in relation to the flour as a whole. Gelatinization temperature, peak viscosity, trough, breakdown, final viscosity, and setback were determined (Figure 4).
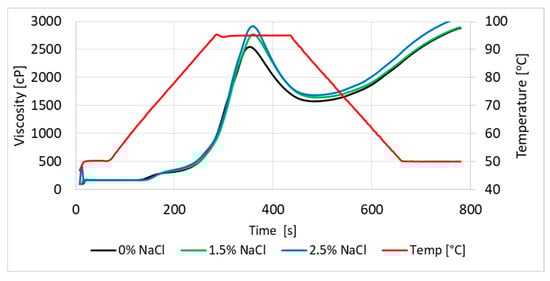
Figure 4.
Viscosity of dough without and with salt addition.
Our studies confirm the influence of salt addition on changes in parameters during starch gelatinization in wheat flour (Table 6). The pasting temperature of starch in wheat flour with the addition of salt was higher than in samples without salt. It was also found that the higher the salt addition, the higher the viscosity, both maximum and final, of the flour suspension noted.
Table 6.
Pasting properties of wheat dough with the addition of salt (0.0–2.5% related to flour) *.
There are various types of salt intended for direct consumption or for food purposes, but only some of them are marked with European geographical indications.
6. Salts with Geographical Indications
With increasing consumer awareness, information about a product’s place of origin has transformed from a minor detail (included in small print on packaging) into one of the main marketing slogans. Connecting a product with a region is meant to encourage consumers to purchase it. Consumers’ motives when purchasing a product from a given location vary. These may include positive associations with the high quality of products originating from a given country or a sense of “consumer patriotism” (the positive impact of the choice on the national community with which the consumer identifies) [118].
According to surveys conducted by Chudy et al. [119], 85% of consumers consciously choose products from a specific region.
Since 1992, the EU has had a system for registering and protecting regional product names. The basic symbols used to identify agricultural products and foodstuffs are those shown in Figure 5. They are protected designation of origin (PDO) and protected geographical indication (PGI). The PDO label is assigned for products where all stages of production take place in the defined geographical area, and PGI is assigned when at least one stage of production takes place in the defined geographical area. European geographical indications serve as a system for the protection and promotion of products that have a specific origin and possess characteristics associated with that origin. The primary goal of EU geographical indications is to promote products from specific regions. They also aid in maintaining cultural heritage, local customs, and distinct methods of production [119].
Figure 5.
Labels of protected designation of origin (PDO) and protected geographical indication (PGI) [120].
Producers who use these marks to mark their products emphasize the product’s connection with a given country, region, or town, which is often the main factor for the buyer when choosing a product. The distinctiveness of products frequently stems from the specific natural circumstances of a particular area or the historical methods of their creation, and this is true for salt as well.
Table 7 presents 11 salts with the PDO mark (including 1 at the application stage; the 1st one in the table) and 7 salts with the PGI mark (including 2 at the application stage; the 13th and 17th in the table) [121].
Table 7.
Salts with geographical indications (Product type: Food; Class 2.6 Salt).
In Europe, only eight countries (Croatia, France, Greece, Ireland, Italy, Portugal, Turkey, and the United Kingdom) can demonstrate such geographical indications. Germany and Poland, despite being leading salt producers with rich salt traditions, unfortunately, do not have certified salt.
7. Conclusions
The review of the scientific literature indicates the following:
- There is a need to define the parameters of micronized salt, along with performing further toxicological studies on contaminants and additives in salt;
- There is a need to analyze the long-term health effects, and to develop techniques for removing microplastics in salt and eliminating plastic packaging;
- In medicine, there are still no clear answers as to how much sodium a healthy body can accumulate;
- The wider use of fluoride in salt should be considered as an interesting solution for anti-caries prophylaxis;
- Further research on compounds added to salt to supplement iodine is necessary;
- In order to show national and cultural heritage and promote regions with a long tradition of salt production, it is advisable for salt producers to apply for the protection of their products with the PGI or PGI mark.
Furthermore, the presented experiment demonstrated that salt affects both the gluten–proteolytic and starch–amylolytic systems in wheat dough. Its addition increases dough stability and extends its development time. Salt also influences the starch gelatinization process, increasing the gelatinization temperature and paste viscosity.
Author Contributions
Conceptualization, S.C.; methodology, S.C. and A.M.; formal analysis, S.C., A.M. and R.K.; investigation, S.C., A.M. and R.K.; data curation, S.C., A.M. and R.K.; writing—original draft preparation, S.C., A.M. and R.K.; writing—review and editing, S.C. and A.M.; visualization, S.C. and A.M.; supervision, S.C. and A.M. All authors have read and agreed to the published version of the manuscript.
Funding
This research received no external funding.
Institutional Review Board Statement
Not applicable.
Informed Consent Statement
Not applicable.
Data Availability Statement
No new data were created or analyzed in this study. Data sharing is not applicable to this article.
Conflicts of Interest
The authors declare no conflicts of interest.
References
- Kołodziejski, J. Charakterystyka rynku soli w Polsce na przykładzie Kopalni Soli „Kłodawa” SA. Min.–Inform. Autom. Electr. Eng. 2022, 549, 1–16. [Google Scholar] [CrossRef]
- Hodbod, M.; Czapowski, G. Rock Salt, 2nd ed.; Polish Geological Institute—National Research Institute: Warsaw, Poland, 2020; p. 5.
- Li, Z.; Liang, Y.; Zhou, J.; Sun, X. Impacts of de-icing salt pollution on urban road greenspace: A case study of Beijing. Front. Environ. Sci. Eng. 2014, 8, 747–756. [Google Scholar] [CrossRef]
- Hintz, W.D.; Fay, L.; Relyea, R.A. Road salts, human safety, and the rising salinity of our fresh waters. Front. Ecol. Environ. 2022, 20, 22–30. [Google Scholar] [CrossRef]
- WHO Guideline: Sodium Intake for Adults and Children. Available online: https://iris.who.int/bitstream/handle/10665/77985/9789241504836_eng.pdf?sequence=1 (accessed on 2 August 2025).
- Santos, J.A.; Tekle, D.; Rosewarne, E.; Flexner, N.; Cobb, L.; Al-Jawaldeh, A.; Kim, W.J.; Breda, J.; Whiting, S.; Campbell, N.; et al. A systematic review of salt reduction initiatives around the world: A midterm evaluation of progress towards the 2025 global non-communicable diseases salt reduction target. Adv. Nutr. 2021, 12, 1768–1780. [Google Scholar] [CrossRef]
- Jaenke, R.; Barzi, F.; McMahon, E.; Webster, J.; Brimblecombe, J. Consumer acceptance of refor-mulated food products: A systematic review and meta-analysis of salt-reduced foods. Crit. Rev. Food Sci. Nutr. 2017, 57, 3357–3372. [Google Scholar] [CrossRef]
- Bobowski, N.; Rendahl, A.; Vickers, Z. A longitudinal comparison of two salt reduction strategies: Acceptability of a low sodium food depends on the consumer. Food Qual. Pref. 2015, 40, 270–278. [Google Scholar] [CrossRef]
- Denver, S.; Christensen, T.; Nordström, J. Consumer preferences for low-salt foods: A Danish case study based on a comprehensive supermarket intervention. Public Health Nutr. 2021, 24, 3956–3965. [Google Scholar] [CrossRef]
- Kamińska, M.; Krusiec-Świdergoł, B. Wykorzystanie terapeutycznych właściwości soli w profilaktyce i leczeniu chorób układu oddechowego. Państwo I Społeczeństwo 2023, 23, 135–149. [Google Scholar] [CrossRef]
- Jeran, A. Uzdrowiskowe czynniki lecznicze w kontekście Uzdrowiska w Ciechocinku Spa healing factors in the context of the health resort Ciechocinek. Jedziemy Do Wód W Biul. Inf. Stowarzyszenia Gm. Uzdrow. RP 2015, 2, 33–42. Available online: https://sgurp.pl/assets/public/pdf/biuletyny_jedziemy_do_wod/Biuletyn_SGURP_2-2015_REF-1.pdf (accessed on 11 January 2025).
- Faracik, R. Dziedzictwo salinarne a współczesna haloterapia w Europie Środkowej. In Tradycje i Perspektywy Rozwoju Kultury Uzdrowiskowej w Muszynie w Kontekście Europejskim; Płonka-Syroka, B., Brzegowy, P., Syroka, A., Dorocki, S., Eds.; Oficyna Wydawnicza Arboretum: Wrocław, Poland, 2020; pp. 383–398. [Google Scholar]
- Bhat, S.; Marklund, M.; Henr, M.E.; Appel, L.J.; Croft, K.D.; Neal, B.; Wu, J.H. A systematic review of the sources of dietary salt around the world. Adv. Nutr. 2020, 11, 677–686. [Google Scholar] [CrossRef] [PubMed]
- Marro, C.; Bakhshaliyev, V.; Sanz, S.; Aliyev, N. Archaeological investigations on the salt mine of Duzdagi (Nakhchivan, Azerbaïdjan). TÜBA-AR-Turk. Acad. Sci. J. Archaeol. 2010, 13, 233–246. [Google Scholar]
- Warzelnia. Available online: https://www.kopalnia.pl/turysta-indywidualny/o-kopalni/warzelnia-czyli-miejsce-pozyskiwania-soli (accessed on 17 March 2025).
- Salt Statistics and Information. Available online: https://www.usgs.gov/centers/national-minerals-information-center/salt-statistics-and-information (accessed on 17 March 2025).
- Singh, E.J. Salt in India—And A Monstrous Hedge. Salt in India—And A Monstrous Hedge. RGNUL Soc. Sci. Review. A Half Yrly. Peer Rev. J. Rajiv Gandhi Natl. Univ. Law Punjab 2019, 2, 47–58. Available online: https://www.rgnul.ac.in/PDF/57595759-33f9-47be-8705-20516ec668f0.pdf (accessed on 28 February 2025).
- Poborska-Młynarska, K. Współczesne techniki eksploatacji soli kamiennej w kopalniach podziemnych. Przegląd Górniczy 2015, 71, 140–146. Available online: https://yadda.icm.edu.pl/baztech/element/bwmeta1.element.baztech-e2c2d84b-b205-4da3-8f87-b1217ebf0652 (accessed on 27 February 2025).
- Urbański, P.; Gawlik, A. Rock salt production in O/ZG “Polkowice-Sieroszowice”—A case study. Min.–Inform. Autom. Electric. Eng. 2022, 549, 49–82. [Google Scholar] [CrossRef]
- Kreutz, F.O. przyczynie błękitnego zabarwienia soli kuchennej. Rozpr. Akad. Umiejętności. Wydział Mat.-Przyrodniczy. Ser. II 1893, 4, 193–205. [Google Scholar]
- Nassau, K. The Physics and Chemistry of Color: The fifteen Causes of Color, 2nd ed.; Wiley: New York, NY, USA, 2001; p. 496. [Google Scholar]
- Chen, W.; Tegenkamp, C.; Pfnür, H.; Bredow, T. Color centers in NaCl by hybrid functionals. Phys. Rev. B—Condens. Matter Mater. Phys. 2010, 82, 104106. [Google Scholar] [CrossRef]
- Zielasek, V.; Hildebrandt, T.; Henzler, M. Surface color centers on epitaxial NaCl films. Phys. Rev. B 2000, 62, 2912. [Google Scholar] [CrossRef]
- Desarnaud, J.; Derluyn, H.; Carmeliet, J.; Bonn, D.; Shahidzadeh, N. Hopper growth of salt crystals. J. Phys. Chem. Lett. 2018, 9, 2961–2966. [Google Scholar] [CrossRef]
- Legutko, M.; Tomanek, G.; Gierak, Ł.; Kropiwnicki, J. The micronization as a key to modern pharmacy. CHEMIK 2014, 68, 224–226. Available online: https://miesiecznikchemik.pl/2014/mikronizacja-kluczem-do-wspolczesnej-farmacji/ (accessed on 28 February 2025).
- de Araújo, C.D.L.; Krauskopf, M.M.; Manzi, J.A.S.; Barbosa, J.A.L.; Cavalcante, C.L.; Feltre, G.; Rios-Mera, J.D.; Saldaña, E.; Castillo, C.J.C. Impact of micronized salt in reducing the sodium con-tent in fresh sausages. Foods 2024, 13, 459. [Google Scholar] [CrossRef] [PubMed]
- da Rosa, J.L.; Rios-Mera, J.D.; Castillo, C.J.C.; Lorenzo, J.M.; Pinton, M.B.; Dos Santos, B.A.; Campagnol, P.C.B. High-power ultrasound, micronized salt, and low KCl level: An effective strategy to reduce the NaCl content of Bologna-type sausages by 50%. Meat Sci. 2023, 195, 109012. [Google Scholar] [CrossRef]
- Fan, X.; Xu, C.; Qin, Y.; Zhou, D.; Li, D. Lipid-protein synergistic micronized salt composite: High-pressure homogenization for enhanced sodium dispersion and thermal stability. Food Chem. 2025, 487, 144825. [Google Scholar] [CrossRef] [PubMed]
- Jaworska, J.; Siepak, M. Polskie sole kamienne vs sole himalajskie–analiza porównawcza wybranych składników soli spożywczych. Przegląd Solny 2018, 14, 95–104. Available online: http://psgs.agh.edu.pl/wp-content/uploads/2023/04/PS6-Jaworska2-1.pdf (accessed on 8 March 2025).
- Jaworska, J.; Niedzielski, P. Skład chemiczny soli spożywczych–sole kłodawskie na tle tak zwanych soli morskich. Chem. Compos. Commer. Table Salts–Rock Salt Kłodawa Comp. So-Call. Sea Salts. Przegląd Solny 2023, 17, 58–68. Available online: http://psgs.agh.edu.pl/wp-content/uploads/2024/01/PS2023-Jaworska1.pdf (accessed on 8 March 2025).
- Basu, A.; Biswas, D.; Mukherje, A. Genotoxicity testing of two anticaking agents: Sodium and potassium ferrocyanide in vitro. Int. J. Hum. Genet. 2013, 13, 21–25. [Google Scholar] [CrossRef]
- Codex Alimentarius International Food Standards. General Standard for Food Additives. Available online: https://www.fao.org/gsfaonline/docs/CXS_192e.pdf (accessed on 3 August 2025).
- Zimmermann, M.B.; Andresson, M. Global endocrinology: Global perspectives in endocrinology: Coverage of iodized salt programs and iodine status in 2020. Europ. J. Endocrinol. 2021, 185, 13–21. [Google Scholar] [CrossRef]
- Greenwald, R.P.; Childs, L.; Pachón, H.; Timmer, A.; Houston, R.; Codling, K. Comparison of salt iodization requirements in national standards with global guidelines. Cur. Dev. Nutr. 2022, 6, nzac116. [Google Scholar] [CrossRef] [PubMed]
- Guideline: Fortification of Food-Grade Salt with Iodine for the Prevention and Control of Iodine Deficiency Disorders. Available online: https://iris.who.int/handle/10665/136908 (accessed on 20 July 2025).
- Rozporządzenie Ministra Zdrowia z dnia 13 marca 2024 r. w Sprawie Substancji Wzbogacających Dodawanych do Żywności. Available online: https://isap.sejm.gov.pl/isap.nsf/DocDetails.xsp?id=WDU20240000420 (accessed on 30 April 2025).
- Cabinet Regulation No. 696 of 2015 on Edible Salt. Available online: https://faolex.fao.org/docs/pdf/lat206621.pdf (accessed on 20 July 2025).
- Todd, C.H.; Dunn, J.T. Intermittent oral administration of potassium iodide solution for the correction of iodine deficiency. Am. J. Clin. Nutr. 1998, 67, 1279–1283. [Google Scholar] [CrossRef]
- Milczarek, M.; Stępniak, J.; Lewiński, A.; Karbownik-Lewińska, M. Potassium iodide, but not potassium iodate, as a potential protective agent against oxidative damage to membrane lipids in porcine thyroid. Thyroid. Res. 2013, 6, 1–8. [Google Scholar] [CrossRef]
- Singalavanija, A.; Ruangvaravate, N.; Dulayajinda, D. Potassium iodate toxic retinopathy: A report of five cases. Retina 2000, 20, 378–383. [Google Scholar] [CrossRef]
- Li, X.; Cao, X.; Li, J.; Xu, J.; Ma, W.; Wang, H.; Wang, J.; Zhang, Y. Effects of high potassium iodate intake on iodine metabolism and antioxidant capacity in rats. J. Trace Elem. Med. Biol. 2020, 62, 126575. [Google Scholar] [CrossRef]
- Marthaler, T.M. Salt fluoridation and oral health. Acta Med. Acad. 2013, 42, 140–155. [Google Scholar] [CrossRef]
- Hescot, P.; Roland, E.; Desfontaine, J. Fluoridated salt in France. J. Trace Elem. Med. Biol. 1995, 9, 144–145. [Google Scholar] [CrossRef] [PubMed]
- Nedović, V.; Kalušević, A.; Manojlović, V.; Lević, S.; Bugarski, B. An overview of encapsulation technologies for food applications. In 11th International Congress on Engineering and Food (ICEF11); Elsevier Science Bv: Amsterdam, The Netherlands, 2011; Volume 1, pp. 1806–1815. [Google Scholar] [CrossRef]
- Stajić, S.; Vasilev, D. Encapsulation of Meat Product Ingredients and Influence on Product Quality. In Encapsulation in Food Processing and Fermentation, 1st ed.; Lević, S., Nedović, V., Bugarski, B., Eds.; CRC Press: Boca Raton, FL, USA, 2022; pp. 255–280. [Google Scholar]
- Winkel, C. Stability of Aroma Chemicals. In Chemistry and Technology of Flavors and Fragrances; Rowe, D.J., Ed.; CRC Press: Boca Raton, FL, USA, 2004; pp. 249–250. [Google Scholar] [CrossRef]
- Puri, S.; Rekhi, T.K.; Thomas, T.; Jadhav, M.H.; Mannar, V.; Diosady, L.L. Sensory Trial of Quintuple Fortified Salt—Salt Fortified With Iodine, Iron, Folic Acid, Vit-amin B12, and Zinc—Among Consumers in New Delhi, India. Food Nutr. Bull. 2022, 43, 340–350. [Google Scholar] [CrossRef]
- Modupe, O.; Siddiqui, J.; Jonnalagadda, A.; Diosady, L.L. Folic acid fortification of double fortified salt. Sci. Rep. 2021, 11, 14561. [Google Scholar] [CrossRef] [PubMed]
- Codex Alimentarius International Food Standars, General Standard for Contaminants and Toxins in Food and Feed CXS 193-1995. Available online: https://www.fao.org/fao-who-codexalimentarius/sh-proxy/en/?lnk=1&url=https%253A%252F%252Fworkspace.fao.org%252Fsites%252Fcodex%252FStandards%252FCXS%2B193-1995%252FCXS_193e.pdf (accessed on 3 February 2025).
- Salvo, E.; Tardugno, R.; Nava, V.; Naccari, C.; Virga, A.; Salvo, A.; Corbo, F.; Clodoveo, M.L.; Cicero, N. Gourmet table salts: The mineral composition showdown. Toxics 2023, 11, 705. [Google Scholar] [CrossRef]
- Suteja, Y.; Dirgayusa, I.G.N.P.; Purnama, S.G.; Purwiyanto, A.I.S. From sea to table: Assessing microplastic contamination in local and non-local salt in Bali, In-donesia. Chemosphere 2025, 374, 144192. [Google Scholar] [CrossRef] [PubMed]
- Ruan, X.; Ao, J.; Ma, M.; Jones, R.R.; Liu, J.; Li, K.; Zhang, L. Nanoplastics detected in commercial sea salt. Environ. Sci. Technol. 2024, 58, 9091–9101. [Google Scholar] [CrossRef]
- Lazăr, N.N.; Călmuc, M.; Milea, Ș.A.; Georgescu, P.L.; Iticescu, C. Micro and nano plastics in fruits and vegetables: A review. Heliyon 2024, 10, e28291. [Google Scholar] [CrossRef]
- Lehel, J.; Murphy, S. Microplastics in the food chain: Food safety and environmental aspects. Rev. Environ. Contam. Toxicol. 2021, 259, 1–49. [Google Scholar] [CrossRef]
- Barnosky, A.D.; Matzke, N.; Tomiya, S.; Wogan, G.O.U.; Swartz, B.; Quental, T.B.; Marshall, C.; McGuire, J.L.; Lindsey, E.L.; Maguire, K.C.; et al. Has the Earth’s sixth mass extinction already arrived? Nature 2011, 471, 51–57. [Google Scholar] [CrossRef]
- Kyriakopoulos, G.L.; Zorpas, A.A.; Inglezakis, V.J.; Rodríguez-Barroso, R. The silent invaders: Microplastic accumulation, impacts, and monitoring approaches. Toxics 2005, 13, 192. [Google Scholar] [CrossRef] [PubMed]
- Ritz, E. The history of salt-aspects of interest to the nephrologist. Nephrol. Dial. Transplant. 1996, 11, 969975. [Google Scholar] [CrossRef]
- Kamyk, J. Rynek soli w Polsce–stan obecny i tendencje zmian. Gospod. Surowcami Miner. 2008, 24, 143–153. Available online: https://min-pan.krakow.pl/wp-content/uploads/sites/4/2017/12/10-kamyk.pdf (accessed on 8 March 2025).
- Kwong, E.J.L.; Whiting, S.; Bunge, A.C.; Leven, Y.; Breda, J.; Rakovac, I.; Cappuccio, F.P.; Wickramasinghe, K. Population-level salt intake in the WHO European Region in 2022: A systematic review. Public Health Nutr. 2023, 26, 6–19. [Google Scholar] [CrossRef] [PubMed]
- Hooper, L.; Bartlett, C.; Smith, G.D.; Ebrahim, S. Systematic review of long term effects of advice to reduce dietary salt in adults. BMJ 2002, 325, 628. [Google Scholar] [CrossRef]
- Kojuri, J.; Rahimi, R. Effect of “no added salt diet” on blood pressure control and 24 hour urinary sodium excretion in mild to moderate hypertension. BMC Cardiovas. Disor. 2007, 7, 34. [Google Scholar] [CrossRef]
- Garg, R.; Williams, G.H.; Hurwitz, S.; Brown, N.J.; Hopkins, P.N.; Adler, G.K. Low-salt diet increases insulin resistance in healthy subjects. Metabolism 2011, 60, 965–968. [Google Scholar] [CrossRef]
- Kodintsev, V.V.; Lenda, I.V.; Ponomarev, A.V.; Naumov, N.A.; Salatov, Y.S. Sodium as one of the basic elements in human life. Eur. J. Nat. Hist. 2022, 5, 4–7. Available online: https://s.world-science.ru/pdf/2022/2022_5.pdf#page=4 (accessed on 15 March 2025).
- Hurley, S.W.; Johnson, A.K. The biopsychology of salt hunger and sodium deficiency. Pflügers Arch.-Europ. J. Physiol. 2015, 467, 445–456. [Google Scholar] [CrossRef]
- Sehgal, S.; Gupta, S.; Mishra, M.K. Electrolytes and Acid-Base Disorders. In Clinical Applications of Biomolecules in Disease Diagnosis; Singh, R.L., Singh, P., Pathak, N., Eds.; Springer: Singapore, 2024; pp. 155–175. [Google Scholar] [CrossRef]
- Solnica, B.; Kieć-Wilk, B. Diagnostyka laboratoryjna zaburzeń gospodarki wodno elektrolitowej i równowagi kwasowo-zasadowej. In Laboratory Diagnostics with Elements of Clinical Biochemistry, 5th ed.; Dembińska-Kieć, A., Naskalski, J.W., Solnica, B., Eds.; Edra Urban & Partner Publishing House: Wrocław, Poland, 2017; pp. 135–152. [Google Scholar]
- Coskun, T.; Baumgartner, H.K.; Chu, S.; Montrose, M.H. Coordinated regulation of gastric chloride secretion with both acid and alkali secretion. Am. J. Physiol. Gastrointest. Liver Physiol. 2002, 283, 1147–1155. [Google Scholar] [CrossRef] [PubMed]
- Heer, M.; Baisch, F.; Kropp, J.; Gerzer, R.; Drummer, C. High dietary sodium chloride consumption may not in-duce body fluid retention in humans. Am. J. Physiol. Renal. Physiol. 2002, 278, F585–F595. [Google Scholar] [CrossRef] [PubMed]
- Rabelink, T.J.; Rotmans, J.I. Salt is getting under our skin. Nephrol. Dial. Transplant. 2009, 24, 3282–3283. [Google Scholar] [CrossRef]
- Heer, M.; Frings-Meuthen, P.; Titze, J.; Boschmann, M.; Frisch, S.; Baecker, N.; Beck, L. Increasing sodium intake from a previous low or high intake affects water, electrolyte and acid–base balance differently. Br. J. Nutr. 2009, 101, 1286–1294. [Google Scholar] [CrossRef]
- Albarracín, W.; Sánchez, I.C.; Grau, R.; Barat, J.M. Salt in food processing; usage and reduction: A review. Int. J. Food Sci. Technol. 2011, 46, 1329–1336. [Google Scholar] [CrossRef]
- Rysová, J.; Šmídová, Z. Effect of salt content reduction on food processing technology. Foods 2021, 10, 2237. [Google Scholar] [CrossRef]
- de Oliveira, D.D.C.; Cristina Andrade, A.C.; Guimarães, J.; Rodrigues, J.F.; Natividade, M.M.P.; Bastos, S.C. Sodium reduction in butter using microparticulated salt. Br. Food J. 2019, 121, 874–881. [Google Scholar] [CrossRef]
- Winiarska-Mieczan, A.; Kwiatkowska, K.; Kwiecień, M.; Baranowska-Wójcik, E.; Wójcik, G.; Krusiński, R. Analysis of the intake of sodium with cereal products by the population of Poland. Food Addit. Contam. Part A 2019, 36, 884–892. [Google Scholar] [CrossRef]
- Cardoso, S.; Pinho, O.; Moreira, P.; Pena, M.J.; Alves, A.; Moreira, J.L.; Mendes, J.; Graça, P.; Gonçalves, C. Salt content in pre-packaged foods available in Portuguese market. Food Control 2019, 106, 106670. [Google Scholar] [CrossRef]
- Inyang, U.E.; Iduh, A.O. Influence of pH and salt concentration on protein solubility, emulsifying and foaming properties of sesame protein concentrate. J. Am. Oil Chem. Soc. 1996, 73, 1663–1667. [Google Scholar] [CrossRef]
- Raikos, V.; Campbell, L.; Euston, S.R. Effects of sucrose and sodium chloride on foaming properties of egg white proteins. Food Res. Internat. 2007, 40, 347–355. [Google Scholar] [CrossRef]
- Waniska, R.D.; Kinsella, J.E. Foaming properties of proteins: Evaluation of a column aeration apparatus using ovalbumin. J. Food Sci. 1979, 44, 1398–1402. [Google Scholar] [CrossRef]
- Demetriades, K.U.O.M.; Coupland, J.N.; McClements, D.J. Physical properties of whey protein stabilized emulsions as related to pH and NaCl. J. Food Sci. 1997, 62, 342–347. [Google Scholar] [CrossRef]
- Zayas, J.F. Functionality of Proteins in Food, 1st ed.; Springer: Berlin/Heidelberg, Germany, 1997; pp. 1–373. [Google Scholar]
- Mańko-Jurkowska, D.; Domian, E. The Effect of Heat- and Salt Treatment on the Stability and Rheological Properties of Chickpea Protein-Stabilized Emulsions. Appl. Sci. 2024, 14, 2698. [Google Scholar] [CrossRef]
- Akan, E.; Yerlikaya, O.; Kinik, O. Importance of salt in dairy products and sodium reduction strategies in food and dairy products. Agro Food Ind. Hi-Tech 2017, 28, 60–62. Available online: https://www.researchgate.net/publication/316668166_Importance_of_salt_in_dairy_products_and_sodium_reduction_strategies_in_food_and_dairy_products (accessed on 20 March 2025).
- Guinee, T.P. Salting and the role of salt in cheese. Int. J. Dairy Technol. 2004, 57, 99–109. [Google Scholar] [CrossRef]
- Bae, I.; Park, J.H.; Choi, H.Y.; Jung, H.K. Emerging Innovations to Reduce the Salt Content in Cheese; Effects of Salt on Fla-vor, Texture, and Shelf Life of Cheese; and Current Salt Usage: A Review. Korean J. Food Sci. Anim. Resour. 2017, 37, 793–798. [Google Scholar] [CrossRef]
- Laikoja, K.; Teder, L.; Jõudu, I. Assessment of chemical and sensory quality of unsalted and salted sweet cream butter during storage at different temperatures and time. J. Agric. Sci. 2017, 2, 76–81. [Google Scholar] [CrossRef]
- El Sadek, G.M.; Shehata, A.E.; Maharan, G.A.; Nofal, A.A.; Mehana, A.S. Effect of acidity and salt content on the keeping quality of butter. Élelmiszervizsgálati Közlemények 1974, 333–340. Available online: http://epa.niif.hu/03100/03135/00105/pdf/EPA03135_elelmiszervizsgalati_kozlemenyek_1974_05-06_333-340.pdf (accessed on 20 March 2025).
- Fitzgerald, E.; Buckley, J. Effect of total and partial substitution of sodium chloride on the quality of Cheddar cheese. J. Dairy. Sci. 1985, 68, 3127–3134. [Google Scholar] [CrossRef]
- Ganesan, B.; Brown, K.; Irish, D.A.; Brothersen, C.; McMahon, D.J. Manufacture and sensory analysis of reduced-and low-sodium Cheddar and Mozzarella cheeses. J. Dairy Sci. 2014, 97, 1970–1982. [Google Scholar] [CrossRef] [PubMed]
- Konieczny, P.; Kowalski, R.; Pyrcz, J. Wybrane wyróżniki jakościowe suszonych produktów Przekąskowych z mięsa wołowego. Żywność. Nauka. Technologia. Jakość 2004, 3, 32–39. Available online: https://wydawnictwo.pttz.org/wp-content/uploads/2015/02/03_Konieczny.pdf (accessed on 5 March 2025).
- Alahakoon, A.U.; Jayasena, D.D.; Ramachandra, S.; Jo, C. Alternatives to nitrite in processed meat: Up to date. Trends Food Sci. Technol. 2015, 45, 37–49. [Google Scholar] [CrossRef]
- Toldrá, F. Chapter 9—The Storage and Preservation of Meat: III—Meat Processing. In Lawrie’s Meat Science, 8th ed.; Toldrá, F., Ed.; Woodhead Publishing: Cambridge, UK, 2017; pp. 265–296. [Google Scholar]
- Delgado-Pando, G.; Fischer, E.; Allen, P.; Kerry, J.P.; Sullivan, M.G.O.; Hamill, R.M. Salt content and minimum acceptable levels in whole-muscle cured meat products. Meat Sci. 2018, 139, 179–186. [Google Scholar] [CrossRef] [PubMed]
- Wang, X.; Yu, Q.; He, L.; Zhang, Q.; Ma, J. Effects of nitrite concentrations on the quality and protein oxidation of salted meat. J. Food Sci. 2022, 87, 3978–3994. [Google Scholar] [CrossRef] [PubMed]
- Armenteros, M.; Aristoy, M.; Toldra, F. Effects of sodium, potassium, calcium, and magnesium chloride salts on porcine muscle proteases. Eur. Food Res. Technol. 2009, 229, 93–98. [Google Scholar] [CrossRef]
- Zimińska, H. Podstawy metod utrwalania surowców rzeźnych. In Technologia Mięsa; Pezacki, W., Ed.; Wydawnictwo Naukowo Techniczne: Warszawa, Poland, 1981; pp. 324–336. [Google Scholar]
- Majou, D.; Christieans, S. Mechanisms of the bactericidal effects of nitrate and nitrite in cured meats. Meat Sci. 2018, 145, 273–284. [Google Scholar] [CrossRef]
- Casey, P.G.; Condon, S. Sodium chloride decreases the bactericidal effect of acid pH on Escherichia coli O157:H45. Int. J. Food Microbiol. 2002, 76, 199–206. [Google Scholar] [CrossRef]
- Konieczny, P.; Pospiech, E.; Politowska, I. Wpływ soli morskiej na wybrane właściwości frakcji tłuszczowej mięsa bydlęcego. Żywność. Nauka. Technologia. Jakość 2005, 3, 108–120. Available online: https://wydawnictwo.pttz.org/wp-content/uploads/2015/02/11_Konieczny.pdf (accessed on 19 March 2025).
- Makała, H. Rola soli w przetworach mięsnych i możliwości obniżenia jej zawartości. Postępy Nauk. I Technol. Przemysłu Rolno-Spożywczego 2016, 71, 30–43. Available online: https://www.ibprs.pl/wp-content/uploads/2018/08/PNiTPRS-2016-nr-3-Rozdzial3.pdf (accessed on 19 March 2025).
- Konieczny, P.; Górecka, D. Mięso w żywieniu człowieka—Aktualne kierunki w produkcji wyrobów mięsnych. Przem. Spoż. 2011, 3, 28–31. [Google Scholar]
- Steen, L.; Fraeye, I.; Goemaere, O.; Sifre, L.; Goderis, B.; Paelinck, H.; Foubert, I. Effect of salt and liver/fat ratio on microstructure, emulsion stability, texture and sensory mouth feel of liver paste. Food Bioprocess. Technol. 2014, 7, 2855–2864. [Google Scholar] [CrossRef]
- Feng, X.; Chen, L.; Lei, N.; Wang, S.; Xu, X.; Zhou, G.; Li, Z. Emulsifying Properties of Oxidatively Stressed Myofibrillar Protein Emulsion Gels Prepared with (-)-Epigallocatechin-3-gallate and NaCl. J. Agric. Food Chem. 2017, 65, 2816–2826. [Google Scholar] [CrossRef] [PubMed]
- Zheng, J.; Han, Y.; Ge, G.; Zhao, M.; Sun, W. Partial substitution of NaCl with chloride salt mixtures: Impact on oxidative characteristics of meat myofibrillar protein and their rheological properties. Food Hydrocoll. 2019, 96, 36–42. [Google Scholar] [CrossRef]
- Hamm, R. Biochemistry of Meat Hydration. Adv. Food Res. 1961, 10, 355–463. [Google Scholar] [CrossRef]
- Álvarez, S.; Mullen, A.M.; Hamill, R.; O’Neill, E.; Álvarez, C. Dry-aging of beef as a tool to improve meat quality. Impact of processing conditions on the technical and or-ganoleptic meat properties. Adv. Food Nutr. Res. 2021, 95, 97–130. [Google Scholar] [CrossRef]
- Codină, G.G.; Voinea, A.; Dabija, A. Strategies for Reducing Sodium Intake in Bakery Products, a Review. Appl. Sci. 2021, 11, 3093. [Google Scholar] [CrossRef]
- AACC International Method 54-21.02 Rheological Behavior of Flour by Farinograph: Constant Flour Weight Procedure. 2011. Available online: https://www.scribd.com/document/847695460/AACC54-21-Farinografo#:~:text=The%20document%20outlines%20the%20AACC%20International%20Method,values%20based%20on%20the%20flour's%20moisture%20content (accessed on 5 February 2025).
- Linko, P.; Härkönen, H.; Linko, Y.Y. Effects of sodium chloride in the processing of bread baked from wheat, rye and barley flours. J. Cereal Sci. 1984, 2, 53–62. [Google Scholar] [CrossRef]
- Chen, G.; Ehmke, L.; Sharma, C.; Miller, R.; Faa, P.; Smith, G.; Li, Y. Physicochemical properties and gluten structures of hard wheat flour doughs as affected by salt. Food Chem. 2019, 275, 569–576. [Google Scholar] [CrossRef]
- Tuhumury, H.C.D.; Small, D.M.; Day, L. The effect of sodium chloride on gluten network formation and rheology. J. Cereal Sci. 2014, 60, 229–237. [Google Scholar] [CrossRef]
- Abedi, E.; Majzoobi, M.; Farahnaky, A.; Pourmohammadi, K.; Mahmoudi, M.R. Effect of ionic strength (NaCl and CaCl2) on functional, textural and electrophoretic properties of native and acetylated gluten, gliadin and glutenin. Int. J. Biol. Macromol. 2018, 120, 2035–2047. [Google Scholar] [CrossRef]
- Tuhumury, H.C.; Small, D.M.; Day, L. Effects of Hofmeister salt series on gluten network formation: Part II. Anion series. Food Chem. 2016, 212, 798–806. [Google Scholar] [CrossRef] [PubMed]
- Kuang, J.; Xu, K. Comparative molecular conformation, interaction, and network characteristics of wheat gluten modulated by sodium chloride and sodium carbonate. IFST 2023, 58, 6621–6632. [Google Scholar] [CrossRef]
- Avramenko, N.A.; Tyler, R.T.; Scanlon, M.G.; Hucl, P.; Nickerson, M.T. The chemistry of bread making: The role of salt to ensure optimal functionality of its constituents. Food Rev. Inter. 2018, 34, 204–225. [Google Scholar] [CrossRef]
- Schünemann, C.; Treu, G. Technologie der Backwarenherstellung: Fachkundliches Lehrbuch für Bäcker und Bäckerinnen; Gildebuchverlag GmbH: Hamburg, Germany, 2002; p. 35. [Google Scholar]
- Toyosaki, T.; Sakane, Y.; Kasai, M. Effects of medium-chain triacylglycerols (MCT) on the Maillard reaction. J. Food Process Technol. 2013, 2, 84–89. [Google Scholar] [CrossRef]
- AACC International Method 76-21.01 General Pasting Method for Wheat or Rye Flour or StarchUsing the Rapid Visco Analyser. 1999. Available online: https://www.scribd.com/document/623660661/AACC-metodo-76-21-01-RVA (accessed on 5 February 2025).
- Ochońska-Borowska, Z.; Pietrzyk, A. Oznaczanie geograficznego pochodzenia produktu w czasach „konsumenckiego patriotyzmu”. iKAR 2022, 11, 7–24. [Google Scholar] [CrossRef]
- Chudy, S.; Kępiński, J.; Makowska, A. The Origin Link Between “Śląski” Cheese and the Silesia Region: A Basis for Obtaining Protection for Geographical Indications. Foods 2025, 14, 338. [Google Scholar] [CrossRef] [PubMed]
- eAbrosia. OER Commons. Available online: https://ec.europa.eu/agriculture/eambrosia/geographical-indications-register/ (accessed on 29 April 2025).
- Available online: https://www.tmdn.org/giview/gi/search (accessed on 29 April 2025).
Disclaimer/Publisher’s Note: The statements, opinions and data contained in all publications are solely those of the individual author(s) and contributor(s) and not of MDPI and/or the editor(s). MDPI and/or the editor(s) disclaim responsibility for any injury to people or property resulting from any ideas, methods, instructions or products referred to in the content. |
© 2025 by the authors. Licensee MDPI, Basel, Switzerland. This article is an open access article distributed under the terms and conditions of the Creative Commons Attribution (CC BY) license (https://creativecommons.org/licenses/by/4.0/).