
Research Progress in the Detection of Mycotoxins in Cereals and Their Products by Vibrational Spectroscopy


Abstract
1. Introduction
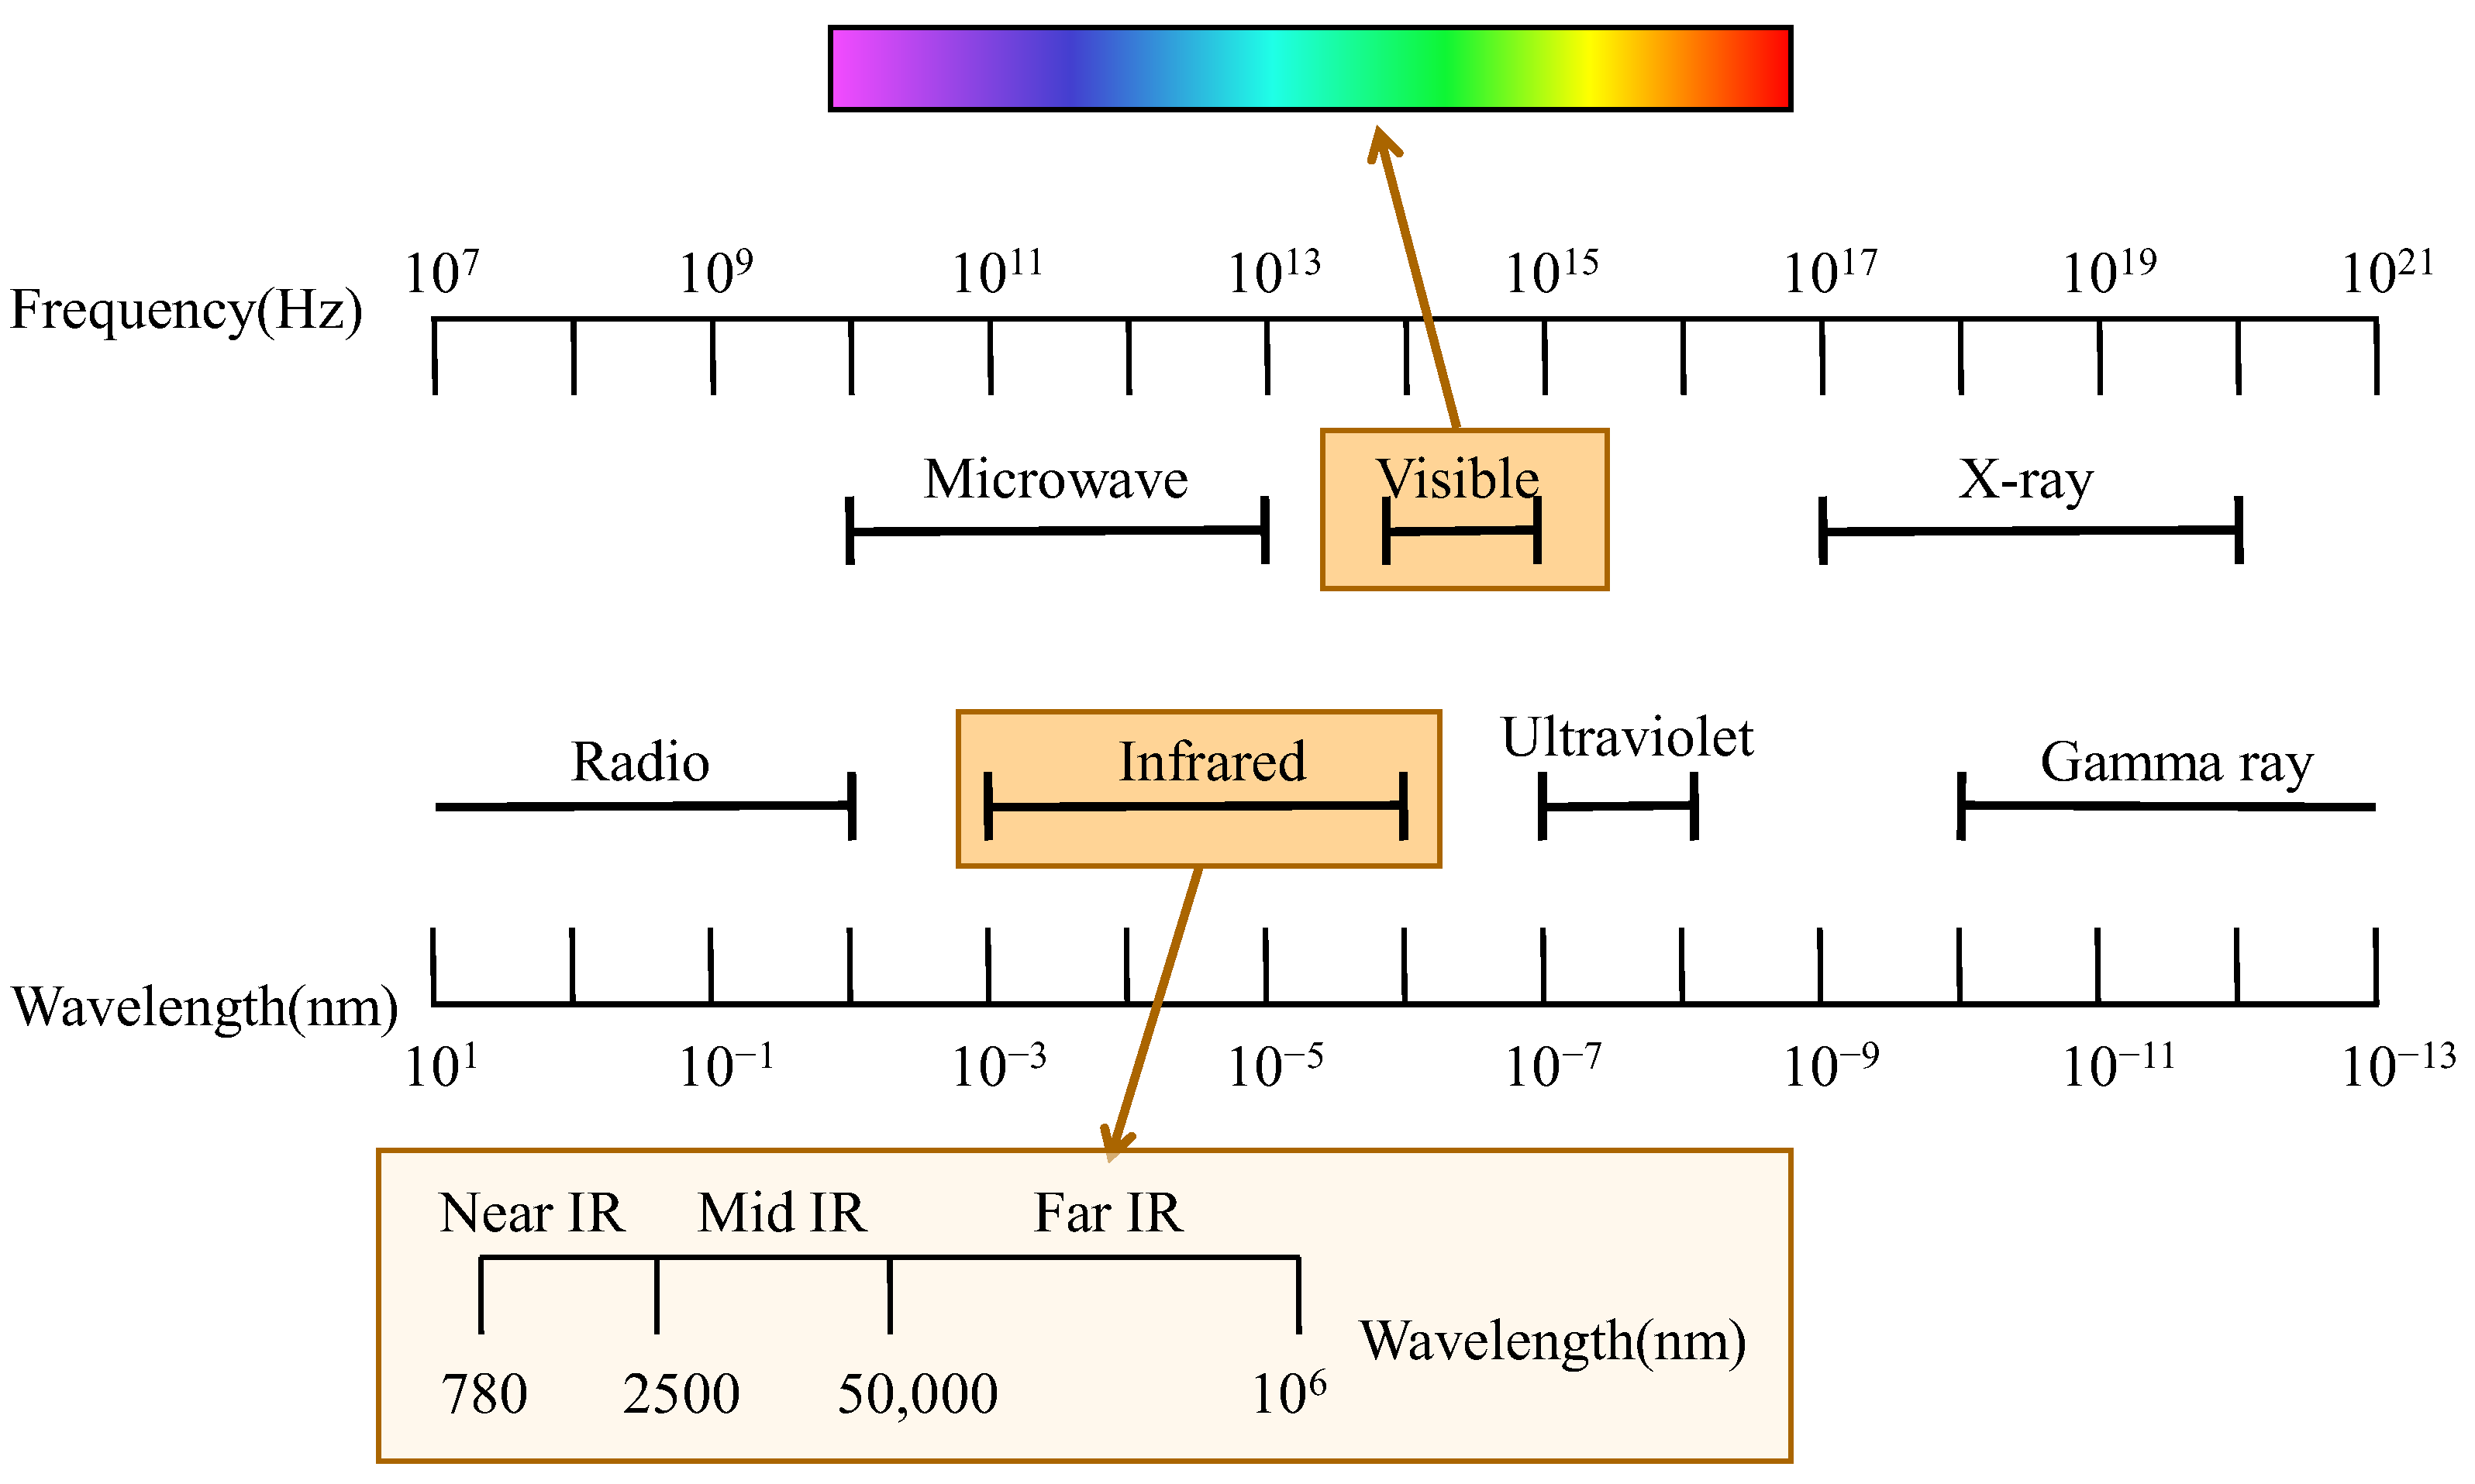
2. Basic Principles of Vibrational Spectroscopy
2.1. Vis–NIR
2.2. NIR
2.3. MIR
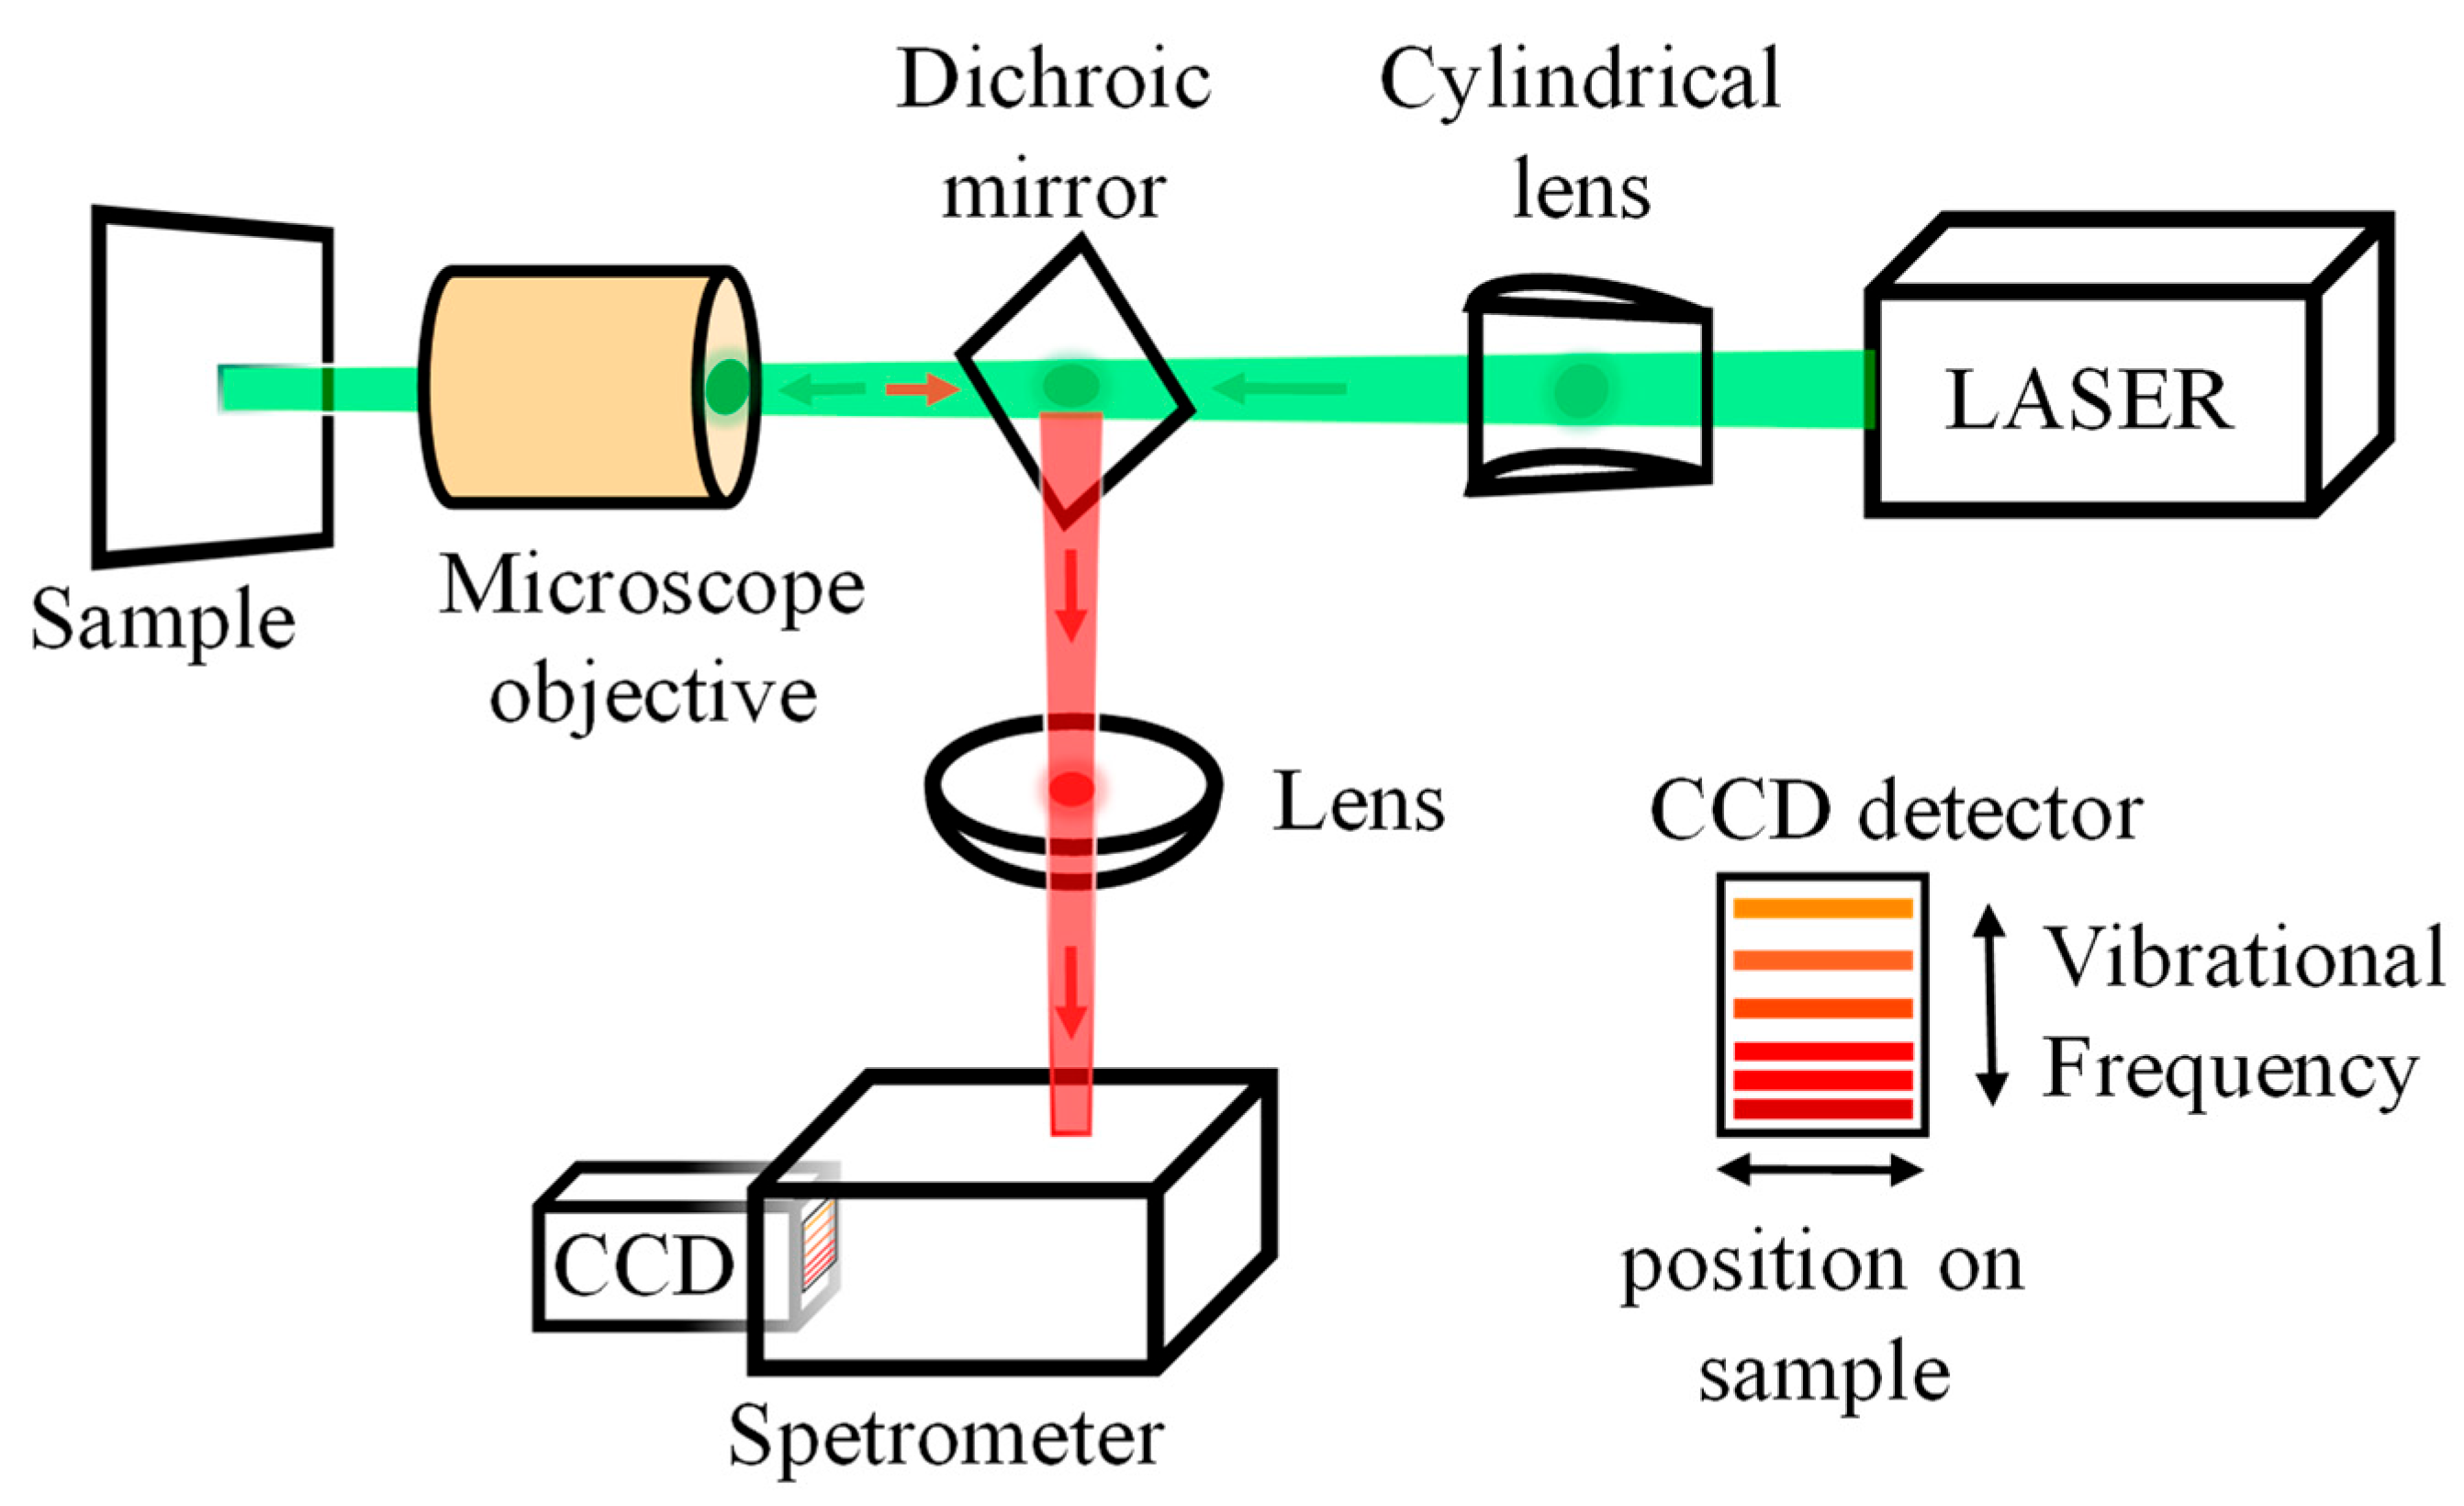
2.4. Raman
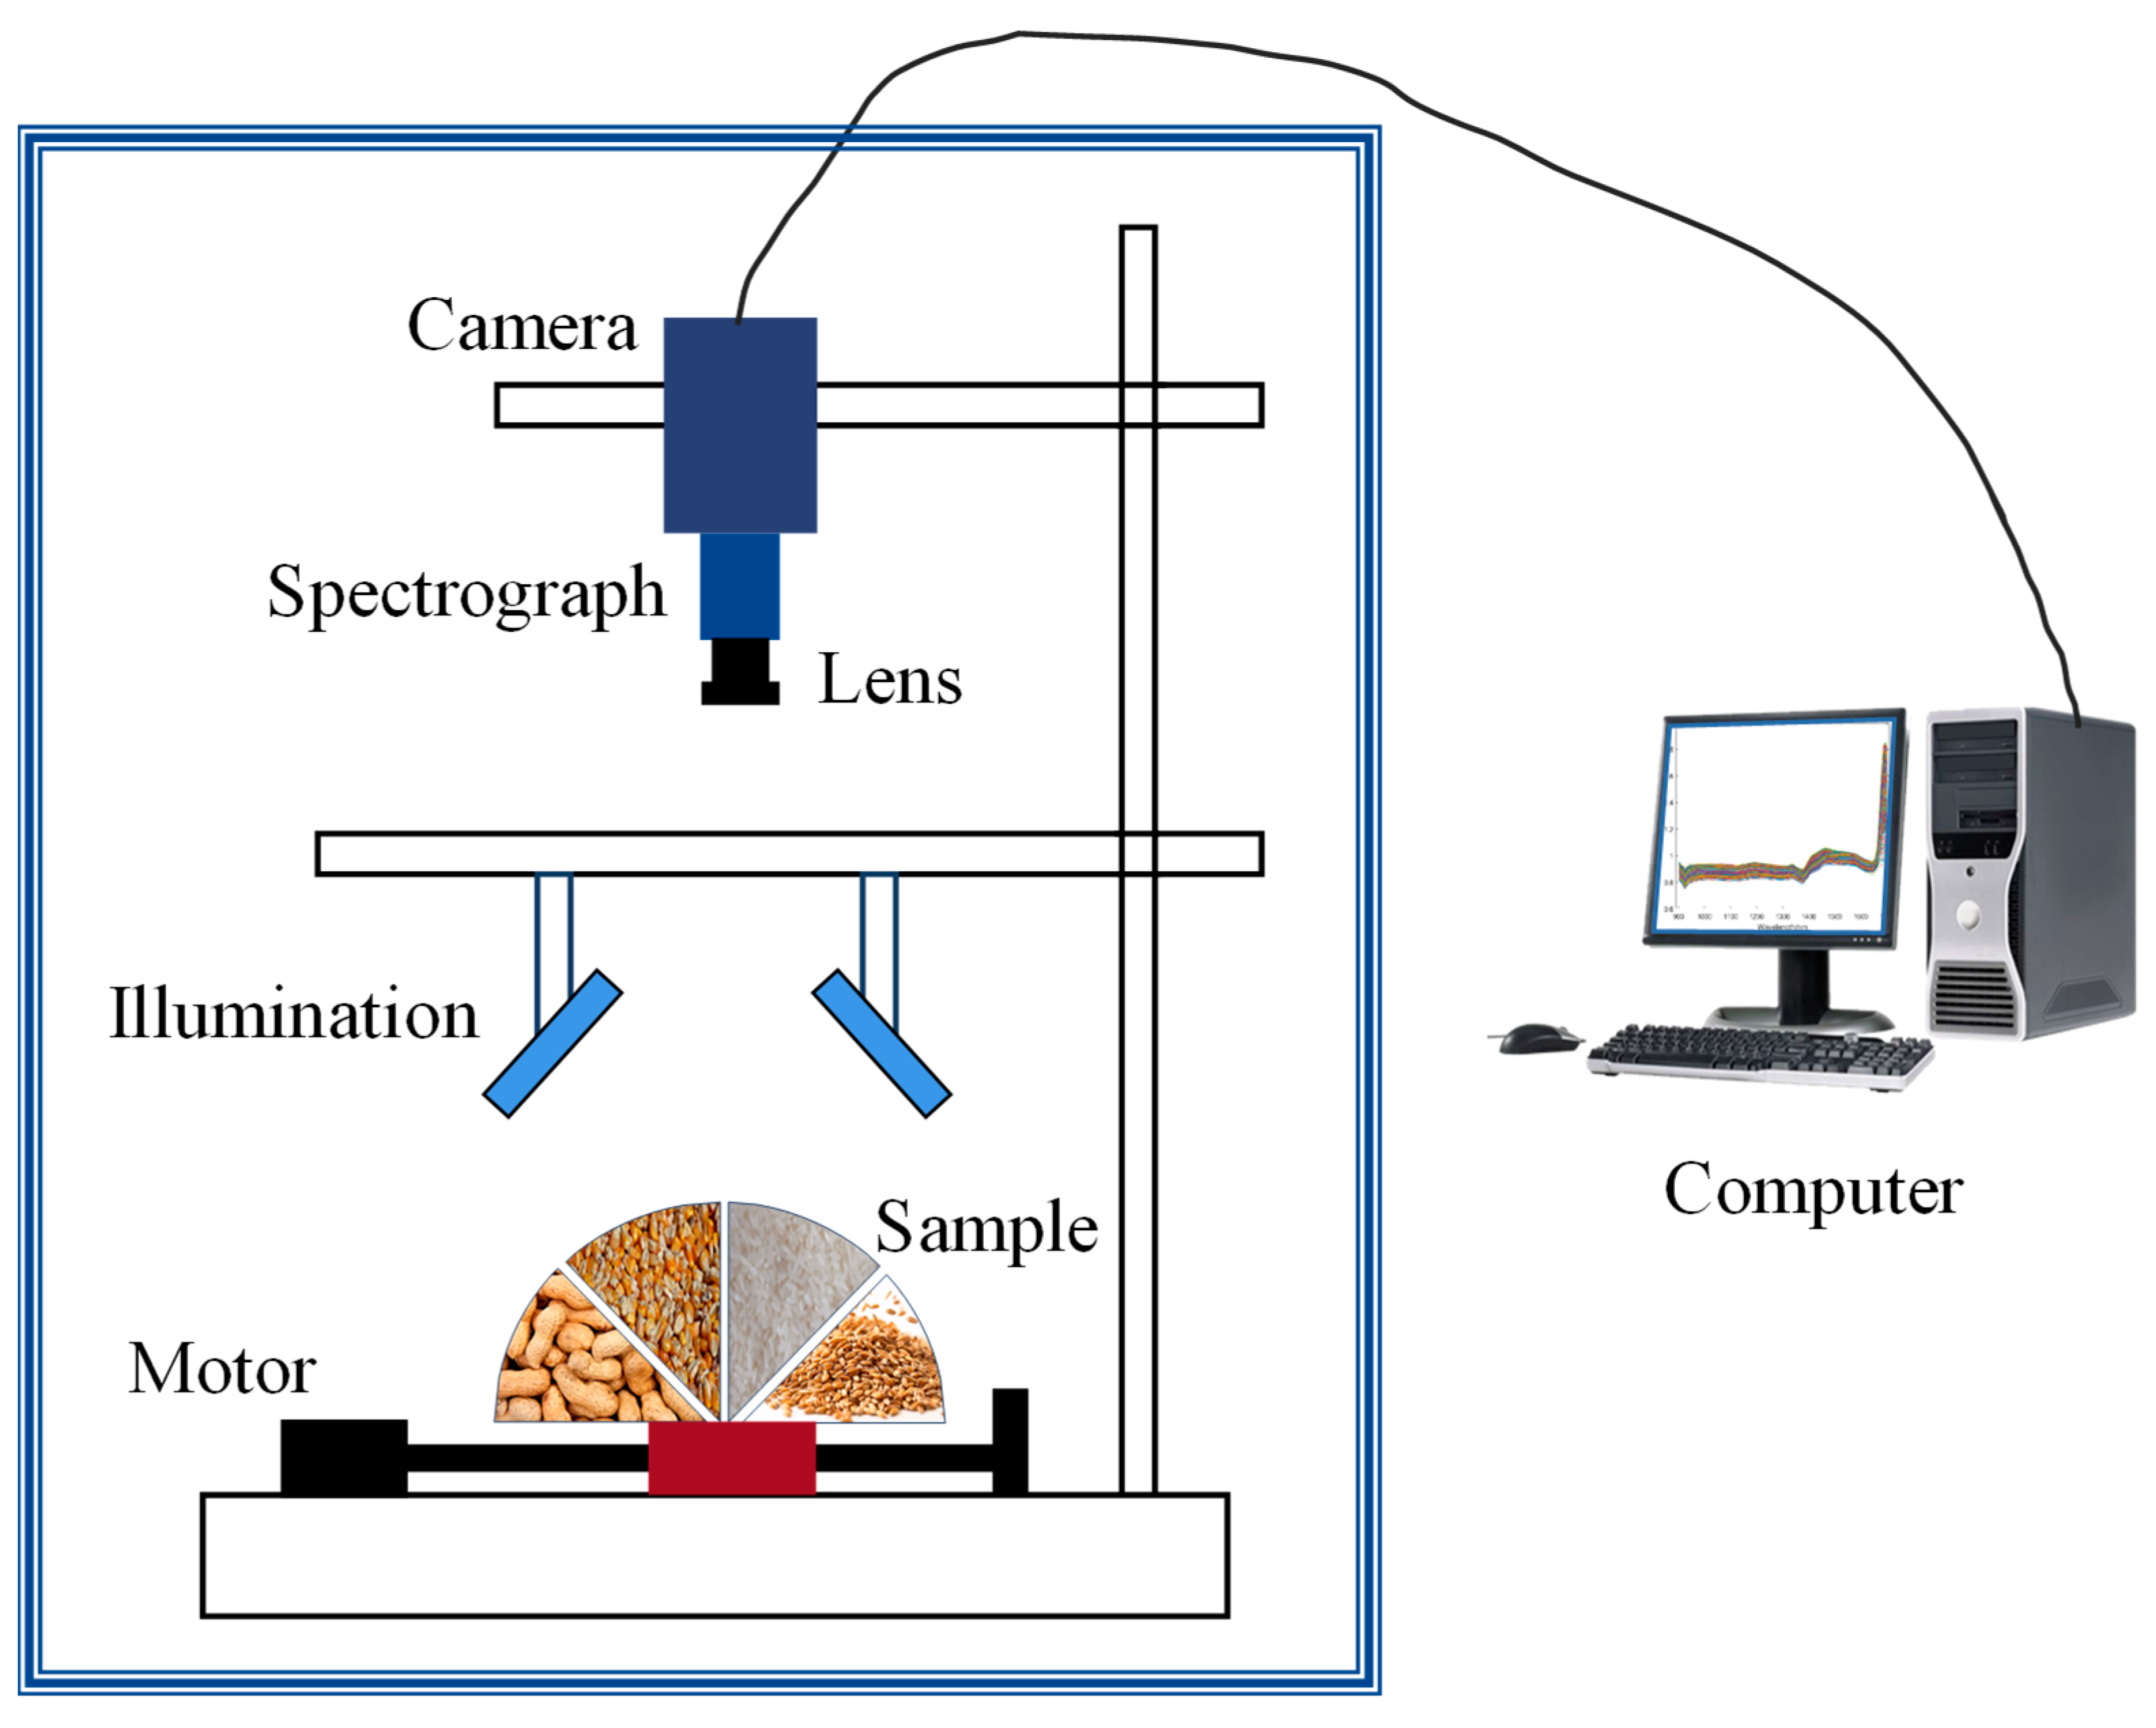
2.5. HSI
3. Spectral Analysis Framework
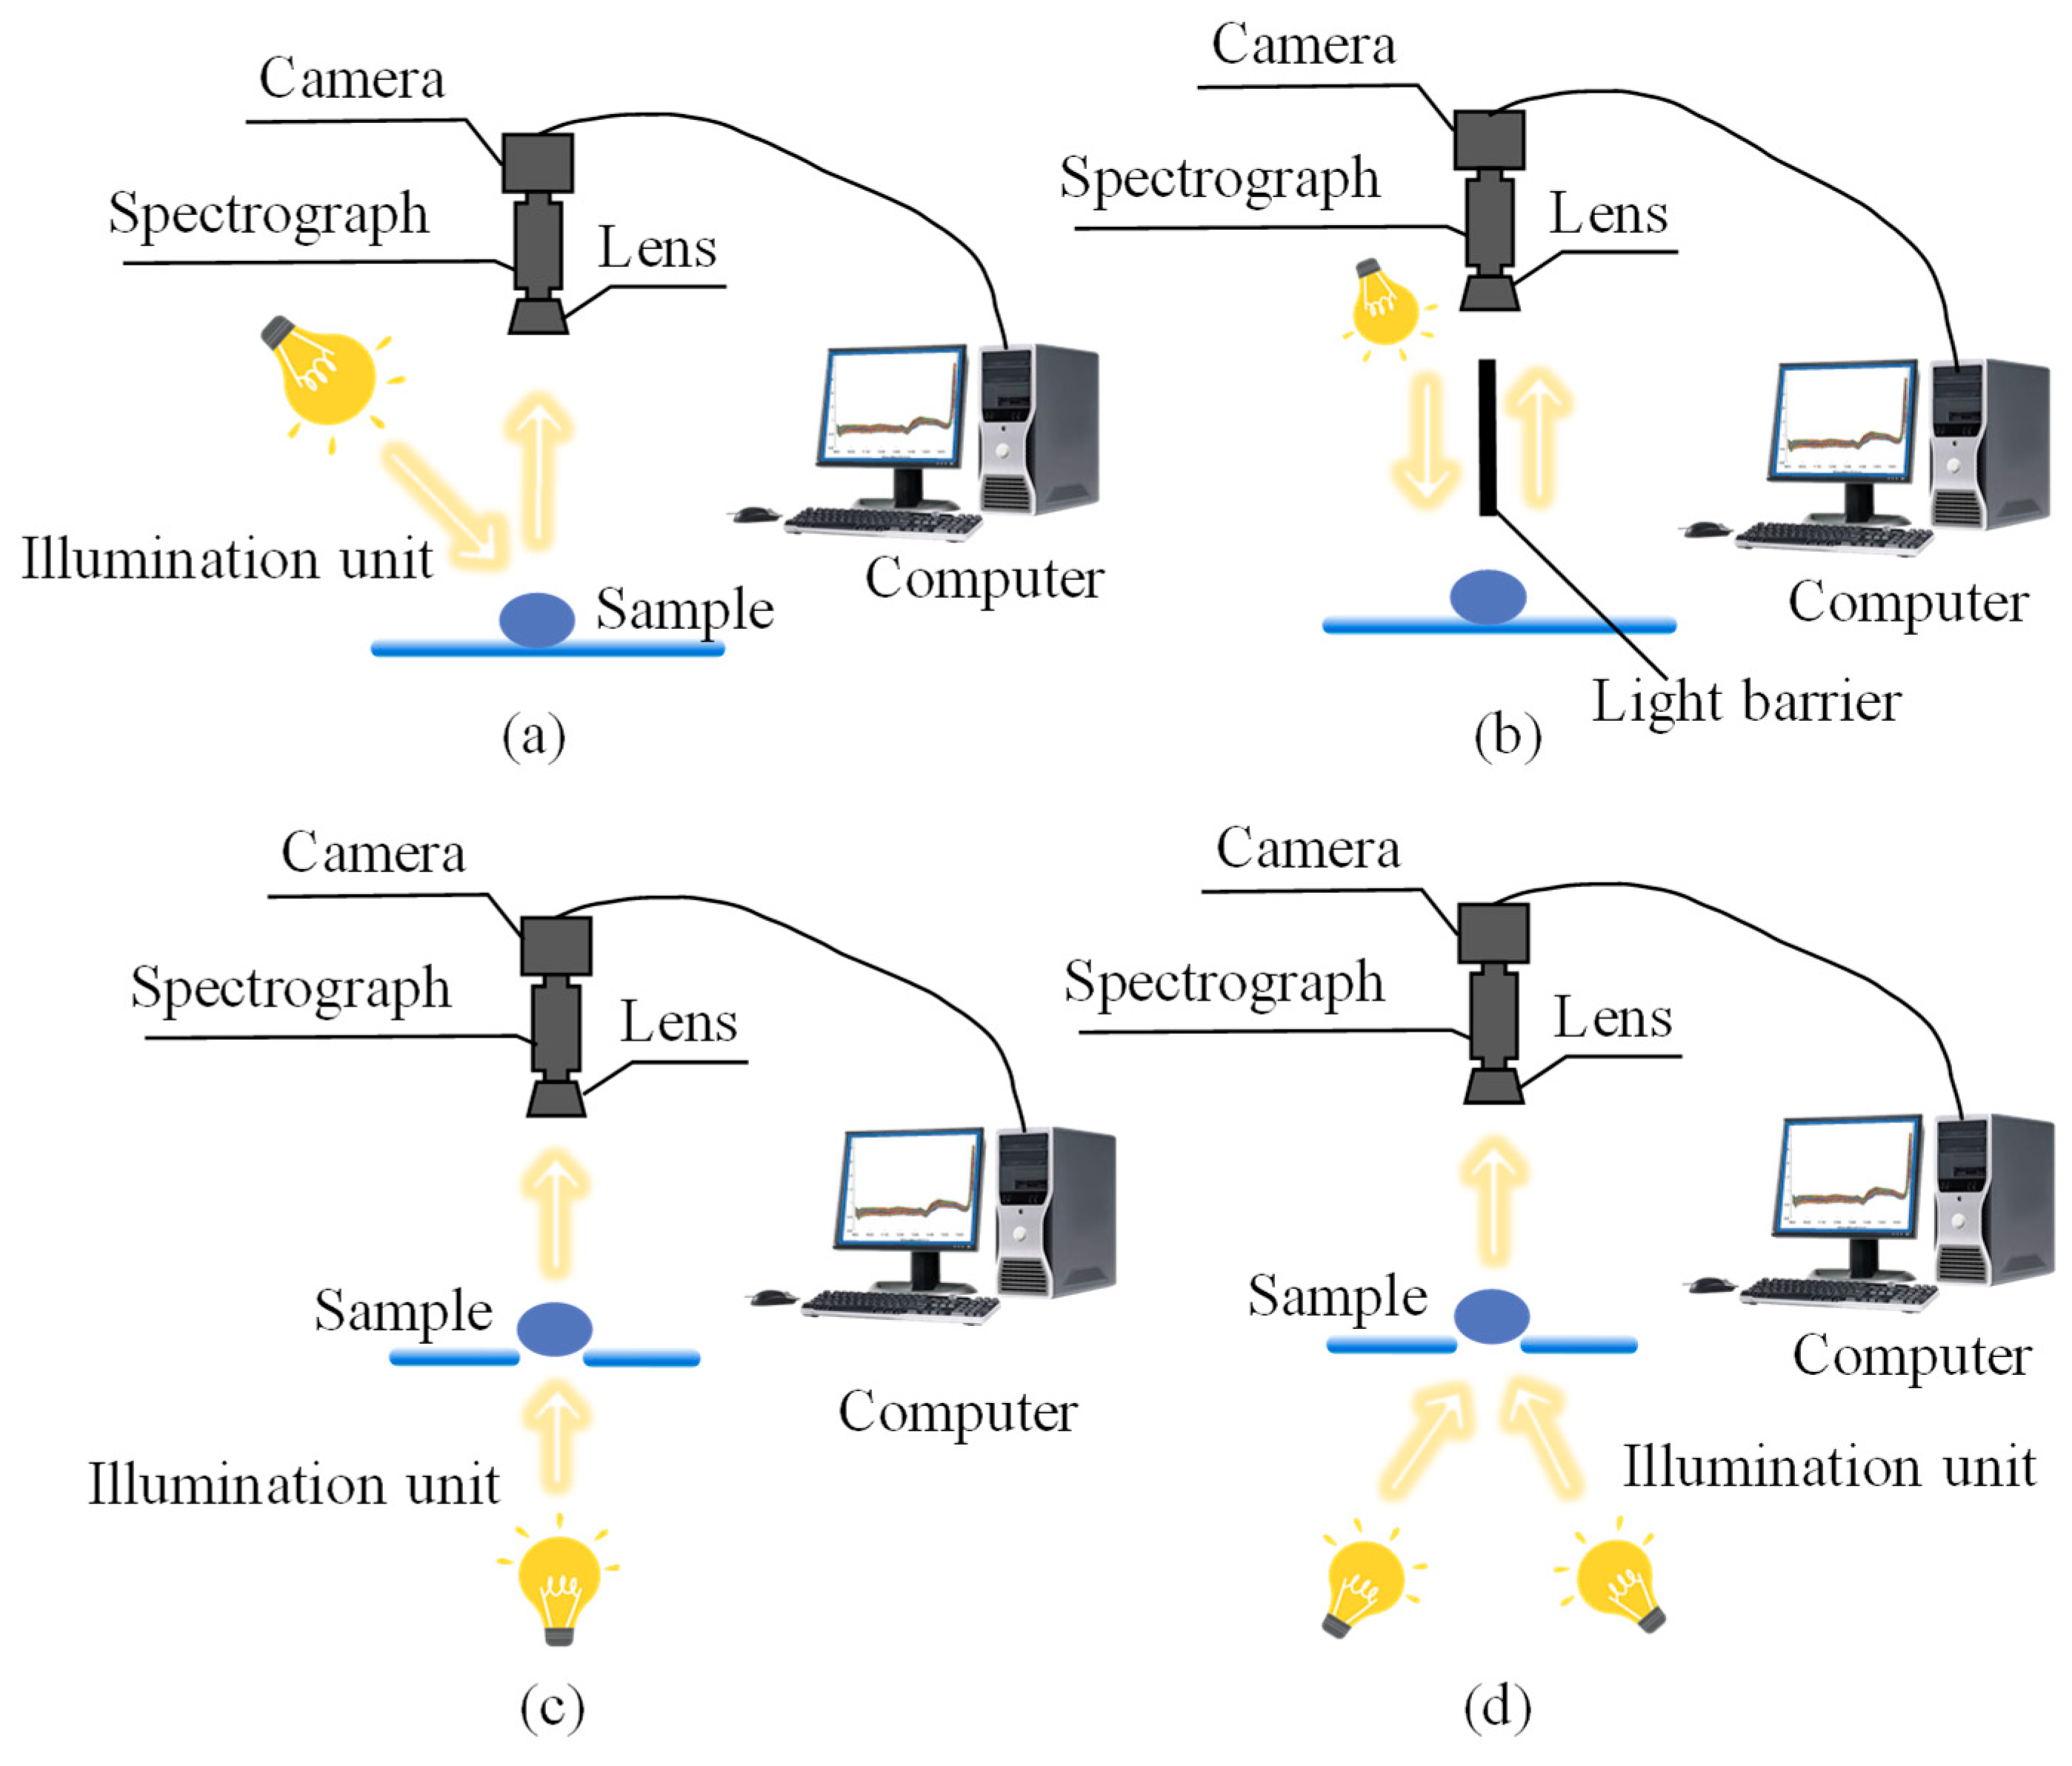
3.1. Sample Preparation and Data Acquisition
3.2. Dataset Partitioning
3.3. Preprocessing Methods
3.4. Feature Extraction or Feature Selection
3.5. Model Calibration
3.6. Model Evaluation
4. Application of Spectral Technology in Monitoring Mycotoxins
4.1. Vis–NIR
4.2. NIR

| Samples | Toxins | Range | Processing | Modeling | Performance | Ref. |
|---|---|---|---|---|---|---|
| Wheat | AFB1 | 4.1465–44.6981 ug/kg | Ground | PLSR | R2 = 0.9935 | [105] |
| Peanut | AFB1 | 2.1207–290.0161 ug/kg | Ground | SVR | R2 = 0.9761 | [107] |
| Maize | AFB1 | 2.6214–63.0195 ug/kg | Ground | PLSR, SVR | PLSR: R2 = 0.9260 SVR: R2 = 0.9707 | [108] |
| Wheat | ZEN | 19.6–65.0 ug/kg | Ground | SVR | R2 = 0.99 | [106] |
| Wheat | ZEN | 20.2380–483.9630 ug/kg | Ground | PLSR, SVR | PLSR: R2 = 0.9212 SVR: R2 = 0.9434 | [109] |
| Maize | AFB1 | Ground | BPNN | R = 0.9951 | [110] | |
| Maize | AF, AFB1 | AF: 0.015–73.07 ug/kg AFB1: 0.015–30.17 ug/kg | Unground | PLS, ANN, PCA-DA | AF: R2 = 0.78, Acc = 100% AFB1: R2 = 0.82, Acc = 97.4% | [111] |
| Black beans | Fumonisin B1 | 0–10 mg/kg | Unground/ Ground | PLSR | R2 = 0.92 | [112] |
| Peanut | AFB1 | 2.21–23.79 g/kg | Unground | LDA, PLSR | R2 = 0.942, Acc = 100% | [113] |
| Peanut | AFB1 | 0.63–56.0 ug/kg | Ground | CNN | R2 = 0.99 | [114] |
| Rice | AFB1 | 0–41.990 ug/kg | Ground | PLS-DA, PLSR | R = 0.952, Acc = 90% | [115] |
| Maize | FB1, FB2 | FB1: 62.5–4000 ug/kg FB2: 62.5–2861 ug/kg | Ground | PLSR, ANN | FB1: R2 = 0.91 FB2: R2 = 0.93 | [116] |
| Barley | Enniatin | 5.4–7459.2 ug/kg | Ground | PLS-DA | Sensitivity = 94.2% | [117] |
| Peanut | AFB1 | 2.44–223.76 ug/kg | Unground | Naïve Bayes | Acc = 86.96% | [118] |
| Maize | FB1, FB2 | 0–217.45 mg/kg | Ground | PLSR, SVR, LPLS-S, PLS-DA, SVM-DA | R2 = 0.91, Acc = 89.3% | [119] |
| Maize | AFB1 | 2.6214–63.0195 ug/kg | Ground | CNN | R2 = 0.9955 | [120] |
4.3. MIR
| Samples | Toxins | Range | Processing | Modeling | Performance | Ref. |
|---|---|---|---|---|---|---|
| Wheat | FBH | / | Unground/ Ground | RF, LDA | Kernels: Acc = 93.1% Flour: Acc = 100% | [97] |
| Wheat | DON | / | Ground | PLS-DA | Balanced dataset: true positive rate (TPR): 0.81 Imbalanced dataset: true negative rate (TNR): 0.85 | [121] |
| Peanut | AF | 3.24–2951.21 ppb | Unground | OPLS-DA, SIMCA, PLSR | R = 0.85, Sensitivity = 94.7% | [123] |
| Wheat | OTA | 0.15–54 ug/kg | Unground | PLS-DA, PC-LDA | Acc = 96% | [122] |
4.4. Raman
| Samples | Toxins | Range | SERS Substrate | Performance | LOD | Ref. |
|---|---|---|---|---|---|---|
| Wheat Maize | OTA ZEN | OTA: 0.01–100 ng/mL ZEN: 0.05–500 ng/mL | Reporting probe: Au@Ag core–shell nanoparticles modified 4-MBA and DTNB Capture probe: Gold nanorods (AuNRs) modified complementary DNA (SH-cDNA) | OTA: R2 = 0.986 ZEN: R2 = 0.987 | OTA: 0.018 ng/mL ZEN: 0.054 ng/mL | [134] |
| Maize | ZEN | 5–400 μg/kg | AuMBA@AgMBANPs | R2 = 0.9989 | 3 μg/kg | [130] |
| Maize | ZEN | 3–200 ng/mL | MSN–Rh6g–AuNPs | R2 = 0.988 | 0.0064 ng/mL | [131] |
| Maize | ZEN | 10–1000 μg/kg | Core–shell Au@AgNPs with embedded reporter molecules (4-MBA) | R2 = 0.993 | 3.6 μg/kg | [133] |
| Wheat | AFB1 | 0.1–5 ng/mL | Au@Ag core–shell nanoparticle (Au@Ag CSNPs) | R2 = 0.9963 | 0.03 ng/mL | [135] |
| Coix seed | AFB1 | 0.01–100 ng/mL | gold magnetic nanoparticles (GMNPs) and Ag NPs | R2 = 0.9948 | 0.0060 ng/mL | [136] |
| Wheat | FB1 | 0.01–1 µg/L | Se-WCDs-Au-Janus Ag NPs | R2 = 0.9883 | 0.005 μg/L | [137] |
| Peanut | AFB1 | 0.01–100 ng/mL | AuNPs and MNPs | R2 = 0.9742 | 5.81 pg/mL | [132] |
4.5. HSI
| Samples | Toxins | Range | Processing | Data Type | Modeling | Performance | Ref. |
|---|---|---|---|---|---|---|---|
| Wheat | DON | 0.9–57 mg/kg | Ground | Spectral value | PLSR, RF, SVR, CNN | R2 = 0.96 | [141] |
| Maize | AFB1 | 0–1206 ug/kg | Ground | Spectral value | LDA, SVM, QDA | Vis–NIR: Acc = 82.6% Fluorescence: Acc = 95.7% SWIR: Acc = 95.7% Raman: Acc = 87% | [142] |
| Wheat | DON | 0–135.7 mg/kg | Unground | Spectral value | LDA, Naïve Bayes, KNN, ANN, PLSR | R2 = 0.88, Acc = 76.9% | [138] |
| Wheat | DON | <LOD−6.233 mg/kg | Ground | Spectral features, Image features | LDA, PLSR | R = 0.691, Acc = 96.92% | [140] |
| Wheat | DON | <LOD − 2.7 mg/kg | Unground | Spectral features | LDA | Acc = 92.5% | [143] |
| Wheat | DON Fusarium | / | Unground | Spectral features, Image features | KNN | DON: Acc = 80%, Fusarium: Acc = 85% | [144] |
| Wheat | DON | <LOD−507.28 mg/kg | Unground | Spectral feature | PLS-DA, PLS, SVM, LPLS-S, | , R2 = 0.81 | [139] |
| Peanut | AFB1, AFB2, AFG2, AF | AFB1: 0.148–84.038 AFB2: 0.011–73.625 AFG2: 0–9.163 AF: 0.159–166.826 | Unground | Spectral feature | PLS-DA, LDA, SIMCA, K-NN PLSR, PCR | AFB1: R2 = 0.8863, Acc = 89.66% AFB2: R2 = 0.7864 AFG2: R2 = 0.6612 AF: R2 = 0.8559, Acc = 79.31% | [145] |
| Maize Kernels | DON, FB1, FB2, FB1 + FB2 | DON: <LOD−18.622 FB1: <LOD−37.591 FB2: <LOD−27.066 FB1 + FB2: <LOD − 63.891 | Unground | Spectral feature | RF, ANN, KNN, logistic regression, PLSR | DON: Acc = 98.60% FB1 + FB2: Acc = 84.40% DON+ FB1 + FB2: Acc = 89.8% DON: R = 0.904 FB1: R = 0.868 FB2: R = 0.901 FB1 + FB2: R = 0.901 | [146] |
| Oat | DON | <LOD-2706 µg/kg | Unground/ Ground | Spectral feature | RF, ANN, KNN Naïve Bayes, PLSR | Unground: Acc = 77.8% Ground: Acc = 70.8% Unground: R = 0.92 Ground: R = 0.90 | [147] |
| Peanut | AFB1 | 0–200 ppb | Unground | Spectral feature Texture feature Color feature | LDA, PLS-DA, SVM | Acc = 94% | [148] |
| Maize | AF | LOD−>2000 ppb | Unground | Spectral feature | PLS-DA | 20 ppb: Acc = 89.8% 100 ppb: Acc = 89.3% | [149] |
| Maize | AF | LOD−>2000 ppb | Unground | Spectral feature | LDA | 20 ppb: Acc = 86.7% 100 ppb: Acc = 89.6% | |
| Maize | AF FM | / | Unground | Spectral feature | PLS-DA, SVM | Vis–NIR: Acc = 89.1% Fluorescence: Acc = 71.7% SWIR: Acc = 95.7% | [150] |
| Maize | ZEN | 19.98–102.30 µg/kg | Unground | Spectral feature | BPNN, PLS-DA, SVM | R2 = 0.95, Acc = 93.33% | [151] |
| Peanut | AF | / | Unground | Spectral feature | PLS-DA, PCA-LDA, LDA, ISOGA-CNN, CNN, CNN-LSTM, A-CNN-LSTM | Binary: Acc = 93.33% Six: Acc = 100% | [152] |
5. Difference Analysis of Different Vibrational Spectroscopy Techniques
6. Challenges, Trends and Outlook
7. Conclusions
Author Contributions
Funding
Data Availability Statement
Acknowledgments
Conflicts of Interest
References
- Mc Carthy, U.; Uysal, I.; Badia-Melis, R.; Mercier, S.; O’Donnell, C.; Ktenioudaki, A. Global food security–Issues, challenges and technological solutions. Trends Food Sci. Technol. 2018, 77, 11–20. [Google Scholar] [CrossRef]
- Jiang, Y.; Chen, S.; Hu, B.; Zhou, Y.; Liang, Z.; Jia, X.; Huang, M.; Wei, J.; Shi, Z. A comprehensive framework for assessing the impact of potential agricultural pollution on grain security and human health in economically developed areas. Environ. Pollut. 2020, 263, 114653. [Google Scholar] [CrossRef]
- Poutanen, K. Past and future of cereal grains as food for health. Trends Food Sci. Technol. 2012, 25, 58–62. [Google Scholar] [CrossRef]
- Walker, S.; Jaime, R.; Kagot, V.; Probst, C. Comparative effects of hermetic and traditional storage devices on maize grain: Mycotoxin development, insect infestation and grain quality. J. Stored Prod. Res. 2018, 77, 34–44. [Google Scholar] [CrossRef]
- Shi, H.; Li, J.; Zhao, Y.; Mao, J.; Wang, H.; Zhu, J. Effect of Aspergillus flavus contamination on the fungal community succession, mycotoxin production and storage quality of maize kernels at various temperatures. Food Res. Int. 2023, 174, 113662. [Google Scholar] [CrossRef]
- Qiu, J.; Gu, H.; Wang, S.; Ji, F.; He, C.; Jiang, C.; Shi, J.; Liu, X.; Shen, G.; Lee, Y.-W.; et al. A diverse Fusarium community is responsible for contamination of rice with a variety of Fusarium toxins. Food Res. Int. 2024, 195, 114987. [Google Scholar] [CrossRef] [PubMed]
- Zou, M.; Zhou, S.; Zhou, Y.; Jia, Z.; Guo, T.; Wang, J. Cadmium pollution of soil-rice ecosystems in rice cultivation dominated regions in China: A review. Environ. Pollut. 2021, 280, 116965. [Google Scholar] [CrossRef]
- Mebdoua, S.; Ounane, G. Evaluation of pesticide residues in wheat grains and its products from Algeria. Food Addit. Contam. Part B 2019, 12, 289–295. [Google Scholar] [CrossRef]
- Telloli, C.; Cicconi, F.; Lombardi, P.; Borgognoni, F.; Salvi, S.; Iapalucci, M.C.; Rizzo, A. ICP-MS triple quadrupole as analytical technique for the characterization of metal contamination processes in commercial flours for food safety. J. Food Compos. Anal. 2025, 141, 107387. [Google Scholar] [CrossRef]
- Zhang, Q.; Wang, X.; Chen, Y.; Song, G.; Zhang, H.; Huang, K.; Luo, Y.; Cheng, N. Discovery and solution for microplastics: New risk carriers in food. Food Chem. 2025, 471, 142784. [Google Scholar] [CrossRef]
- Luo, L.; Ma, S.; Li, L.; Liu, X.; Zhang, J.; Li, X.; Liu, D.; You, T. Monitoring zearalenone in corn flour utilizing novel self-enhanced electrochemiluminescence aptasensor based on NGQDs-NH2-Ru@SiO2 luminophore. Food Chem. 2019, 292, 98–105. [Google Scholar] [CrossRef]
- Zhu, W.; Li, L.; Zhou, Z.; Yang, X.; Hao, N.; Guo, Y.; Wang, K. A colorimetric biosensor for simultaneous ochratoxin A and aflatoxins B1 detection in agricultural products. Food Chem. 2020, 319, 126544. [Google Scholar] [CrossRef]
- Ngolong Ngea, G.L.; Yang, Q.; Castoria, R.; Zhang, X.; Routledge, M.N.; Zhang, H. Recent trends in detecting, controlling, and detoxifying of patulin mycotoxin using biotechnology methods. Compr. Rev. Food Sci. Food Saf. 2020, 19, 2447–2472. [Google Scholar] [CrossRef] [PubMed]
- Xia, X.; Zhang, Y.; Li, M.; Garba, B.; Zhang, Q.; Wang, Y.; Zhang, H.; Li, P. Isolation and characterization of a Bacillus subtilis strain with aflatoxin B 1 biodegradation capability. Food Control 2017, 75, 92–98. [Google Scholar] [CrossRef]
- Li, X.; Sun, M.; Xu, L.; Liu, L.; Xu, X.; Kuang, H.; Xu, C. Development of a visual immunosensing platform based on fluorescent microspheres for the rapid detection of ochratoxins in cereals. Food Chem. 2025, 469, 142510. [Google Scholar] [CrossRef]
- Deligeorgakis, C.; Magro, C.; Skendi, A.; Gebrehiwot, H.H.; Valdramidis, V.; Papageorgiou, M. Fungal and Toxin Contaminants in Cereal Grains and Flours: Systematic Review and Meta-Analysis. Foods 2023, 12, 4328. [Google Scholar] [CrossRef] [PubMed]
- Arce-López, B.; Coton, M.; Coton, E.; Hymery, N. Occurrence of the two major regulated mycotoxins, ochratoxin A and fumonisin B1, in cereal and cereal-based products in Europe and toxicological effects: A review. Environ. Toxicol. Pharmacol. 2024, 109, 104489. [Google Scholar] [CrossRef] [PubMed]
- Awuchi, C.G.; Ondari, E.N.; Nwozo, S.; Odongo, G.A.; Eseoghene, I.J.; Twinomuhwezi, H.; Ogbonna, C.U.; Upadhyay, A.K.; Adeleye, A.O.; Okpala, C.O.R. Mycotoxins’ Toxicological Mechanisms Involving Humans, Livestock and Their Associated Health Concerns: A Review. Toxins 2022, 14, 167. [Google Scholar] [CrossRef] [PubMed]
- Wang, T.; Cui, R.; Yu, H.-F.; Yang, D.; Zhang, S.; Nie, Y.; Teng, C.-B. The impact of aflatoxin B1 on animal health: Metabolic processes, detection methods, and preventive measures. Toxicon 2025, 255, 108262. [Google Scholar] [CrossRef]
- Liu, W.-C.; Pushparaj, K.; Meyyazhagan, A.; Arumugam, V.A.; Pappuswamy, M.; Bhotla, H.K.; Baskaran, R.; Issara, U.; Balasubramanian, B.; Mousavi Khaneghah, A. Ochratoxin A as an alarming health threat for livestock and human: A review on molecular interactions, mechanism of toxicity, detection, detoxification, and dietary prophylaxis. Toxicon 2022, 213, 59–75. [Google Scholar] [CrossRef]
- Winkler, J.; Kersten, S.; Meyer, U.; Engelhardt, U.; Dänicke, S. Residues of zearalenone (ZEN), deoxynivalenol (DON) and their metabolites in plasma of dairy cows fed Fusarium contaminated maize and their relationships to performance parameters. Food Chem. Toxicol. 2014, 65, 196–204. [Google Scholar] [CrossRef]
- Qu, L.-L.; Jia, Q.; Liu, C.; Wang, W.; Duan, L.; Yang, G.; Han, C.-Q.; Li, H. Thin layer chromatography combined with surface-enhanced raman spectroscopy for rapid sensing aflatoxins. J. Chromatogr. A 2018, 1579, 115–120. [Google Scholar] [CrossRef]
- Pradhan, S.; Ananthanarayan, L. Standardization and validation of a high-performance thin-layer chromatography method for the quantification of aflatoxin B1 and its application in surveillance of contamination level in marketed food commodities from the Mumbai region. JPC–J. Planar Chromatogr.–Mod. TLC 2021, 33, 617–630. [Google Scholar] [CrossRef]
- Zhang, B.; Liu, W.; Liu, Z.; Fu, X.; Du, D. High-performance liquid chromatography for the sensitive zearalenone determination by the automated immunomagnetic beads purifier for one-step sample pre-treatment. Eur. Food Res. Technol. 2021, 248, 109–117. [Google Scholar] [CrossRef]
- Mao, J.; Zheng, N.; Wen, F.; Guo, L.; Fu, C.; Ouyang, H.; Zhong, L.; Wang, J.; Lei, S. Multi-mycotoxins analysis in raw milk by ultra high performance liquid chromatography coupled to quadrupole orbitrap mass spectrometry. Food Control 2018, 84, 305–311. [Google Scholar] [CrossRef]
- Zhang, Y.; Li, M.; Cui, Y.; Hong, X.; Du, D. Using of Tyramine Signal Amplification to Improve the Sensitivity of ELISA for Aflatoxin B1 in Edible Oil Samples. Food Anal. Methods 2018, 11, 2553–2560. [Google Scholar] [CrossRef]
- Jayasena, S.; Koppelman, S.J.; Taylor, S.L.; Baumert, J.L. Development of a sensitive and Ara h 2 specific competitive ELISA for the quantification of Peanut. Food Control 2025, 177, 111435. [Google Scholar] [CrossRef]
- Feng, R.; Yu, Q.; Bao, Y.; Chen, L.; Luo, Y.; Tan, Y.; Hong, H. Myofibrillar protein lipoxidation in fish induced by linoleic acid and 4-hydroxy-2-nonenal: Insights from LC-MS/MS analysis. Food Res. Int. 2024, 187, 114357. [Google Scholar] [CrossRef]
- Ma, S.; Wang, M.; You, T.; Wang, K. Using Magnetic Multiwalled Carbon Nanotubes as Modified QuEChERS Adsorbent for Simultaneous Determination of Multiple Mycotoxins in Grains by UPLC-MS/MS. J. Agric. Food Chem. 2019, 67, 8035–8044. [Google Scholar] [CrossRef]
- Ma, S.; Pan, L.g.; You, T.; Wang, K. g-C3N4/Fe3O4 Nanocomposites as Adsorbents Analyzed by UPLC-MS/MS for Highly Sensitive Simultaneous Determination of 27 Mycotoxins in Maize: Aiming at Increasing Purification Efficiency and Reducing Time. J. Agric. Food Chem. 2021, 69, 4874–4882. [Google Scholar] [CrossRef]
- Zhai, W.; You, T.; Ouyang, X.; Wang, M. Recent progress in mycotoxins detection based on surface-enhanced Raman spectroscopy. Compr. Rev. Food Sci. Food Saf. 2021, 20, 1887–1909. [Google Scholar] [CrossRef] [PubMed]
- Maphaisa, T.C.; Akinmoladun, O.F.; Adelusi, O.A.; Mwanza, M.; Fon, F.; Tangni, E.; Njobeh, P.B. Advances in mycotoxin detection techniques and the crucial role of reference material in ensuring food safety. A review. Food Chem. Toxicol. 2025, 200, 115387. [Google Scholar] [CrossRef] [PubMed]
- Kushwaha, S.; Soni, H.; Tandon, S.; Singh, G.; Gandhi, Y.; Kumar, V.; Jagtap, C.; Narasimhaji, C.V.; Mathapati, S.; Srikanth, N.; et al. Fungal toxin (mycotoxin): Introduction, sources and types, production, detection, and applications. Food Nutr. 2025, 1, 100005. [Google Scholar] [CrossRef]
- Tahir, H.E.; Xiaobo, Z.; Jianbo, X.; Mahunu, G.K.; Jiyong, S.; Xu, J.-L.; Sun, D.-W. Recent Progress in Rapid Analyses of Vitamins, Phenolic, and Volatile Compounds in Foods Using Vibrational Spectroscopy Combined with Chemometrics: A Review. Food Anal. Methods 2019, 12, 2361–2382. [Google Scholar] [CrossRef]
- Ouyang, Q.; Fan, Z.; Chang, H.; Shoaib, M.; Chen, Q. Analyzing TVB-N in snakehead by Bayesian-optimized 1D-CNN using molecular vibrational spectroscopic techniques: Near-infrared and Raman spectroscopy. Food Chem. 2025, 464, 141701. [Google Scholar] [CrossRef]
- Yu, T.; Yao, S.; Zhang, Z.; Victorio Ramos, A.F.; Rodriguez-Saona, L.; Wang, J. Sources, advances, and future prospects of screening food contaminants in plant-based foods by vibrational spectroscopy combined with machine learning. Trends Food Sci. Technol. 2025, 160, 105017. [Google Scholar] [CrossRef]
- Zareef, M.; Arslan, M.; Mehedi Hassan, M.; Ali, S.; Ouyang, Q.; Li, H.; Wu, X.; Muhammad Hashim, M.; Javaria, S.; Chen, Q. Application of benchtop NIR spectroscopy coupled with multivariate analysis for rapid prediction of antioxidant properties of walnut (Juglans regia). Food Chem. 2021, 359, 129928. [Google Scholar] [CrossRef]
- Pandiselvam, R.; Sruthi, N.U.; Kumar, A.; Kothakota, A.; Thirumdas, R.; Ramesh, S.V.; Cozzolino, D. Recent Applications of Vibrational Spectroscopic Techniques in the Grain Industry. Food Rev. Int. 2021, 39, 209–239. [Google Scholar] [CrossRef]
- Mishra, G.; Srivastava, S.; Panda, B.K.; Mishra, H.N. Rapid Assessment of Quality Change and Insect Infestation in Stored Wheat Grain Using FT-NIR Spectroscopy and Chemometrics. Food Anal. Methods 2017, 11, 1189–1198. [Google Scholar] [CrossRef]
- Lin, H.; Jiang, H.; Lin, J.; Chen, Q.; Ali, S.; Teng, S.W.; Zuo, M. Rice Freshness Identification Based on Visible Near-Infrared Spectroscopy and Colorimetric Sensor Array. Food Anal. Methods 2021, 14, 1305–1314. [Google Scholar] [CrossRef]
- Ouyang, Q.; Liu, L.; Zareef, M.; Wang, L.; Chen, Q. Application of portable visible and near-infrared spectroscopy for rapid detection of cooking loss rate in pork: Comparing spectra from frozen and thawed pork. LWT 2022, 160, 113304. [Google Scholar] [CrossRef]
- Chen, S.; Liang, J.; Huang, M.; Wang, B.; Xu, X.; Xu, J. Rapid and non-destructive prediction of pear firmness based on visible-near-infrared spectroscopy with a new method of spectra generating and wavelength selecting. Infrared Phys. Technol. 2025, 149, 105903. [Google Scholar] [CrossRef]
- Wang, C.; Luo, X.; Guo, Z.; Wang, A.; Zhou, R.; Cai, J. Influence of the peel on online detecting soluble solids content of pomelo using Vis-NIR spectroscopy coupled with chemometric analysis. Food Control 2025, 167, 110777. [Google Scholar] [CrossRef]
- Wu, J.; Zareef, M.; Chen, Q.; Ouyang, Q. Application of visible-near infrared spectroscopy in tandem with multivariate analysis for the rapid evaluation of matcha physicochemical indicators. Food Chem. 2023, 421, 136185. [Google Scholar] [CrossRef]
- Liu, X.; Tian, X.; Hu, D.; Yuan, X.; Ma, X.; Xiang, P.; Liao, S. Utilizing full transmittance Vis/NIR spectroscopy for online detection of soluble solids and anthocyanin content in blood oranges. J. Food Compos. Anal. 2025, 145, 107865. [Google Scholar] [CrossRef]
- Teixido-Orries, I.; Yang, L.; Molino, F.; Medina, A.; Marín, S.; Verheecke-Vaessen, C. Detection of Fusarium spp. and T-2 and HT-2 toxins contamination in oats using visible and near-infrared spectroscopy. Int. J. Food Microbiol. 2025, 441, 111301. [Google Scholar] [CrossRef]
- Shen, F.; Huang, Y.; Jiang, X.; Fang, Y.; Li, P.; Liu, Q.; Hu, Q.; Liu, X. On-line prediction of hazardous fungal contamination in stored maize by integrating Vis/NIR spectroscopy and computer vision. Spectrochim. Acta Part A Mol. Biomol. Spectrosc. 2020, 229, 118012. [Google Scholar] [CrossRef]
- He, X.; Zhao, T.; Shen, F.; Liu, Q.; Fang, Y.; Hu, Q. Online detection of naturally DON contaminated wheat grains from China using Vis-NIR spectroscopy and computer vision. Biosyst. Eng. 2021, 201, 1–10. [Google Scholar] [CrossRef]
- Tingting, S.; Xiaobo, Z.; Jiyong, S.; Zhihua, L.; Xiaowei, H.; Yiwei, X.; Wu, C. Determination Geographical Origin and Flavonoids Content of Goji Berry Using Near-Infrared Spectroscopy and Chemometrics. Food Anal. Methods 2015, 9, 68–79. [Google Scholar] [CrossRef]
- Yahui, L.; Xiaobo, Z.; Tingting, S.; Jiyong, S.; Jiewen, Z.; Holmes, M. Determination of Geographical Origin and Anthocyanin Content of Black Goji Berry (Lycium ruthenicum Murr.) Using Near-Infrared Spectroscopy and Chemometrics. Food Anal. Methods 2016, 10, 1034–1044. [Google Scholar] [CrossRef]
- Arslan, M.; Xiaobo, Z.; Tahir, H.E.; Xuetao, H.; Rakha, A.; Basheer, S.; Hao, Z. Near-infrared spectroscopy coupled chemometric algorithms for prediction of antioxidant activity of black goji berries (Lycium ruthenicum Murr.). J. Food Meas. Charact. 2018, 12, 2366–2376. [Google Scholar] [CrossRef]
- Guo, Z.; Huang, W.; Peng, Y.; Chen, Q.; Ouyang, Q.; Zhao, J. Color compensation and comparison of shortwave near infrared and long wave near infrared spectroscopy for determination of soluble solids content of ‘Fuji’ apple. Postharvest Biol. Technol. 2016, 115, 81–90. [Google Scholar] [CrossRef]
- Fan, S.; Pan, T.; Li, G. Evaluation of the physicochemical content and solid-state fermentation stage of Zhenjiang aromatic vinegar using near-infrared spectroscopy. Int. J. Food Eng. 2020, 16, 20200127. [Google Scholar] [CrossRef]
- Zareef, M.; Chen, Q.; Hassan, M.M.; Arslan, M.; Hashim, M.M.; Ahmad, W.; Kutsanedzie, F.Y.H.; Agyekum, A.A. An Overview on the Applications of Typical Non-linear Algorithms Coupled With NIR Spectroscopy in Food Analysis. Food Eng. Rev. 2020, 12, 173–190. [Google Scholar] [CrossRef]
- Zhang, H.; Jiang, H.; Liu, G.; Mei, C.; Huang, Y. Identification of Radix puerariae starch from different geographical origins by FT-NIR spectroscopy. Int. J. Food Prop. 2017, 20, 1567–1577. [Google Scholar] [CrossRef]
- Chen, Q.; Chen, M.; Liu, Y.; Wu, J.; Wang, X.; Ouyang, Q.; Chen, X. Application of FT-NIR spectroscopy for simultaneous estimation of taste quality and taste-related compounds content of black tea. J. Food Sci. Technol. 2018, 55, 4363–4368. [Google Scholar] [CrossRef] [PubMed]
- Agyekum, A.A.; Kutsanedzie, F.Y.H.; Mintah, B.K.; Annavaram, V.; Zareef, M.; Hassan, M.M.; Arslan, M.; Chen, Q. Rapid and Nondestructive Quantification of Trimethylamine by FT-NIR Coupled with Chemometric Techniques. Food Anal. Methods 2019, 12, 2035–2044. [Google Scholar] [CrossRef]
- Hu, X.; Shi, J.; Zhang, F.; Zou, X.; Holmes, M.; Zhang, W.; Huang, X.; Cui, X.; Xue, J. Determination of Retrogradation Degree in Starch by Mid-infrared and Raman Spectroscopy during Storage. Food Anal. Methods 2017, 10, 3694–3705. [Google Scholar] [CrossRef]
- Shen, Y.; Wu, X.; Wu, B.; Tan, Y.; Liu, J. Qualitative Analysis of Lambda-Cyhalothrin on Chinese Cabbage Using Mid-Infrared Spectroscopy Combined with Fuzzy Feature Extraction Algorithms. Agriculture 2021, 11, 275. [Google Scholar] [CrossRef]
- Wu, X.; Zhang, T.; Wu, B.; Zhou, H. Identification of lambda-cyhalothrin residues on Chinese cabbage using fuzzy uncorrelated discriminant vector analysis and MIR spectroscopy. Int. J. Agric. Biol. Eng. 2022, 15, 217–224. [Google Scholar] [CrossRef]
- Candeias, D.N.C.; Silva, K.M.; Pereira, H.S.; Bezerra, L.P.; da Silva, J.D.S.; Fernandes, D.D.d.S.; Diniz, P.H.G.D. Geographical origin authentication of instant coffee from southern Bahia using MIR and NIR spectroscopy coupled with DD-SIMCA. Food Chem. 2025, 479, 143698. [Google Scholar] [CrossRef]
- Carbas, B.; Machado, N.; Oppolzer, D.; Ferreira, L.; Brites, C.; Rosa, E.A.S.; Barros, A.I.R.N.A. Comparison of near-infrared (NIR) and mid-infrared (MIR) spectroscopy for the determination of nutritional and antinutritional parameters in common beans. Food Chem. 2020, 306, 125509. [Google Scholar] [CrossRef] [PubMed]
- Amirvaresi, A.; Nikounezhad, N.; Amirahmadi, M.; Daraei, B.; Parastar, H. Comparison of near-infrared (NIR) and mid-infrared (MIR) spectroscopy based on chemometrics for saffron authentication and adulteration detection. Food Chem. 2021, 344, 128647. [Google Scholar] [CrossRef] [PubMed]
- Zhao, B.; Zhang, H.; Liu, X.; Dong, Q.; Zang, H. Study of glycated human serum albumin in non-enzymatic glycation process based on MIR/NIR spectroscopy. J. Mol. Struct. 2025, 1335, 141928. [Google Scholar] [CrossRef]
- Tang, L.J.; Li, X.K.; Huang, Y.; Zhang, X.-Z.; Li, B.Q. A novel importance scores based variable selection approach and validation using a MIR and NIR dataset. Spectrochim. Acta Part A Mol. Biomol. Spectrosc. 2025, 330, 125701. [Google Scholar] [CrossRef]
- Zade, S.V.; Sahebi, H.; Alizadeh, A.M.; Jannat, B.; Rastegar, H.; Abedinzadeh, S.; Hashempour-Baltork, F.; Mousavi Khaneghah, A. Optimizing DD-SIMCA modeling for accurate classification of rice varieties via raman spectroscopy. Appl. Food Res. 2025, 5, 100909. [Google Scholar] [CrossRef]
- Singh, D.; Sharma, R.; Shivanna, S.K.; Gandhi, K.; Singh, R.; Sharda, T. Detection of adulteration in ghee using Raman spectroscopy in combination with chemometrics. Food Control 2025, 178, 111481. [Google Scholar] [CrossRef]
- Zhang, F.; Liu, Z.; Wu, Y. Raman spectroscopy combined with a novel explainable MSDCNN networks for avocado oil adulteration detection. J. Food Compos. Anal. 2025, 146, 107915. [Google Scholar] [CrossRef]
- Wang, J.; Chen, Q.; Belwal, T.; Lin, X.; Luo, Z. Insights into chemometric algorithms for quality attributes and hazards detection in foodstuffs using Raman/surface enhanced Raman spectroscopy. Compr. Rev. Food Sci. Food Saf. 2021, 20, 2476–2507. [Google Scholar] [CrossRef]
- Zhu, J.; Agyekum, A.A.; Kutsanedzie, F.Y.H.; Li, H.; Chen, Q.; Ouyang, Q.; Jiang, H. Qualitative and quantitative analysis of chlorpyrifos residues in tea by surface-enhanced Raman spectroscopy (SERS) combined with chemometric models. LWT 2018, 97, 760–769. [Google Scholar] [CrossRef]
- Lu, X.; Sun, J.; Mao, H.; Wu, X.; Gao, H. Quantitative determination of rice starch based on hyperspectral imaging technology. Int. J. Food Prop. 2017, 20, S1037–S1044. [Google Scholar] [CrossRef]
- Zhou, X.; Sun, J.; Mao, H.; Wu, X.; Zhang, X.; Yang, N. Visualization research of moisture content in leaf lettuce leaves based on WT-PLSR and hyperspectral imaging technology. J. Food Process Eng. 2017, 41, e12647. [Google Scholar] [CrossRef]
- Zhu, Y.; Zou, X.; Shen, T.; Shi, J.; Zhao, J.; Holmes, M.; Li, G. Determination of total acid content and moisture content during solid-state fermentation processes using hyperspectral imaging. J. Food Eng. 2016, 174, 75–84. [Google Scholar] [CrossRef]
- Zhu, Y.; Fan, S.; Zuo, M.; Zhang, B.; Zhu, Q.; Kong, J. Discrimination of New and Aged Seeds Based on On-Line Near-Infrared Spectroscopy Technology Combined with Machine Learning. Foods 2024, 13, 1570. [Google Scholar] [CrossRef]
- Huang, Y.; Pan, Y.; Liu, C.; Zhou, L.; Tang, L.; Wei, H.; Fan, K.; Wang, A.; Tang, Y. Rapid and Non-Destructive Geographical Origin Identification of Chuanxiong Slices Using Near-Infrared Spectroscopy and Convolutional Neural Networks. Agriculture 2024, 14, 1281. [Google Scholar] [CrossRef]
- Tian, H.; Zhang, L.; Li, M.; Wang, Y.; Sheng, D.; Liu, J.; Wang, C. Weighted SPXY method for calibration set selection for composition analysis based on near-infrared spectroscopy. Infrared Phys. Technol. 2018, 95, 88–92. [Google Scholar] [CrossRef]
- Solout, M.V.; Zade, S.V.; Abdollahi, H.; Ghasemi, J.B. Enhanced data point importance for subset selection in partial least squares regression: A comparative study with Kennard-Stone method. Chemom. Intell. Lab. Syst. 2025, 263, 105416. [Google Scholar] [CrossRef]
- Wang, T.; Zhang, Y.; Li, F.; Cao, N. Preprocessing and regression approaches alter the spectral estimation accuracy of plant phosphorus content—A three-level meta-analysis. Comput. Electron. Agric. 2025, 234, 110205. [Google Scholar] [CrossRef]
- Khodabakhshian, R.; Seyedalibeyk Lavasani, H.; Weller, P. A methodological approach to preprocessing FTIR spectra of adulterated sesame oil. Food Chem. 2023, 419, 136055. [Google Scholar] [CrossRef]
- Sun, J.; Yang, W.; Zhang, M.; Feng, M.; Xiao, L.; Ding, G. Estimation of water content in corn leaves using hyperspectral data based on fractional order Savitzky-Golay derivation coupled with wavelength selection. Comput. Electron. Agric. 2021, 182, 105989. [Google Scholar] [CrossRef]
- Li, Y.; Pan, T.; Li, H.; Chen, S. Non-invasive quality analysis of thawed tuna using near infrared spectroscopy with baseline correction. J. Food Process Eng. 2020, 43, e13445. [Google Scholar] [CrossRef]
- Xu, F.; Huang, X.; Tian, X.; Yu, S.; Zhang, X.; Zareef, M. Application of hyperspectral imaging and colorimetric sensor array coupled with multivariate analysis for quality detection during salted duck eggs processing. J. Food Process Eng. 2024, 47, e14589. [Google Scholar] [CrossRef]
- Shuanhui, W.; Chang, C.; Jing, T.; Zhi, L.; Xianxian, M.; Jialu, Z.; Dongguang, W.; Shaohua, Z. Geographical origin traceability of kiwifruit products using stable isotope and multi-element analysis with multivariate modeling: Feature extraction, selection of model and variable, and discrimination. Food Chem. X 2025, 26, 102231. [Google Scholar] [CrossRef]
- Luo, N.; Yang, X.; Sun, C.; Xing, B.; Han, J.; Zhao, C. Visualization of vibrational spectroscopy for agro-food samples using t-Distributed Stochastic Neighbor Embedding. Food Control 2021, 126, 107812. [Google Scholar] [CrossRef]
- Tong, Z.; Zhang, S.; Yu, J.; Zhang, X.; Wang, B.; Zheng, W. A Hybrid Prediction Model for CatBoost Tomato Transpiration Rate Based on Feature Extraction. Agronomy 2023, 13, 2371. [Google Scholar] [CrossRef]
- Vallese, F.D.; Paoloni, S.G.; Springer, V.; Fernandes, D.D.d.S.; Diniz, P.H.G.D.; Pistonesi, M.F. Exploiting the successive projections algorithm to improve the quantification of chemical constituents and discrimination of botanical origin of Argentinean bee-pollen. J. Food Compos. Anal. 2024, 126, 105925. [Google Scholar] [CrossRef]
- Xing, Z.; Du, C.; Shen, Y.; Ma, F.; Zhou, J. A method combining FTIR-ATR and Raman spectroscopy to determine soil organic matter: Improvement of prediction accuracy using competitive adaptive reweighted sampling (CARS). Comput. Electron. Agric. 2021, 191, 106549. [Google Scholar] [CrossRef]
- Wang, Z.; Chen, J.; Zhang, J.; Tan, X.; Ali Raza, M.; Ma, J.; Zhu, Y.; Yang, F.; Yang, W. Assessing canopy nitrogen and carbon content in maize by canopy spectral reflectance and uninformative variable elimination. Crop J. 2022, 10, 1224–1238. [Google Scholar] [CrossRef]
- Li, W.; Shi, Y.; Huang, X.; Li, Z.; Zhang, X.; Zou, X.; Hu, X.; Shi, J. Study on the Diffusion and Optimization of Sucrose in Gaido Seak Based on Finite Element Analysis and Hyperspectral Imaging Technology. Foods 2024, 13, 249. [Google Scholar] [CrossRef]
- Yao, K.; Sun, J.; Tang, N.; Xu, M.; Cao, Y.; Fu, L.; Zhou, X.; Wu, X. Nondestructive detection for Panax notoginseng powder grades based on hyperspectral imaging technology combined with CARS-PCA and MPA-LSSVM. J. Food Process Eng. 2021, 44, e13718. [Google Scholar] [CrossRef]
- He, H.-J.; Zhang, C.; Bian, X.; An, J.; Wang, Y.; Ou, X.; Kamruzzaman, M. Improved prediction of vitamin C and reducing sugar content in sweetpotatoes using hyperspectral imaging and LARS-enhanced LASSO variable selection. J. Food Compos. Anal. 2024, 132, 106350. [Google Scholar] [CrossRef]
- Kutsanedzie, F.Y.H.; Chen, Q.; Hassan, M.M.; Yang, M.; Sun, H.; Rahman, M.H. Near infrared system coupled chemometric algorithms for enumeration of total fungi count in cocoa beans neat solution. Food Chem. 2018, 240, 231–238. [Google Scholar] [CrossRef] [PubMed]
- Gangadevi, E.; Rani, R.S.; Dhanaraj, R.K.; Nayyar, A. Spot-out fruit fly algorithm with simulated annealing optimized SVM for detecting tomato plant diseases. Neural Comput. Appl. 2023, 36, 4349–4375. [Google Scholar] [CrossRef]
- Hornung, R.; Boulesteix, A.-L. Interaction forests: Identifying and exploiting interpretable quantitative and qualitative interaction effects. Comput. Stat. Data Anal. 2022, 171, 107460. [Google Scholar] [CrossRef]
- Ji, F.; Li, F.; Hao, D.; Shiklomanov, A.N.; Yang, X.; Townsend, P.A.; Dashti, H.; Nakaji, T.; Kovach, K.R.; Liu, H.; et al. Unveiling the transferability of PLSR models for leaf trait estimation: Lessons from a comprehensive analysis with a novel global dataset. New Phytol. 2024, 243, 111–131. [Google Scholar] [CrossRef]
- Guo, Z.; Wang, M.; Agyekum, A.A.; Wu, J.; Chen, Q.; Zuo, M.; El-Seedi, H.R.; Tao, F.; Shi, J.; Ouyang, Q.; et al. Quantitative detection of apple watercore and soluble solids content by near infrared transmittance spectroscopy. J. Food Eng. 2020, 279, 109955. [Google Scholar] [CrossRef]
- Almoujahed, M.B.; Rangarajan, A.K.; Whetton, R.L.; Vincke, D.; Eylenbosch, D.; Vermeulen, P.; Mouazen, A.M. Non-destructive detection of fusarium head blight in wheat kernels and flour using visible near-infrared and mid-infrared spectroscopy. Chemom. Intell. Lab. Syst. 2024, 245, 105050. [Google Scholar] [CrossRef]
- Shen, F.; Zhao, T.; Jiang, X.; Liu, X.; Fang, Y.; Liu, Q.; Hu, Q.; Liu, X. On-line detection of toxigenic fungal infection in wheat by visible/near infrared spectroscopy. LWT 2019, 109, 216–224. [Google Scholar] [CrossRef]
- Tao, F.; Yao, H.; Hruska, Z.; Liu, Y.; Rajasekaran, K.; Bhatnagar, D. Use of Visible–Near-Infrared (Vis-NIR) Spectroscopy to Detect Aflatoxin B1 on Peanut Kernels. Appl. Spectrosc. 2019, 73, 415–423. [Google Scholar] [CrossRef]
- Appaw, W.; Zaukuu, J.-L.Z.; Aouadi, B.; Mensah, E.T.; Oduro, I.N.; Kovacs, Z. Predicting aflatoxin contamination in white and yellow maize using Vis/NIR spectroscopy combined with PCA-LDA and PLSR models through aquaphotomics approaches. Appl. Food Res. 2025, 5, 100841. [Google Scholar] [CrossRef]
- Almoujahed, M.B.; Apolo-Apolo, O.E.; Alhussein, M.; Kazlauskas, M.; Kriaučiūnienė, Z.; Šarauskis, E.; Mouazen, A.M. Prediction of Deoxynivalenol contamination in wheat kernels and flour based on visible near-infrared spectroscopy, feature selection and machine learning modelling. Spectrochim. Acta Part A Mol. Biomol. Spectrosc. 2025, 330, 125718. [Google Scholar] [CrossRef]
- Huang, Y.; Liu, H.; Lu, X.; Yao, L.; Chen, J.; Pan, T. Vis-NIR spectroscopic discriminant analysis of aflatoxin B1 excessive standard in peanut meal as feedstuff materials. Spectrochim. Acta Part A Mol. Biomol. Spectrosc. 2024, 317, 124394. [Google Scholar] [CrossRef] [PubMed]
- Ong, P.; Tung, I.C.; Chiu, C.-F.; Tsai, I.L.; Shih, H.-C.; Chen, S.; Chuang, Y.-K. Determination of aflatoxin B1 level in rice (Oryza sativa L.) through near-infrared spectroscopy and an improved simulated annealing variable selection method. Food Control 2022, 136, 108886. [Google Scholar] [CrossRef]
- Zheng, S.-Y.; Wei, Z.-S.; Li, S.; Zhang, S.-J.; Xie, C.-F.; Yao, D.-S.; Liu, D.-L. Near-infrared reflectance spectroscopy-based fast versicolorin A detection in maize for early aflatoxin warning and safety sorting. Food Chem. 2020, 332, 127419. [Google Scholar] [CrossRef] [PubMed]
- Jiang, H.; Wang, J.; Chen, Q. Comparison of wavelength selected methods for improving of prediction performance of PLS model to determine aflatoxin B1 (AFB1) in wheat samples during storage. Microchem. J. 2021, 170, 106642. [Google Scholar] [CrossRef]
- Ning, H.; Wang, J.; Jiang, H.; Chen, Q. Quantitative detection of zearalenone in wheat grains based on near-infrared spectroscopy. Spectrochim. Acta Part A Mol. Biomol. Spectrosc. 2022, 280, 121545. [Google Scholar] [CrossRef]
- Li, J.; Deng, J.; Bai, X.; da Graca Nseledge Monteiro, D.; Jiang, H. Quantitative analysis of aflatoxin B(1) of peanut by optimized support vector machine models based on near-infrared spectral features. Spectrochim. Acta Part A Mol. Biomol. Spectrosc. 2023, 303, 123208. [Google Scholar] [CrossRef]
- Deng, J.; Jiang, H.; Chen, Q. Characteristic wavelengths optimization improved the predictive performance of near-infrared spectroscopy models for determination of aflatoxin B1 in maize. J. Cereal Sci. 2022, 105, 103474. [Google Scholar] [CrossRef]
- Zhao, Y.; Zhu, C.; Jiang, H. Quantitative detection of zearalenone in wheat using intervals selection coupled to near-infrared spectroscopy. Infrared Phys. Technol. 2024, 136, 105004. [Google Scholar] [CrossRef]
- Liu, T.; He, J.; Yao, W.; Jiang, H.; Chen, Q. Determination of aflatoxin B1 value in corn based on Fourier transform near-infrared spectroscopy: Comparison of optimization effect of characteristic wavelengths. LWT 2022, 164, 113657. [Google Scholar] [CrossRef]
- Bailly, S.; Orlando, B.; Brustel, J.; Bailly, J.-D.; Levasseur-Garcia, C. Rapid Detection of Aflatoxins in Ground Maize Using Near Infrared Spectroscopy. Toxins 2024, 16, 385. [Google Scholar] [CrossRef] [PubMed]
- Acuña-Gutiérrez, C.; Schock, S.; Jiménez, V.M.; Müller, J. Detecting fumonisin B1 in black beans (Phaseolus vulgaris L.) by near-infrared spectroscopy (NIRS). Food Control 2021, 130, 108335. [Google Scholar] [CrossRef]
- Yao, W.; Liu, R.; Zhang, F.; Li, S.; Huang, X.; Guo, H.; Peng, M.; Zhong, G. Detecting Aflatoxin B(1) in Peanuts by Fourier Transform Near-Infrared Transmission and Diffuse Reflection Spectroscopy. Molecules 2022, 27, 6294. [Google Scholar] [CrossRef] [PubMed]
- Jiang, H.; Deng, J.; Zhu, C. Quantitative analysis of aflatoxin B1 in moldy peanuts based on near-infrared spectra with two-dimensional convolutional neural network. Infrared Phys. Technol. 2023, 131, 104672. [Google Scholar] [CrossRef]
- Putthang, R.; Sirisomboon, P.; Sirisomboon, C.D. Shortwave Near-Infrared Spectroscopy for Rapid Detection of Aflatoxin B1 Contamination in Polished Rice. J. Food Prot. 2019, 82, 796–803. [Google Scholar] [CrossRef]
- Carbas, B.; Sampaio, P.; Barros, S.C.; Freitas, A.; Silva, A.S.; Brites, C. Rapid screening of fumonisins in maize using near-infrared spectroscopy (NIRS) and machine learning algorithms. Food Chem. X 2025, 27, 102351. [Google Scholar] [CrossRef]
- Caramês, E.T.d.S.; Piacentini, K.C.; Aparecida Almeida, N.; Lopes Pereira, V.; Azevedo Lima Pallone, J.; de Oliveira Rocha, L. Rapid assessment of enniatins in barley grains using near infrared spectroscopy and chemometric tools. Food Res. Int. 2022, 161, 111759. [Google Scholar] [CrossRef]
- Zhang, S.; Li, Z.; An, J.; Yang, Y.; Tang, X. Identification of aflatoxin B1 in peanut using near-infrared spectroscopy combined with naive Bayes classifier. Spectrosc. Lett. 2021, 54, 340–351. [Google Scholar] [CrossRef]
- Shen, G.; Kang, X.; Su, J.; Qiu, J.; Liu, X.; Xu, J.; Shi, J.; Mohamed, S.R. Rapid detection of fumonisin B1 and B2 in ground corn samples using smartphone-controlled portable near-infrared spectrometry and chemometrics. Food Chem. 2022, 384, 132487. [Google Scholar] [CrossRef]
- Wang, B.; Deng, J.; Jiang, H. Markov Transition Field Combined with Convolutional Neural Network Improved the Predictive Performance of Near-Infrared Spectroscopy Models for Determination of Aflatoxin B(1) in Maize. Foods 2022, 11, 2210. [Google Scholar] [CrossRef]
- Freitag, S.; Anlanger, M.; Fomina, P.; Femenias, A.; Aledda, M.; Mizaikoff, B.; Kohler, A.; Sulyok, M.; Krska, R. Attenuated total reflection mid-infrared spectroscopy to screen Austrian and French wheat from multiple years for deoxynivalenol. Spectrochim. Acta Part A Mol. Biomol. Spectrosc. 2025, 340, 126340. [Google Scholar] [CrossRef]
- De Girolamo, A.; von Holst, C.; Cortese, M.; Cervellieri, S.; Pascale, M.; Longobardi, F.; Catucci, L.; Porricelli, A.C.R.; Lippolis, V. Rapid screening of ochratoxin A in wheat by infrared spectroscopy. Food Chem. 2019, 282, 95–100. [Google Scholar] [CrossRef]
- Yao, S.; Fountain, J.; Miyagusuku-Cruzado, G.; West, M.; Nwosu, V.; Dowd, E.; Giusti, M.M.; Rodriguez-Saona, L.E. Portable mid-infrared spectroscopy combined with chemometrics to detect toxic metabolites, aflatoxins in Aspergillus-infected peanuts. LWT 2025, 215, 117186. [Google Scholar] [CrossRef]
- Deng, J.; Jiang, H.; Chen, Q. Determination of aflatoxin B(1) (AFB(1)) in maize based on a portable Raman spectroscopy system and multivariate analysis. Spectrochim. Acta Part A Mol. Biomol. Spectrosc. 2022, 275, 121148. [Google Scholar] [CrossRef] [PubMed]
- Xue, Y.; Ning, H.; Jiang, H. Determination of zearalenone content in wheat by modified one-dimensional convolutional neural network-based Raman spectra. Sens. Actuators A Phys. 2024, 370, 115221. [Google Scholar] [CrossRef]
- Mei, C.; Wang, Z.; Jiang, H. Determination of aflatoxin B1 in wheat using Raman spectroscopy combined with chemometrics. Spectrochim. Acta Part A Mol. Biomol. Spectrosc. 2025, 327, 125384. [Google Scholar] [CrossRef] [PubMed]
- Jiang, H.; Zhao, Y.; Li, J.; Zhao, M.; Deng, J.; Bai, X. Quantitative detection of aflatoxin B1 in peanuts using Raman spectra and multivariate analysis methods. Spectrochim. Acta Part A Mol. Biomol. Spectrosc. 2024, 316, 124322. [Google Scholar] [CrossRef]
- Guo, Z.; Wang, M.; Wu, J.; Tao, F.; Chen, Q.; Wang, Q.; Ouyang, Q.; Shi, J.; Zou, X. Quantitative assessment of zearalenone in maize using multivariate algorithms coupled to Raman spectroscopy. Food Chem. 2019, 286, 282–288. [Google Scholar] [CrossRef]
- Yao, S.; Miyagusuku-Cruzado, G.; West, M.; Nwosu, V.; Dowd, E.; Fountain, J.; Giusti, M.M.; Rodriguez-Saona, L.E. Nondestructive and Rapid Screening of Aflatoxin-Contaminated Single Peanut Kernels Using Field-Portable Spectroscopy Instruments (FT-IR and Raman). Foods 2024, 13, 157. [Google Scholar] [CrossRef]
- Yin, L.; You, T.; Arslan, M.; El-Seedi, H.R.; Guo, Z.; Zou, X.; Cai, J. Dual-layers Raman reporter-tagged Au@Ag combined with core-satellite assemblies for SERS detection of Zearalenone. Food Chem. 2023, 429, 136834. [Google Scholar] [CrossRef]
- Guo, Z.; Gao, L.; Yin, L.; Arslan, M.; El-Seedi, H.R.; Zou, X. Novel mesoporous silica surface loaded gold nanocomposites SERS aptasensor for sensitive detection of zearalenone. Food Chem. 2023, 403, 134384. [Google Scholar] [CrossRef]
- Gao, X.; Liu, Y.; Wei, J.; Wang, Z.; Ma, X. A facile dual-mode SERS/fluorescence aptasensor for AFB1 detection based on gold nanoparticles and magnetic nanoparticles. Spectrochim. Acta Part A Mol. Biomol. Spectrosc. 2024, 315, 124268. [Google Scholar] [CrossRef]
- Yin, L.; You, T.; El-Seedi, H.R.; El-Garawani, I.M.; Guo, Z.; Zou, X.; Cai, J. Rapid and sensitive detection of zearalenone in corn using SERS-based lateral flow immunosensor. Food Chem. 2022, 396, 133707. [Google Scholar] [CrossRef]
- Chen, R.; Li, S.; Sun, Y.; Huo, B.; Xia, Y.; Qin, Y.; Li, S.; Shi, B.; He, D.; Liang, J.; et al. Surface-enhanced Raman spectroscopy aptasensor for simultaneous determination of ochratoxin A and zearalenone using Au@Ag core-shell nanoparticles and gold nanorods. Microchim. Acta 2021, 188, 281. [Google Scholar] [CrossRef] [PubMed]
- Jiao, T.; Dong, C.; Zhu, A.; Ahmad, W.; Peng, L.; Wu, X.; Chen, Q.; Wei, J.; Chen, X.; Qin, O.; et al. AFB1-responsive mesoporous silica nanoparticles for AFB1 quantification based on aptamer-regulated release of SERS reporter. Food Chem. 2025, 463, 141417. [Google Scholar] [CrossRef] [PubMed]
- Han, C.; Zhai, W.; Wang, Y.; Cao, J.; Wang, M. A SERS aptasensor for rapid detection of aflatoxin B1 in coix seed using satellite structured Fe3O4@Au nanocomposites. Food Control 2022, 142, 109228. [Google Scholar] [CrossRef]
- Wang, Y.; Liang, X.; Yang, Y. A SERS “on–off” sensor for Hg2+ and fumonisin B1 determination in grains based on Au-Janus Ag NPs modified by carbon dots. Microchim. Acta 2025, 192, 172. [Google Scholar] [CrossRef]
- Femenias, A.; Llorens-Serentill, E.; Ramos, A.J.; Sanchis, V.; Marín, S. Near-infrared hyperspectral imaging evaluation of Fusarium damage and DON in single wheat kernels. Food Control 2022, 142, 109239. [Google Scholar] [CrossRef]
- Shen, G.; Cao, Y.; Yin, X.; Dong, F.; Xu, J.; Shi, J.; Lee, Y.-W. Rapid and nondestructive quantification of deoxynivalenol in individual wheat kernels using near-infrared hyperspectral imaging and chemometrics. Food Control 2022, 131, 108420. [Google Scholar] [CrossRef]
- Zhao, T.; Chen, M.; Jiang, X.; Shen, F.; He, X.; Fang, Y.; Liu, Q.; Hu, Q. Integration of spectra and image features of Vis/NIR hyperspectral imaging for prediction of deoxynivalenol contamination in whole wheat flour. Infrared Phys. Technol. 2020, 109, 103426. [Google Scholar] [CrossRef]
- Saini, D.K.; Rana, A.; Halder, J.; Billah, M.M.; Gill, H.S.; Zhang, J.; Thapa, S.; Ali, S.; Turnipseed, B.; Glover, K.; et al. Rapid estimation of DON content in wheat flour using close-range hyperspectral imaging and machine learning. Plant Phenome J. 2024, 7, e70001. [Google Scholar] [CrossRef]
- Kim, Y.-K.; Baek, I.; Lee, K.-M.; Qin, J.; Kim, G.; Shin, B.K.; Chan, D.E.; Herrman, T.J.; Cho, S.-k.; Kim, M.S. Investigation of reflectance, fluorescence, and Raman hyperspectral imaging techniques for rapid detection of aflatoxins in ground maize. Food Control 2022, 132, 108479. [Google Scholar] [CrossRef]
- Marín, S.; López, C.; Lérida, J.L.; Prim, M.; Ramos, A.J. Assessing deoxynivalenol concentration reduction and mass loss in wheat batches using near infrared hyperspectral imaging. Food Res. Int. 2024, 196, 115047. [Google Scholar] [CrossRef] [PubMed]
- Nadimi, M.; Brown, J.M.; Morrison, J.; Paliwal, J. Examination of wheat kernels for the presence of Fusarium damage and mycotoxins using near-infrared hyperspectral imaging. Meas. Food 2021, 4, 100011. [Google Scholar] [CrossRef]
- Guo, Z.; Zhang, J.; Dong, H.; Sun, J.; Huang, J.; Li, S.; Ma, C.; Guo, Y.; Sun, X. Spatio-temporal distribution patterns and quantitative detection of aflatoxin B1 and total aflatoxin in peanut kernels explored by short-wave infrared hyperspectral imaging. Food Chem. 2023, 424, 136441. [Google Scholar] [CrossRef]
- Borràs-Vallverdú, B.; Marín, S.; Sanchis, V.; Gatius, F.; Ramos, A.J. NIR-HSI as a tool to predict deoxynivalenol and fumonisins in maize kernels: A step forward in preventing mycotoxin contamination. J. Sci. Food Agric. 2024, 104, 5495–5503. [Google Scholar] [CrossRef]
- Teixido-Orries, I.; Molino, F.; Femenias, A.; Ramos, A.J.; Marín, S. Quantification and classification of deoxynivalenol-contaminated oat samples by near-infrared hyperspectral imaging. Food Chem. 2023, 417, 135924. [Google Scholar] [CrossRef]
- He, X.; Yan, C.; Jiang, X.; Shen, F.; You, J.; Fang, Y. Classification of aflatoxin B1 naturally contaminated peanut using visible and near-infrared hyperspectral imaging by integrating spectral and texture features. Infrared Phys. Technol. 2021, 114, 103652. [Google Scholar] [CrossRef]
- Tao, F.; Yao, H.; Hruska, Z.; Kincaid, R.; Rajasekaran, K. Near-infrared hyperspectral imaging for evaluation of aflatoxin contamination in corn kernels. Biosyst. Eng. 2022, 221, 181–194. [Google Scholar] [CrossRef]
- Kim, Y.-K.; Baek, I.; Lee, K.-M.; Kim, G.; Kim, S.; Kim, S.-Y.; Chan, D.; Herrman, T.J.; Kim, N.; Kim, M.S. Rapid Detection of Single- and Co-Contaminant Aflatoxins and Fumonisins in Ground Maize Using Hyperspectral Imaging Techniques. Toxins 2023, 15, 472. [Google Scholar] [CrossRef]
- Liu, W.; Deng, H.; Shi, Y.; Liu, C.; Zheng, L. Application of multispectral imaging combined with machine learning methods for rapid and non-destructive detection of zearalenone (ZEN) in maize. Measurement 2022, 203, 111944. [Google Scholar] [CrossRef]
- Guo, Z.; Zhang, J.; Sun, J.; Dong, H.; Huang, J.; Geng, L.; Li, S.; Jing, X.; Guo, Y.; Sun, X. A multivariate algorithm for identifying contaminated peanut using visible and near-infrared hyperspectral imaging. Talanta 2024, 267, 125187. [Google Scholar] [CrossRef]
- Liang, K.; Huang, J.; He, R.; Wang, Q.; Chai, Y.; Shen, M. Comparison of Vis-NIR and SWIR hyperspectral imaging for the non-destructive detection of DON levels in Fusarium head blight wheat kernels and wheat flour. Infrared Phys. Technol. 2020, 106, 103281. [Google Scholar] [CrossRef]
- Mishra, P.; Passos, D.; Marini, F.; Xu, J.; Amigo, J.M.; Gowen, A.A.; Jansen, J.J.; Biancolillo, A.; Roger, J.M.; Rutledge, D.N.; et al. Deep learning for near-infrared spectral data modelling: Hypes and benefits. TrAC Trends Anal. Chem. 2022, 157, 116804. [Google Scholar] [CrossRef]
- Zhang, X.; Lin, T.; Xu, J.; Luo, X.; Ying, Y. DeepSpectra: An end-to-end deep learning approach for quantitative spectral analysis. Anal. Chim. Acta 2019, 1058, 48–57. [Google Scholar] [CrossRef] [PubMed]
- Deng, J.; Mei, C.; Jiang, H. Enhancing the application of near-infrared spectroscopy in grain mycotoxin detection: An exploration of a transfer learning approach across contaminants and grains. Food Chem. 2025, 480, 143854. [Google Scholar] [CrossRef] [PubMed]

| Samples | Toxins | Range | Processing | Modeling | Performance | Ref. |
|---|---|---|---|---|---|---|
| Wheat | DON | 0–49.3 mg/kg | Ground Unground | Random forest (RF) Extra trees (ET) AdaBoost (AB) | Kernels: ET: R2 = 0.77 RF: Acc = 84.2% Flour: ET: R2 = 0.94 AB: Acc = 89% | [101] |
| Wheat | Fusarium head blight(FHB) | / | Ground Unground | Linear discriminant Analysis (LDA), RF | Kernels: Acc = 100% Flour: Acc = 100% | [97] |
| Maize | Aflatoxin | 0–50 ng/g | Unground | LDA, PLSR | R2 = 0.99, Acc = 100% | [100] |
| Wheat | Fusarium and Aspergillus | / | Unground | LDA, PLSR | R2 = 0.89, Acc = 91.7% | [98] |
| Peanut | AFB1 | 10–1000 ppb | Unground | PLS-DA | 20 ppb: Acc = 90% 40 ppb: Acc = 94.29% | [99] |
| Peanut | AFB1 | 1.37–268.16 ug/kg | Ground | PLS-DA, PLS | R = 0.956, Acc = 91.9% | [102] |
| White | AFB1 | 6.57–124.29 ug/kg | Unground | PLSR | >35: R2 = 0.69 <35: R2 = 0.61 | [103] |
| Maize | Versicolorin A | / | Ground | K-nearest neighbors (KNN), SVM, XGBoost | SVM: Acc = 90% XGBoost: R2: 0.97 | [104] |
| Samples | Toxins | Range | Processing | Modeling | Performance | Ref. |
|---|---|---|---|---|---|---|
| Maize | AFB1 | 2.6214–63.0195 ug/kg | Ground | SVM | R2 = 0.9715 | [124] |
| Wheat | ZEN | 2–63 ug/kg | Ground | CNN | R2 = 0.9837 | [125] |
| Wheat | AFB1 | 2.040–92.534 ug/kg | Ground | PLSR | R2 = 0.9927 | [126] |
| Peanut | AFB1 | 2.1207–290.0161 ug/kg | Ground | PLSR | R = 0.9558 | [127] |
| Maize | ZEN | 6.90–800.20 ug/kg | Ground | PLSR | R = 0.9260 | [128] |
| Peanut | AF | 30–400 ppb | Unground | SIMCA | Acc = 80.8% | [129] |
| Spectral Technology | Principle | Benefits | Shortcomings | Sensitivity | Sample Requirements |
|---|---|---|---|---|---|
| Vis–NIR | Color + vibration frequency multiplication/combination frequency | Fast, low cost, sensitive to color changes | Low specificity, spectral overlap | μg/kg-mg/kg | Ground, Unground |
| NIR | The vibration of the hydrogen-containing group is multiplied or combined | Fast, good penetration, mature, high online potential | Water effect, model dependence is strong | μg/kg | Ground, Unground |
| MIR | Fundamental frequency vibration | Rich molecular structure information, high specificity, molecular fingerprint interval | Shallow penetration, moisture-sensitive | μg/kg | Ground, Unground, Tablet |
| Raman | Inelastic scattering vibration | Water compatibility | Weak signal and prone to fluorescence interference | μg/kg | Ground, Unground |
| SERS | Raman scattering, surface signal enhancement | Ultra-high sensitivity, High specificity | Strong dependence on the base, challenges in reproducibility/stability, and high cost | ng/kg-pg/kg | Extraction, Base Preparation |
| HSI | Spectral spatial imaging | Spatial information distribution, heterogeneity analysis | Large volume of data, complex processing, and expensive instruments | μg/kg-mg/kg | Ground, Unground |
Disclaimer/Publisher’s Note: The statements, opinions and data contained in all publications are solely those of the individual author(s) and contributor(s) and not of MDPI and/or the editor(s). MDPI and/or the editor(s) disclaim responsibility for any injury to people or property resulting from any ideas, methods, instructions or products referred to in the content. |
© 2025 by the authors. Licensee MDPI, Basel, Switzerland. This article is an open access article distributed under the terms and conditions of the Creative Commons Attribution (CC BY) license (https://creativecommons.org/licenses/by/4.0/).
Share and Cite
Deng, J.; Zhao, M.; Jiang, H. Research Progress in the Detection of Mycotoxins in Cereals and Their Products by Vibrational Spectroscopy. Foods 2025, 14, 2688. https://doi.org/10.3390/foods14152688
Deng J, Zhao M, Jiang H. Research Progress in the Detection of Mycotoxins in Cereals and Their Products by Vibrational Spectroscopy. Foods. 2025; 14(15):2688. https://doi.org/10.3390/foods14152688
Chicago/Turabian StyleDeng, Jihong, Mingxing Zhao, and Hui Jiang. 2025. "Research Progress in the Detection of Mycotoxins in Cereals and Their Products by Vibrational Spectroscopy" Foods 14, no. 15: 2688. https://doi.org/10.3390/foods14152688
APA StyleDeng, J., Zhao, M., & Jiang, H. (2025). Research Progress in the Detection of Mycotoxins in Cereals and Their Products by Vibrational Spectroscopy. Foods, 14(15), 2688. https://doi.org/10.3390/foods14152688