3.1. Composition and Physico-Chemical Analyses of Cheeses
The physico-chemical composition of goat cheeses (fat, proteins and salt content) is presented in
Table 2. The fat content ranged from 31.28 to 39.26%, and all cheeses could be classified as semi-fat cheeses according Spanish legislation [
19]. The results showed a lower fat value in CGC, then in FC, MC and finally in MGC. Significant differences were found between all cheeses (
p < 0.05). The fat content values found in our study for cheese made from Murciano-Granadina and Malagueña goat milk were higher than reported for these cheeses in the literature [
20,
21]. Many of the variations in cheese characteristics were due to the differences in milk composition that depend on lactation stage, season, breed, feeding and genotype [
5]. Furthermore, when the milk is not standardized, as in artisanal cheeses, the effect of the breed and the ripening time are the most influential factors on the physico-chemical characteristics of cheeses [
3,
20].
The protein content ranged from 22.34 to 26.23% and statistically significant differences (
p ≤ 0.05) were observed. CGC and MG (26.20 and 26.23%, respectively) had a higher protein content than MGC (23.45%) and FC that showed the lowest fat percentage (22.34%). The fat/protein ratio of goat milk normally varies between 1.1 and 1.5 [
5]. The variation in the fat/protein ratio between cheeses made from the milk of different indigenous goat breeds ranged from 1.19 to 1.67, with significant differences (
p < 0.05). All cheeses were made in spring, so that could have presented a high fat/protein ratio which could have led to a reduction in the fat retention in the cheese during its transformation [
22].
According to the data from the milk control, the milk of the Malagueña breed goat has, on average, 4.8% fat and 3.4% protein. Similarly, the milk of the Guadarrama goat breed has 4.6 and 3.5% fat and protein, respectively; milk of the Florida breed has 4.9% fat and 3.4% protein; and finally, milk of the Murciano-Granadina breed has 5.1% and 3.6% fat and protein [
23], although, of course, these are average values that change depending on the state of lactation, the time of year or the feeding of the animals. The composition of the cheeses studied (percentage of fat and protein) is generally correlated with the composition of the milk used to make the cheeses, although these data are not available in this study.
The four cheeses had less than 2% of salt. The CGC salt content was lower than the rest of the cheeses studied (1.25% salt) (
p < 0.05). There were no significant differences between MC, MGC and FC (
p < 0.05), obtaining values between 1.72 and 1.87%. NaCl content was similar with that found in the literature for hard cheeses [
24]. The differences between the cheeses studied could be due to variations in the specific salting process used for each particular cheese. It is possible that more salt is added during the salting process, resulting in a higher salt content in the final product. The addition of salt in high concentrations to increase the flavor and preservation of a cheese decreases proteolytic enzyme activity while increasing osmotic pressure, which eliminates part of the water trapped in the protein network of the curd, causing cheeses to have lower moisture [
25]. Also, salt dehydrates bacteria, killing them or preventing them from growing and multiplying [
6]. Namely, a high correlation coefficient was observed between fat and salt content (r = 0.931,
p > 0.05) (
Table S2).
The physico-chemical parameters of pH, moisture and water activity (a
w) can be seen in
Table 1. In relation to pH, the values obtained are in the range between 4.85 and 5.39. The pH of the cheeses should be slightly acidic to inhibit the growth of pathogenic microorganisms. MGC was the most acidic cheese (pH = 4.85), followed by FC (5.27). CGC and MC were lower in acidity (5.36 and 5.39, respectively) than MGC and FC. Significant differences (
p < 0.05) were observed between MGC and FC, and between each of them and CGC and MC. Low pH values (particularly below 5.0) in artisanal cheeses could be a relevant factor for pathogen control [
26]. In general, pH measurement is an important tool to verify appropriate fermentation; the pH of hard cheeses tends to increase with the ripening process due to the presence of certain basic amino acids and NH
3, as well as the decomposition of the lactic acid salt [
27,
28]. Furthermore, the type of starter culture used, the initial microbial load of the milk used and the absorption of salt during the salting process could have contributed to the observed variations in pH [
21].
Moisture content in cheeses from milk of different autochthonous goat breeds showed significant differences (
p < 0.05). CGC and FC have a higher moisture content (37.48 and 36.30%, respectively) than MGC and MC (33.01 and 30.77%, respectively). Considering that the ripening time of the cheeses was 60 days, it could be expected that they had low moisture values. The moisture of most cheeses is established by the speed and extension of syneresis and the compression of the structure of casein. After coagulation, processes such as molding, pressing and salting are coupled with a lowering of pH and result in a significant loss of moisture as the whey is removed [
3].
Related to water activity, significant differences (
p < 0.05) were observed among the different cheeses studied. Values of a
w ranged between 0.93 and 0.95 and statistically significant differences were detected between all cheeses. CGC and MC had lower a
w than FC and MGC. Moisture in cheeses was related to a
w. In this sense, CGC was found to have the highest moisture content among the cheeses analyzed, indicating a higher a
w compared to the other cheeses. In second place was FC, followed by MC and MGC, which presented similar moisture values and a lower a
w compared to the two previous cheeses. To corroborate these relations, a significant correlation coefficient was observed between a
w and moisture (r = 0.983,
p < 0.05) (
Tables S1, S2 and S4).
The cheeses made from the milk of different autochthonous goat breeds studied were different in fat, protein, salt, pH, moisture content and aw,which could be due to the different compositional characteristics of the milk that was used for their manufacture, and also to the different manufacturing procedures, even though they were all manufactured from raw milk collected in the same month and were ripened for 60 days.
3.2. Fatty Acid Profile of Cheeses
The fatty acid (FFA) compositions of cheeses made from the milk of different autochthonous goat breeds (Cabra del Guadarrama, Malagueña, Murciano-Granadina and Florida) are presented in
Table 3. The fatty acid profile is described by 26 fatty acids. The following are the most predominant fatty acids that were identified in cheeses: palmitic acid (C16:0), oleic acid (C18:1n9c), stearic acid (C18:0), myristic acid (C14:0), capric acid (C10:0), lauric acid (C12:0), caprylic acid (C8:0) and linoleic acid (C18:2w-6). In MGC, palmitic acid (C16:0), capric acid (C10:0), lauric acid (C12:0) and myristic acid (C14:0) content were higher than in CGC, MC and FC (
p < 0.05). CGC had lower oleic acid (C18:1n9c) and stearic acid (C18:0) content than rest of cheeses (
p < 0.05). Only in MGC was EPA-Timnodonic acid (C20:5 n3) detected. The results obtained showed that saturated fatty acids (SFAs) were the predominant fatty acids of all the cheeses studied. CGC had a significantly lower (
p < 0.05) content of these acids (162.73 ± 4.26 mg FAME/g cheese) than MGC (212.03 ± 2.69 mg FAME/g cheese), which were found to be predominantly caproic acid (C6:0), caprylic acid (C8:0), capric acid (C10:0), lauric acid (C12:0) and palmitic acid (C16:0). SUFAs are known to contribute to the characteristic flavor and aroma of cheese [
29]. Among the MUFAs detected in these cheeses, the most abundant was oleic acid and no significant differences were detected between MC, MGC and FC (
p > 0.05), while CGC had a lower content of this fatty acid than the rest of the cheeses. The UFA contents were lower in CGC (56.00 ± 1.38 mg FAME/g cheese), with significant differences with the other autochthonous goat cheeses in our study. CGC had a lower content of all fatty acid fractions, due to the lower fat content than the rest of the cheeses studied. The flavor properties of cheese are directly influenced by the amount of FFAs and the pH value, and these parameters tend to influence each other [
30]. In our study, a negative correlation was found between pH and SCFA and SUFA content (r = −0.978 and r = −0.894, respectively,
p < 0.05) (
Table S2).
To evaluate the nutritional value of the lipids of the cheeses, different lipid health indices were calculated. The PUFA n-6/n-3 fatty acid ratio is an important health factor and maintaining a low omega-6/omega-3 ratio is important for decreasing inflammation [
31]. The Western diet, with its excessive consumption of processed foods and inadequate intake of omega-3 fatty acids, is characterized by a high PUFA n-6/n-3 ratio of up to 15/1-16.7/1 [
32]. In our study, there were significant differences between CGC and MC that showed a significantly lower (
p < 0.05) n-6/n-3 ratio (3.73 and 3.76, respectively) than FC (4.85) and much less than MGC (11.56). Furthermore, higher values were obtained (the observed ratio was in the range of 3.74–11.00) than those found in the literature for semi-hard cheeses, where the ratio was 3.3 [
33]. Another study found that the PUFA n6/n3 ratio was 2 for cheeses made from Carpathian goat milk [
34]. CGC and MC, which showed a lower n-6/n-3 ratio, are cheeses made in Madrid and Las Navas del Marqués, a town near to the Madrid region. CGC is made using milk from the autochthonous Cabra del Guadarrama breed. Although there may be differences due to breed, animal feeding is perhaps the most important factor influencing the w6/w3 ratio. Feeding systems, particularly grazing, have been shown to affect the profile of essential fatty acids, particularly the omega-6/omega-3 balance. The utilization of concentrates probably increases the omega-6 content or decreases the omega-3 concentration, often exceeding a 4:1 omega-6/omega-3 ratio and diminishing the beneficial effects of omega-3 on consumer health [
35]. Conversely, goats that graze on natural pastures tend to produce milk and cheese with a more favorable omega-6/omega-3 ratio. This is because pastures are richer in omega-3 fatty acids. Therefore, the difference is probably due to the type of feed used, as well as the higher proportion of concentrates [
36]. Another study found that the content of fatty acids varied according to breed, with significant differences evident not only for individual acids, but also for their groups, such as SFAs, UFAs and MUFAs [
37].
A useful parameter that indicates the health properties of food is the AI (showing the inhibition of the aggregation of plaque), and it is assumed that the most favorable AI value for human health is below 1 [
38]. It was observed that MGC had a higher AI than the rest of the cheeses studied. Another interesting index is the thrombogenic index (showing the tendency to form clots in the blood vessels). In the present study, the lowest atherogenic and thrombogenic index was determined in cheeses made from the milk of the Malagueña goat breed (2.65 and 3.35, respectively), while the highest value was recorded in cheese made from the milk of Murciano-Granadina goats (3.03 and 4.08, respectively), with significant differences (
p < 0.05). When we compared our results, we found that lower values of AI were obtained for cheeses made with milk from different Polish goat breeds [
38], but that these values were similar to those obtained for cheeses made with milk from Bulgarian goat breeds [
39]. In addition, cheese made of milk from the autochthonous del Guadarrama breed was characterized by the lowest hypocholesterolemic and hypercholesterolemic fatty acid index (84.68 and 92.97, respectively) of all the cheeses studied (
p < 0.05). Therefore, the influence of breed on the fatty acid profile was visible in our study, similar to that described in the literature [
39]. Moreover different authors have described that the feeding system plays a major role in modulating the fatty acid composition of cow, goat and sheep milk [
40,
41,
42,
43] and have also described an improvement in the nutritional quality of cheeses produced in the spring months [
22].
The four cheeses studied have different fat contents, so the fatty acid content depends on the amount of total fat and therefore on the total fatty acid content. The percentage of each fatty acid in relation to the total amount of fatty acids has also been calculated. This is because the percentage of fatty acids is a better indicator of the quality of the fat in cheeses. The results are expressed in
Table 4. It can be seen that no statistically significant differences were observed for the butyric acid (C4:0) and myristic acid (C14:0) fatty acid percentages among all cheese types studied. However, the four cheeses were all different in the percentage of the following fatty acids: palmitic acid (C16:0), margaric acid (C17:0), linoleic acid (C18:2n6c), arachidic acid (C20:0), C20:1n9 and behenic acid (C22:0). MGC had the highest percentage of palmitic acid (C16:0) fatty acid (30.21%), then FC (28.67%), CGC (27.53%) and MC (26.74%). The percentage of the fatty acid margaric acid (C17:0) varied from 0.47% (MGC) to 0.58% (FC), 0.71% (CGC) and 0.96% (MC). They were also all different in the percentage of linoleic fatty acid (C18:2n6c). The one with the lowest percentage was CGC (2.22%), followed by FC (2.76%), MC (3.28%) and MGC (3.67%). In relation to the percentage of the fatty acid arachidic acid (C20:0), MGC had 0.20%, FC 0.41%, CGC 0.70% and MC 0.96%. CGC had a lower percentage of C20:1n9 (0.05%) than FC (0.07%), MGC (0.07%) and MC (0.09%). In the same way, MGC had a lower percentage of the behenic acid (C22:0) fatty acid (0.06%) than FC (0.12%), CGC (0.21%) and MC (0.29%).
Figure 1 shows the distribution of the percentages of fatty acids in the map configured by the first two principal components, which together explain 76% of the observed variance.
MC had a higher percentage of the margaric acid (C17:0), stearic acid (C18:0), α-linolenic acid (C18:3n3), arachidic acid (C20:0), timnodonic acid-EPA (C20:5n3), C20:1n9, C21:0, behenic acid (C22:0), clupanodonic acid-DPA (C22:5n3), C23:0 and lignoceric acid (C24:0) fatty acids and a lower percentage of the myristoleic acid (C14:1n5) and palmitic acid (C16:0) fatty acids than all other cheeses studied. MGC had a higher percentage of palmitic acid (C16:0) and linoleic acid (C18:2n6) and a lower percentage of the pentadecylic acid (C15:0), margaric acid (C17:0), α-linolenic acid (C18:3n3), arachidic acid (C20:0), behenic acid (C22:0) and clupanodonic acid-DPA (C22:5n3) fatty acids than all other cheeses studied. FC had a higher percentage of the myristoleic acid (C14:1n5), palmitoleic acid (C16:1n7) and arachidonic acid (C20:4n6) fatty acids than the rest of cheeses studied. CGC had the lowest percentage of the palmitoleic acid (C16:1n7), cis-vaccenic acid (C18:1n7c), linoleic acid (C18:2n6c) and C20:1n9 fatty acids than the rest of the cheeses studied.
MGC and CGC had a higher percentage of short- and even-chain saturated fatty acids (caproic acid (C6:0), caprylic acid (C8:0), capric acid (C10:0) and lauric acid (C12:0)) and a lower percentage of the cis-vaccenic acid (C18:1n7c) and arachidonic acid (C20:4n6) fatty acids than MC and FC.
CGC and MC had a higher percentage of odd-chain saturated fatty acids: hendecanoic acid (C11:0), pentadecylic acid (C15:0), margaric acid (C17:0), (C21:0) and long-chain even-chain saturated fatty acids (arachidic acid (C20:0), behenic acid (C22:0), lignoceric acid (C24:0)) and a lower percentage of palmitic acid (C16:0) than FC and MGC.
A dendrogram was constructed using the percentages of fatty acids in the studied cheeses as variables. The results showed that the fatty acid profile of Guadarrama Goat cheese was more similar to Malagueña Cheese than to the Florida and Murciano-Granadina goat cheeses (
Figure 2). These two cheeses were produced in the Madrid and Ávila regions of Spain, less than 90 km apart. In contrast, the Florida and Murciano-Granadina Cheeses were produced in Andalusia, in the provinces of Seville and Cádiz, respectively. Murciano-Granadina goat cheese is the one with the most different fatty acid profile compared to the rest of the cheeses studied. As previously discussed, MGC had a higher atherogenic and thrombogenic index, and a higher PUFA n-6/n-3 ratio than the rest of the cheeses studied. In Spain, several breeds of goat are highly prized for the quality of their milk, which has been used for cheese production. The Murciano-Granadina breed is the most widely used for this purpose. The Murciano-Granadina breed has high milk production and is highly specialized in this respect, surpassing others in volume. Its milk has a high fat and protein content, which translates into an excellent cheese yield and a characteristic flavor. In addition, MGC has a higher fat content than the other cheeses. The Murciano-Granadina breed is the most widely used in Spain for producing goat cheese thanks to its high milk production. This breed enables the production of cheeses with a good yield and high sensory quality, although the lipid profile of its milk is less healthy than that of other breeds used by small-scale dairies to make artisanal cheeses.
3.3. Color and Texture Profile Analysis of Cheeses
The color of the rind and the paste (interior) of the cheeses made from the milk of different autochthonous goat breeds are presented in
Table 5. The colorimetric parameters of cheese depend mainly on the type of milk used in the production of the product and the ripening time. When the color of the cheese paste was analyzed, the lightness (
L*) of the cheese paste ranged from 77.34 for MC to 89.98 for MGC and it was found that CGC and MC had lower luminosity values than the other two cheeses (81.34 and 77.34) (
p < 0.05). No differences were observed in the red index among the four cheeses studied.
Similar values were found in a study of Canarian goat cheeses [
3]. They described that goat cheese was the brightest in comparison to cheese from other animal species. In the red index of cheese paste (
a*), no significant differences (
p > 0.05) were found among the cheeses studied. Finally, in the yellow index of cheese paste (
b*), significant differences (
p < 0.05) were observed among the four types of cheese studied.
Significant differences in rind lightness (L*) (p < 0.05) among the four cheeses studied were measured, with a lower brightness in CGC and higher brightness in FC (55.80 and 70.99, respectively), although no significant differences (p > 0.05) were found between MC and MGC.
Statistically significant differences were observed among the four cheeses analyzed for the colorimeter parameters of the rind red (a*) and yellow (b*) index (p < 0.05). The highest redness and yellowness values were found for MGC, followed by MC, CGC and FC.
The color of cheeses is influenced by the type of milk used, by the processing technique or family to which it belongs and by the ripening time. Also, the feeding system given to goats has a significant impact on the levels of carotenoids in their milk and the color of the cheese produced [
44]. In the literature it has been described that cheeses made with spring milk are more yellowish in color than those made with winter milk. For example, cheeses made with winter milk from dairy goats fed grass silage are more yellowish than those made with milk from animals fed hay. On the other hand, it has been described that ripening time affects all color parameters in most cheeses [
3]. The high
L* value of cheese could be due to the high moisture content [
45]. The redness (
a*) observed as ripening progressed may have been related to the chemical composition (smaller fat globules and a total conversion of β-carotene to vitamin A). The yellow color (
b*) of the cheese was mainly due to the presence of carotenoids [
46]. The increases in the
a* and
b* values were due to biochemical reactions, such as lipolysis and proteolysis during maturation and the diversified feeding of the goats [
47]. Some researchers related increases in the
L* and
b* of the cheese surface to microstructural changes [
48].
To study the texture of the goat cheeses, a double compression test (TPA) (at both 50% and 75% of the initial size) was carried out.
Table 5 shows the results obtained for the instrumental texture properties of goat cheeses. At 50% compression, it was observed that CGC (46.07 N) and FC (53.91 N) were significantly softer (
p > 0.05) than MC (76.06 N) and MGC (70.86 N) and there were no significant differences (
p > 0.05) between CGC and FC and between MGC and MC. The most elastic cheese was CGC (0.87), and the least elastic was FC (0.76), although there were no significant differences (
p > 0.05) between CGC, MC and MGC. Cabra del Guadarrama Cheese is also more cohesive (0.53) (
p > 0.05) than the other cheeses studied. CGC and FC (0.28 and 0.20 Ns, respectively) were statistically significantly more adhesive cheeses (
p < 0.05) than MGC and MC (0.06 and 0.02 Ns, respectively). Higher values of hardness and lower values of cohesiveness than the cheeses studied in this work have been described for Canarian goat cheeses also ripened for 60 days [
3]. FC had lower values of chewiness (16.45 N) than MC (23.30). However, no significantly differences were detected among MGC, CGC and FC (
p > 0.05). CGC had a higher value of resilience (0.33) than the rest of the cheeses in this study (
p < 0.05). Finally, there was a significant difference (
p < 0.05) between MC and FC with regard to gumminess, which was higher for MC (29.56 N) than for the other cheeses. Similar values have been described for the springiness, resilience and cohesiveness of Mexican cheeses [
26].
When the test was carried out with a compression of 75%, all the values obtained followed the same trend as those obtained with 50%, with the exception of adhesion, which was higher for FC (0.18 Ns), and chewiness, which was higher for MGC (11.96 N).
The results of the instrumental texture analysis performed showed that MGC and MC are harder cheeses than CGC and FC. The texture properties of these two cheeses are more similar to each other than to those of MC and MGC.
Textural characteristics are criteria of great importance to the sensory properties and the perception and acceptance of products by consumers, so several studies have reported correlations between chemical composition and selected instrumental textural parameters of cheese [
49]. For example, protein content in cheese was positively associated with firmness and chewiness but negatively associated with gumminess [
50]. In contrast, in this study, protein was positively associated with gumminess at 75% compression (r = 0.930). Fat content was reported to have a negative effect on the gumminess and chewiness [
50]. Other studies in the literature reported a strong positive correlation between the fat content of cheeses and textural fracturability (r = 0.456,
p < 0.05), hardness (r = 0.441,
p < 0.05), adhesiveness (r = 0.684,
p < 0.01) and gumminess (r = 0.721,
p < 0.01) [
51]. In addition, we observed a negative effect of fat content on the cohesion at 75% compression (r = 0.955,
p < 0.01) (
Table S1).
In this study, moisture exhibited a strong positive correlation with adhesiveness at 50% and 75% compression (r = 0.980 and r = 0.977, respectively). Additionally, at 50% compression, moisture exhibited a negative correlation with hardness (
Table S1). The literature describes a positive relationship between cohesiveness and cheese moisture, such that the higher the water content, the greater the force exerted by the internal bonds of the cheese [
50]. In this sense, CGC had a higher moisture content and therefore greater cohesiveness. However, MC, which had the lowest moisture content, had higher values of hardness and lower values of springiness than the other cheeses. Furthermore, a
w was positively correlated with hardness (r = 0.987) and adhesiveness (r = 0.989). On the other hand, hardness at 50% showed a negative correlation with adhesiveness (r = −0.999,
p ≤ 0.01) and cohesiveness (r = −0.915). CGC had the highest bond strength and the lowest hardness. Cohesiveness showed a positive correlation with adhesiveness (r = 0.930,
p > 0.05) and springiness (r = 0.980,
p < 0.05) (
Table S1). In general, in our study, springiness, cohesiveness or resilience were the parameters that showed the least variation from one cheese to another. However, other parameters such as hardness or gumminess showed more variability.
3.4. Microbiological Analysis
Table 6 presents the data from the microbiological counts carried out on goat cheeses from autochthonous goat breeds. In the goat cheeses studied, lactobacilli and lactococci were the most abundant microbial groups, as has been previously described in the literature. After the production and ripening processes of cheeses made from raw goat milk, the genus
Lactobacillus was the most abundant microbial group [
52]. MGC had the lowest counts of lactobacilli (6.53 log CFU/g of cheese) (
p < 0.05). For the growth of lactococci, CGC and FC (8.03 and 8.00 log CFU/g of cheese, respectively) showed higher counts than MC (7.41 log CFU g of cheese) and MGC (5.99 log CFU/g of cheese), with significant differences (
p > 0.05). In this study, a significant correlation was detected between lactobacilli counts and pH (r = 0.980). Lactobacilli may contribute to the acidification of milk during the initial steps of cheese making via the production of organic acids, mainly lactic acid [
53].
There were no significant differences (
p > 0.05) in the content of HLB between MC, MGC and FC, which all showed higher counts than CGC (6.58 log CFU/g cheese). Lactic acid bacteria (LAB) play an important role in inhibiting the growth of most undesirable microorganisms by acidifying the environment and contributing to the organoleptic characteristics of the cheese through processes such as lactose fermentation, protein hydrolysis and catabolic reactions during the ripening process [
54]. Dairy products are important sources of biological active compounds of particular relevance to human health and of lactic acid bacteria. In addition, their influence on the development of the sensory characteristics of the cheese may be significant as they are one of the predominant microbial groups during the ripening process [
7].
MGC had lower counts of total mesophilic aerobes (6.33 log CFU/g of cheese) than all other cheeses (
p > 0.05). Finally, molds and yeasts were only detected in CGC, having been added during the elaboration process. For other raw goat milk cheeses, it has been suggested that the total FAA in cheeses might also be related to the presence of yeasts and their lipase activity [
44]; on the contrary, in our study, we described a negative correlation between MUFAs (r = −0.960,
p < 0.05) and PUFAs (r = −0.859) and molds and yeasts, although in this study, only was detected in CGC (
Table S2).
Enterobacteriaceae were only detected in MC. This type of bacteria is considered to be an indicator of the hygienic conditions of milk production [
55] and high levels of
Enterobacteriace in raw milk cheeses are of great concern for the dairy industry because of their technological and public health significance [
56]. Artisanal cheeses are often manufactured from raw milk in farms or small dairies. Furthermore, the indigenous microbiota of raw milk is usually quite diverse and heterogeneous and has a significant impact on the overall microbiota of cheese with the starter used in the production process. Both factors were responsible for the differences between the cheeses [
54].
The results obtained in this work showed that the microbiota of CGC was more abundant and diverse, and that MGC presented a lower total count than the other cheeses studied.
3.5. Sensory Analysis
The sensory properties of cheese are influenced by many factors, including species, milk production environment and processing technologies, as well as the chemical and microbiological properties of the raw materials used, which are among the main determinants of cheese yield and quality [
57]. In addition to chemical composition and nutrient content, sensory evaluation is an important part of cheese quality assessment.
3.5.1. Quantitative Descriptive Analysis by Trained Assessors
Table 7 shows the results of the sensory attributes (appearance, texture and olfactory–gustatory profile) of the cheeses studied in this work, evaluated by a panel of trained judges.
After evaluating the tactile and oral phases, no significant differences (
p > 0.05) between the four cheeses analyzed in terms of springiness, surface roughness, friability, adherence and number of chews were detected. These results indicate that these attributes were not sufficient to differentiate the cheeses. The highest value for springiness was CGC (6.14), for surface roughness was MC (4.53), for friability was MGC (5.83), for adherence was FC (4.20) and for number of chews was MGC (12.86). With regard to springiness, CGC was described as the most elastic of all the cheeses studied. However, significant differences (
p < 0.05) were detected by the panel in terms of the surface humidity between MC and the rest of the cheeses, in which a lower value was obtained (3.79). Moreover, a negative correlation between sensorial moisture and instrumental hardness was detected (r = −0.891) (
Table S7). The cheese made with Cabra del Guadarrama milk had the highest surface humidity value (5.88), although there were no differences with MGC and FC (
p > 0.05). This observation is in line with the results of the physico-chemical analysis previously carried out on the moisture content of each cheese. Statistically significant differences (
p < 0.05) were found between the cheeses for the scores given by the assessors for firmness. In addition, both in the evaluation performed by texture analysis and by instrumental techniques, it was observed that MC had a higher firmness (6.44), which was related to its hardness (r = −0.987,
p < 0.05). In addition, the firmness had an indirect relation with instrumental and sensory moisture (r = −1.00,
p < 0.01 and r = −0.890,
p < 0.05, respectively) and, on the other hand, with a
w (r = −0.986,
p < 0.05) (
Table S7). These results are consistent because juiciness depends directly on the water content of the food [
29]. In relation to juiciness, significant differences (
p < 0.05) were found between MC and MGC, which were perceived as having less juiciness than the other cheeses (2.36 and 2.76, respectively). A negative correlation between firmness and juiciness was detected (r = −0.982,
p ≤ 0.05). In addition, a negative correlation between springiness and friability was detected (r = −0.923,
p ≤ 0.05) (
Tables S5–S7).
Regarding flavor attributes, no significant differences (
p > 0.05) were found for salty, bitter and sweet flavors. However, significant differences were observed in the acid flavor between MC (3.82) and MGC (6.07) (
p < 0.05). In relation to the salty flavor, MGC was the saltiest for the trained judges (4.94), according to the results of the physico-chemical analysis, although the differences observed were not statistically significant. In addition, a negative correlation between bitter flavor and adherence was detected (r = −0.965,
p ≤ 0.05) (
Tables S5–S7).
No significant differences in overall persistence and overall impression were found (p > 0.05). For this latter parameter MC was the best rated (6.96), followed by FC (6.86), MGC (6.58) and CGC (6.47). All cheeses were scored with values higher than 6 on a scale of 10 points, so the judges had high overall liking values of all the cheeses studied. The trained judges perceived that all the cheeses had a similar sensory quality.
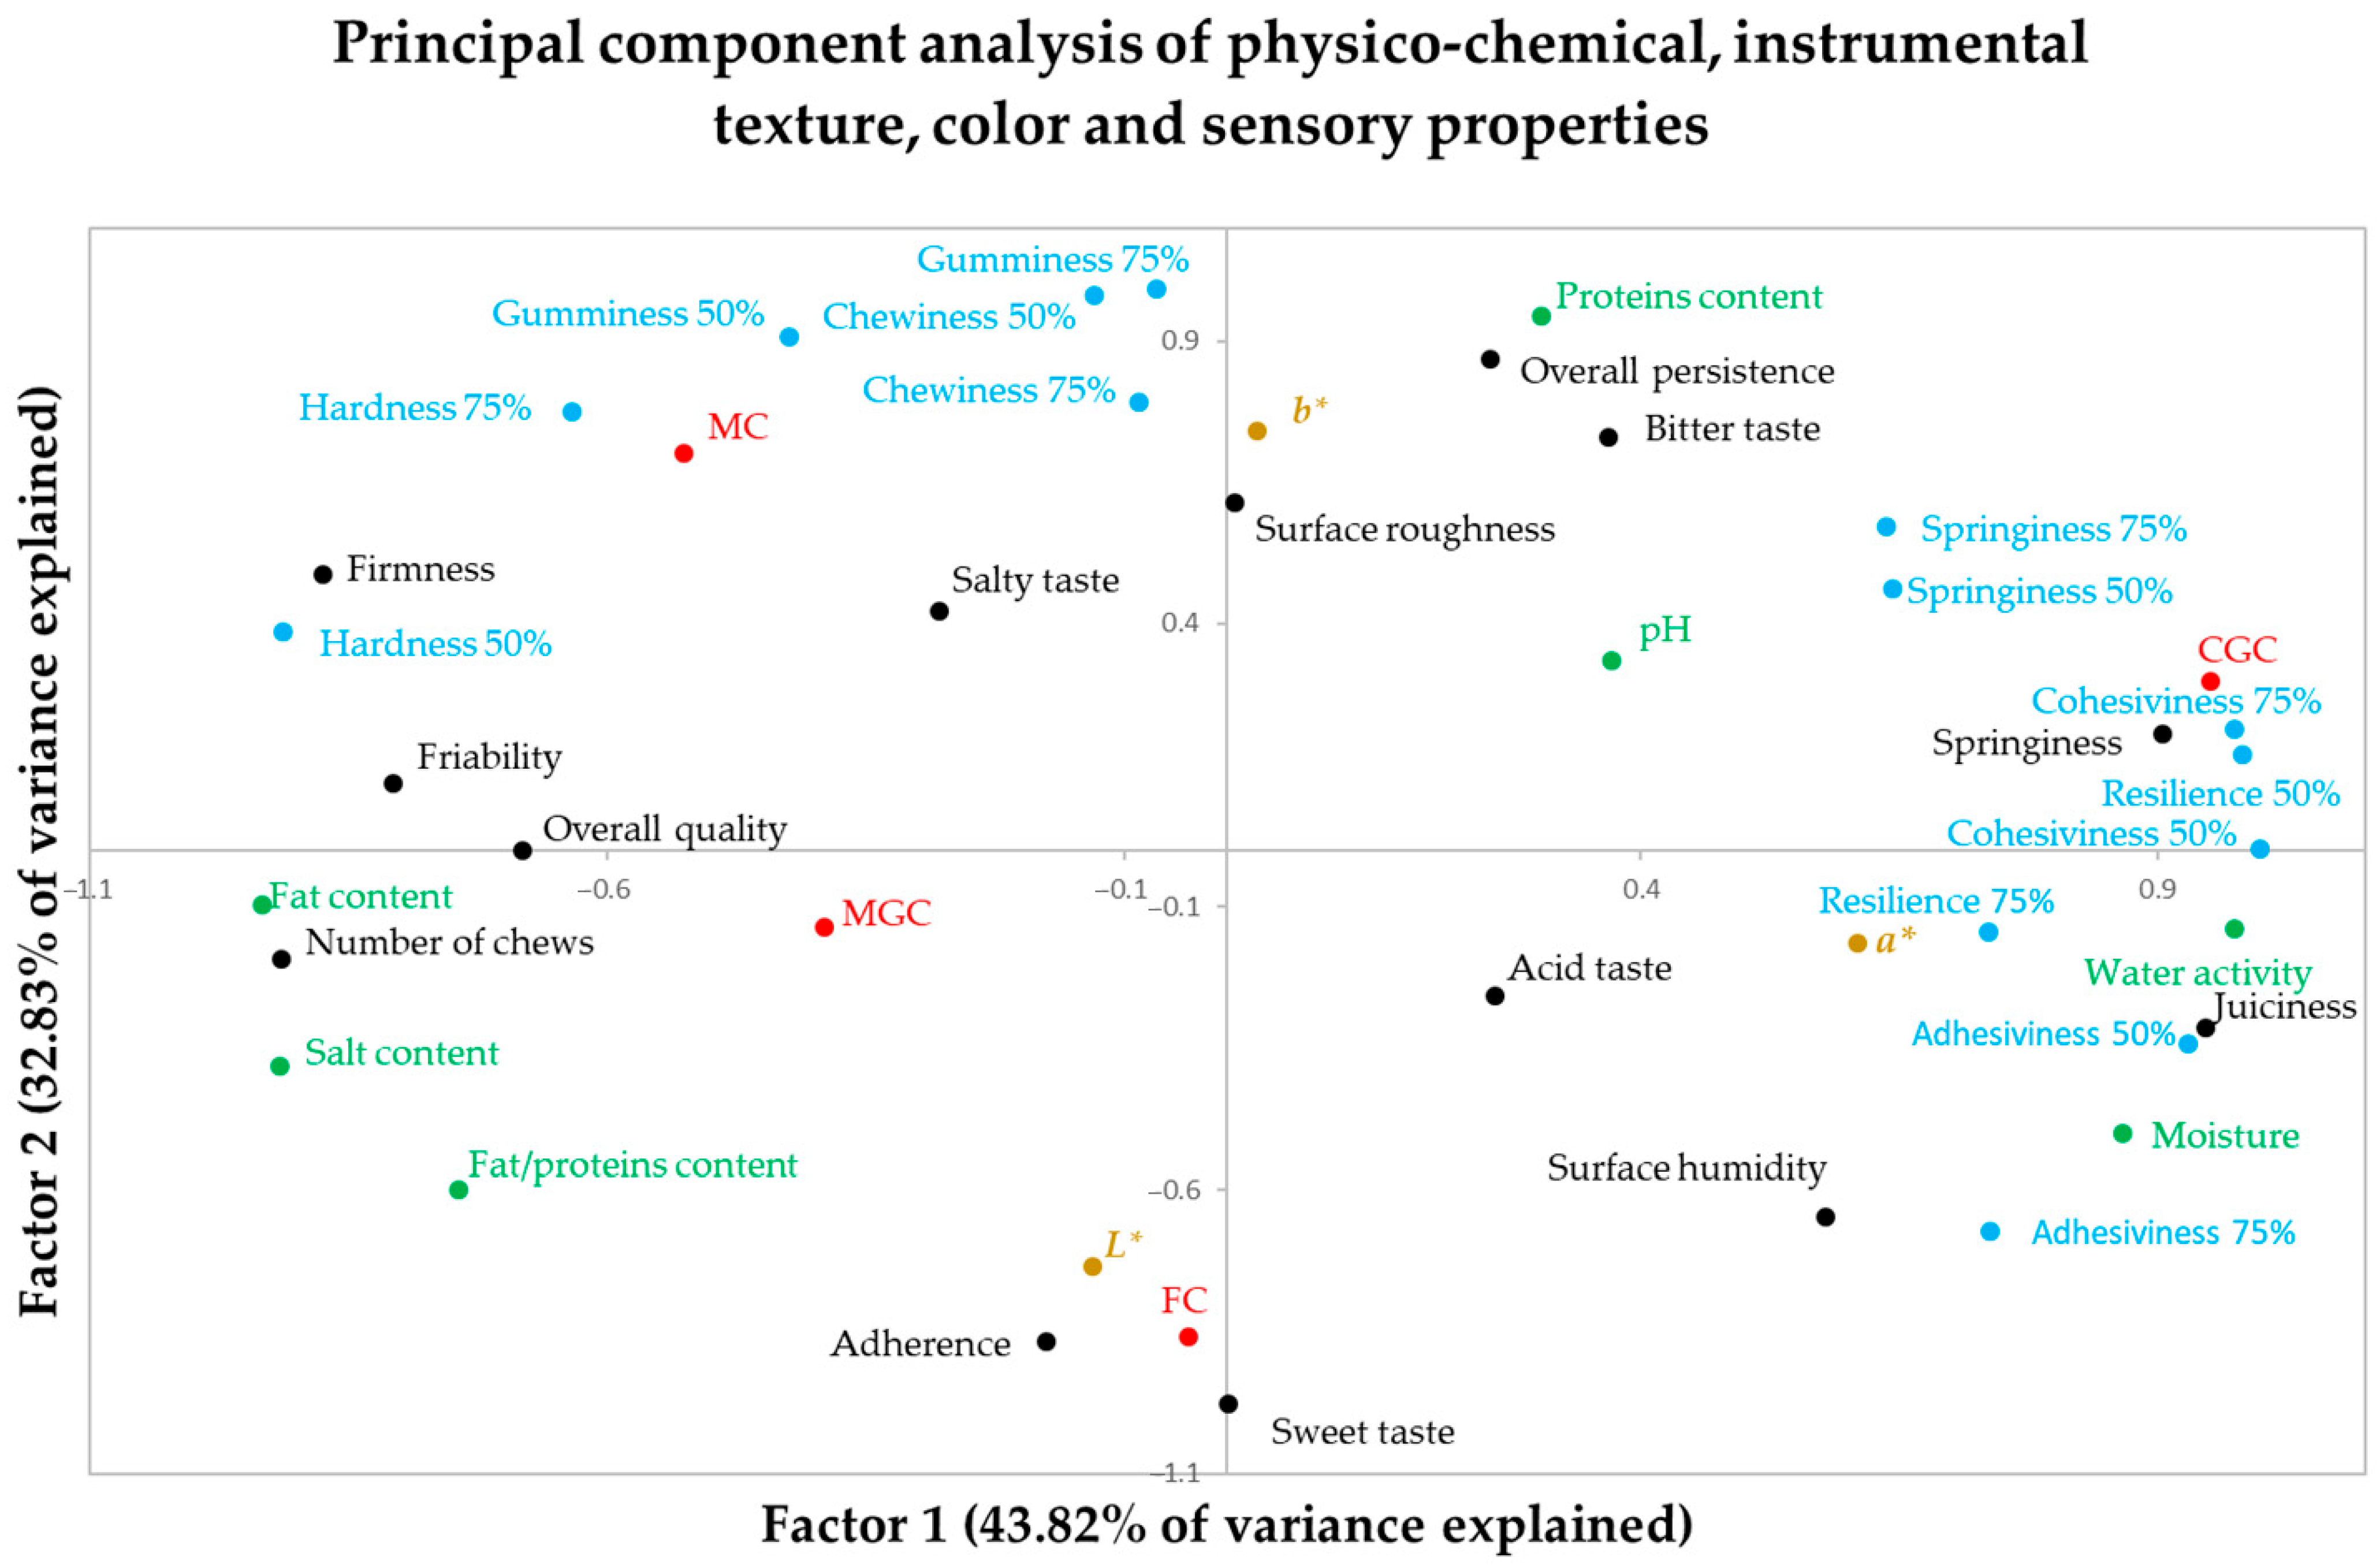
A principal component analysis was performed, including physico-chemical parameters, instrumental texture parameters and sensory properties as variables. Three principal components were detected, with the first one explaining 43.80% of the explained variance, the second one 32.80% and the third one 23.34%. No other principal component was detected because the three of them explained 100% of the variance.
Table 8 shows the component matrix in which the three main components are detected and the correlation coefficients of each variable with each of the selected main components appear. The variables with the highest correlation with each of the principal components are shaded.
Figure 3 shows the distribution of the physico-chemical, instrumental texture, color and sensory properties in the map configured by the first two principal components, which together explain the 73.39% of the observed variance.
The first component represents the water content (moisture, water activity) and related sensory variables (juiciness, springiness) or instrumental variables (springiness, adhesiveness). Similarly, hardness (both instrumental and sensory), fat content and other variables are negatively correlated with this main component (
Table 8;
Figure 3). This first principal component is what allows us to differentiate CGC from MGC and MC.
The second main component refers to the protein content and related properties. include instrumental texture (hardness, gumminess, chewiness) and sensory properties (such as persistence and bitterness, which are related to the cheeses included in this work with a higher protein content). On the contrary, it is negatively correlated with the sweet flavor and sensory adherence. This second factor is what mainly allows us to differentiate FC from CGC and MC (
Table 8,
Figure 3).
The third main component is the acidic character of the cheese. The acidic and salty flavors are positively correlated with this main component, and the pH is negatively correlated. This main component allows us to differentiate MGC, which is a more acidic cheese, from FC and MC.
The olfactory profile of the cheeses was described by a panel of trained judges via two routes: the nasal route (
Figure 4a) and the retronasal route (
Figure 4b). The panelists detected the lactic and animal families as the dominant smells through the nasal route, followed by the fruity and spicy families. Of the lactic family, FC and CGC were the cheeses for which a higher percentage of judges detected their presence (52.63% and 51.43%, respectively). Animal smell was detected by 31.25% of the panelists in MC and by a similar percentage in CGC and FC (28.95% and 28.57%, respectively). Using the retronasal route, the panelists detected the smells more frequently, with the lactic and animal families being the ones that a higher percentage of judges identified. Fruit, spice and vegetable smells were detected more frequently in all cheeses by the retronasal route than by the nasal route. Via the retronasal route, the aromas of the lactic family were also perceived by a greater percentage of the panel judges (59.46%), followed by CGC (45.16%).
3.5.2. Consumer Acceptance
Results from the hedonic analyses measured both in blind (uninformed) and informed conditions with untrained consumers (n = 116) are shown in
Figure 5. The results of the acceptance tests with consumer judges showed that goat cheeses were moderately valued in the hedonic test (appearance, smell, flavor, texture and overall liking), with values above 6 points on a scale of 9 points. Several authors indicated a high overall liking in hedonic analyses when they obtained scores over 6 for different food products [
58,
59,
60,
61].
With respect to appearance, a higher score was obtained for MGC under blind and informed conditions (7.33 and 7.38, respectively) than rest of the cheeses, although no significant differences were found (p > 0.05). When consumers knew the characteristics of the cheeses (goat cheeses, raw milk cheeses and milk from native breeds from different regions of Spain), their assessment of the appearance of the cheeses did not change significantly.
In blind conditions, FC obtained lower smell scores than MGC (p < 0.05). However, under informed conditions, no significant differences were detected between the four cheeses studied. The information improved consumers’ assessment of the smell of FC.
In blind conditions, the judges did not give different scores for the flavor of the cheeses. In informed conditions, FC obtained better scores than MGC (p < 0.05). In the same way as for the evaluation of the smell, the information improved the evaluation of FC by consumers.
In both blind and informed conditions, the consumers gave better scores for texture acceptance for FC than MC and MGC (p < 0.05). Texture acceptance scores for CGC were also higher than for MC and MGC. In this case, however, the differences were not significant. As previously discussed, the textural properties of FC and CGC were more similar to each other than to those of MC and MGC, with the latter two being harder. The information did not significantly modify consumers’ assessment of the texture.
Finally, in blind conditions, there were no differences in overall liking between the cheeses studied. However, when consumers were informed, they preferred FC to MGC. Providing information to consumers worsened the overall liking of MGC.
A positive correlation was detected between appearance and smell (r = 0.954,
p < 0.05). A positive correlation was detected between overall quality and moisture and adhesivity (r = 0.973 and r = 0.985, respectively,
p < 0.05), and a negative correlation with hardness (r = −0.961,
p < 0.05) (
Table S8).
The results of the rank test, which was carried out in both blind and informed conditions, showed that there were no significant differences between the four cheeses studied. In the blind test, the FC was rated first, followed in order by MGC, CGC and MC. Under informed conditions, however, a change in the order of preference was observed among some of the cheeses: FC remained in first place and was still rated as the best by consumers. Second place went to the CGC, possibly because it was from a local breed from Madrid and was favored by the group of consumers who carried out the tasting. The MC and MGC obtained the lowest preference, meaning they were the cheeses most affected when the tasters knew the goat breed they came from. In any case, the differences were small, with no significant differences in the order of preference for the cheeses in either condition.
Furthermore, the lipolysis of triacylglycerols (TAGs) plays an essential role in the sensory properties of cheeses. Some FFAs have been shown to either directly contribute to the aroma characteristics of numerous cheeses or indirectly contribute as precursors of the compounds that are responsible for the aroma [
62]. In this study, MUFA and UFA content showed a significant negative correlation (
p < 0.05) with flavor (r = −0.967 and r = −0.992, respectively) (
Table S5). Few previous studies have been able to correlate the sensory attributes of goat cheeses, smell and flavor, with FFAs [
29].
The sensory properties of goat cheeses are an important factor for consumer acceptability and the marketability of the products. When cheese quality is analyzed on the market through surveys of consumer perceptions, selection, freshness and flavor were listed as the primary reasons for purchasing [
63]. The results of the sensory analysis showed the impact of information on the origin of the product producing a positive effect on the results related to flavor, appearance, texture, smell and the quality of the product.
This study presents the characterization of four goat cheeses made in artisanal dairies with milk from different indigenous goat breeds. To the best of our knowledge, this is the first work that has studied the physico-chemical, microbiological and sensory characteristics of cheeses made from the autochthonous goat breed of Madrid, Cabra del Guadarrama, and compared them with those of other Spanish goat breeds. The results show the high quality of the cheeses, which contributes to the conservation of these breeds, and confirms the need to raise consumer awareness of indigenous breeds in order to increase the consumption of these products.


