Review

What We Know About per- and Polyfluoroalkyl Contamination Levels in Milk. A Review from the Last Decade

Department of Veterinary Medicine and Animal Science, University of Milan, Via dell’Università 6, 26900 Lodi, Italy
*
Author to whom correspondence should be addressed.
Foods 2025, 14(13), 2274; https://doi.org/10.3390/foods14132274
Submission received: 31 March 2025 / Revised: 8 June 2025 / Accepted: 21 June 2025 / Published: 26 June 2025
(This article belongs to the Section Food Toxicology)

Abstract

Due to its nutritional value and versatility, milk is recognized to be one of the most widely consumed beverages worldwide, with a forecasted global consumption of 356 million tons in 2025. Recent updates in legislation and the assessment of their toxicological effects increased attention to the determination of per- and polyfluoroalkyl substances (PFASs), classified as “forever pollutants” for their stability and environmental spread in foods. The present review aims to collect all the information related to milk contamination reported by the scientific literature over the last decade and address the PFAS contamination levels around the globe. Twenty-two studies were found to be published about the detection of PFASs in milk in the period considered in this review, with a total of 824 analyzed samples on a global scale and a maximum of 60 investigated analytes. This review confirms that PFASs, including PFOA and PFOS, are detected in milk worldwide. However, the wide variability in reported concentration levels highlights a critical lack of consistent data and underscores the absence of coordinated, large-scale monitoring programs. This gap in surveillance significantly limits our understanding of actual exposure risks and reinforces the urgent need for comprehensive, systematic research across different regions and production systems.

1. Introduction

Among the most widely consumed beverages worldwide, dairy milk is recognized to be one of the most important ones, both for its nutritional value and versatility. In fact, for centuries, milk has been integral to human diets not only because it is rich in essential nutrients (e.g., calcium, proteins, vitamins, and minerals) but also for its role as a base for a variety of dairy products such as cheese, yogurt, and butter, playing a key role in the diets of millions, especially for infants and young children [1]. Trends in global milk consumption show stable growth from 2019 and forecast a global consumption of 356 million tons of milk in 2025 [2].
As the global demand for milk and dairy products continues to increase, concerns about milk contamination and related potential human risks have emerged as significant health issues. Contaminants can be present in milk and dairy products through multiple pathways, including feed, water sources, and dairy cows [3,4].
Due to recent updates in legislation and the assessment of their toxicological effects, great attention has been paid to the determination of per- and polyfluoroalkyl substances (PFASs) [3]. PFASs are classified as “forever pollutants” because of their stability and widespread environmental impact. Moreover, these contaminants are known for their ability to move across the environment and accumulate throughout the food chain [5]. While PFAS can cycle through water, soil, and food chains, affecting human health via various exposure routes, diet and drinking water remain the primary sources of human PFAS exposure [6,7]. Estimates show that 60–98% of the total PFAS daily exposure for humans can be linked to dietary contribution [8], and the European Food Safety Authority (EFSA) has designated milk and dairy products as significant sources of PFAS chronic exposure for sensitive populations [9].
Diet exposure may occur through both direct environmental contaminations, affecting raw and non-processed foods, and indirect exposure from PFAS present in food contact materials, a pathway that remains controversial [10]. Concerns are linked to PFAS’s ability to act as endocrine disruptors, and to affect the human immune, endocrine, and reproductive systems [7]. Moreover, there is increasing concern on the topic since the “International Agency for Research on Cancer” (IARC) categorized perfluorooctanoic acid (PFOA) as “carcinogenic to humans” (Group 1), and perfluorooctanesulfonic acid (PFOS) as “possibly carcinogenic to humans” (Group 2B) [11].
Several approaches have been used worldwide to limit and contain the damage caused by PFAS, including restricting or eliminating their use in common materials, and allocating funds for remediation efforts [12]. At the European level, authorities began monitoring PFAS contamination in 2004, and in 2008, the European Union (EU) introduced regulations on PFOS production and commercialization, valid until 2019, which was then replaced by the “Regulation (EU) 2019/1021,” which prohibits the manufacturing and sale of PFOS and its derivatives (with some exceptions) [13]. Moreover, in 2008, EFSA issued a scientific opinion on PFOS and PFOA, acknowledging that the contribution of PFAS precursors to environmental contamination was not fully understood [14]. In 2018, EFSA assessed human health risks from PFOS and PFOA in food, noting widespread exposure in blood samples and emphasizing the need for new analytical methods and legislative measures [15]. In 2020, the EFSA Panel on Contaminants in the Food Chain (CONTAM) published a scientific opinion assessing the health risks of four PFAS compounds (PFOS, PFOA, perfluorononanoic acid (PFNA), and perfluorohexanesulfonic acid (PFHxS)) in food, establishing a tolerable weekly intake (TWI) for their sum of 4.4 ng per kg of body weight per week [16]. Consequently, the EU Commission established maximum levels (ML) for these four PFASs (singularly and as a sum) in certain foods [17]. Despite all the legislation mentioned before, there are still no limits set for PFASs in milk and dairy products, but the Commission Recommendation (EU) 2022/1431 established guideline values [18].
In scientific literature, studies [19,20,21,22] have demonstrated that PFASs are capable of binding to β-lactoglobulin proteins in milk, and consequently that dairy milk can become a reservoir for PFAS. This underlines the importance of better understanding how PFAS can accumulate in milk and dairy products (transfer of PFAS from feed to cows, production process, packaging) [4], and collecting the available data on the global contamination levels to provide useful information that might support PFAS regulation in this matrix.
The present review aims to provide a comprehensive and up-to-date overview of the topic and collect most of the information related to milk PFAS contamination reported by the scientific literature over the last decade, considering (i) the main methodology and investigated analytes; (ii) the number of samples analyzed on a global scale; and (iii) PFAS contamination levels of milk around the globe. Moreover, this review could provide useful insight for those who want to evaluate a risk characterization for humans based on milk consumption, addressing and considering the most recent data available in scientific literature. This review focuses on literature from the past ten years to ensure relevance, accuracy, and alignment with current scientific and regulatory standards. Advances in analytical technologies over the last decade have significantly improved the sensitivity and specificity of PFAS detection in complex matrices like milk. Furthermore, recent studies reflect updated regulatory priorities, including monitoring both legacy and emerging PFAS compounds. Limiting the scope to the most recent decade also accounts for changes in contamination sources and industrial practices. Additionally, contemporary sample preparation techniques enhance comparability and data quality across studies. Finally, this time frame provides a manageable and focused dataset, allowing for a clearer synthesis of current knowledge and identification of research gaps in PFAS detection across different milk types.

2. Materials and Methods

This review selected publications based on scientific studies, considering ten years (2014–2024), and the first trimester of 2025, and excluding both non-peer-reviewed studies and studies not available in English. The literature search was performed by using bibliographic databases, such as PubMed, Scopus, and Google Scholar. The different keywords used were PFASs, milk, PFASs “and” milk, PFASs “and” dairy, PFASs “and” goat, PFASs “and” sheep. To enrich the information, we included in this review studies with a reduced number of samples. The studies that did not report the number of milk samples analyzed were cited but excluded from the discussion of this review. The initial search for studies on PFAS in milk yielded 117 results in PubMed and 164 in Scopus. A broader search conducted using Google Scholar returned approximately 24,800 results. However, the majority of these were found to be irrelevant to the specific focus of this review and were rapidly screened out during the initial assessment phase. The authors performed the research on each database and screened each work independently. The selected studies were then discussed in pairs. Applying our inclusion criteria, excluding the duplicates, 22 studies were selected for this review.
We acknowledge that restricting the research to only original articles (published in English) and not considering also institutional reports might lead us to underestimate the number of samples. Nevertheless, we are confident that none of these methodological limitations would change the overall conclusions of this review.
Abbreviations of the analytes cited in this review are reported in the Abbreviations section at the end of the document.

3. Results

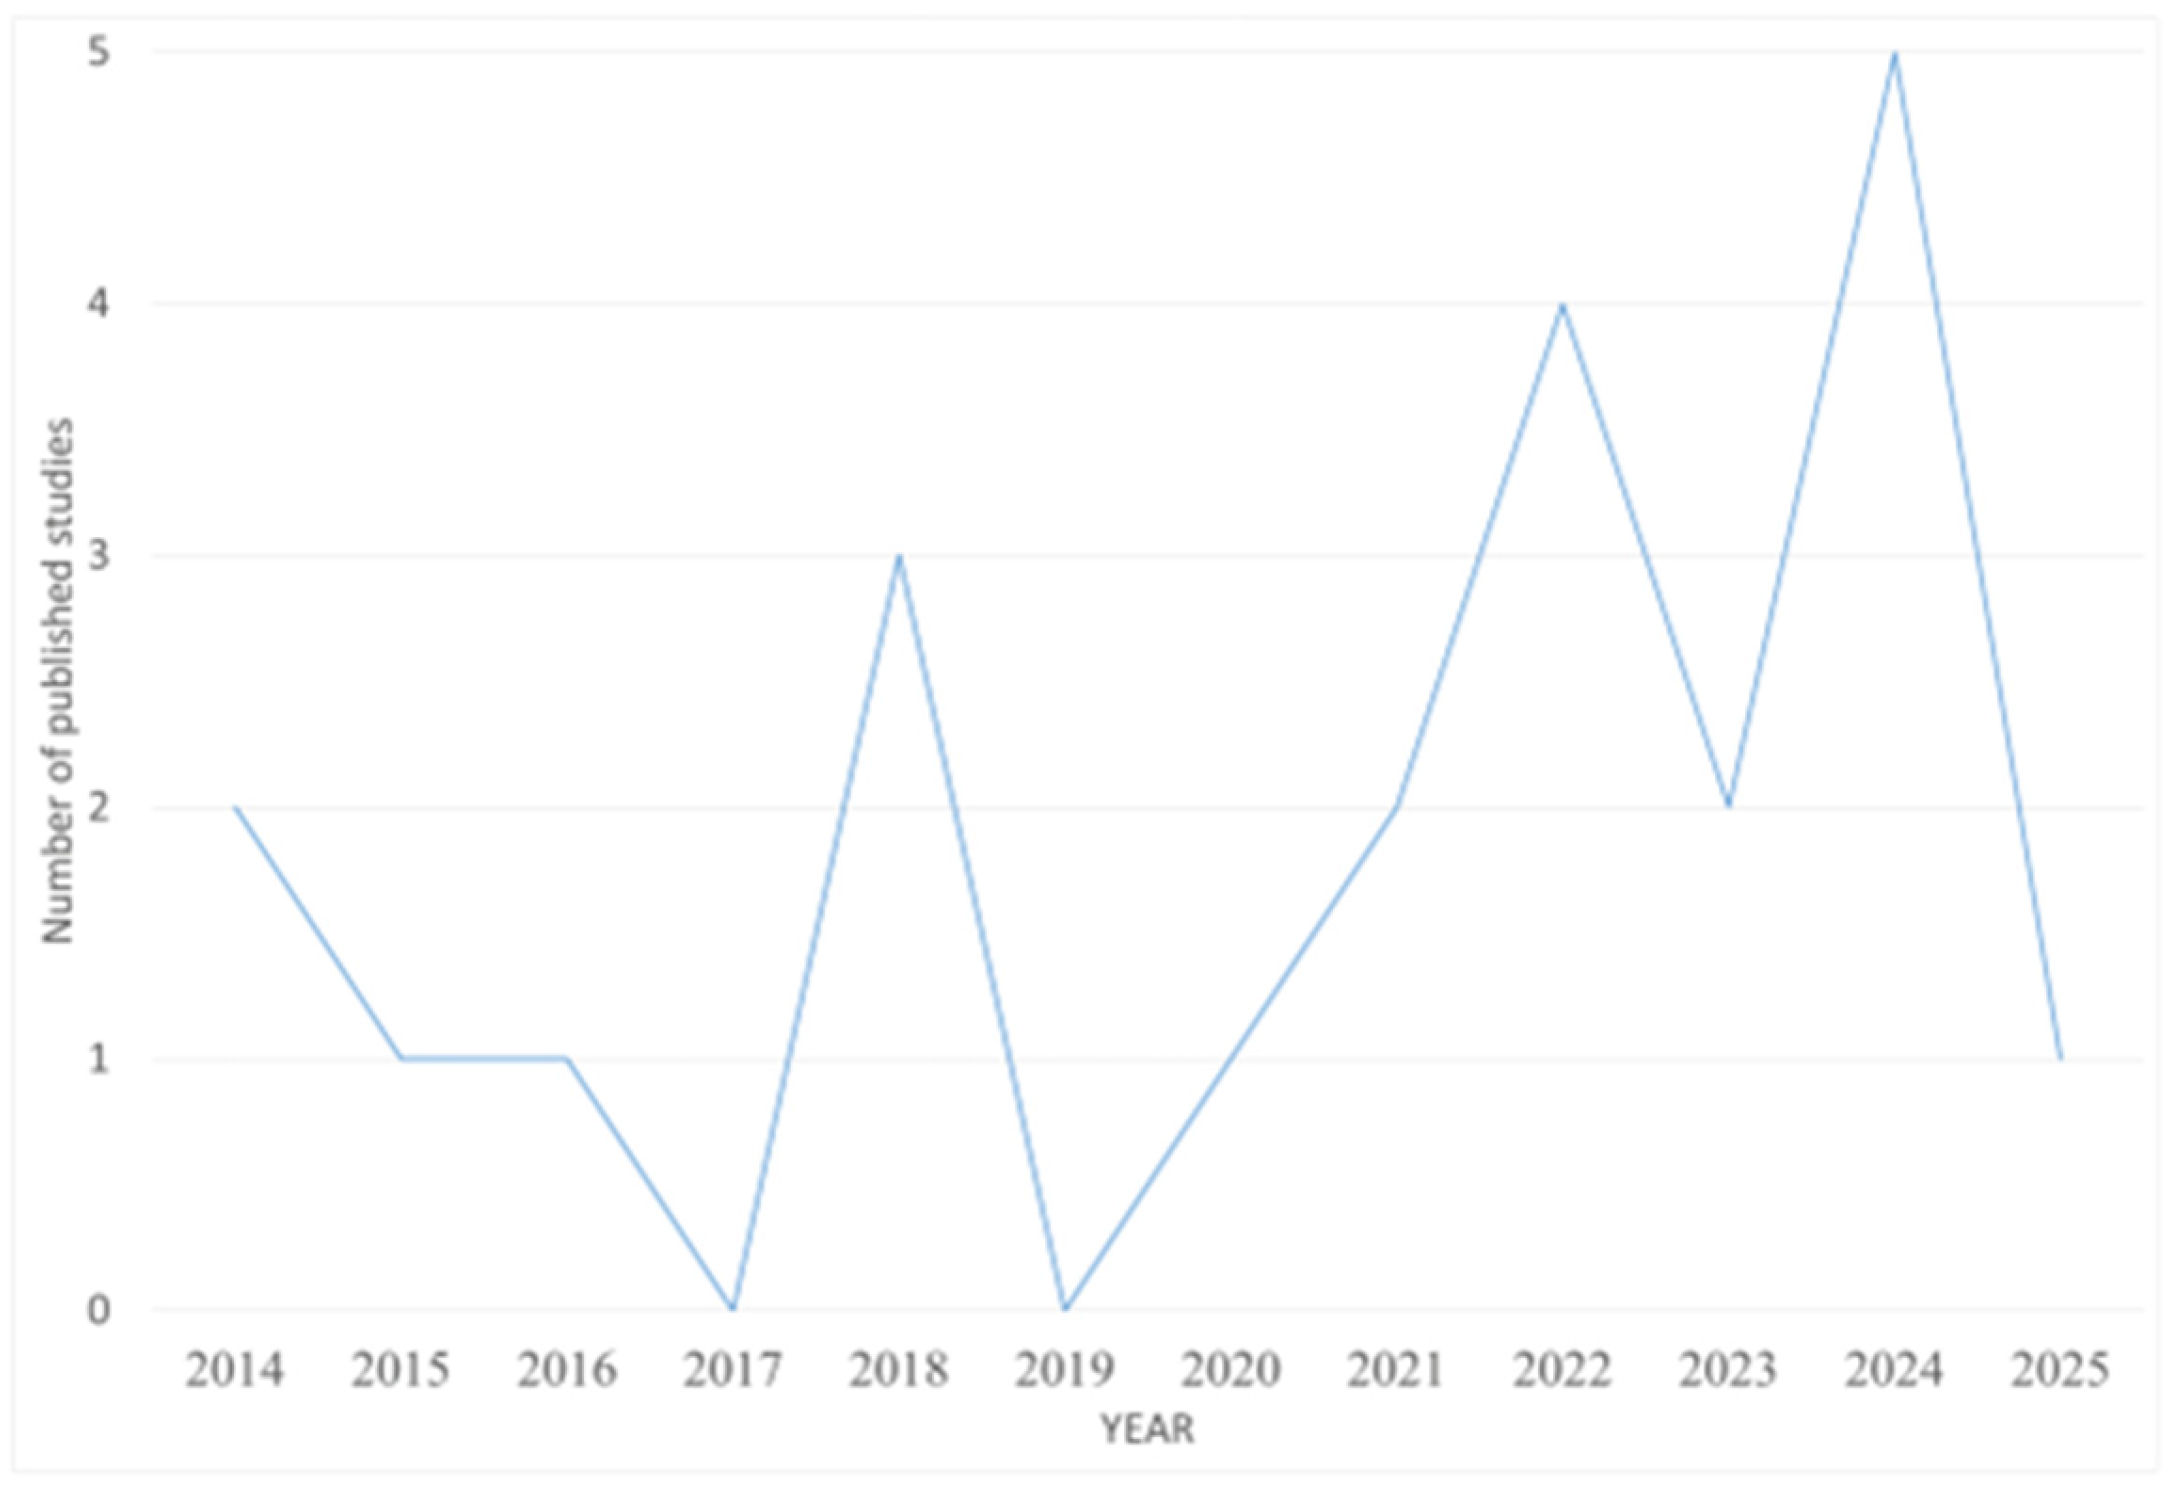
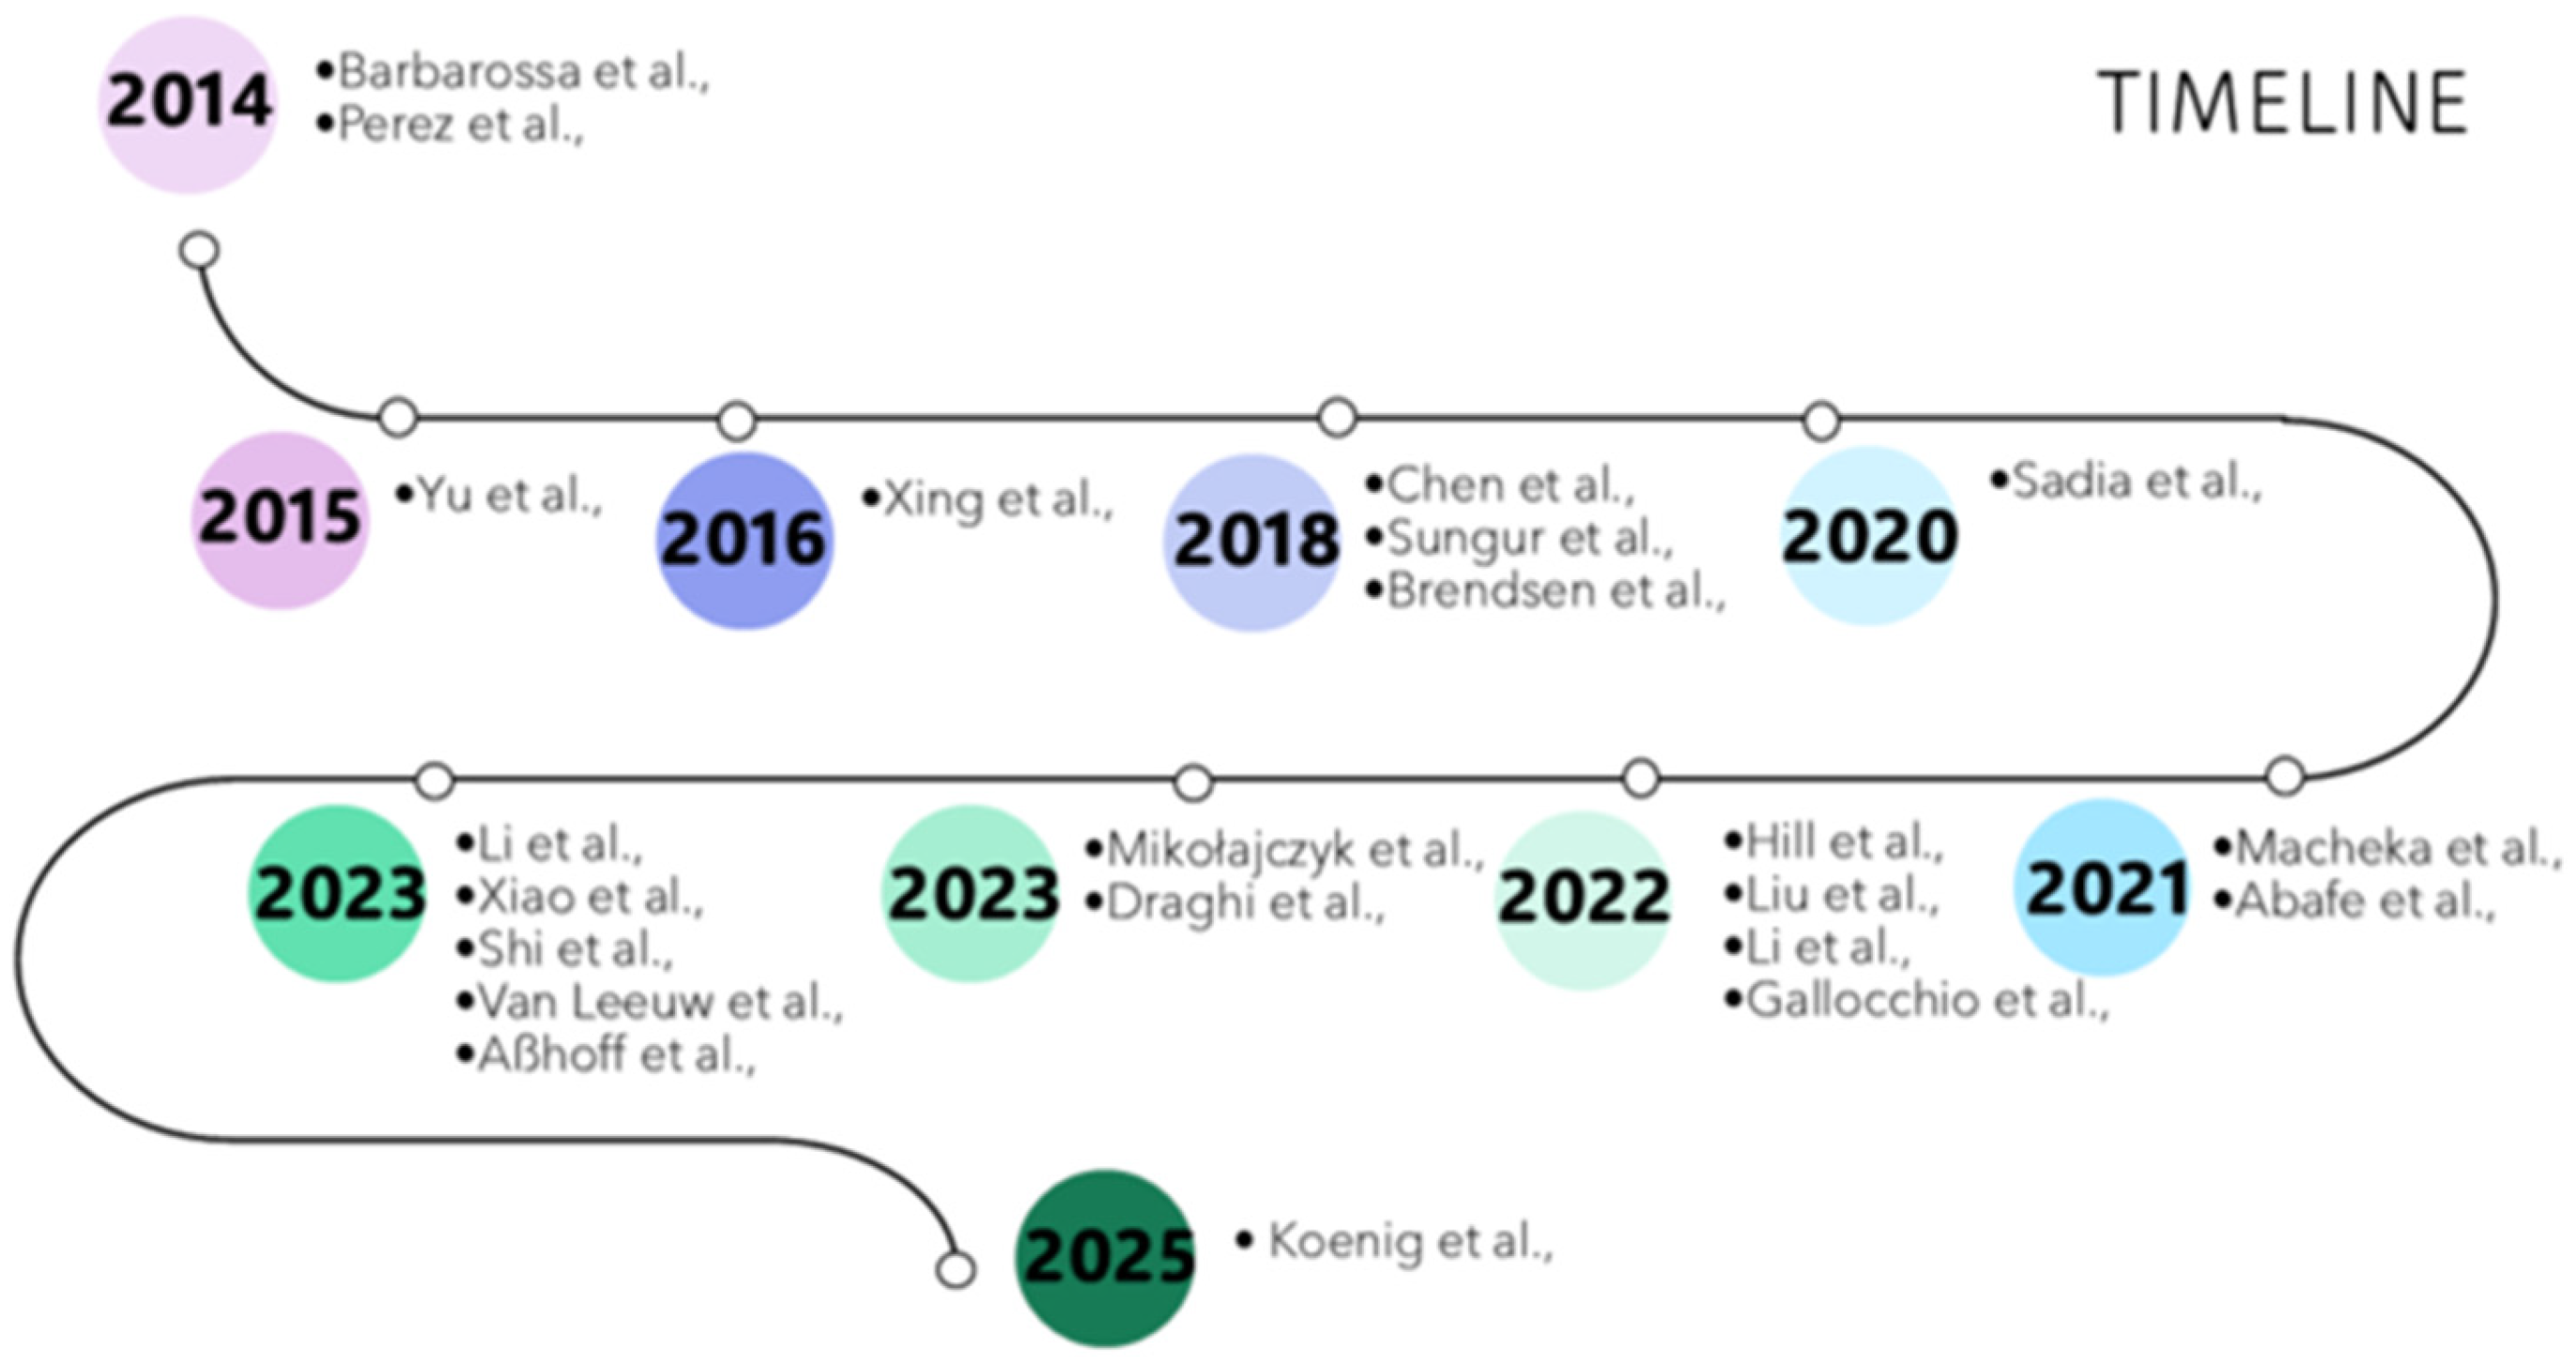
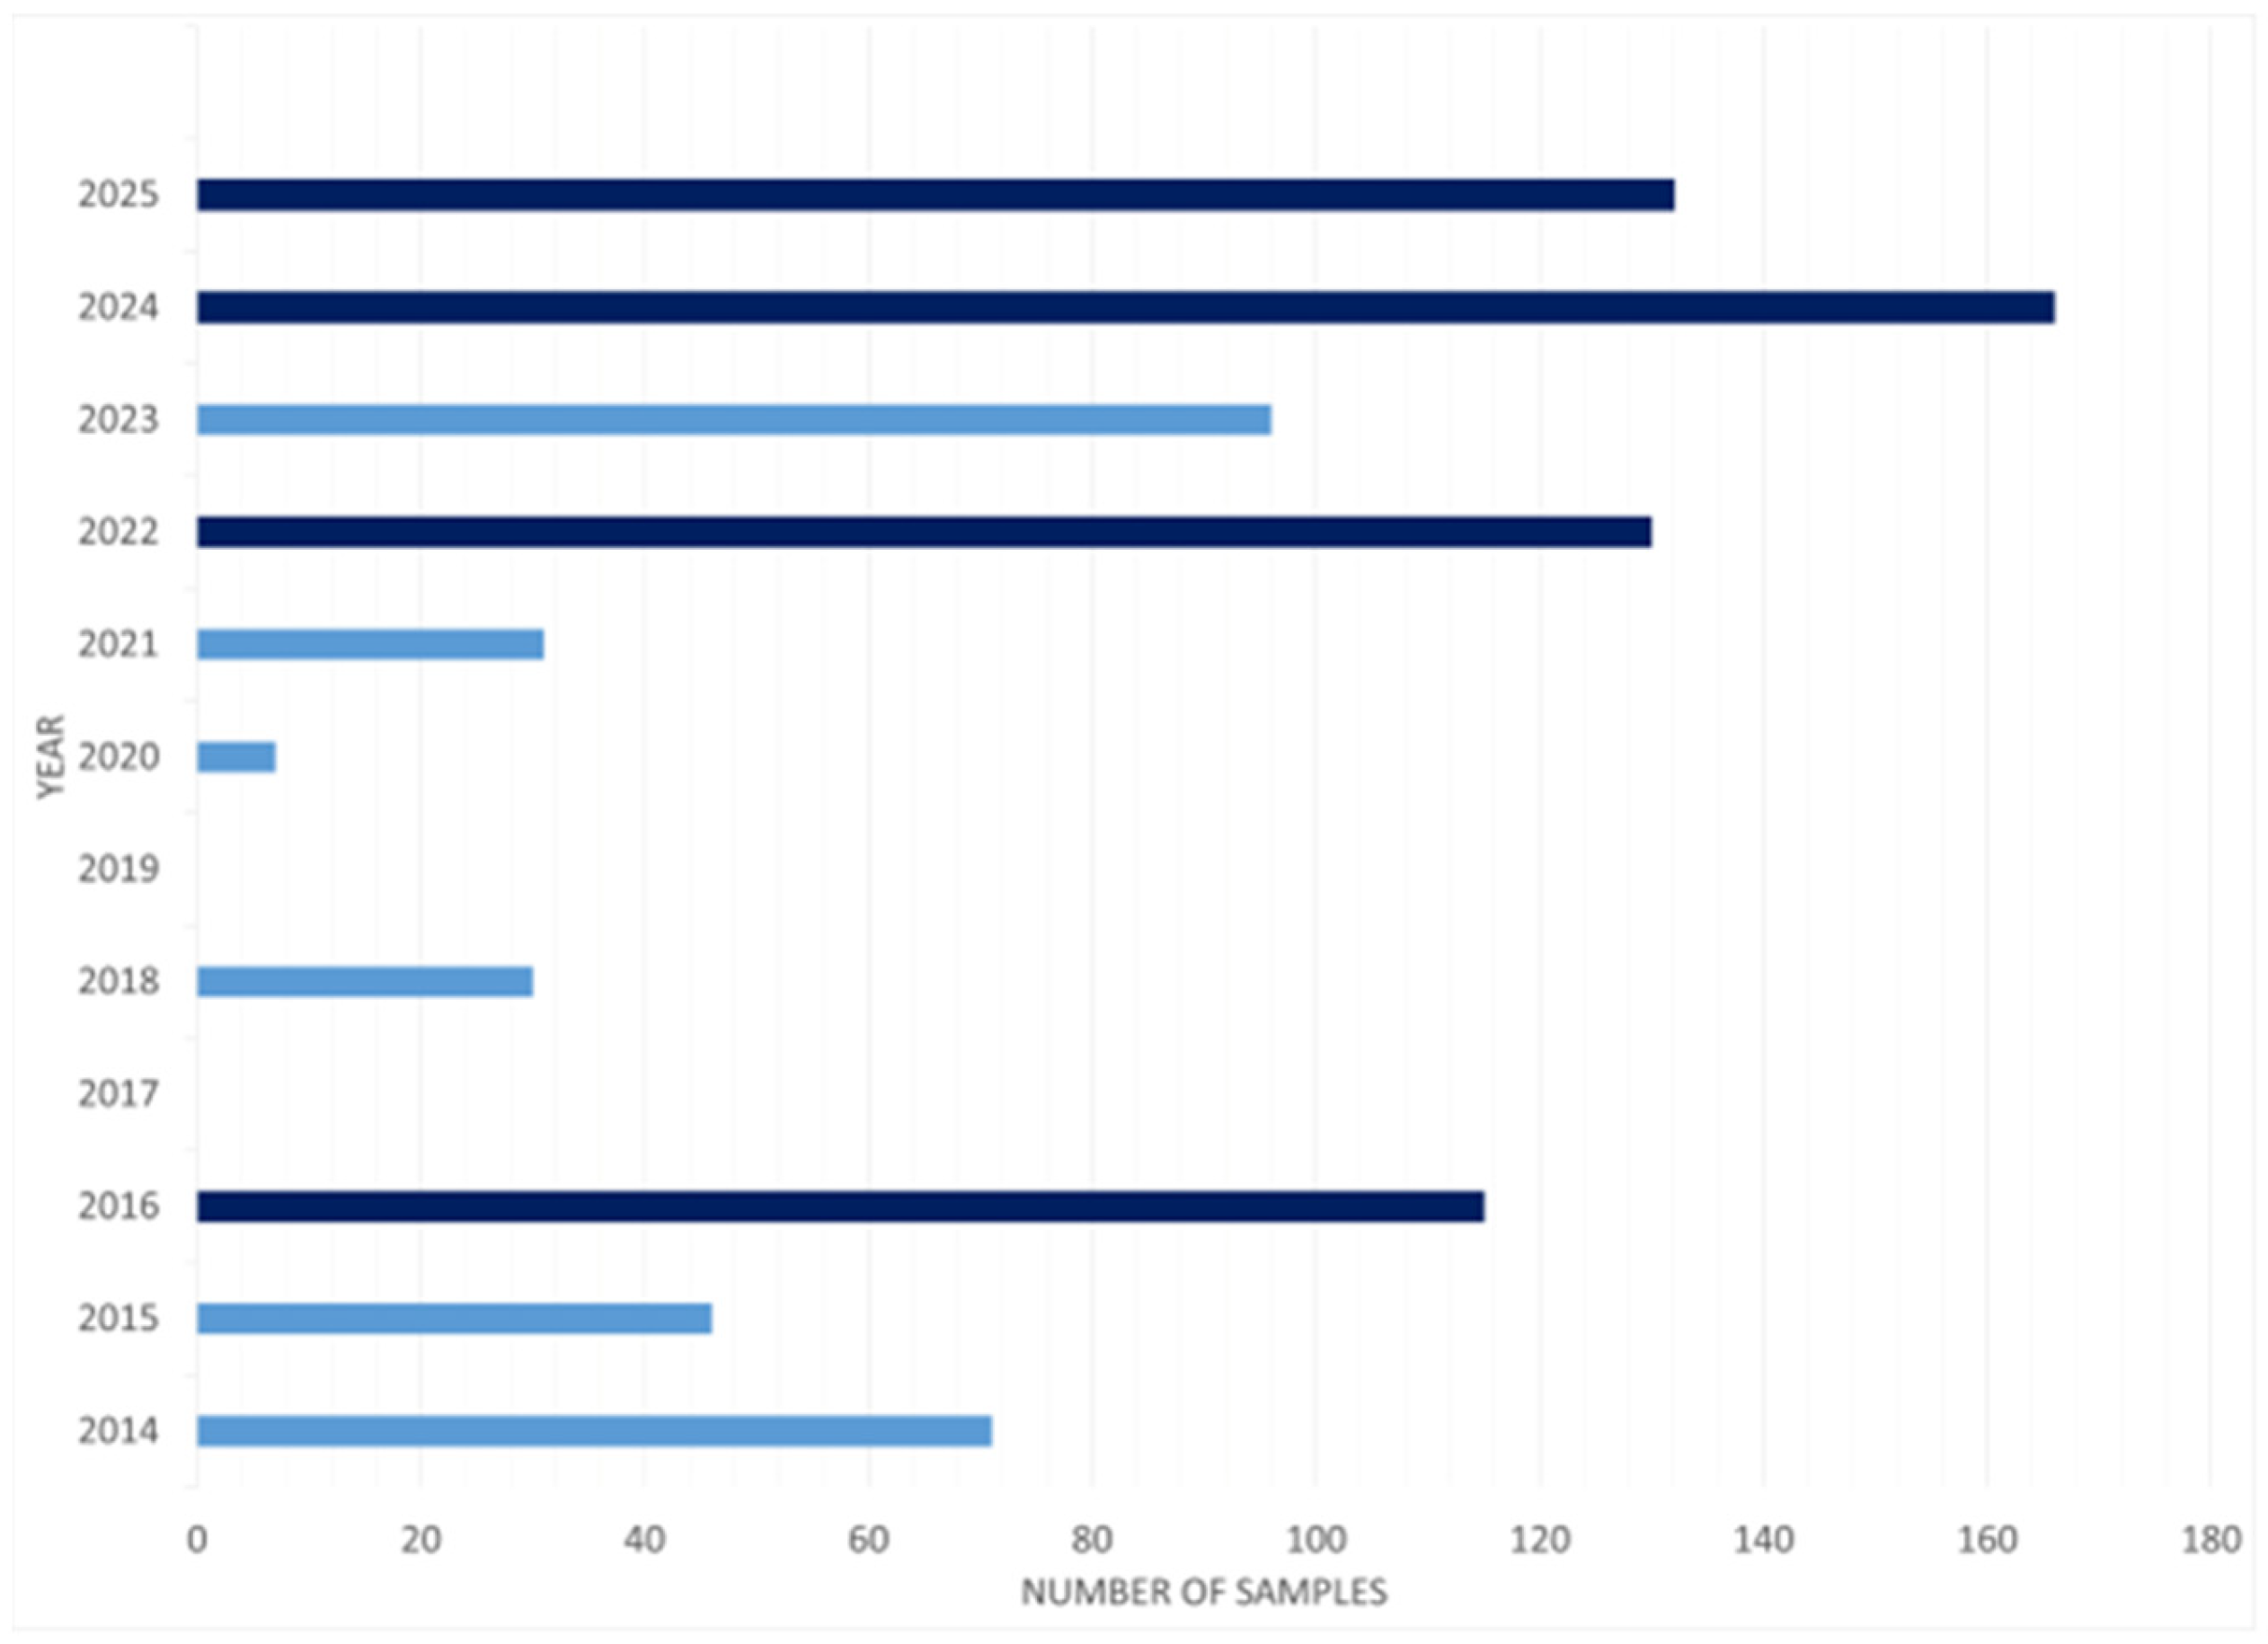
3.1. Literature Overview

Considering our selection criteria, 22 studies were found to be published about the detection of PFASs in milk in the period considered in this review (Figure 1 and Figure 2). Detailed information is reported in Table 1.
Current methods for detecting PFASs in milk rely on HPLC-MS/MS. Due to the amphipathic PFAS characteristics, they can accumulate in both protein and fat; therefore, precise sample preparation is crucial to accurately detect and quantify these analytes [31]. Table 1 shows that different PFAS extraction techniques have been explored. The extraction protocol usually involves two steps: firstly, a liquid extraction; and secondly, a clean-up step performed by SPE. However, some studies performed the extraction and purification in one step by using a QuEChERS method.
Considering the investigated analytes (Table 2), while all the studies involved PFOA and PFOS, five of them [23,26,28,29,30] did not consider all the four main PFASs (PFOA, PFOS, PFNA, PFHxS) (Table 1). Perfluorocarboxylic acids and perfluoroalkyl sulfonic acids were included in all the studies; however, only a few of them considered fluorotelomers, which can be industrially used as an alternative to PFOA and PFOS. The highest number of analytes investigated was by Li et al. 2024 [37], who developed a method able to discriminate between 60 PFASs in milk.

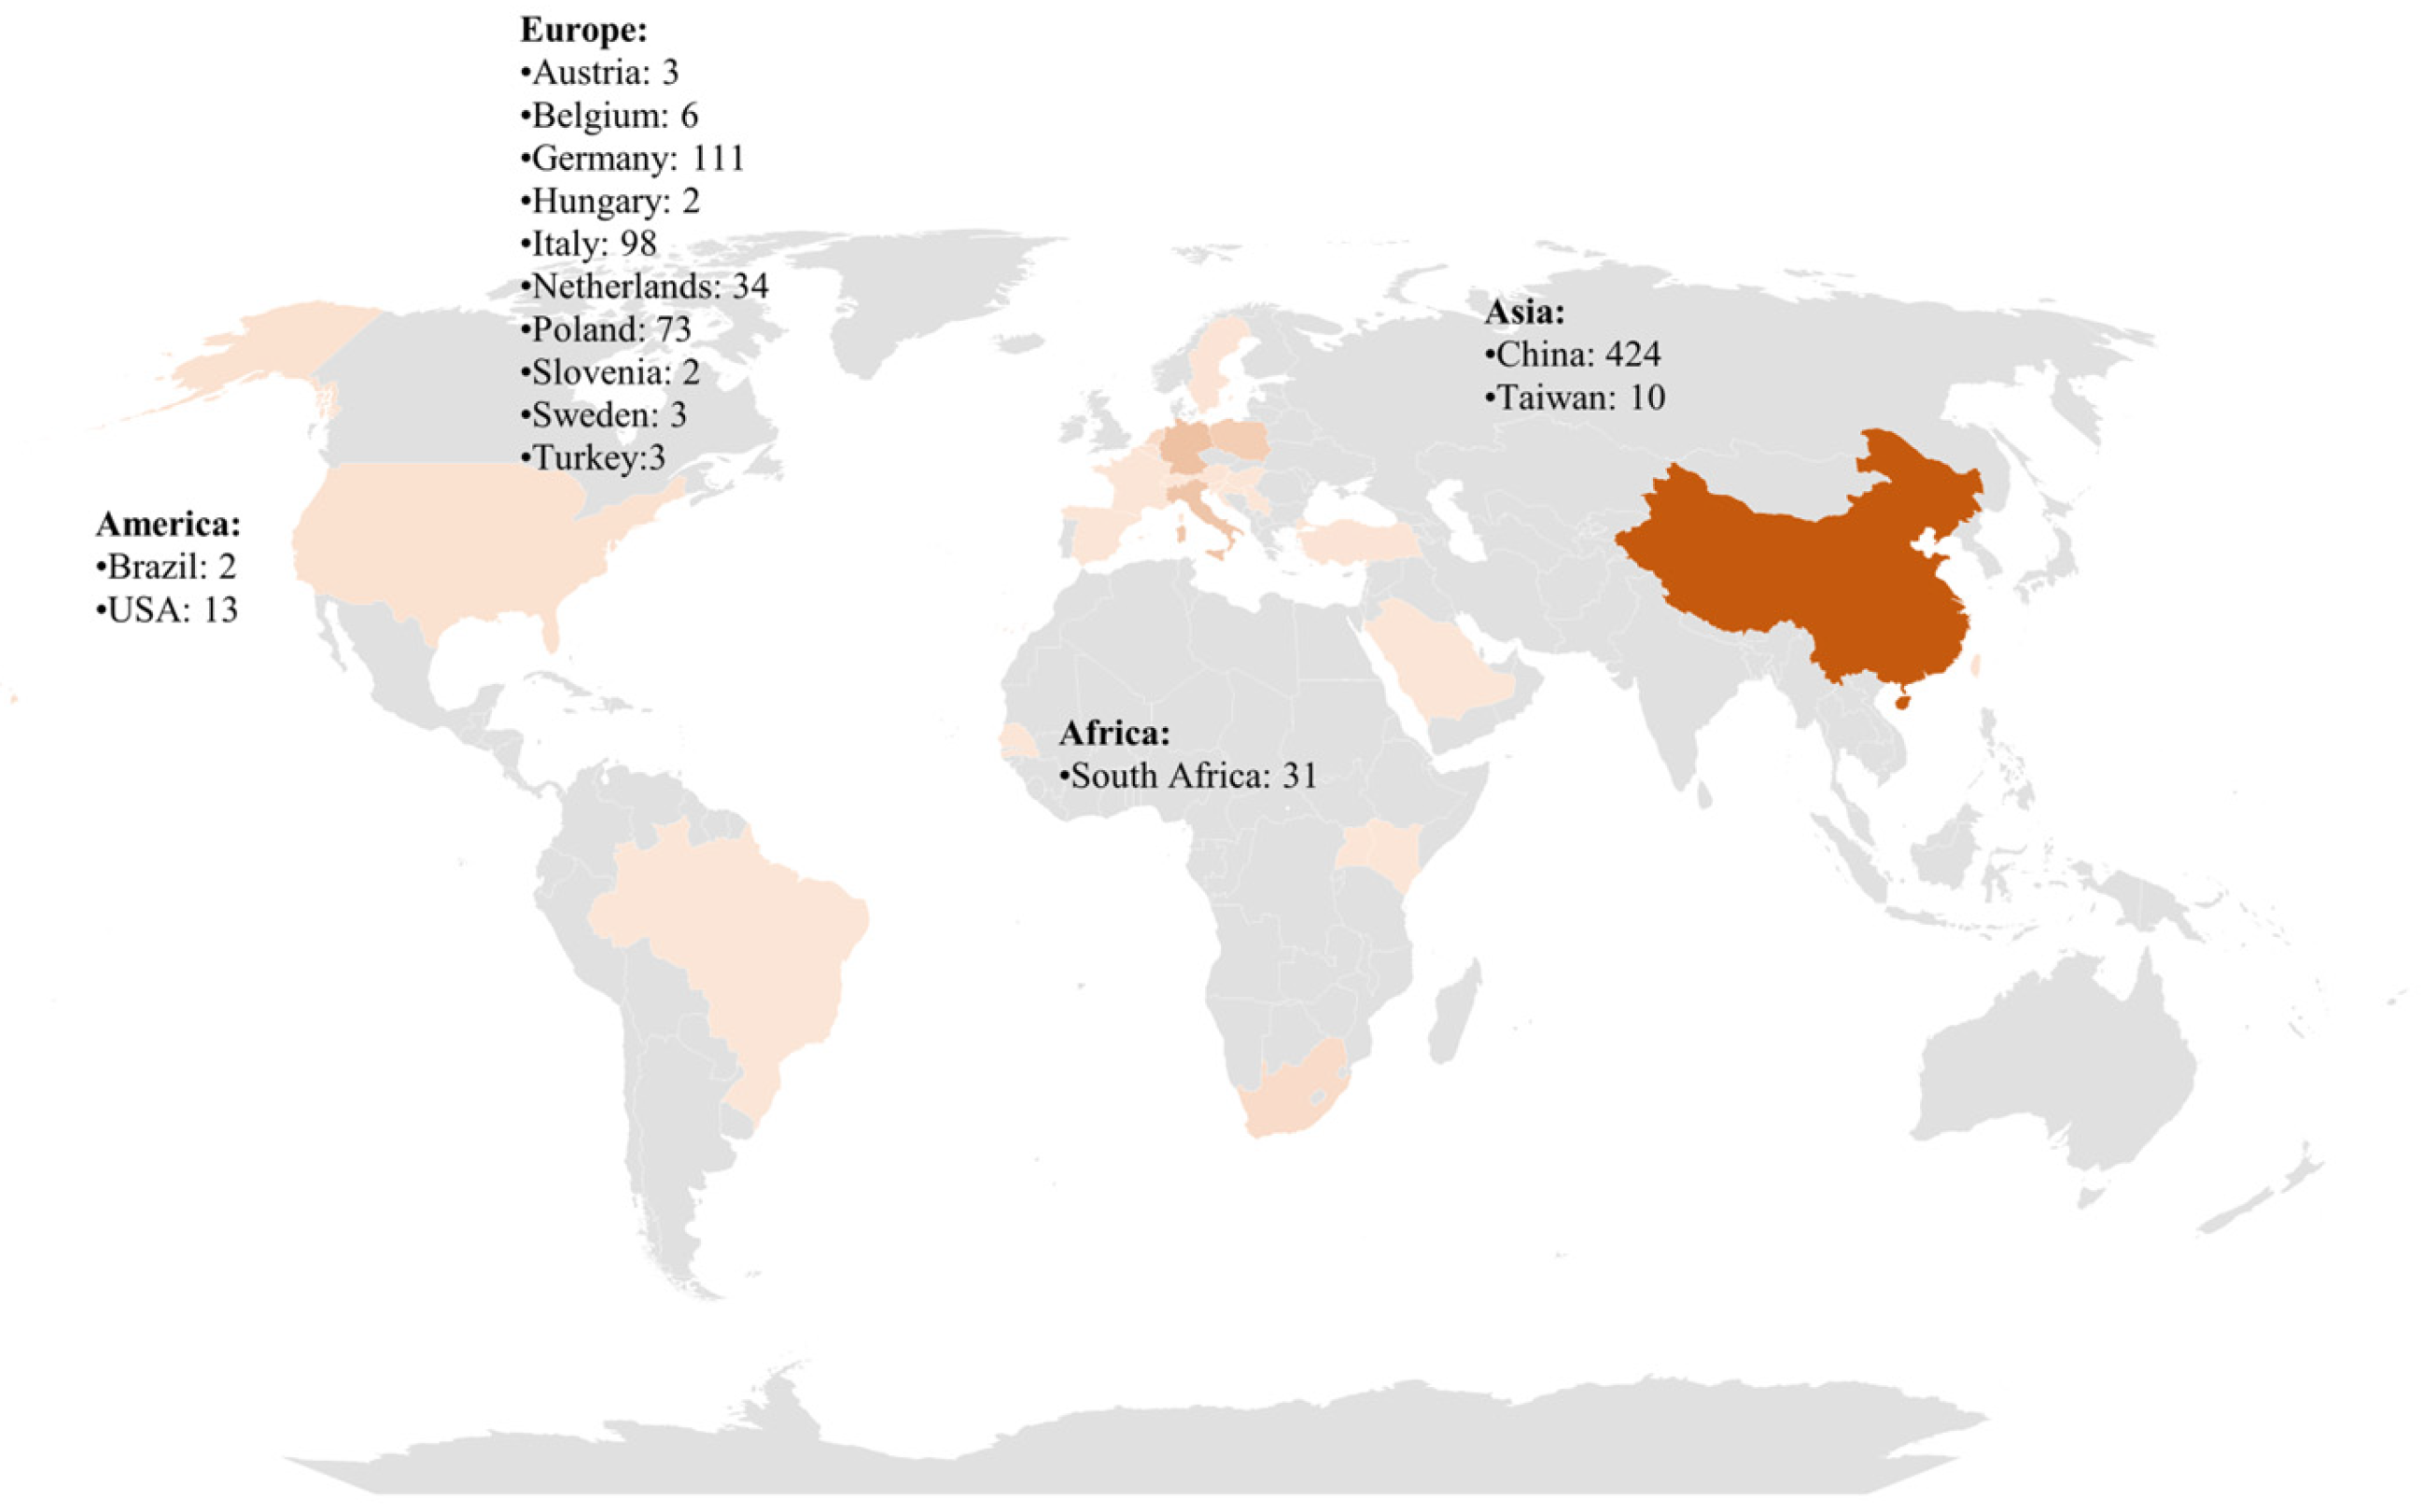
3.2. Incidence of PFASs in Milk Around the World

A total of 824 milk samples were analyzed in the period between 2014 and 2025 (Figure 3 and Figure 4), also including 22 goat and 15 sheep milk samples. In the following paragraphs, we summarize the main findings of the 22 selected studies divided by the origin of the samples collected. Moreover, in Table S1, we collected all the information provided by the several considered studies regarding the concentration of the four main PFASs (PFOA, PFOS, PFNA, PFHxS). In this table, provided in the Supplementary Materials, we reported the results as they are shown in the original article, without changing the measurement units.

3.2.1. Africa

Two studies published in 2021 report the detection of PFASs in milk and infant formula available on the South African market. In particular, Macheka et al. 2021 [8] analyzed the presence of 15 PFASs in 23 dairy milk samples distributed as follows: five fat-free, eight low-fat, seven full cream, and three lactose-free. Their findings showed that the sum of the 15 analyzed PFAS in the dairy milk ranged from 0.08–15.51 ng mL−1 with PFBA, PFPeA, PFuDA, PFTrDA, and PFDoA being the most prevalent PFASs and a detection frequency of ≥96%. Despite the decrease in the PFAS concentrations from full cream to low fat, no statistically significant difference was reported for the different types of milk.
Moreover, Abafe et al. 2021 [31] developed a method to assess the presence of 15 PFASs in milk and infant formula, applying it to eight pooled dairy milk samples. The analytes detected more frequently in retail milk were PFDA, PFuDA, PFDoA and PFTrDA. This study reported that the presence of perfluoro carboxylic acids was prevalent compared to perfluoroalkylsulfonic acids. Detailed information related to the concentration of the four main PFASs is reported in Table S1 provided in the Supplementary Materials.

3.2.2. America

Hill et al. 2022 [4] improved a sensitive method to detect 27 PFASs in milk and applied it to 13 milk samples collected from six states across the United States. In particular, samples were collected from dairy farms that confirmed the use of biosolids on cropland or were within geographic proximity to military installations with confirmed aqueous film-forming foam (AFFF) use. The only analyte detected in this study was 6:2 FTS at a concentration of 6.6 ng L−1, while no other PFASs were detected in the study. Detailed information related to the concentration of the four main PFASs is reported in Table S1 provided in the Supplementary Materials. According to the USA, the Food and Drug Administration (FDA) has been testing food for the detection of PFASs since 2019, with most of them collected for the total diet study. Eight sets of data have been published since then, and three milk samples have been analyzed throughout these years in each dataset. The results were always below the method detection limits [43].

3.2.3. Asia

Eight studies have been published over the last decade on the detection of PFASs in milk samples collected in Asia. Firstly, Yu et al. 2015 [25] analyzed 46 cow milk samples from different brands purchased in sampling sites in China in the provinces of Shandong, Anhui, Liaoning, Fujian, Jiangxi, and Guangdong. In total, 16 out of the 20 investigated PFASs were found in the samples. PFBA, PFNA, PFHxDA, and PFTrDA were the most frequently detected compounds (89% of the milk samples), while the total concentration of PFASs ranged from 0.19 to 0.66 μg L−1.
Xing et al. 2016 [26] assessed the presence of PFOS and PFOA in milk by analyzing 115 samples, divided as follows: 24 raw milk and 91 retail milk from 8 different producing areas in the Chinese autonomous region of Xinjiang. Both the analytes were found in retail samples, while in raw milk PFOA was not detected. The percentage of the quantifiable samples was 33% and 39.6% for PFOA and PFOS in retail milk, respectively, while it was 12.5% for PFOS in raw milk. The mean concentrations detected were 16.2 and 24.5 ng g−1 for PFOA and PFOS in retail milk, respectively, while it was 2.2 ng g−1 for PFOS in raw milk. In this study, no correlation was found between the measured concentrations of the two compounds in each sample.
Chen et al. 2018 [27] detected and quantified 7 PFASs in different food items, including 10 milk samples, purchased from Taiwan. According to the results, the median concentration levels were 0.01, 0.03, 1.70, 1.54, 0.02, and 0.07 ng mL−1 for PFHxS, PFHxA, PFOA, PFDA, PFUnDA, PFDoDA, respectively, while PFOS was not detected. The number of milk samples analyzed by Li et al. 2022 [33] was four (two raw milk, two bagged milk), with all being obtained from local farms and markets. In this study, the most detected compound was PFOS, while PFPeA was detected in only one bagged sample.
Liu et al. 2022 [34] investigated the occurrence of 16 PFASs in 107 raw milk samples purchased from nine Chinese provinces, investigating potential correlations between PFAS concentrations in milk and cow feed. The study showed a detection frequency of 96.3% for PFASs in milk samples with PFOS (67.5%) and PFBA (12.8%) as prevalent compounds, with sum concentrations of the analyzed PFASs ranging from below the method detection limit to a maximum of 9.82 ng g−1. The highest detected concentration is related to PFOS (9.19 ng g−1).
Li et al. 2024 [37] developed a method to determine 60 PFASs in milk purchased in Beijing, China and applied it to 35 milk samples. Among all the investigated PFASs, only PFBS, PFHxS, PFOS, PFNS, PFPeA, PFOA, PFNA, and 6:2 FTS were detected.
Xiao et al. 2024 [38] investigated the occurrence of PFAS in cow feed, drinking water, and raw milk, exploring the passage of PFAS through these matrices. In this study, 92 raw milk samples were analyzed from 20 provinces across China. Seven PFAS were detected in raw milk with a mean concentration of ∑PFAS of 0.15 ± 0.13 ng mL−1, with the highest detection frequency for PFOS and PFOA. In particular, PFOA (0.08 ± 0.09 ng mL−1) was the most significant compound in raw milk, contributing to 51.5%.
Shi et al. 2024 [40] developed a method to detect 22 PFASs in milk and applied it to analyze 25 milk samples (whole milk, low-fat milk, skim milk, and fresh milk). The detected PFASs were PFBA and PFOA, with detection frequencies of 67% and 10%, respectively. Detailed information related to the concentration of the four main PFASs is reported in Table S1 provided in the Supplementary Materials.

3.2.4. Europe

The first study published on the topic, considering ten years from 2014 to 2025, is by Barbarossa et al. 2014 [23], who performed the first monitoring study on the presence of PFOS and PFOA in cow milk available in the northern Italian market on a large scale. This study investigated 67 samples: 22 samples obtained from different stores in the Bologna areas, and 45 samples (8 organic milk; 37 from farms with high hygienic and nutritional standards) represented all producers supplying milk to two dairy plants in Lombardy and Emilia Romagna. According to the findings, PFOS was present in 43% of the samples, with a maximum concentration of 97 ng L−1, while PFOA was present in 40% of the samples, with a maximum concentration of 32 ng L−1. No correlation was found between the type of milk and the detected levels of contamination.
Sungur et al. 2018 [28] investigated the presence of PFOA and PFOS in Turkish brands of food and beverages available on the Turkish market, including three milk samples, detecting an average PFOS concentration of 0.100 ng g−1, while PFOA was not detected. Berendsen et al. 2018 [29] presented a study in which they developed a sensitive method for 13 PFASs in milk, applying it to 17 milk samples (16 cattle, 1 goat) purchased from the Netherlands. The real case application was focused on the detection of PFOA and HFPO-DA only, which were not found in the samples. Gallocchio et al. 2022 [32] developed a fast method to determine 14 PFASs in food of animal origin, including cow’s milk, and applied it to 6 milk samples. No PFASs were found (<LOD).
Mikołajczyk et al. 2023 [35] analysed 73 milk samples to determine the presence and concentration of 14 PFASs. Samples were distributed as follows: 38 cow, 20 goat, and 15 sheep milk samples, all gathered from several regions of Poland. Results showed that the lower-bound concentration sum of the four regulated PFAS (∑4 PFASs: PFOA, PFOS, PFNA, PFHxS) were 0.0055, 0.0046, and 0.0008 µg kg−1 in sheep’s, goat’s, and in cow’s milk, respectively. Among them, linear PFOS was the most detected, with detection percentages of 33%, 76%, and 93% of cow’s, goat’s, and sheep’s milk samples, respectively. Considering the other investigated PFASs, the predominant was PFTeDA, the highest concentration of all 14 investigated PFASs, peaking in sheep’s milk at a mean of 0.0073 µg kg−1.
Draghi et al. 2023 [36] evaluated the distribution of 14 PFASs in the 3 milk fractions (whole milk, skim milk, and cream), collecting the samples from 23 cows in northern Italy. In this study, PFBA was shown to be the most frequent PFAS detected in all three fractions, followed by PFOS and PFOA. According to the four regulated PFASs, the highest detected concentration was related to PFOA in the skimmed fraction (1002.70 pg g−1), while PFHxS was detected only in the cream fraction. Moreover, they found a significant difference in PFOS concentrations, which was significantly higher in milk cream than in skimmed and whole milk. Ten milk samples, collected from the German market, were analyzed by Aßhoff et al. 2024 [41]; in this study, PFOS was detected in seven samples, but only quantifiable in three samples of them (concentration range of 9.0–13 ng L−1). PFHxA was also detected in one sample.
Van Leeuw et al. 2024 [39] analyzed 17 milk and milk products, including 4 milk samples, to investigate the presence of 25 PFASs collected from the Belgian market. In this case, all the investigated analytes were always detected below the LOQ. The first study published on this topic in the first trimester of 2025 was by Koenig et al. [42] who analyzed 132 milk samples collected from the German market. According to the samples provenance they were distributed as follows: 2 Hungary, 2 Slovenia, 1 Switzerland, 3 Austria, 17 The Netherlands, 1 Croatia, 2 Italy, 1 France, 2 Belgium, and 101 Germany. Considering the four main PFASs, the detected percentages were 98.4%, 96.2%, 2.27%, and 47%, for PFHxS, PFOS, PFOA, and PFNA, respectively. These analytes were detected with a median concentration sum of 4.57 ng kg−1 (range 0.941–137 ng kg−1). This study included also one goat’s milk sample, which showed a maximum concentration of 137 ng kg−1 for the four main PFASs (PFOA, PFOS, PFNA, PFHxS). Detailed information related to the concentration of the four main PFASs is reported in Table S1 provided in the Supplementary Materials.

3.2.5. Others

Two studies assessed the presence of PFASs in milk samples collected from different nations.
Pérez et al. 2014 [24] assessed the presence of 21 PFASs in several food items taken from different countries including Brazil, Saudi Arabia, Spain, and Serbia. Among these items, they analyzed four milk samples (one concentrated milk sample from Brazil, one whole milk from Saudi Arabia, one sterilized and one fresh milk from Serbia). In this study, they reported the summary of the concentrations of target compounds (pg g−1) in positive samples but did not show the specific food item. As a general conclusion, it is possible to note that, according to their lipophilicity, PFOA was mainly found in skimmed milk, whereas PFOS was present in whole milk.
Sadia et al. 2020 [30] developed a method for the detection of five PFASs (PFOS was analyzed as l- and br-PFOS) in different food items and applied it to seven milk samples from different countries (Sweden, Kenya, Senegal, Uganda, and Brazil). The highest concentration was found for PFOS in a sample from Kenya (89.9 pg g−1). However, due to the small sample size, the detected concentrations might be considered indicative, but not representative of the national average concentration.
Detailed information related to the concentration of the four main PFASs is reported in Table S1 provided in the Supplementary Materials.

4. Discussion

4.1. Understudied Exposure: PFAS in Milk Amid Widespread Consumption

Milk—whether from cows, goats, or less conventional sources—has long been a cornerstone of human nutrition, yet its role as a potential vector for environmental contaminants like PFAS calls for closer and more comprehensive examination. A recent review has substantially deepened our understanding of PFAS contamination in human breast milk [44], highlighting early-life exposure as a critical concern. However, while the focus on breast milk is undoubtedly important, it primarily pertains to a relatively short—but fundamental—period, typically the first year of life. In contrast, as shown in this review, far less attention has been given to PFAS contamination in other types of milk, particularly cow milk, which is culturally and nutritionally significant across all age groups and commonly consumed throughout life [1]. This disparity in research focus is noteworthy, especially considering that cow milk forms a major component of the human diet in many regions and supports a vast and diverse market, encompassing both small-scale local producers and large industrial dairy operations. The limited data available on PFAS levels in the several milk types available in the market poses a challenge for comprehensive dietary exposure assessments and hinders the development of effective regulatory measures. These findings underscore the urgent need for further investigation into PFAS contamination in dairy products beyond breast milk to ensure food safety and protect public health across all life stages.
To the author’s knowledge, this is the first review to provide both comprehensive information about global data on PFAS concentrations in milk and a dataset that could facilitate rapid data evaluation—particularly for applications such as risk assessment.
A report from FAO projected that “consumption of milk and dairy products will rise from 45 kg year−1 per capita to 66 kg in developing countries, and from 212 to 221 kg in industrial [45]. In particular, milk consumption patterns exhibit substantial regional variation, influenced by cultural, economic, and demographic factors. In sub-Saharan Africa, per capita milk consumption has remained largely stagnant over the past three decades. Milk’s contribution to dietary energy and protein intake has remained constant, suggesting that increases in milk availability have merely kept pace with population growth. As a result, only minor increases in consumption are projected in the coming years. In the Near East and North Africa, milk—alongside poultry—constitutes a significant share of animal product consumption. The contribution of animal products to total caloric intake is expected to rise modestly, from 8.7% in 1997/99 to 11.4% by 2030, reflecting a gradual dietary transition. In Brazil, milk consumption is notable for its upward trajectory. As of 1997/99, per capita consumption was slightly over half the level observed in industrialized nations. This figure is projected to reach approximately three-quarters of the industrial country average by 2030, highlighting Brazil’s growing reliance on dairy as a dietary staple. By contrast, in the broader Latin America and Caribbean region (excluding Brazil), dietary patterns are more heavily influenced by meat, with no significant emphasis on milk consumption reported. South Asia, excluding India, demonstrates a different trend, with milk already playing a central role in the diet. Per capita milk consumption is 50% higher than the average for developing countries and continues to grow steadily. This reflects a culturally embedded preference for dairy products in the region. In India, milk and milk products are the primary drivers behind the projected increase in animal product consumption. The importance of dairy is expected to continue growing until 2030, further cementing its role in the Indian diet. In East Asia (excluding China), the increase in animal product intake is largely due to rising meat consumption, and milk does not appear to contribute significantly to dietary changes. Similarly, in China, milk consumption is projected to remain low, increasing only from 7 kg per capita per year in 1997/99 to 14 kg by 2030. Dairy products will continue to play a minimal role in the Chinese diet, in contrast to the country’s rapidly growing consumption of pork, poultry, and eggs [45].
Thus, data from the Food and Agriculture Organization (FAO) reveals that the countries with the highest per capita cow milk consumption are primarily located in Europe, Oceania, and parts of Asia. In particular, considering Europe, the countries with the highest per capita cow milk consumption are Sweden, Netherlands, Denmark, Ireland, and Germany, with milk consumption ranging from 350 to 270 kg year−1 per capita [45]. These findings underscore the heterogeneity of milk consumption globally, with significant implications for nutrition policy, agricultural development, and food system sustainability.
When comparing the geographic distribution of PFAS studies in milk with global milk consumption patterns, a notable imbalance emerges. Countries with high per capita cow milk consumption—such as Sweden, the Netherlands, Denmark, Ireland, and Germany—have contributed relatively few studies to the literature, with only Germany and Sweden appearing in recent investigations. Even within these, sample sizes are often limited, and coverage is not representative of the national level. This is particularly striking given that per capita consumption in these countries ranges from 270 to 350 kg per year, placing them among the world’s top consumers. Similarly, in rapidly growing dairy markets such as Brazil and India—where milk plays a central or increasingly significant dietary role—there is a marked absence of published data on PFAS contamination in milk, despite projections indicating major increases in consumption by 2030. Conversely, some countries with low or stagnant milk consumption, such as China and South Africa, have been the focus of multiple PFAS studies. While these studies provide important insight into regional contamination and exposure, the overall evidence base remains geographically skewed and insufficiently aligned with actual consumption trends. This discrepancy underscores the urgent need for targeted PFAS monitoring in countries with high or rising milk consumption, to ensure accurate exposure assessments and inform relevant regulatory frameworks.
Thus, it is essential to critically assess the available data—considering both the number of samples and their geographic origin—while also emphasizing the significant lack of information from several countries, which limits the global representativeness of current findings, which is a key finding of this review.

4.2. PFAS Contamination: Regional and Analytical Disparities

Exploring the results shown in the previous section, the comparative analysis of PFAS concentrations in milk across continents reveals notable geographic disparities in both contamination levels and compound diversity. Asia exhibits the broadest spectrum of PFAS types, with studies reporting the detection of up to 16 different compounds in milk samples, including PFBA, PFNA, PFTrDA, and PFOS, with concentrations ranging from below detection limits to 9.82 ng g−1. In contrast, while displaying less compound diversity, Europe shows relatively higher concentrations of specific PFASs, particularly PFOS and PFOA. Notably, PFOS was found at 97 ng L−1 concentrations in Italy [23] and up to 137 ng kg−1 in Germany [42]. Africa and America reported generally lower PFAS concentrations, with a few exceptions such as the detection of 15.51 ng mL−1 in South African dairy milk [8], while U.S. samples consistently showed concentrations below detection limits, except for one sample with 6:2 FTS at 6.6 ng L−1 [4]. The FDA Total Diet Study also supports the minimal PFAS contamination in U.S. milk. This contrast underscores a trend: Asian samples tend to reflect environmental and agricultural variability through a wider PFAS profile, while European studies highlight localized high concentrations of fewer, often regulated PFASs, such as PFOS and PFOA. These findings suggest differing sources, regulations, and environmental persistence of PFASs across regions.
Considering the large number of compounds included in the PFASs category, and the need to collect comparable data from different studies, this review highlighted that it would be interesting and useful to (i) expand the range of investigated molecules in future studies; (ii) define a list of required principal molecules to be included in the study. As emerged from this review, only one study investigated the presence of 60 PFASs, while all the other studies remained always below the 20 investigated molecules. Despite efforts to reduce the PFASs use in industrial production, their ability to be persistent and bioaccumulative makes them able to continue to impact the food chain. Consequently, monitoring the dietary exposure of humans to a wide range of PFASs is crucial for assessing their effects on human health [46].
However, the diversity in analytical methods—particularly in the choice between traditional SPE and modified QuEChERS—likely contributes to the discrepancies observed in PFAS detection rates across studies. Harmonizing detection limits and validation parameters would significantly improve cross-study comparability.

4.3. PFAS Contamination in Non-Cow Milk Species

According to the detection of PFAS in different types of milk, only one study from Poland [35], deepened the topic. This study provides one of the most comprehensive comparisons of PFAS contamination across cow, goat, and sheep milk to date. It highlights significantly higher PFAS levels in goat and sheep milk, suggesting species-specific exposure pathways likely linked to grazing behavior and soil ingestion. Despite low overall dietary risk, these findings underscore the need to deepen research into PFAS contamination beyond cow milk, particularly in small-scale and pasture-based systems that are underrepresented in current literature. This is a significant finding because sheep milk plays a significant role in the dairy economies of several regions, particularly in Asia and Europe. In 2012, global sheep milk production was estimated at approximately 10.12 million tonnes, with Asia contributing the largest share (46.7%), followed by Europe (29.8%) and Africa (23.1%), while the Americas and Oceania accounted for only 0.4% and a negligible amount, respectively [46]. The leading producers globally were China (1.58 million tonnes), Turkey (1.01 million tonnes), and Syria (703,000 tonnes). In Europe, Greece led with 945,430 tonnes, followed by Romania (650,912 tonnes), Spain (552,517 tonnes), Italy (481,970 tonnes), and France (274,686 tonnes). Greece also exhibited the highest per capita consumption of sheep milk, reaching 63.1 kg per year [46,47]. Based on these considerations, this review strongly recommends exploring the topic, especially those countries in which sheep milk is produced and consumed the most.

4.4. Risk Characterization

In total, 5 of the 22 studies considered in this review also performed a risk characterization to evaluate human exposure to PFAS through milk consumption. The data presented in this study reflect the year of publication of the individual papers. Consequently, risk characterization assessments and the consequent considerations may not align with the current regulatory limits established by the EFSA.
Xing et al. 2016 [26] conducted a preliminary health risk assessment to evaluate exposure to PFOA and PFOS through milk consumption among the general adult population in Xinjiang, China. The average daily intake of PFOA and PFOS was estimated by combining the mean concentrations of these compounds in milk with daily consumption data obtained from a regional food frequency survey, with results normalized to a standard adult body weight of 60 kg. The study found that PFOS intake (0.0318 ng kg−1 per day) was consistently higher than PFOA intake (0.0211 ng kg−1 per day) across all population groups. Estimated intakes increased with age, with the highest exposures observed in individuals aged 70 years and above, which correlated with significantly higher milk consumption in this age group (113 g day−1). Substantial variability in the average daily intake values was observed across geographic regions, races, and age groups, while gender did not show significant differences. Residents of northern and urban areas, as well as Han Chinese and individuals classified by the Authors as “other races”, probably meaning “other populations”, exhibited the highest intake levels. Despite these variations, the calculated hazard ratios (HRs), based on the very high Tolerable Daily Intakes at that time established by the EFSA (1500 ng kg−1 per day for PFOA and 150 ng kg−1 per day for PFOS) [15], remained well below 1 for all population subgroups, indicating a negligible health risk from PFAS exposure via milk. The highest observed HR, for PFOS, was 0.362 × 10⁻³. These findings underscore the importance of considering local dietary patterns and demographic factors in PFAS risk assessments.
Macheka et al. 2021 [8] conducted a comprehensive dietary risk assessment to estimate human exposure to PFAS through the intake of dairy milk and infant formula in South Africa, with specific attention to infants, adolescents, and adults. Estimated daily intakes (EDIs) were calculated using age-appropriate milk consumption data from national dietary guidelines and exposure factor handbooks, with separate values derived for urban and rural populations, as well as for partially breastfed and exclusively formula-fed infants. The results revealed that toddlers (ages 1–6) exhibited the highest PFAS intake levels, with total EDIs reaching 20.41 ng kgbw−1 per day in urban areas and 14.17 ng kgbw−1 per day in rural areas. In comparison, adolescents had the lowest intake levels, and no significant differences were observed between urban and rural populations across age groups, likely due to the similarity in milk sources. Importantly, even in the worst-case scenario—based on WHO-recommended milk consumption volumes—the EDIs for both PFOS and PFOA remained well below the EFSA reference doses (150 ng kgbw−1 per day for PFOS and 1500 ng kgbw−1 per day for PFOA). However, as previously reported in this review, in 2020 the EFSA [16] established a TWI of 4.4 ng kgbw−1, which means that the daily exposure should not exceed 0.6 ng kgbw−1. Consequently, these findings do not align with the current regulation. Nonetheless, PFOS levels consistently exceeded those of PFOA across all groups, and toddlers’ overall exposure to PFAS was markedly higher than that of other demographics, underscoring their heightened vulnerability. Particularly notable was the contribution of PFDoA, which accounted for over 30% of the total PFAS intake in all groups, highlighting the need to consider less frequently regulated long-chain PFAS in exposure assessments. While the EDIs available for PFOA and PFOS singularly suggest low immediate health risks, the potential for adverse effects from chronic, cumulative exposure, especially in young children, remains a concern due to the long biological half-lives of PFOS and PFOA (5.4 and 3.8 years, respectively). Moreover, considering the TWI for the sum of the main four PFAS, the results highlight a situation of potential risk. These findings emphasize the importance of incorporating age-specific dietary patterns and cumulative exposure to a broad range of PFAS compounds when assessing the public health risks associated with dairy consumption.
Furthermore, Liu et al. 2022 [34] conducted a human health risk assessment based on hazard quotient (HQ) calculation, which showed that children are significantly more exposed to PFAS through milk consumption than adults, due to higher intake relative to body weight. Using the most recent EFSA reference dose (0.63 ng kgbw−1 per day), HQs exceeded 1 in high-exposure scenarios, with values reaching 2.31 for adults and 19.21 for children, indicating a potential health risk even from milk alone. Earlier RfDs resulted in HQs below 1, highlighting how stricter guidelines based on new evidence increase concern. In this study, Monte Carlo simulations confirmed that children consistently fall into higher exposure brackets. These findings emphasize the need to prioritize children in PFAS risk assessments and support stricter regulatory controls on PFAS levels in milk.
According to Mikołajczyk et al. 2023 [35], the intake of PFAS through milk consumption was found to be well below the TWI recommended by EFSA, indicating low health risk. Estimated exposures based on mean upper-bound (UB) concentrations ranged from 0.153–0.266 ng kgbw−1 for children and 0.050–0.088 ng kgbw−1 for adults, representing less than 7% and 2% of the TWI, respectively. Even under high-exposure scenarios using 95th percentile concentrations and recommended milk consumption levels, intake remained below 48% of the TWI for children and 16% for adults. Cow’s milk, the most commonly consumed, posed no significant concern, with exposure estimates remaining under 20% of the TWI for children even in worst-case scenarios.
Notably, to reach TWI, a child would have to consume over 23 L of milk per week, and an adult over 70 L, which is far beyond typical dietary patterns. However, while milk alone is unlikely to cause an exceedance of the TWI, the cumulative contribution from other PFAS-contaminated foods and water—such as fish or eggs—could lead to higher total exposure. Additionally, the analysis was limited to raw milk; potential PFAS contamination from processing or packaging was not assessed. These findings are consistent with the EFSA conclusion that milk is not a major dietary source of PFAS, though other studies suggest it may contribute significantly to specific contexts.
Xiao et al. 2024 [38] evaluated human health risks from PFAS exposure via milk using EDI and HQ, with a focus on PFOA and PFOS, the most prevalent compounds in milk. The results showed a clear age-related trend, with younger children, especially 1–5 years old, having significantly higher exposure levels than adults due to greater milk intake relative to body weight. Across different regions of China, PFOA and PFOS EDIs decreased with age, and the highest EDIs were observed in 1-year-old children. When applying for the older, more lenient EFSA TDI [14], all HQs remained below 1, indicating no significant health risk. However, with the revised EFSA thresholds from 2018 (0.8 ng kg−1 per day for PFOA and 1.8 ng kg−1 per day for PFOS) and 2020 (0.63 ng kg−1 per day for both), HQs for young children exceeded 1 in most regions, particularly in Central and North China, signaling a potential health risk. For instance, the HQ for 1-year-olds in Central China reached 8.55 for PFOA and 2.99 for PFOS under the 2020 guideline. These findings highlight that children are a vulnerable subgroup in PFAS exposure through milk, underscoring the need for stricter regulatory controls, age-specific risk evaluations, and possibly lower intake recommendations for contaminated milk sources. Although milk alone may not exceed tolerable intake values for the general population, cumulative PFAS exposure from other food and environmental sources should be considered in comprehensive risk assessments.
As an overall consideration, this review confirms that PFASs are detected in milk worldwide and given the variability in the detected concentration levels, it evidences that further research is needed to gather comprehensive data from different regions. Moreover, it would be desirable to define LOQ and LOD values to be mandatory achieved in the various studies to make it possible to compare the results and the detection frequencies more accurately.
Considering the number of analyzed samples, while for some countries such as Italy, Germany, and China, a fair number of samples have been analyzed over the past decade, for many other countries there is little or no data reporting the level of PFAS concentrations in milk. However, even for the nation with a higher number of analyzed samples, the detected PFAS concentrations might be considered indicative, but not representative of the national average concentration. Moreover, a considerable number of samples reported in this review were investigated as they were used as “real samples” in the applications of developed methods. This emphasizes even more the need to set up real monitoring systems on a national scale that might allow us to obtain a true picture of what the actual contamination levels of this matrix might be.
In particular, as emerged from the discussion, PFOS and PFOA are both the most relevant and among the most frequently detected PFAS compounds in the food chain, with PFOS typically having higher detection frequency and mean concentration levels than PFOA. This might be due to the higher bioaccumulation potential of PFOS [24]. Even considering the low concentrations level found in milk for these compounds, the concern is linked to the fact that they have been recently categorized as “carcinogenic to humans” (PFOA) and as “possibly carcinogenic to humans” (PFOS) by the IARC [11].
Therefore, while PFAS levels in milk are generally low and often below the limit of quantification and no significant risk of exposure to PFAS related to milk consumption emerged from the considered studies, milk remains an important route of exposure due to its high consumption deepened. In fact, milk is a fundamental daily food for both adults and, particularly, children [23]. Moreover, while several studies have reported on the concentrations of perfluoroalkyl substances in milk and milk products, only a few have analyzed a wide range of samples and PFAS compounds at the same time. Therefore, while contamination is usually minimal, ongoing vigilance is necessary to manage potential risks to human health [37].

4.5. Future Perspectives

The present review highlighted several critical research gaps. Firstly, the scientific literature reveals a clear underrepresentation of studies focusing on non-cow milk. This significantly limits the ability to conduct accurate exposure assessments for populations that regularly or frequently consume these alternative milk types. However, even within the context of cow milk, which is the most studied matrix, the available data remains limited in scope, geographic coverage, and methodological consistency. This overall scarcity of robust and comparable data across different milk types underscores the urgent need for more comprehensive and standardized research efforts to support effective risk assessment and public health decision-making. Secondly, it appears clear that there is a limited temporal coverage of the studies, most datasets reflect short-term or single-timepoint monitoring, which is insufficient to assess seasonal or long-term trends in PFAS accumulation. Research has documented seasonal fluctuations in PFAS concentrations in various environmental media. For instance, a study conducted in the Ebro Delta (Catalonia, Spain) observed that PFOS concentrations in river water varied seasonally, with maximum levels recorded in winter and spring [48]. Research on river waters in central Italy found that the sum of 21 target perfluorinated compounds (PFCs) was highest in June, potentially due to reduced river streamflow during warmer summer months [49]. Despite the documented seasonal variations of PFAS in environmental matrices, there is a notable absence of studies examining the seasonality of PFAS concentrations in cow milk. This gap in the literature highlights the need for targeted research to understand how seasonal factors may influence PFAS levels in milk, which is crucial for accurate exposure assessments and public health evaluations. Eventually, while some studies [4,34] linked PFAS occurrence to agricultural inputs or geographic proximity to pollution sources, systematic source apportionment remains underdeveloped. Future studies and research might start from these considerations and try to explore this uncovered aspect of the topic. Current evidence suggests that fat content and milk processing may influence PFAS distribution in dairy products, although findings are not always statistically significant. For instance, Macheka et al. [8] observed higher PFAS concentrations in full-cream milk, but no significant differences across milk types were confirmed. In contrast, Draghi et al. 2023 [36] reported significantly elevated PFOS levels in milk cream, indicating a potential role of milk processing in modulating PFAS exposure. The same study also found higher detection frequencies in multiparous cows, highlighting a need to explore physiological and dietary factors affecting PFAS bioaccumulation.
Additionally, differences in PFAS levels across animal species and milk types (e.g., cow, sheep, goose), as shown by Mikołajczyk et al. 2023 [35] underscore the importance of understanding the mechanistic basis of PFAS transfer into milk, particularly for long-chain compounds. These findings collectively point to the need for expanded surveillance, toxicokinetic studies, and risk assessments that consider dairy fat content, animal physiology, and milk processing in both contaminated and non-contaminated environments.
As a technical consideration, a valuable perspective for future investigation involves systematically examining how the choice of analytical methods influences PFAS detection in milk, particularly regarding sensitivity and inter-study comparability. Differences in sample preparation techniques—such as solid-phase extraction (SPE) versus modified QuEChERS protocols—and variability in LC-MS/MS instrumentation and settings can significantly affect detection limits and compound recovery. Standardizing analytical workflows would enhance the reliability of cross-study comparisons and support the development of harmonized guidelines for PFAS surveillance in these matrices.

5. Conclusions

PFASs have been shown to be ubiquitously present in milk worldwide, with concentrations varying across different countries. The detection of these compounds is usually conducted using high-performance liquid chromatography-tandem mass spectrometry (HPLC-MS/MS), typically involving liquid extraction followed by solid-phase extraction (SPE). However, rapid methods such as QuEChERS have been used to improve the efficiency of the extraction and cleanup steps.
This review highlighted that PFAS contamination in milk has been reported across several geographical areas, including Europe, Asia, Africa, and America. Considering the various PFASs, PFOS and PFOA, reported by the IARC as “carcinogenic to humans” (PFOA) and as “possibly carcinogenic to humans” (PFOS), are among the most frequently detected.
Although the studies reported in the present review showed generally low concentrations of PFASs in milk, it is important to remain aware of potential risks associated with long-term exposure, especially for sensitive population groups (e.g., children and toddlers). Milk, as a widely consumed food item, continues to be an important potential source of PFAS exposure, and consequently ongoing monitoring and updated regulation appears to be crucial to protect human health. This review underlines that further research is essential to assess the impact of these substances on human health and to ensure that appropriate measures are taken to reduce human exposure to PFASs through food, particularly milk.

Supplementary Materials

The following supporting information can be downloaded at: https://www.mdpi.com/article/10.3390/foods14132274/s1, Table S1: Concentrations of the four main PFASs (PFOA, PFOS, PFNA, PFHxS) detected in milk samples reported by the scientific literature in the period 2014–2025. The results are shown as reported in the original article, without changing the measurement units. If reported in the original article, both the range and the mean/median values are shown.

Author Contributions

Conceptualization, D.C., F.A., S.G. and T.S.S.; data curation, D.C.; writing—original draft preparation, D.C.; writing—review and editing, D.C. and F.A.; supervision, F.A. and S.G. All authors have read and agreed to the published version of the manuscript.

Funding

This research was funded under the National Recovery and Resilience Plan (NRRP), Mission 4 Component 2 Investment 1.3—call for tender No. 341 of 15 March 2022 of Italian Ministry of University and Research funded by the European Union—NextGenerationEU, award number: project code PE00000003, concession decree No. 1550 of 11 October 2022 adopted by the Italian Ministry of University and Research, CUP D93C22000890001, project title “ON Foods—Research and Innovation Network on Food and Nutrition Sustainability, Safety and Security—Working ON Foods”.

Data Availability Statement

Data is contained within the article or Supplementary Materials.

Acknowledgments

Project funded under the National Recovery and Resilience Plan (NRRP), Mission 4 Component 2 Investment 1.3—call for tender No. 341 of 15 March 2022 of Italian Ministry of University and Research funded by the European Union—NextGenerationEU, award number: project code PE00000003, concession decree No. 1550 of 11 October 2022 adopted by the Italian Ministry of University and Research, CUP D93C22000890001, project title “ON Foods—Research and Innovation Network on Food and Nutrition Sustainability, Safety and Security—Working ON Foods”.

Conflicts of Interest

The authors declare no conflicts of interest.

Abbreviations

The following abbreviations are used in this manuscript:
10:2 FTCA10:2 Fluorotelomer carboxylic acid
10:2 FTUCA10:2 Fluorotelomer unsaturated carboxylic acid
11H-PFUnDA11H-Perfluoroundecanoic acid
3:3 FTCA3:3 Fluorotelomer carboxylic acid
5:1:2 FTB5:1:2 Fluorotelomer betaine
5:3 FTB5:3 Fluorotelomer betaine
5:3 FTCA5:3 Fluorotelomer carboxylic acid
6:2 Cl PFESA6:2 chlorinated polyfluoroalkyl ether sulfonate
6:2 FTCA6:2 fluorotelomer carboxylic acid
6:2 FTUCA6:2 Fluorotelomer unsaturated carboxylic acid
7:3 FTCA7:3 Fluorotelomer carboxylic acid
7H-PFHpA7H Perfluoroheptanoic acid
8:2 ClPFESA8:2 chlorinated polyfluoroalkyl ether sulfonate
8:2 FTCA8:2 Fluorotelomer carboxylic acid
8:2 FTUCA8:2 Fluorotelomer unsaturated carboxylic acid
8:3 FTCA8:3 Fluorotelomer carboxylic acid
Cl-PFOSChlorinated perfluorooctanesulfonate
FBSAPerfluoro-1-butanesulfonamide
FDSAPerfluorodecanesulfonamide
FHxSAPerfluoro-1-hexanesulfonamide
FOSAPerfluorooctane sulfonamide
l-PFHxSPerfluorohexanesulfonic acid
NaDONASodium dodecafluoro-3H-4,8-dioxanonanoate
N-AP-FHxSAN-(3-dimethylaminopropan-1-yl)perfluoro-1-hexane-sulfonamide
N-CMAmP 6:2FOSAN-(carboxymethyl)-N,N-dimethyl-N-[3-(1H,1H,2H,2H- perfluoro-1-octanesulfonamido)propan-1-yl]ammonium (6:2 FTAB)
N-TAmP-FHxSAN-[3-(perfluoro-1-hexanesulfonamido)propan-1-yl]-N,N,N-trimethylammonium
N-EtFOSAN-ethyl perfluorooctane sulfonamide
N-EtFOSAAN-ethyl perfluorooctanesulfonamido acetic acid
N-MeFBSAN-Methylperfluoro-1-butanesulfonamide
N-MeFOSAN-methyl perfluorooctane sulfonamide
N-MeFOSAAN-methyl perfluorooctanesulfonamido acetic acid
PF4OPeAPerfluoro-4-oxapentanoic acid
PF5OHxAPerfluoro-5-oxahexanoic acid
PFBAPerfluorobutanoic acid
PFBSPerfluorobutanesulfonic acid
PFDAPerfluorodecanoic acid
PFDoDAPerfluorododecanoic Acid
PFDoSPerfluorodecane Sulfonic Acid
PFDSPerfluorodecanesulfonic Acid
PFECHSPerfluoro-4-ethylcyclohexane
PFEESAPerfluoro(2-ethoxyethane)sulfonic acid
PFHpAPerfluoroheptanoic acid
PFHpSPerfluoroheptanesulfonic acid
PFHxAPerfluorohexanoic acid
PFHxDAPerfluoro-n-hexadecanoic acid
PFHxSLinear perfluorohexanesulfonic acid
PFNAPerfluorononanoic acid
PFNSPerfluorononanesulfonic acid
PFOAPerfluorooctanoic acid
PFOcDAPerfluorooctadecanoic acid
PFOSPerfluorooctanesulfonic acid
PFPeAPerfluoropentanoic acid
PFPeSPerfluoropentanesulfonic acid
PFTeDAPerfluorotetradecanoic acid
PFTrDAPerfluorotridecanoic Acid
PFUnDAPerfluoroundecanoic acid
10:2 FTS1H,1H,2H,2H-perfluorododecane sulfonate
4:2 FTS1H,1H,2H,2H-perfluoro-1-hexanesulfonate
6:2 FTS1H,1H,2H,2H-perfluoro-1-octanesulfonate
8:2 FTS1H,1H,2H,2H-perfluoro-1-decanesulfonate
ADONADodecafluoro-3H-4,8-dioxanonanoate
br PFOSBranched Perfluorooctanesulfonic acid
C6O4Perfluoropolyether carboxylic acid
FDEA2-Perfluorodecyl ethanoic acid
FHEA2-Perfluorohexyl ethanoic acid
FOEA2-Perfluorooctyl ethanoic acid
FOUEA2H-perfluoro-2-decenoic acid
HFPO-DA (Gen X)Hexafluoropropylene oxide dimer acid
l PFDOSLinear Perfluorodecane Sulfonic Acid
l PFHpSLinear Perfluoroheptanesulfonic acid
l PFNSLinear Perfluorononanesulfonic acid
l PFOSLinear Perfluorooctanesulfonic acid
l-PFBSLinear Perfluorobutanesulfonic acid
l-PFDSLinear Perfluorodecanesulfonic Acid
PFDoAPerfluorododecanoic acid
PFDoDSPerfluoro-1-dodecanesulfonate
PFODA4,4′-((perfluorocyclobutane-1,2-diyl)bis(oxy))dianiline
PFOSAPerfluorooctane sulfonamide
PFPAPentafluoropropionic anhydride
PFPrSPerfluoropropanesulfonic acid
PFTeAPerfluorotetradecanoic acid
PFTrAPerfluorotridecanoic acid
PFTrDSPerfluoro-1-tridecanesulfonate
PFTriDAPentacosafluorotridecanoic acid
PFUdAPerfluoroundecanoic acid
PFUnAPerfluoroundecanoic acid
PFUnDSPerfluoroundecane sulfonate

References

  1. Danesi, L.; Nobile, M.; Fontana, M.; Tirloni, E.; Chiesa, L.M.; Savini, F.; Villa, R.E.; Panseri, S. Preliminary Investigation towards the Use of Infrared Technology for Raw Milk Treatment. Foods 2024, 13, 1117. [Google Scholar] [CrossRef] [PubMed]
  2. Clal.it. Available online: https://www.clal.it/ (accessed on 25 March 2025).
  3. Nobile, M.; Panseri, S.; Curci, D.; Chiesa, L.M.; Ghidini, S.; Arioli, F. Prevalence of perfluoroalkyl substances in paired batches of precooked and canned bovine meat and their implication on consumer safety. Food Chem. Toxicol. 2024, 192, 114910. [Google Scholar] [CrossRef] [PubMed]
  4. Hill, N.I.; Becanova, J.; Lohmann, R. A sensitive method for the detection of legacy and emerging per- and polyfluorinated alkyl substances (PFAS) in dairy milk. Anal. Bioanal. Chem. 2022, 414, 1235–1243. [Google Scholar] [CrossRef] [PubMed]
  5. Jha, G.; Kankarla, V.; McLennon, E.; Pal, S.; Sihi, D.; Dari, B.; Diaz, D.; Nocco, M. Per- and Polyfluoroalkyl Substances (PFAS) in Integrated Crop–Livestock Systems: Environmental Exposure and Human Health Risks. Int. J. Environ. Res. Public Health 2021, 18, 12550. [Google Scholar] [CrossRef]
  6. Domingo, J.L.; Nadal, M. Human exposure to per- and polyfluoroalkyl substances (PFAS) through drinking water: A review of the recent scientific literature. Environ. Res. 2019, 177, 108648. [Google Scholar] [CrossRef]
  7. Nobile, M.; Arioli, F.; Curci, D.; Ancillotti, C.; Scanavini, G.; Chiesa, L.M.; Panseri, S. Incidence of Perfluoroalkyl Substances in Commercial Eggs and Their Impact on Consumer’s Safety. Foods 2023, 12, 3846. [Google Scholar] [CrossRef]
  8. Macheka, L.R.; Olowoyo, J.O.; Mugivhisa, L.L.; Abafe, O.A. Determination and assessment of human dietary intake of per and polyfluoroalkyl substances in retail dairy milk and infant formula from South Africa. Sci. Total Environ. 2021, 755, 142697. [Google Scholar] [CrossRef]
  9. Sunderland, E.M.; Hu, X.C.; Dassuncao, C.; Tokranov, A.K.; Wagner, C.C.; Allen, J.G. A review of the pathways of human exposure to poly- and perfluoroalkyl substances (PFASs) and present understanding of health effects. J. Expo. Sci. Environ. Epidemiol. 2019, 29, 131–147. [Google Scholar] [CrossRef]
  10. Young, W.M.; South, P.; Begley, T.H.; Diachenko, G.W.; Noonan, G.O. Determination of Perfluorochemicals in Cow’s Milk Using Liquid Chromatography-Tandem Mass Spectrometry. J. Agric. Food Chem. 2012, 60, 1652–1658. [Google Scholar] [CrossRef]
  11. Zahm, S.; Bonde, J.P.; Chiu, W.A.; Hoppin, J.; Kanno, J.; Abdallah, M.; Blystone, C.R.; Calkins, M.M.; Dong, G.-H.; Dorman, D.C.; et al. Carcinogenicity of perfluorooctanoic acid and perfluorooctanesulfonic acid. Lancet Oncol. 2024, 25, 16–17. [Google Scholar] [CrossRef]
  12. Schiavone, C.; Portesi, C. PFAS: A Review of the State of the Art, from Legislation to Analytical Approaches and Toxicological Aspects for Assessing Contamination in Food and Environment and Related Risks. Appl. Sci. 2023, 13, 6696. [Google Scholar] [CrossRef]
  13. European Commission Regulation (EU). Regulation (Eu) 2019/1021 of the European Parliament and of the Council of 20 June 2019 on Persistent Organic Pollutants; EU: Brussels, Belgium, 2019. [Google Scholar]
  14. European Food Safety Authority (EFSA). Perfluorooctane sulfonate (PFOS), perfluorooctanoic acid (PFOA) and their salts Scientific Opinion of the Panel on Contaminants in the Food chain. EFSA J. 2008, 6, 653. [Google Scholar] [CrossRef]
  15. EFSA Panel on Contaminants in the Food Chain (CONTAM). Risk to human health related to the presence of perfluorooctane sulfonic acid and perfluorooctanoic acid in food. EFSA J. 2018, 16, e05194. [Google Scholar] [CrossRef]
  16. EFSA Panel on Contaminants in the Food Chain (EFSA CONTAM Panel). Risk to human health related to the presence of perfluoroalkyl substances in food. EFSA J. 2020, 18, e06223. [Google Scholar] [CrossRef]
  17. Commission Regulation (EU). 2023/915 on Maximum Levels for Certain Contaminants in Food and Repealing Regulation (EC) No 1881/2006; EU: Brussels, Belgium, 2023. [Google Scholar]
  18. Commission Recommendation (EU). 2022/1431 of 24 August 2022 on the Monitoring of Perfluoroalkyl Substances in Food; EU: Brussels, Belgium, 2022. [Google Scholar]
  19. Ropers, M.H.; Durand, S.; Veyrand, B.; Beaumal, V.; Marchand, P.; Anton, M.; Le Bizec, B. Contamination of food by fluorinated surfactants—Distribution in emulsions and impact on the interfacial protein behaviour. Food Hydrocoll. 2009, 23, 1149–1155. [Google Scholar] [CrossRef]
  20. Wang, J.; Shi, Y.; Pan, Y.; Cai, Y. Perfluorinated compounds in milk, milk powder and yoghurt purchased from markets in China. Chin. Sci. Bull. 2010, 55, 1020–1025. [Google Scholar] [CrossRef]
  21. Kowalczyk, J.; Ehlers, S.; Oberhausen, A.; Tischer, M.; Fürst, P.; Schafft, H.; Lahrssen-Wiederholt, M. Absorption, Distribution, and Milk Secretion of the Perfluoroalkyl Acids PFBS, PFHxS, PFOS, and PFOA by Dairy Cows Fed Naturally Contaminated Feed. J. Agric. Food Chem. 2013, 61, 2903–2912. [Google Scholar] [CrossRef]
  22. Van Asselt, E.D.; Kowalczyk, J.; Van Eijkeren, J.C.H.; Zeilmaker, M.J.; Ehlers, S.; Fürst, P.; Lahrssen-Wiederholt, M.; van der Fels-Klerx, H.J. Transfer of perfluorooctane sulfonic acid (PFOS) from contaminated feed to dairy milk. Food Chem. 2013, 141, 1489–1495. [Google Scholar] [CrossRef]
  23. Barbarossa, A.; Gazzotti, T.; Zironi, E.; Serraino, A.; Pagliuca, G. Short communication: Monitoring the presence of perfluoroalkyl substances in Italian cow milk. J. Dairy Sci. 2014, 97, 3339–3343. [Google Scholar] [CrossRef]
  24. Pérez, F.; Llorca, M.; Köck-Schulmeyer, M.; Škrbić, B.; Oliveira, L.S.; Martinello, K.d.B.; Al-Dhabi, N.A.; Antić, I.; Farré, M.; Barceló, D. Assessment of perfluoroalkyl substances in food items at global scale. Environ. Res. 2014, 135, 181–189. [Google Scholar] [CrossRef]
  25. Yu, Y.; Xu, D.; Lu, M.; Zhou, S.; Peng, T.; Yue, Z.; Zhou, Y. QuEChERs Combined with Online Interference Trapping LC-MS/MS Method for the Simultaneous Determination of 20 Polyfluoroalkane Substances in Dietary Milk. J. Agric. Food Chem. 2015, 63, 4087–4095. [Google Scholar] [CrossRef]
  26. Xing, Z.; Lu, J.; Liu, Z.; Li, S.; Wang, G.; Wang, X. Occurrence of Perfluorooctanoic Acid and Perfluorooctane Sulfonate in Milk and Yogurt and Their Risk Assessment. Int. J. Environ. Res. Public Health 2016, 13, 1037. [Google Scholar] [CrossRef] [PubMed]
  27. Chen, W.L.; Bai, F.Y.; Chang, Y.C.; Chen, P.C.; Chen, C.Y. Concentrations of perfluoroalkyl substances in foods and the dietary exposure among Taiwan general population and pregnant women. J. Food Drug Anal. 2018, 26, 994–1004. [Google Scholar] [CrossRef]
  28. Sungur, Ş.; Köroğlu, M.; Turgut, F. Determination of perfluorooctanoic acid (PFOA) and perfluorooctane sulfonic acid (PFOS) in food and beverages. Int. J. Environ. Anal. Chem. 2018, 98, 360–368. [Google Scholar] [CrossRef]
  29. Berendsen, B.J.A.; Lakraoui, F.; Leenders, L.; Van Leeuwen, S.P.J. The analysis of perfluoroalkyl substances at ppt level in milk and egg using UHPLC-MS/MS. Food Addit. Contam. Part A 2020, 37, 1707–1718. [Google Scholar] [CrossRef]
  30. Sadia, M.; Yeung, L.W.; Fiedler, H. Trace level analyses of selected perfluoroalkyl acids in food: Method development and data generation. Environ. Pollut. 2020, 263, 113721. [Google Scholar] [CrossRef]
  31. Abafe, O.A.; Macheka, L.R.; Olowoyo, J.O. Confirmatory Analysis of Per and Polyfluoroalkyl Substances in Milk and Infant Formula Using UHPLC–MS/MS. Molecules 2021, 26, 3664. [Google Scholar] [CrossRef]
  32. Gallocchio, F.; Moressa, A.; Zonta, G.; Angeletti, R.; Lega, F. Fast and Sensitive Analysis of Short- and Long-Chain Perfluoroalkyl Substances in Foods of Animal Origin. Molecules 2022, 27, 7899. [Google Scholar] [CrossRef]
  33. Li, J.; Gao, Y.; Wan, Y.; Liu, J.; Liu, L.; Wang, J.; Sun, X.; Pi, F.; Chen, X. A novel analytical strategy for the determination of perfluoroalkyl acids in various food matrices using a home-made functionalized fluorine interaction SPME in combination with LC-MS/MS. Food Chem. 2022, 366, 130572. [Google Scholar] [CrossRef]
  34. Liu, Y.; Zhang, Q.; Li, Y.; Hao, Y.; Li, J.; Zhang, L.; Wang, P.; Yin, Y.; Zhang, S.; Li, T.; et al. Occurrence of per- and polyfluoroalkyl substances (PFASs) in raw milk and feed from nine Chinese provinces and human exposure risk assessment. Chemosphere 2022, 300, 134521. [Google Scholar] [CrossRef]
  35. Mikołajczyk, S.; Warenik-Bany, M.; Pajurek, M. Occurrence of perfluoroalkyl substances in cow’s, goat’s and sheep’s milk—Dietary intake and risk assessment. J. Vet. Res. 2023, 67, 593–602. [Google Scholar] [CrossRef] [PubMed]
  36. Draghi, S.; Pavlovic, R.; Pellegrini, A.; Fidani, M.; Riva, F.; Brecchia, G.; Agradi, S.; Arioli, F.; Vigo, D.; Di Cesare, F.; et al. First Investigation of the Physiological Distribution of Legacy and Emerging Perfluoroalkyl Substances in Raw Bovine Milk According to the Component Fraction. Foods 2023, 12, 2449. [Google Scholar] [CrossRef] [PubMed]
  37. Li, Y.; Gao, Y.; Sun, S.; Zhang, Y.; Li, X.; Shi, L.; Zhan, Y.; Wang, Q.; Chen, C.; Zhang, Q. Efficient Online TurboFlow Method for Simultaneous Determination of 60 Emerging Per- and Polyfluoroalkyl Substances in Milk. J. Agric. Food Chem. 2024, 72, 24857–24865. [Google Scholar] [CrossRef] [PubMed]
  38. Xiao, K.; Li, X.; Xu, N.; Wang, X.; Hao, L.; Bao, H.; Zhang, L.; Shi, Y.; Cai, Y. Carry-over rate of per- and polyfluoroalkyl substances to raw milk and human exposure risks in different regions of China. Sci. Total Environ. 2024, 944, 173902. [Google Scholar] [CrossRef]
  39. Van Leeuw, V.; Malysheva, S.V.; Fosseprez, G.; Murphy, A.; Aarab, C.E.A.; Andjelkovic, M.; Waegeneers, N.; Van Hoeck, E.; Joly, L. Per- and polyfluoroalkyl substances in food and beverages: Determination by LC-HRMS and occurrence in products from the Belgian market. Chemosphere 2024, 366, 143543. [Google Scholar] [CrossRef]
  40. Shi, R.; Liu, L.; Liu, X.; Liu, Z.; Liu, J.; Wang, J.; Di, S.; Qi, P.; Wang, X. Integrated QuEChERS combined with LC–MS/MS for high-throughput analysis of per- and polyfluoroalkyl substances in milk. Anal. Bioanal. Chem. 2024, 416, 203–214. [Google Scholar] [CrossRef]
  41. Aßhoff, N.; Bernsmann, T.; Esselen, M.; Stahl, T. A sensitive method for the determination of per- and polyfluoroalkyl substances in food and food contact material using high-performance liquid chromatography coupled with tandem mass spectrometry. J. Chromatogr. A 2024, 1730, 465041. [Google Scholar] [CrossRef]
  42. Koenig, P.; Brand, B.; Hamscher, G.; Stahl, T. Development, optimization and validation of a highly sensitive and selective method for the determination of PFAS in animal-based food. Chemosphere 2025, 372, 144123. [Google Scholar] [CrossRef]
  43. Available online: https://www.fda.gov/food/environmental-contaminants-food/analytical-results-testing-food-pfas-environmental-contamination (accessed on 26 March 2025).
  44. González, N.; Domingo, J.L. PFC/PFAS concentrations in human milk and infant exposure through lactation: A comprehensive review of the scientific literature. Arch. Toxicol. 2025, 99, 1843–1864. [Google Scholar] [CrossRef]
  45. Livestock Production. Available online: https://www.fao.org/4/Y4252E/y4252e07.htm?utm_source (accessed on 6 June 2025).
  46. Skapetas, B.; Kalaitzidou, M. Current status and perspectives of sheep sector in the world. LRRD 2017, 29. [Google Scholar]
  47. Singh, R.; Sahoo, A. Importance of sheep milk: ‘dairy sheep’ a perspective avenue. In Donkey & Non-Bovine Milk; ILRI-NRCC Publication: Bikaner, India, 2023; Volume 4. [Google Scholar]
  48. Pignotti, E.; Casas, G.; Llorca, M.; Tellbüscher, A.; Almeida, D.; Dinelli, E.; Farré, M.; Barceló, D. Seasonal variations in the occurrence of perfluoroalkyl substances in water, sediment and fish samples from Ebro Delta (Catalonia, Spain). Sci. Total Environ. 2017, 607–608, 933–943. [Google Scholar] [CrossRef] [PubMed]
  49. Castellani, F.; Galletti, M.; Charavgis, F.; Cingolani, A.; Renzi, S.; Nucci, M.; Protano, C.; Vitali, M. Perfluorinated Compounds (PFCs) in River Waters of Central Italy: Monthly Variation and Ecological Risk Assessment (ERA). Arch. Environ. Contam. Toxicol. 2023, 84, 332–346. [Google Scholar] [CrossRef] [PubMed]
Figure 1. Line chart reporting the number of studies published each year from 2014 to 2025 related to the detection of PFASs in milk samples.
Foods 14 02274 g001
Figure 2. Timeline showing the different studies published around the world during the 2014–2025 decade related to the detection of PFASs in milk samples [4,8,23,24,25,26,27,28,29,30,31,32,33,34,35,36,37,38,39,40,41,42].
Foods 14 02274 g002
Figure 3. The number of milk samples analyzed in different countries for the detection of PFASs. All the countries with more than one sample analyzed are listed as text, divided by the continent. Darker shades of orange indicate countries with a higher number of samples.
Foods 14 02274 g003
Figure 4. Number of milk samples analyzed each year from 2014 to 2025 for the detection of PFASs. In darker blue the years in which the number of analyzed samples was higher than 100.
Foods 14 02274 g004
Table 1. Papers published about the detection of PFASs in milk samples in the period between 2014 and 2025. The table shows the investigated analytes, the extraction protocol, and the instrumental technique used to perform the analyses.
ReferenceYearAnalytesExtraction ProtocolInstrumental Analysis
[23]2014PFOA; PFOSL-L extraction followed by two purification steps performed by SPE cartridgesUPLC-MS/MS
[24]2014PFBA, PFBS,
PFPeA, PFHxA,
PFHxS, PFHpA,
FHEA, PFOA, PFOS, PFOSA,
FOEA, PFNA,
PFDA, PFDS,
PFUdA, PFDoA,
FDEA, PFTrA,
PFTeDA, PFHxDA,
PFODA
Alkaline digestion followed by a purification step performed by turbulent flow chromatographyLC-QqQ-MS
[25]2015PFBA, PFPA, PFHxA, PFHpA, PFOA, PFNA, PFDA, PFUnDA, PFDoDA, PFTrDa, PFTeDA, PFHxDA, PFOcDA, PFBS, PFPS, PFPS, L-PFHxS, L-PFHpS, L-PFOS, L-PFNS, L-PFDSExtraction and clean up performed using a QuEChERS methodLC-MS/MS
[26]2016PFOA; PFOSUltrasonic extraction followed by a purification step performed by SPE cartridgesHPLC-MS/MS
[27]2018PFHxA, PFOA, PFDA, PFUnDA, PFDoDA, PFHxS, PFOSAcidification and then purification by SPE cartridgesUPLC-MS/MS
[28]2018PFOA, PFOSLiquid extractionLC-MS/M
[29]2018PFOA, HFPO-DALiquid extraction followed by a purification step performed by SPE cartridgesLC-MS/MS
[30]2020L- and br-PFOS, PFOA, PFHxSAlkaline digestion followed by SPE clean-up stepsLC-MS/MS
[8]2021PFBA, PFPeA, PFBS, PFHxA,
PFHpA, PFHxS,
PFOA, PFNA,
PFOS, PFDA,
PFUdA, PFDS,
PFDoA, PFTrDA,
PFTeDA
Extraction and clean up performed using a QuEChERS methodUHPLC-MS/MS
[31]2021L-PFBS, PFBA, PFDA, PFDoA, PFDS, PFHpA, PFHxA, PFHxS, PFNA, PFOA, PFOS, PFPeA, PFTeDA, PFTrDA, PFuDAExtraction and clean up performed using a QuEChERS methodUHPLC-MS/MS
[4]2022PFBA, PFPeA
PFHxA, PFHpA
PFOA, PFNA
PFDA, PFUnDA
PFDoDA, PFTriDA
PFTeDA, PFBS, PFPeS, PFHxS
PFHpS, PFOS
PFNS, PFDS, PFECHS, FBSA
FOSA, N-MeFOSA
N-EtFOSA, N-MeFOSAA, N-EtFOSAA, 4:2 FtS, 6:2 FtS, 8:2 FtS
Liquid extraction followed by SPE clean up stepLC-MS/MS
[32]2022PFBA, PFPeA, PFHxA, PFHpA, PFOA, PFNA, PFDA, PFUnA, PFDoA, PFBS, PFHxS, PFOS, GenX, C6O4Extraction and clean up performed using a QuEChERS methodLC-MS/MS
[33]2022PFPeA, PFHpA
PFOA, PFNA
PFDA, PFHxS
PFOS
Direct immersion SPME (DI-SPME)LC-MS/MS
[34]2022PFBA, PFBS, PFPeA, PFHxA, PFHxS, PFHpA, PFOA, PFOS, PFNA, PFDA, PFUnDA, PFDoDA, PFTrDA, PFTeDA, PFHxDA, PFODALiquid extraction followed by SPE clean-up stepUPLC-MS/MS
[35]2023PFBS, PFPeS, PFHxS,
PFHpS, l-PFOS and br-PFOS, PFHxA, PFHpA, PFOA, PFNA, PFDA, PFUnDA, PFDoA, PFTrDA, PFTeDA
Liquid extraction followed by SPE clean-up stepLC-MS/MS
[36]2023PFBA, PFPeA, PFHxA, PFHpA, PFOA, PFNA, PFDA, FOUEA, NADONA, PFBS, PFHxS, PFOS, NmetFOSAA, 6-2FTSLiquid extraction followed by SPE clean-up stepUPLC-HRMS
[37]2024PFPrS, PFBS, PFPeS, PFHxS, PFHpS, PFOS, PFNS, PFDS, PFDoS, PFBA, PFPeA, PFHxA, PFHpA, PFOA, PFNA, PFDA, PFUnDA, PFDoDA, PFTrDA, PFTeDA, PFHxDA, PFOcDA, 4:2FTS, 6:2FTS, 8:2FTS, 10:2FTS, PFEESA, PFECHS, Cl-PFOS, 6:2ClPFESA, 8:2ClPFESA, 3:3FTCA, 5:3FTCA, 7:3FTCA, 8:3FTCA, 6:2FTCA, 8:2FTCA, 10:2 FTCA, 6:2FTUCA, 8:2FTUCA, 10:2FTUCA, PF4OPeA, PF5OHxA, 7H-PFHpA, 11H-PFUnDA, NaDONA, FBSA, FHxSA, FOSA, FDSA, N-MeFBSA, N-MeFOSA, N-EtFOSA, N-MeFOSAA, N-EtFOSAA, N-AP-FHxSA, N-CMAmP 6:2FOSA N-TAmP-FHxSA, 5:1:2FTB, 5:3FTBpH-dependent cold-induced liquid–liquid extraction as pre-clean-up stepHPLC-MS/MS
[38]2024PFBA, PFPeA
PFHxA, PFHpA
PFOA, PFNA
PFDA, PFUnDA
PFDoDA, PFTrDA, PFTeDA, PFBS, PFPeS, PFHxS
PFHpS, PFOS
Liquid extraction followed by SPE clean-up stepHPLC-MS/MS
[39]2024PFBA, PFPeA
PFHxA, PFHpA
PFOA, PFNA
PFDA, PFUnDA
PFDoDA, PFTrDA
PFTeDA, PFBS
PFPeS, PFHxS
PFHpS, PFOS
PFNS, PFDS
PFUnDS, PFDoDS
PFTrDS, HFPO-DA
DONA
QuEChERS method followed by two clean up steps performed by SPELC-HRMS
[40]2024PFBA, PFHxA, PFHpA
PFOA, PFNA
PFDA, PFUnDA
PFDoDA, PFTrDA
PFTeDA, N-MeFOSAA, N-EtFOSAA, PFBS
PFHxS, PFHpS
PFOS, PFDS
4:2 FTS, 6:2 FTS
8:2 FTS, L-PENS
L-PFDoS
Extraction and clean up performed using a QuEChERS methodLC–MS/MS
[41]2024PFBS, PFHxA PFPeS, PFHpA, PFHxS, PFOA, PFHpS, PFNA
PFOS, PFDA, PFNS, PFUnDA, PFDS, PFDoDA,
PFTrDA, PFDoDS, PFTeA, 4:2 FTS, 6:2 FTS, 8:2 FTS, NaDONA, HFPO-DA
Liquid extraction followed by SPE clean-up stepHPLC-MS/MS
[42]2025PFBA, PFPeA
PFHxA, PFHpA
PFOA, PFNA
PFDA, PFUnDA
PFDoA, PFTrDA
PFTeA, ADONA
HFPO-DA (GenX)
PFBS, PFPeS
PFHxS, PFHpS
PFOS, PFNS
PFDS, PFDoS
4:2 FTS, 6:2 FTS
8:2 FTS
Liquid extraction followed by a QuEChERS step and then two purification steps performed by SPELC-MS/MS
L-L: liquid–liquid; SPE: solid phase extraction; QuEChERS: quick, easy, cheap, effective, rugged and safe; UPLC or UHPLC-MS/MS: ultra-performance liquid chromatography-tandem mass spectrometry; LC-QqQ-MS: liquid chromatography with triple quadrupole mass spectrometry; LC-MS/MS: liquid chromatography-tandem mass spectrometry; HPLC-MS/MS: high-performance liquid chromatography-tandem mass spectrometry.
Table 2. Investigated analytes and their frequency of inclusion in the studies considered in this review. The table shows the analytes investigated in at least two different studies.
AnalytesFrequency (%)
PFOA100
PFOS100
PFHxS77
PFHpA77
PFDA77
PFHxA73
PFNA73
PFBS64
PFBA59
PFPeA55
PFUnDA55
PFTrDA50
PFTeDA50
PFDS41
PFDoDA41
PFHpS36
PFPeS32
PFDoA27
6:2 FtS27
l PFOS23
br PFOS23
PFNS23
HFPO-DA (Gen X)23
4:2 FtS23
8:2 FtS23
PFHxDA18
NaDONA14
N-MeFOSAA14
N-EtFOSAA14
PFUdA14
PFDoS9
PFOcDA9
PFECHS9
FBSA9
FOSA9
N-MeFOSA9
N-EtFOSA9
PFODA9
PFPS9
PFTeA9
PFDoDS9
Disclaimer/Publisher’s Note: The statements, opinions and data contained in all publications are solely those of the individual author(s) and contributor(s) and not of MDPI and/or the editor(s). MDPI and/or the editor(s) disclaim responsibility for any injury to people or property resulting from any ideas, methods, instructions or products referred to in the content.

