


Evaluating a Novel Hydrocolloid Alternative for Yogurt Production: Rheological, Microstructural, and Sensory Properties
 , , , and
Abstract

1. Introduction
2. Materials and Methods
2.1. Preparation of Novel Gel
2.2. Preparation of Yogurt
2.3. Acidity and pH
2.4. Syneresis
2.5. Textural Analysis (Brittleness and Rupture Strength)
2.6. Rheological Analysis
2.7. Microstructure Imaging
2.8. Color Values
2.9. Sensory Analysis
2.10. Statistical Analysis
3. Results and Discussion
3.1. Acidity and pH
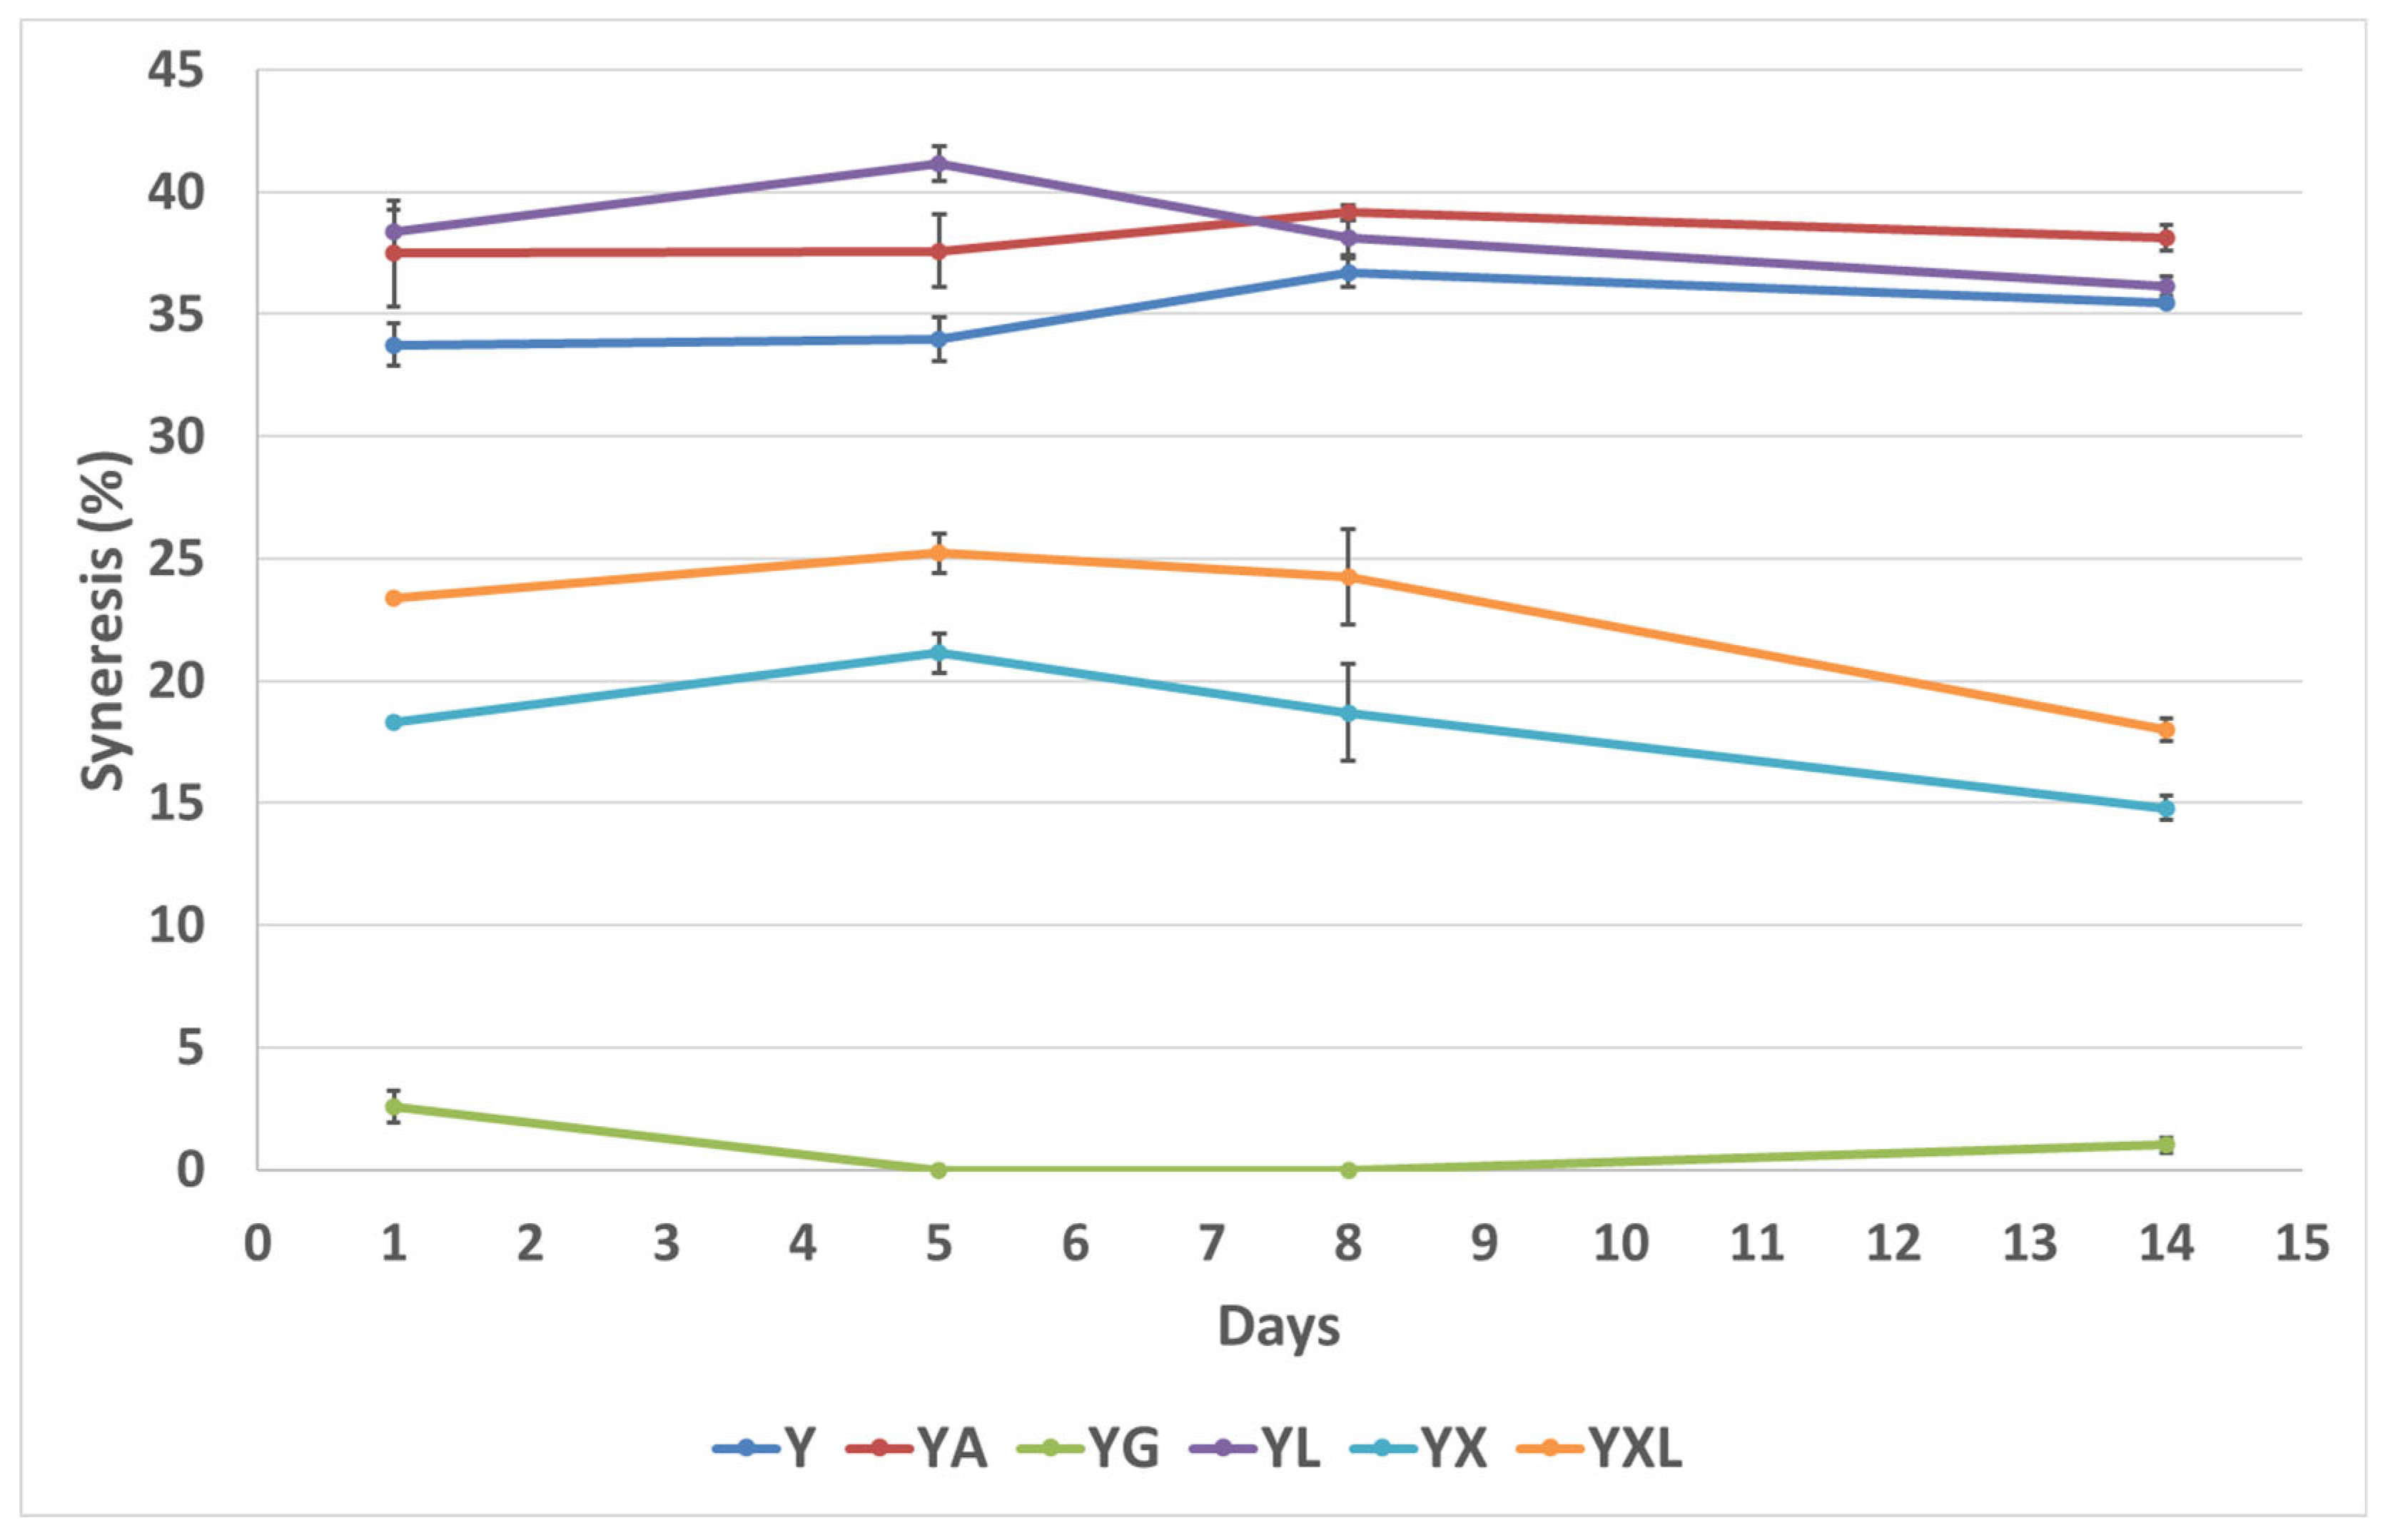
3.2. Syneresis
3.3. Brittleness and Rupture Strength
3.4. Rheological Analysis
3.5. Microstructural Analysis
3.6. Color Values
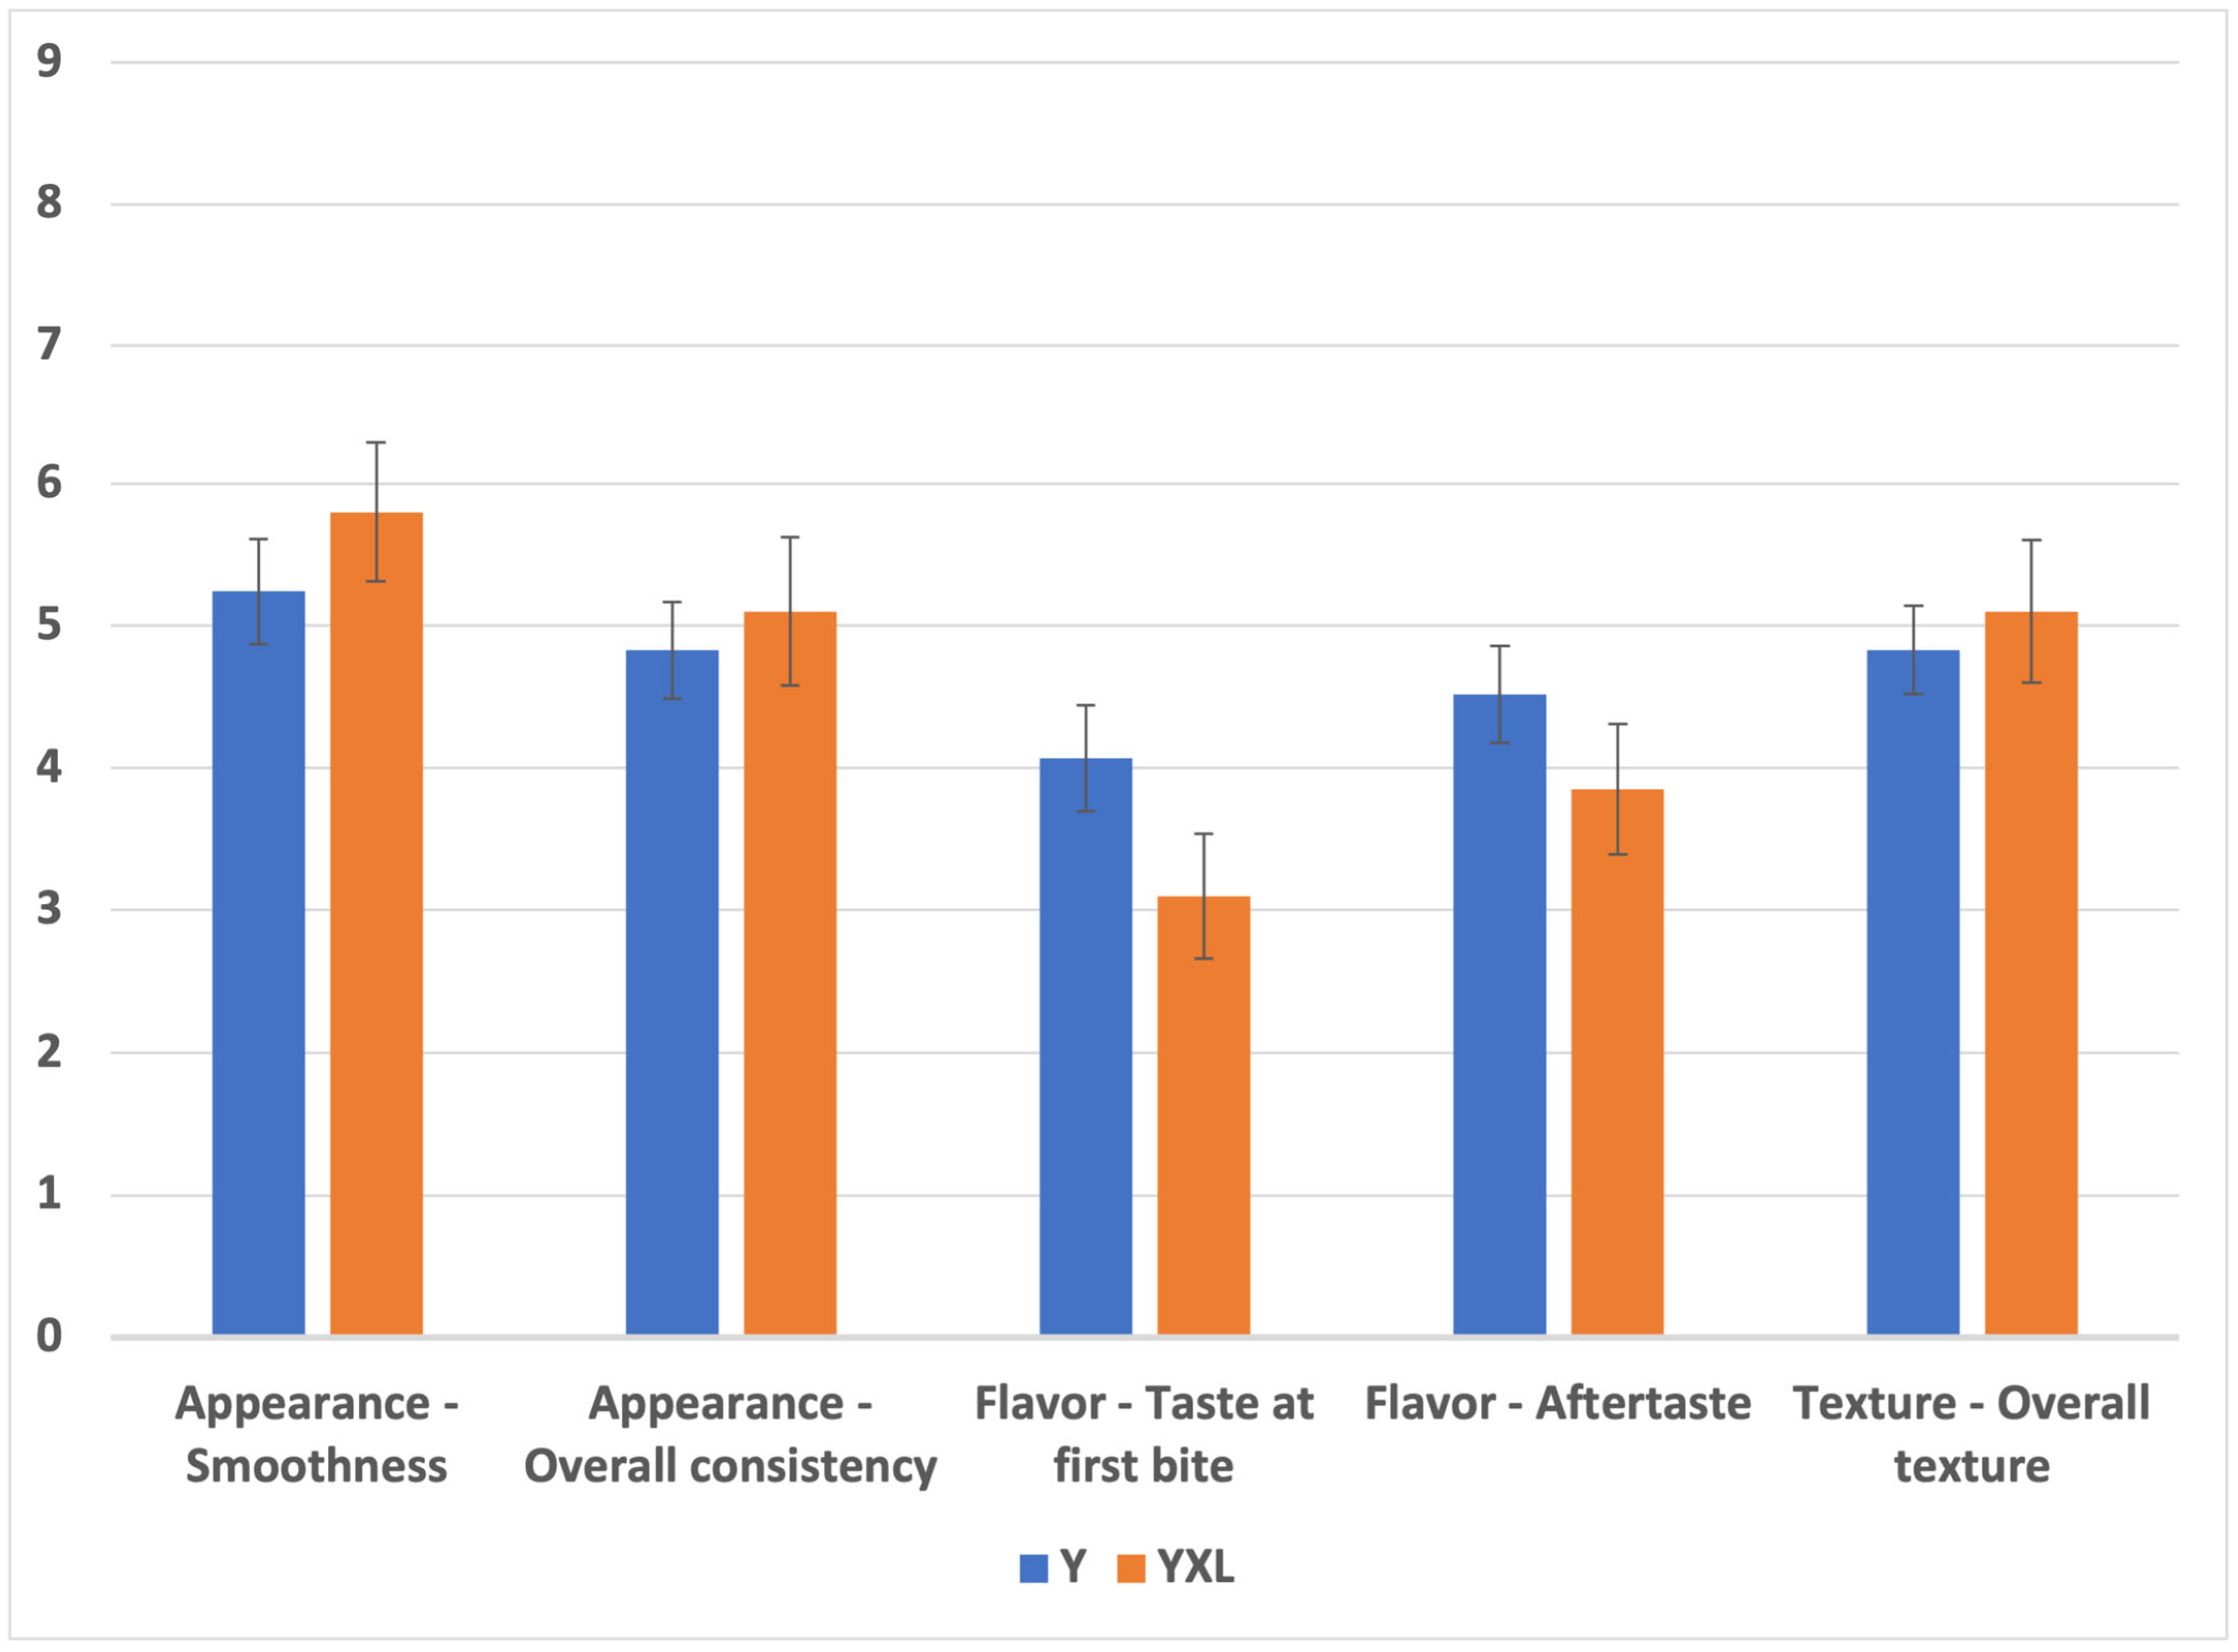
3.7. Sensory Analysis
4. Conclusions
Supplementary Materials
Author Contributions
Funding
Institutional Review Board Statement
Informed Consent Statement
Data Availability Statement
Conflicts of Interest
References
- Zhao, Y.; Khalesi, H.; He, J.; Fang, Y. Application of different hydrocolloids as fat replacer in low-fat dairy products: Ice cream, yogurt and cheese. Food Hydrocoll. 2023, 138, 108493. [Google Scholar] [CrossRef]
- Statista. Available online: https://www.statista.com/outlook/cmo/food/dairy-products-eggs/yogurt/united-states (accessed on 10 March 2024).
- Macit, E.; Bakirci, I. Effect of different stablizers on quality characteristics of the set-type yogurt. Afr. J. Biotechnol. 2017, 16, 2142–2151. [Google Scholar]
- Bahrami, M.; Ahmadi, D.; Alizadeh, M.; Hosseini, F. Physicochemical and sensorial properties of probiotic yogurt as affected by additions of different types of hydrocolloid. Food Sci. Anim. Resour. 2013, 33, 363–368. [Google Scholar] [CrossRef]
- Yousefi, M.; Jafari, S.M. Recent advances in application of different hydrocolloids in dairy products to improve their techno-functional properties. Trends Food Sci. Technol. 2019, 88, 468–483. [Google Scholar] [CrossRef]
- Ares, G.; Gonçalvez, D.; Pérez, C.; Reolón, G.; Segura, N.; Lema, P.; Gámbaro, A. Influence of gelatin and starch on the instrumental and sensory texture of stirred yogurt. Int. J. Dairy Technol. 2007, 60, 263–269. [Google Scholar] [CrossRef]
- Keogh, M.; O’kennedy, B. Rheology of stirred yogurt as affected by added milk fat, protein and hydrocolloids. J. Food Sci. 1998, 63, 108–112. [Google Scholar] [CrossRef]
- Pang, Z.; Deeth, H.; Yang, H.; Prakash, S.; Bansal, N. Evaluation of tilapia skin gelatin as a mammalian gelatin replacer in acid milk gels and low-fat stirred yogurt. J. Dairy Sci. 2017, 100, 3436–3447. [Google Scholar] [CrossRef]
- Huang, T.; Tu, Z.; Shangguan, X.; Wang, H.; Zhang, L.; Bansal, N. Characteristics of fish gelatin-anionic polysaccharide complexes and their applications in yoghurt: Rheology and tribology. Food Chem. 2021, 343, 128413. [Google Scholar] [CrossRef]
- Chelikani, V.; Bhardwaj, P.; Kumar, L.; On, S.L.; Mohan, M.S.; Olivero, A.; Thake, L.; Ramadhani, S.; Wescombe, P.A.; Olejar, K.J. Novel viscoelastic gelling agent with unique physico-chemical properties. Food Chem. 2021, 344, 128715. [Google Scholar] [CrossRef]
- Li, J.-M.; Nie, S.-P. The functional and nutritional aspects of hydrocolloids in foods. Food Hydrocoll. 2016, 53, 46–61. [Google Scholar] [CrossRef]
- Chelikani, V.; Mohan, M.S. Viscoelastic Gelling Agent. Australian Application 2020901266, 22 April 2020. [Google Scholar]
- Karahadian, C.; Lindsay, R. Flavor and textural properties of reduced-sodium process American cheeses. J. Dairy Sci. 1984, 67, 1892–1904. [Google Scholar] [CrossRef]
- Grummer, J.; Bobowski, N.; Karalus, M.; Vickers, Z.; Schoenfuss, T. Use of potassium chloride and flavor enhancers in low sodium Cheddar cheese. J. Dairy Sci. 2013, 96, 1401–1418. [Google Scholar] [CrossRef] [PubMed]
- Campagnol, P.C.B.; dos Santos, B.A.; Terra, N.N.; Pollonio, M.A.R. Lysine, disodium guanylate and disodium inosinate as flavor enhancers in low-sodium fermented sausages. Meat Sci. 2012, 91, 334–338. [Google Scholar] [CrossRef] [PubMed]
- Crowe-White, K.M.; Baumler, M.; Gradwell, E.; Juturu, V.; White, D.A.; Handu, D. Application of umami tastants for sodium reduction in food: An evidence analysis center scoping review. J. Acad. Nutr. Diet. 2023, 123, 1606–1620.e1608. [Google Scholar] [CrossRef]
- Wang, K.; Zhuang, H.; Bing, F.; Chen, D.; Feng, T.; Xu, Z. Evaluation of eight kinds of flavor enhancer of umami taste by an electronic tongue. Food Sci. Nutr. 2021, 9, 2095–2104. [Google Scholar] [CrossRef]
- Pancar, E.D.; Andiç, S.; Boran, G. Comparative effects of fish and cow gelatins and locust bean gum on chemical, textural, and sensory properties of yogurt. J. Aquat. Food Prod. Technol. 2016, 25, 843–853. [Google Scholar] [CrossRef]
- Hassan, A.; Ipsen, R.; Janzen, T.; Qvist, K. Microstructure and rheology of yogurt made with cultures differing only in their ability to produce exopolysaccharides. J. Dairy Sci. 2003, 86, 1632–1638. [Google Scholar] [CrossRef]
- AOAC. Official Methods of Analysis; The Association of Official Analytical Chemists: Washington, DC, USA, 2000. [Google Scholar]
- Ahmed, T.; Akhtaruzzaman, M.; Islam, M.R.; Biswas, M.; Kazi, F.; Das, A.K. Beetroot juice as a natural colorant in functional yogurt: Evaluation of physicochemical, bioactive, microbial and sensory properties during storage. J. Food Meas. Charact. 2025, 19, 4017–4033. [Google Scholar] [CrossRef]
- Ramirez-Santiago, C.; Ramos-Solis, L.; Lobato-Calleros, C.; Peña-Valdivia, C.; Vernon-Carter, E.; Alvarez-Ramírez, J. Enrichment of stirred yogurt with soluble dietary fiber from Pachyrhizus erosus L. Urban: Effect on syneresis, microstructure and rheological properties. J. Food Eng. 2010, 101, 229–235. [Google Scholar] [CrossRef]
- Chan, S.W.; Mirhosseini, H.; Taip, F.S.; Ling, T.C.; Tan, C.P. Comparative study on the physicochemical properties of κ-carrageenan extracted from Kappaphycus alvarezii (doty) doty ex Silva in Tawau, Sabah, Malaysia and commercial κ-carrageenans. Food Hydrocoll. 2013, 30, 581–588. [Google Scholar] [CrossRef]
- Dönmez, Ö.; Mogol, B.A.; Gökmen, V. Syneresis and rheological behaviors of set yogurt containing green tea and green coffee powders. J. Dairy Sci. 2017, 100, 901–907. [Google Scholar] [CrossRef] [PubMed]
- Ong, L.; Dagastine, R.; Kentish, S.; Gras, S. The effect of milk processing on the microstructure of the milk fat globule and rennet induced gel observed using confocal laser scanning microscopy. J. Food Sci. 2010, 75, E135–E145. [Google Scholar] [CrossRef] [PubMed]
- Solari-Godiño, A.; Pérez-Jiménez, J.; Saura-Calixto, F.; Borderías, A.J.; Moreno, H. Anchovy mince (Engraulis ringens) enriched with polyphenol-rich grape pomace dietary fibre: In vitro polyphenols bioaccessibility, antioxidant and physico-chemical properties. Food Res. Int. 2017, 102, 639–646. [Google Scholar] [CrossRef]
- Ibrahim, A.H.; Khalifa, S.A. The effects of various stabilizers on physiochemical properties of camel’s milk yoghurt. J. Am. Sci. 2015, 11, 15–24. [Google Scholar]
- Alakali, J.; Okonkwo, T.; Iordye, E. Effect of stabilizers on the physico-chemical and sensory attributes of thermized yoghurt. Afr. J. Biotechnol. 2008, 7, 158–163. [Google Scholar]
- Alsaleem, K.A.; Hamouda, M.E. Enhancing Low-Fat Probiotic Yogurt: The Role of Xanthan Gum in Functionality and Microbiological Quality. Processes 2024, 12, 990. [Google Scholar] [CrossRef]
- Tabari Shahandasht, N.; Bolandi, M.; Rahmati, M.; Jafarisani, M. Enhancing Stirred Yogurt Quality with Hyaluronic Acid-Rich Rooster Comb Extract: Effects on Texture and Shelf Life. Food Sci. Nutr. 2025, 13, e4666. [Google Scholar] [CrossRef]
- Li, L.; Zhao, B.; Feng, Z.; Wang, D.; Yuan, T.; Song, G.; Kim, S.-A.; Gong, J. Role and influence mechanism of different concentration of hyaluronic acid on physicochemical and organoleptic properties of yogurt. J. Dairy Sci. 2025, 108, 218–228. [Google Scholar] [CrossRef]
- Zhang, B.; Zhu, H.; Liang, D.; Chen, K.; Xie, X.; Yan, S.; Gao, Y. Effects of γ-polyglutamic acid on the rheological, microstructural and sensory properties of low-fat yogurt. J. Sci. Food Agric. 2025, 105, 2943–2951. [Google Scholar] [CrossRef]
- Pang, Z.; Xu, R.; Luo, T.; Che, X.; Bansal, N.; Liu, X. Physiochemical properties of modified starch under yogurt manufacturing conditions and its relation to the properties of yogurt. J. Food Eng. 2019, 245, 11–17. [Google Scholar] [CrossRef]
- Cunha, C.N.; dos Anjos Pinto, C.B.; da Silva Sad, M.E.L.; Colturato, V.M.M.; Berto, G.L.; Arantes, V.; da Silva Barud, H.; Stephani, R.; Perrone, Í.T. Influence of micro and nanofibrillated cellulose on sweetened yogurt production and storage. Int. Dairy J. 2024, 155, 105958. [Google Scholar] [CrossRef]
- Dhakal, D.; Kumar, G.; Devkota, L.; Subedi, D.; Dhital, S. The choice of probiotics affects the rheological, structural, and sensory attributes of lupin-oat-based yoghurt. Food Hydrocoll. 2024, 156, 110353. [Google Scholar] [CrossRef]


| Samples | Description | Percentage (w/v) Addition of Gelling Agent in Final Product | Form of Addition of Ingredient in Milk |
|---|---|---|---|
| Y | Control | - | - |
| YA | AA 1 | 0.5 | Powder |
| YG | Gelatin | 0.5 | Powder |
| YL | LA 2 | 0.012 | Powder |
| YX | DG 3 | 0.83 | Powder |
| YXL | Novel gel | 1 | Gel made with LA 1, DG 2, and water |
| Parameter | Day | Y | YA | YG | YL | YX | YXL |
|---|---|---|---|---|---|---|---|
| pH | 1 | 4.46 ± 0.02 A | 4.41 ± 0.00 A | 4.42 ± 0.01 A | 4.44 ± 0.00 A | 4.55 ± 0.01 AB | 4.48 ± 0.02 A |
| 5 | 4.41 ± 0.03 A | 4.37 ± 0.03 A | 4.33 ± 0.02 B | 4.37 ± 0.00 AB | 4.59 ± 0.01 A | 4.46 ± 0.01 AB | |
| 8 | 4.31 ± 0.00 B | 4.33 ± 0.00 A | 4.38 ± 0.01 AB | 4.31 ± 0.01 B | 4.47 ± 0.00 B | 4.38 ± 0.00 B | |
| 14 | 4.27 ± 0.02 B | 4.34 ± 0.01 A | 4.41 ± 0.01 AB | 4.33 ± 0.03 B | 4.49 ± 0.01 B | 4.43 ± 0.02 AB |
| Parameter | Day | Y | YA | YG | YL | YX | YXL |
|---|---|---|---|---|---|---|---|
| Brittleness (mm) | 1 | 6.35 ± 0.47 bA | 5.24 ± 0.23 cB | 7.94 ± 0.02 aA | 5.57 ± 0.12 bcB | 7.98 ± 0.01 aA | 7.99 ± 0.01 aA |
| 5 | 4.13 ± 0.22 cB | 4.08 ± 0.11 cB | 6.83 ± 0.45 bB | 4.19 ± 0.17 cC | 7.99 ± 0.05 aA | 7.99 ± 0.03 aA | |
| 8 | 4.32 ± 0.30 bB | 4.24 ± 0.34 bB | 7.65 ± 0.14 aAB | 7.73 ± 0.19 aA | 7.95 ± 0.04 aA | 7.98 ± 0.02 aA | |
| 14 | 3.94 ± 0.23 bB | 8 ± 0.00 aA | 7.29 ± 0.02 aAB | 7.94 ± 0.02 aA | 7.97 ± 0.01 aA | 7.99 ± 0.03 aA | |
| Rupture strength (g-force) | 1 | 12.13 ± 0.75 cA | 15.58 ± 0.13 cA | 13.81 ± 0.85 cB | 12.47 ± 0.20 cA | 65.34 ± 3.92 bB | 76.16 ± 1.11 aB |
| 5 | 17.82 ± 0.31 cA | 20.17 ± 0.19 cA | 23.71 ± 0.31 cdA | 15.34 ± 0.58 dA | 75.73 ± 1.05 bA | 94.04 ± 2.43 aA | |
| 8 | 16.6 ± 0.19 cA | 19.29 ± 0.85 cA | 24.07 ± 0.26 cA | 16.11 ± 0.79 dA | 76.48 ± 1.97 bA | 91.75 ± 0.59 aA | |
| 14 | 15.43 ± 0.63 cA | 19.46 ± 0.51 cA | 23.81 ± 0.57 cA | 15.46 ± 0.57 dA | 81.3 ± 2.75 bA | 91.17 ± 1.64 aA |
| Shear Rate/ Parameters | Day | Y | YA | YG | YL | YX | YXL |
|---|---|---|---|---|---|---|---|
| 4.5 s−1 | 1 | 2.92 ± 0.21 bA | 3.09 ± 0.05 bA | 3.79 ± 0.17 aB | 2.61 ± 0.12 bA | 2.75 ± 0.15 bA | 2.54 ± 0.14 bA |
| 5 | 3.38 ± 0.08 bA | 3.24 ± 0.08 bcA | 4.59 ± 0.06 aA | 2.68 ± 0.01 cA | 3.03 ± 0.15 bcA | 2.76 ± 0.09 cA | |
| 8 | 3.52 ± 0.03 bA | 3.43 ± 0.02 bcA | 4.96 ± 0.17 aA | 2.61 ± 0.23 cA | 2.69 ± 0.02 cA | 2.88 ± 0.06 cA | |
| 14 | 3.19 ± 0.05 bA | 3.41 ± 0.07 bA | 5.14 ± 0.06 aA | 3.10 ± 0.03 bA | 2.92 ± 0.05 bA | 3.02 ± 0.09 bA | |
| 60.8 s−1 | 1 | 0.67 ± 0.01 bA | 0.61 ± 0.09 cA | 0.78 ± 0.01 aB | 0.60 ± 0.01 cA | 0.35 ± 0.03 dA | 0.31 ± 0.04 dA |
| 5 | 0.66 ± 0.03 bA | 0.60 ± 0.09 cA | 0.84 ± 0.06 aA | 0.60 ± 0.01 bcA | 0.37 ± 0.05 dA | 0.34 ± 0.01 dA | |
| 8 | 0.66 ± 0.03 bA | 0.60 ± 0.01 bA | 0.84 ± 0.06 aA | 0.63 ± 0.01 bA | 0.36 ± 0.08 cA | 0.35 ± 0.01 cA | |
| 14 | 0.64 ± 0.05 bA | 0.59 ± 0.05 bA | 0.80 ± 0.03 aAB | 0.60 ± 0.08 bA | 0.37 ± 0.05 cA | 0.36 ± 0.05 cA | |
| k 3 | 1 | 7.25 ± 0.76 abA | 8.18 ± 0.17 abA | 9.85 ± 0.61 aB | 6.42 ± 0.45 bA | 9.43 ± 0.80 abAB | 9.20 ± 1.01 abA |
| 5 | 8.91 ± 0.37 bcA | 8.82 ± 0.42 bcA | 12.73 ± 0.28 aAB | 6.61 ± 0.03 cA | 10.48 ± 0.87 abA | 9.48 ± 0.05 bcA | |
| 8 | 9.56 ± 0.19 bA | 9.67 ± 0.08 bA | 14.52 ± 0.73 aA | 6.23 ± 0.79 cA | 6.96 ± 1.64 bcA | 10.15 ± 0.13 bA | |
| 14 | 8.32 ± 0.25 bA | 9.59 ± 0.30 bA | 15.38 ± 0.27 aA | 8.25 ± 0.12 bA | 9.81 ± 0.21 bAB | 10.77 ± 0.43 bA | |
| n 3 | 1 | 0.40 ± 0.01 aA | 0.34 ± 0.03 aA | 0.36 ± 0.01 aA | 0.39 ± 0.01 aA | 0.16 ± 0.01 bB | 0.13 ± 0.03 bA |
| 5 | 0.34 ± 0.01 aA | 0.31 ± 0.01 aA | 0.31 ± 0.06 aA | 0.39 ± 0.04 aA | 0.15 ± 0.01 bB | 0.16 ± 0.04 bA | |
| 8 | 0.32 ± 0.06 abA | 0.29 ± 0.07 bA | 0.28 ± 0.01 bA | 0.41 ± 0.02 aA | 0.27 ± 0.07 bA | 0.14 ± 0.05 cA | |
| 14 | 0.35 ± 0.09 aA | 0.30 ± 0.04 aA | 0.26 ± 0.05 bA | 0.33 ± 0.04 aA | 0.17 ± 0.03 bcAB | 0.13 ± 0.07 cA |
| Parameter 2 | Day | Y | YA | YG | YL | YX | YXL |
|---|---|---|---|---|---|---|---|
| L* | 1 | 28.3 ± 1.2 cA | 33.1 ± 0.6 bA | 37.1 ± 0.7 aA | 40.7 ± 1.2 aA | 37.7 ± 0.6 aA | 37.8 ± 1.2 aA |
| 5 | 36.2 ± 0.4 aB | 37.4 ± 1.4 aB | 37.0 ± 4.1 aA | 39.1 ± 1.4 aA | 32.5 ± 1.2 bB | 37.7 ± 0.7 aA | |
| 8 | 40.5 ± 1.1 aB | 38.9 ± 1.4 abB | 40.7 ± 0.4 aA | 35.4 ± 0.7 bB | 38.2 ± 0.3 abA | 40.4 ± 0.43 aA | |
| 14 | 37.2 ± 0.6 abB | 33.4 ± 0.7 bA | 35.8 ± 0.5 abB | 34.0 ± 1.7 bB | 32.8 ± 1.5 bB | 38.9 ± 1.64 aA | |
| a* | 1 | −1.7 ± 0.1 abA | −1.5 ± 0.0 aA | −1.7 ± 0.1 abA | −1.8 ± 0.1 bA | −1.5 ± 0.1 aA | −1.5 ± 0.0 aA |
| 5 | −1.6 ± 0.0 abA | −1.8 ± 0.1 bB | −1.6 ± 0.1 abA | −1.7 ± 0.1 abA | −1.5 ± 0.1 aA | −1.5 ± 0.0 aA | |
| 8 | −1.8 ± 0.0 aA | −1.9 ± 0.1 aB | −1.7 ± 0.0 aA | −1.8 ± 0.0 aA | −1.7 ± 0.0 aA | −1.7 ± 0.0 aB | |
| 14 | −1.7 ± 0.0 aA | −1.6 ± 0.0 aA | −1.5 ± 0.0 aA | −1.6 ± 0.1 aA | −1.5 ± 0.1 aA | −1.6 ± 0.0 aA | |
| b* | 1 | 7.6 ± 0.4 aA | 6.5 ± 0.1 bcA | 6.8 ± 0.2 bA | 7.4 ± 0.1 aA | 6.4 ± 0.2 bcA | 6.1 ± 0.1 cA |
| 5 | 6.8 ± 0.0 aB | 7.0 ± 0.2 aB | 6.8 ± 0.4 aA | 7.1 ± 0.1 aA | 6.5 ± 0.2 abA | 6.3 ± 0.1 bA | |
| 8 | 7.2 ± 0.1 aAB | 7.2 ± 0.2 aB | 7.2 ± 0.0 aA | 7.0 ± 0.1 abA | 6.6 ± 0.1 abA | 6.4 ± 0.04 bA | |
| 14 | 6.9 ± 0.1 aB | 6.6 ± 0.1 aB | 6.9 ± 0.1 aA | 6.9 ± 0.3 aA | 6.2 ± 0.4 bA | 6.1 ± 0.1 bA |
Disclaimer/Publisher’s Note: The statements, opinions and data contained in all publications are solely those of the individual author(s) and contributor(s) and not of MDPI and/or the editor(s). MDPI and/or the editor(s) disclaim responsibility for any injury to people or property resulting from any ideas, methods, instructions or products referred to in the content. |
© 2025 by the authors. Licensee MDPI, Basel, Switzerland. This article is an open access article distributed under the terms and conditions of the Creative Commons Attribution (CC BY) license (https://creativecommons.org/licenses/by/4.0/).
Share and Cite
Akshit, F.N.U.; Mao, T.; Poojary, S.; Chelikani, V.; Mohan, M.S. Evaluating a Novel Hydrocolloid Alternative for Yogurt Production: Rheological, Microstructural, and Sensory Properties. Foods 2025, 14, 2252. https://doi.org/10.3390/foods14132252
Akshit FNU, Mao T, Poojary S, Chelikani V, Mohan MS. Evaluating a Novel Hydrocolloid Alternative for Yogurt Production: Rheological, Microstructural, and Sensory Properties. Foods. 2025; 14(13):2252. https://doi.org/10.3390/foods14132252
Chicago/Turabian StyleAkshit, F. N. U., Ting Mao, Shwetha Poojary, Venkata Chelikani, and Maneesha S. Mohan. 2025. "Evaluating a Novel Hydrocolloid Alternative for Yogurt Production: Rheological, Microstructural, and Sensory Properties" Foods 14, no. 13: 2252. https://doi.org/10.3390/foods14132252
APA StyleAkshit, F. N. U., Mao, T., Poojary, S., Chelikani, V., & Mohan, M. S. (2025). Evaluating a Novel Hydrocolloid Alternative for Yogurt Production: Rheological, Microstructural, and Sensory Properties. Foods, 14(13), 2252. https://doi.org/10.3390/foods14132252