Article

Effect of a 6-Month Functional Food Intervention on the Microbiota of Stunted Children in East Nusa Tenggara, Indonesia—A Randomized Placebo-Controlled Parallel Trial

by
Ingrid S. Surono
1,†,
Koen Venema
2,3,4,*,†,
Subijanto Martosudarmo
5 and
Pratiwi D. Kusumo
6
1
Food Technology Department, Faculty of Engineering, Bina Nusantara University, Jakarta 11480, Indonesia
2
Centre for Healthy Eating & Food Innovation, Maastricht University, Campus Venlo, 5928 SZ Venlo, The Netherlands
3
Beneficial Microbes® Consultancy, 6709 TN Wageningen, The Netherlands
4
Wageningen Food & Biobased Research, Wageningen University & Research, 6708 PG Wageningen, The Netherlands
5
Department of Child Health, Faculty of Medicine, Universitas Airlangga, Surabaya 60286, Indonesia
6
Faculty of Medicine, Universitas Kristen Indonesia, Jakarta 13630, Indonesia
*
Author to whom correspondence should be addressed.
These authors contributed equally to this work.
Foods 2025, 14(13), 2218; https://doi.org/10.3390/foods14132218
Submission received: 11 April 2025 / Revised: 16 June 2025 / Accepted: 19 June 2025 / Published: 24 June 2025

Abstract

We have previously shown a difference between the gut microbiota composition of stunted and non-stunted children in East Nusa Tenggara, Indonesia. The current study aimed to perform an intervention with a probiotic, Lactiplantibacillus plantarum IS-10506, and its UHT-treated postbiotic compared to placebo in order to accomplish catch-up growth in the stunted children, possibly through modulation of the gut microbiota. Apart from the maltodextrin (placebo), probiotic, and postbiotic in chocolate milk, all groups also received a functional and nutritional biscuit and had access to newly constructed water wells as well as soap to improve hygiene. The results show that independent of treatment, the stunted children had a significantly higher increase in height and zlen (corrected for age) compared with their age- and gender-matched controls but a significantly lower increase in weight. Several potential pathogenic taxa declined in all groups, among which was Escherichia/Shigella (adjusted.p = 6.44 × 10⁻¹⁵), but so did some beneficial taxa, such as Bifidobacterium and Akkermansia. Faecalibacterium, which was already higher in the stunted children at baseline, increased independent of treatment. Changes in the relative abundance of several taxa of the microbiota correlated with the changes in anthropometric measures. In conclusion, although there was no difference between the interventions, understanding the dynamics and the role of the gut microbiota in this process might allow healthcare providers to develop targeted nutritional strategies aimed at optimizing health outcomes for children at risk of stunting, thereby addressing a critical global health issue.

1. Introduction

Stunting, characterized by impaired linear growth in children, remains a serious global health issue, particularly in low- and middle-income countries, including Indonesia. Defined by a height-for-age Z-score (zlen) below −2 standard deviations of the World Health Organization (WHO) growth standards [1], stunting affects approximately 150 million children under five years old globally, with a significant proportion residing in Southeast Asia and sub-Saharan Africa [2,3]. In Indonesia, where malnutrition continues to affect child health and development, stunting prevalence remains unacceptably high, despite modest declines over the past decade [4,5]. In Indonesia, stunting still affected 4.6 million children in 2019, and this figure is still above the rate of stunted children in the broader Southeast Asia region (24.7%) [6].
The etiology of stunting is multifactorial, involving a complex interplay of nutritional deficiencies, recurrent infections, and suboptimal sanitation. Emerging evidence underscores the critical role of gut microbiota in stunting pathogenesis. The gut microbiota, a dynamic ecosystem of microorganisms inhabiting the gastrointestinal tract, contributes to nutrient metabolism, immune regulation, and gut barrier integrity. Dysbiosis, or imbalance in the gut microbial composition, has been implicated in reduced nutrient absorption, chronic inflammation, and impaired linear growth [7,8].
Stunted children frequently exhibit lower microbial diversity, an overabundance of pathogenic taxa such as Escherichia/Shigella, and diminished levels of beneficial butyrate-producing bacteria, including Faecalibacterium and Ruminococcus [3,9], although these taxonomic differences are not consistent in all studies. e.g., in our own baseline study, Faecalibacterium was increased in the stunted children [10]. These microbial alterations are often associated with environmental enteric dysfunction, a subclinical condition characterized by chronic intestinal inflammation and impaired barrier function, which further exacerbates growth faltering [2,11].
To address the problem of stunting, a comprehensive approach targeting both nutritional and environmental factors is necessary. Recent studies have highlighted the potential of interventions aimed at improving the gut microbiota composition as a strategy to promote healthy growth in stunted children [12,13,14,15,16]. Probiotics and postbiotics, which involve live microorganisms or inactivated microbial cells, respectively, have attracted attention as potential therapeutic strategies for restoring gut homeostasis in stunted children [11,17]. Certain probiotic strains, such as Lactiplantibacillus plantarum IS-10506, have been demonstrated to be safe and have immunomodulatory effects and the ability to enhance gut barrier integrity and nutrient absorption [18,19]. Similarly, postbiotics offer an alternative approach, delivering beneficial microbial fragments or metabolites directly without requiring viable microorganisms, thereby addressing limitations associated with probiotic survival in hostile gut environments [7].
East Nusa Tenggara is the province in Indonesia with the highest prevalence of stunting [20]. In our East Nusa Tenggara cohort of children under 5 years of age, we established a difference in microbiota in stunted versus non-stunted children at baseline [10]. Despite the common belief that stunting is largely irreversible after the child’s second birthday, we tested whether catch-up growth and correcting dysbiosis were possible. Therefore, a placebo-controlled, parallel 6-month intervention was carried out with UHT chocolate milk containing the microencapsulated probiotic L. plantarum IS-10506 or its UHT-treated postbiotic on top of hygienic measures. UHT chocolate milk with maltodextrin served as the placebo. All groups were also provided with a functional and nutritional biscuit [21].

2. Materials and Methods

2.1. Ethics Statement
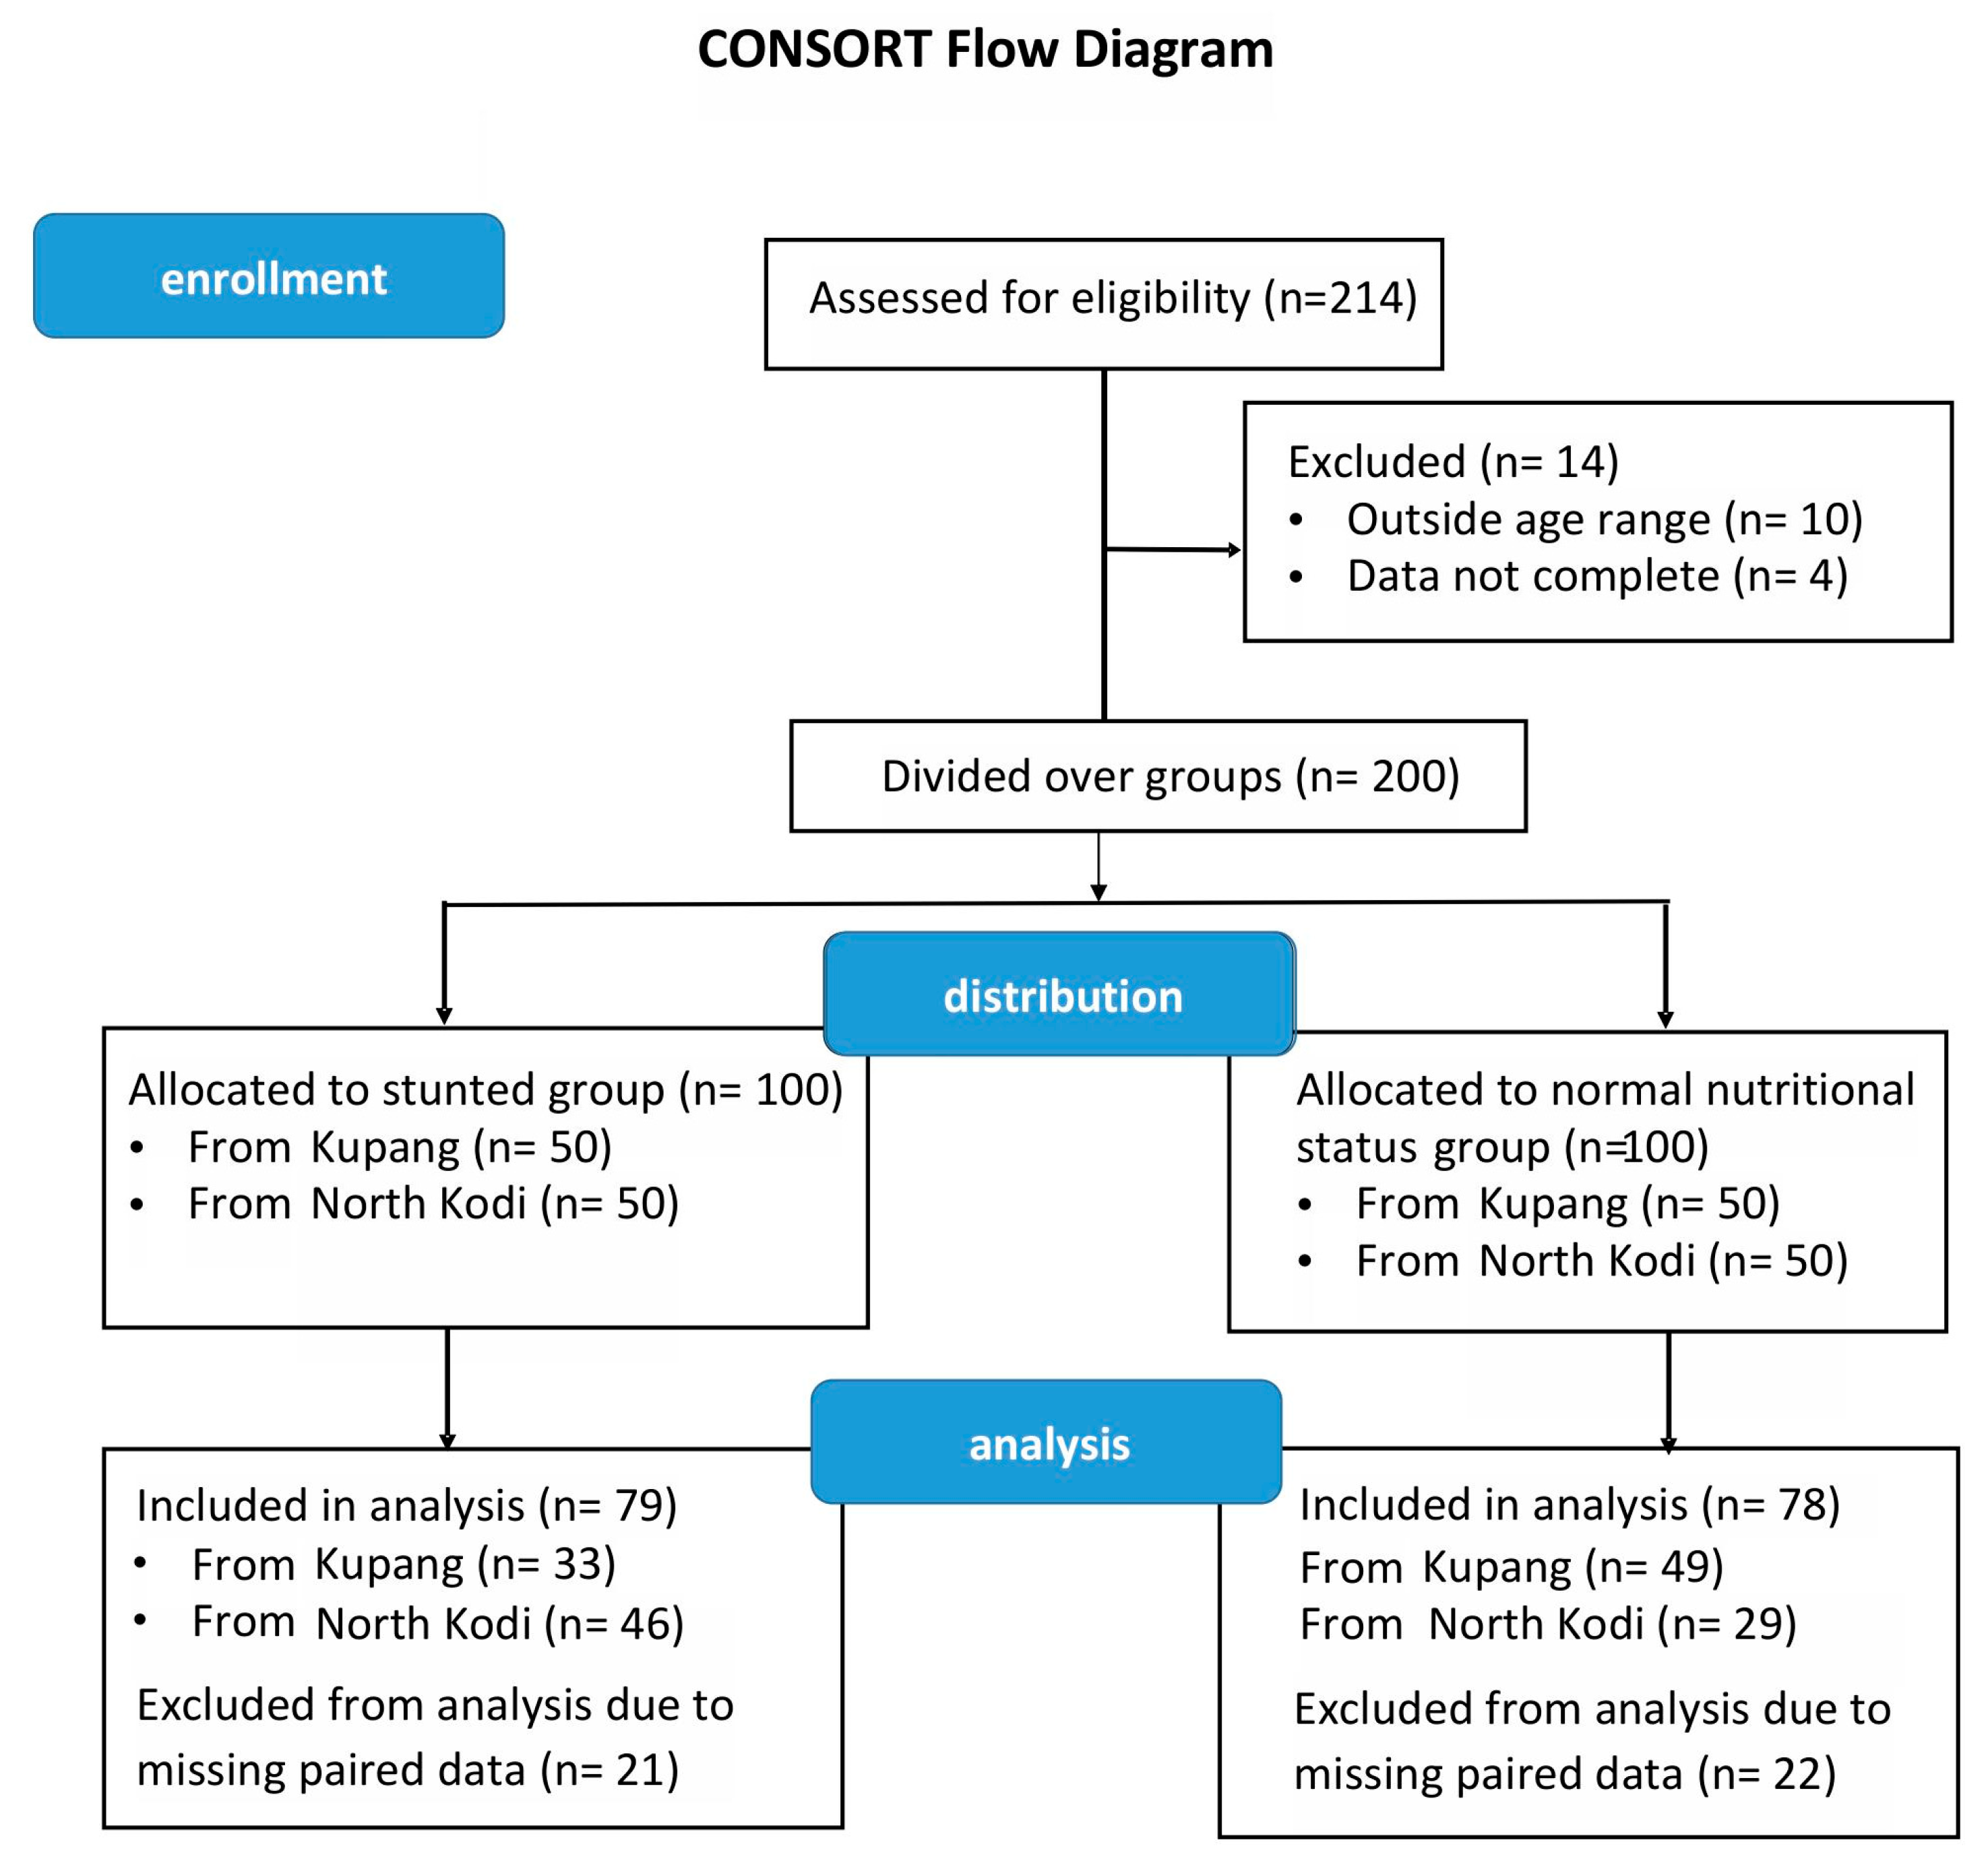
Ethics were in accordance with the ethical standards of the responsible committee on human experimentation (institutional or regional) and with the Helsinki Declaration of 1975, as revised in 2000. The study protocol was approved by the Ethics Committee of the Research Institute of YARSI University under number 308/KEP-UY/BIA/XII/2022 and registered at ClinicalTrials.gov with identifier number NCT05119218. Parents or children’s caregivers received oral and written information and signed a letter of consent before children were included in the study.

2.2. Study Design

A parallel-arm, placebo-controlled study was conducted on children aged 3–5 years old with stunting (n = 100) and normal nutritional status (n = 100), at two locations: Kupang and North Kodi, in the East Nusa Tenggara (ENT) Province. Age (in months) and anthropometric measurements (height (or length) and weight) were recorded based on Department of Health Ministry of Indonesia regulations, and from these, BMI was calculated. In addition, the nutritional status of each child was quantified using the nutritional Z-scores recommended by the WHO, namely (length or) height for age (zlen); weight for age (zwei); and weight for length (zwfl). In addition, the Z-score for BMI for age (zbmi) was calculated. For stunting, the thresholds for zlen are ‘severely stunted’ (<−3 SD); ‘stunted’ (−3 SD to <−2 SD); ‘non-stunted’ (−2 SD to +3 SD); and ‘tall’ (>+3 SD) [1].
The children were randomized (age- and sex-matched) into 3 groups, receiving either placebo, probiotic, or postbiotic for a period of 6 months. To not potentially negatively affect the stunted children in the placebo group, they were all given a functional biscuit (biscuit F1 [21] formulated with 3% Moringa flour, 15% tempe flour, and 20% banana flour; total energy 99 kcal, fat 4 g, protein 2.1 g, carb 13.8 g, dietary fiber 10.4 g, sugar 3.4 g; manufactured by PT. Garudafood Putra Putri Jaya Tbk, Jakarta, Indonesia) and 125 mL of UHT chocolate milk (PT Ultrajaya Milk Industry and Company, Bandung, Indonesia). The placebo consisted of UHT milk with Avicel, encapsulated in alginate and CaCl2. The UHT postbiotic chocolate milk contained killed cells of the probiotic Lactiplantibacillus (L.) plantarum IS-10506, corresponding to 1 billion colony-forming units (CFUs) per pack before these cells were killed by standard UHT treatment. The same probiotic strain, but then alive, was encapsulated in alginate beads, as described before [22] and added at 1 billion CFUs in an aluminum sachet, which the parents or caretakers had to mix with the chocolate milk. This choice was made to prevent settling of the encapsulated cells in the milk carton during storage. The probiotic strain was encapsulated to increase its survival in the gastrointestinal tract [22]. Lunch and dinner were provided in a controlled diet to the children. On top of the nutritional intervention, the following hygienic measures were taken for all children: access to clean water was provided (by drilling water wells and installing pumps for drinking water), along with soap and training in hand washing.

2.3. DNA Isolation and Sequencing of the V3–V4 Region of the 16S rRNA Gene

Fecal samples were collected on site from stunted children and non-stunted children and immediately placed in a cooler with ice packs and shipped the same day to the lab in Jakarta on dry ice. In the lab, 0.5 g of the feces was mixed with 4.5 mL of Zymo buffer (Baseclear, Leiden, The Netherlands) and kept at room temperature prior to extraction of DNA. DNA extraction of feces samples was performed using the Quick-DNA™ Fecal/Soil Microbe Miniprep Kit (Zymo Research, Irvine, CA, USA) according to manufacturer’s instructions, using the Precellys 24 tissue homogenizer (Bertin Instruments, Montigny-le-Bretonneux, France), applying 3 cycles of 30 s each with 5 min cooling on ice in between. DNA was amplified with barcoding, pooled, and subsequently sequenced with an Illumina MiSeq sequencing system according to the manufacturer’s instructions (Illumina, San Diego, CA, USA), as described before [10]. Sequences were converted into FASTQ files using the BCL2FASTQ pipeline; primer sequences were removed, and quality trimming was applied based on the Phred quality score. QIIME 2 software (version 2022.2) was used for microbial analyses [23]. The sequences were classified using SILVA (version 132) as a reference 16S rRNA gene database. The amplified sequence variants (ASVs) table was filtered for those taxa that occurred in more than 20% of the total number of fecal samples. Blanks and controls were taken and behaved as expected.

2.4. Statistical Methods

Differences between groups in anthropometric measurements and Z-scores were investigated using Student’s t-test (between two groups) and an ANOVA (between all groups) followed by Tukey’s post hoc analysis. Non-parametric Spearman’s rank-order correlations were obtained between continuous variables (e.g., anthropometric data and microbiota composition). The Benjamini–Hochberg false discovery rate (FDR) was applied after the Spearman correlation test to correct for multiple comparisons. The non-parametric Kruskal–Wallis test was applied to categorical variables (e.g., being stunted or not and different interventions) and also corrected with the Benjamini–Hochberg FDR. Linear mixed modelling and random forest analysis were performed on the dataset as well. All of these calculations were performed using the software package R (4.3.1) (R Core Team, www.R-project.org/, accessed on 11 January 2024) in RStudio (version 2023.06.1, built 524), with the tidyverse package [24]. Boxplots were created using the package ggplot2 (part of tidyverse). Paired boxplots were created using the package ggpubr [25]. Heatmaps of correlations were created and visualized using the corrplot package [26]. Linear mixed modelling was performed with the packages lmer4 [27], lmer Test [28], and broom. mixed [29]. For random forest analysis, the random forest package was used [30], with parameters ntry = 25, ntree = 999, and 70% of the data in the training set. The variable importance was plotted using ggplot2 and ggpmisc [31]. Q-values (adjusted p-values after FDR) were considered significantly different at q < 0.1.

3. Results

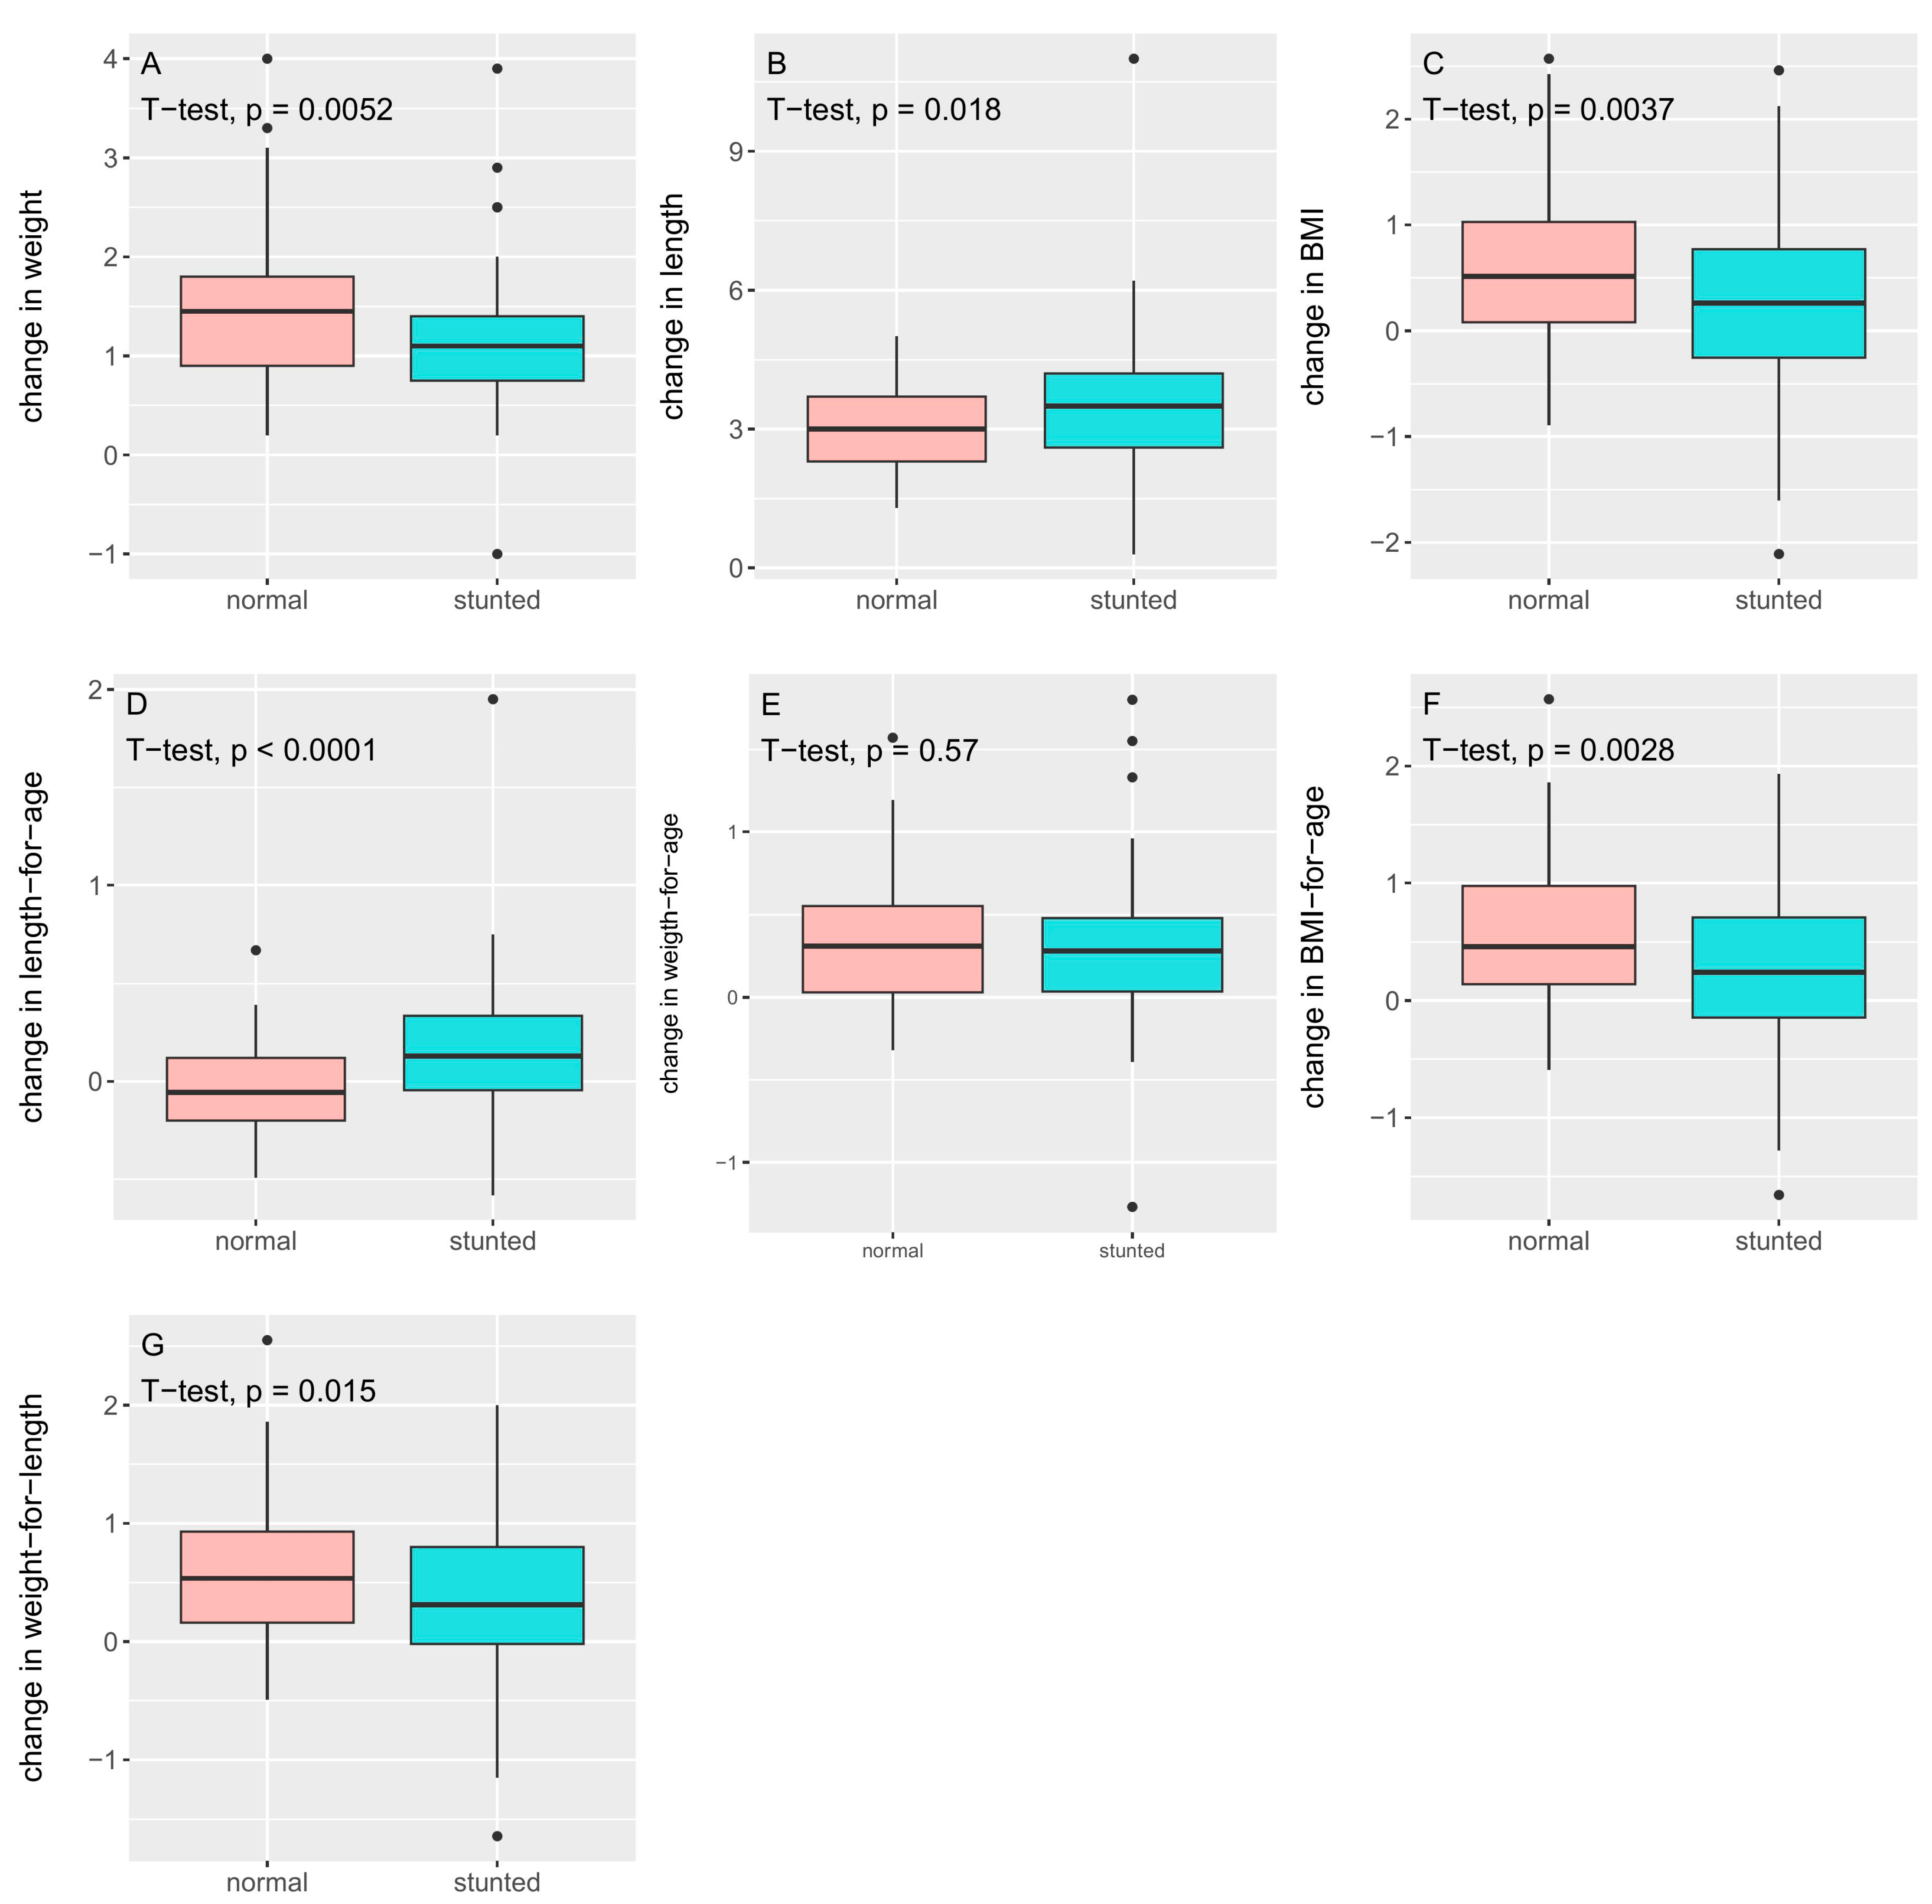
3.1. Anthropometric Measures

Figure 1 shows the CONSORT diagram of the study (Figure 1). For both stunted and non-stunted children, an initial total of 100 subjects were included. Baseline characteristics of these children were described before [10]. Due to missing paired sequence data, eventually, 79 stunted children and 78 non-stunted children were included in the analysis (Figure 1). These were essentially age- and gender-matched, although after removing subjects with paired missing data, age showed a significantly higher value for the stunted group. Table 1 shows the anthropometric data of those children at baseline and after the 6-month intervention, for which a complete dataset was collected at both time points. At baseline, the average Z-score for length (zlen) for the stunted children was −2.67 ± 0.51, ranging from −2.00 to −4.25. As observed before in our Java cohort [32], the non-stunted children were on average also shorter than the WHO reference standard, with an average of −1.12 ± 0.80, and a range of −1.99 to 1.15. Thus, despite being considered to have normal length according to the WHO, only 9 of 78 children were at or above the WHO reference zlen of 0.
The intervention consisted of increased access to clean water (essentially ensured by newly constructed drilled water wells) and providing functional biscuits [20] and chocolate milk for all children. To the chocolate milk either maltodextrin (placebo), the UHT-killed probiotic, or the probiotic L. plantarum IS-10506 was added. Therefore, the effects in the placebo group could be due to the hygienic measures in combination with the provided functional biscuit and chocolate milk.
Paired boxplots of the changes in the anthropometric parameters are provided in Supplemental Figure S1. As expected, all children grew in length and grew heavier (Table 2 and Figure 2 for change in anthropometric parameters). However, the stunted children remained shorter (length, zlen) and lighter (weight, zwei) than the non-stunted children after the 6-month intervention (Table 1). Despite this, the stunted children grew significantly more in length (3.55 ± 1.51 cm) than the non-stunted children (3.06 ± 0.93 cm, p = 0.018; Table 2 and Figure 2), although the difference was small. On the other hand, the non-stunted children gained significantly more weight (stunted 1.15 ± 0.66 kg versus non-stunted 1.46 ± 0.74 kg, p = 0.005; Table 2 and Figure 2), leading to a trend in significant differences for BMI (and zbmi) after the intervention (Table 1). Due to these changes in weight and length, the weight-for-length Z-score (zwfl) became significantly different between the two groups after the intervention (Table 1). Strikingly, the non-stunted children on average had a negative change in zlen (Table 2 and Figure 2), whereas the stunted children, in line with their bigger increase in length, had a positive change in zlen. The difference was highly significant (p < 0.0001).
The changes described above were independent of the interventions (placebo, probiotic or postbiotic). The ANOVA did not show any significant differences in the changes in anthropometric parameters between the three groups after the interventions (Supplemental Table S1a–g). Only when the postbiotic group was combined with the probiotic group (from which the postbiotic was derived) was the difference in weight after the intervention significantly higher than placebo (p = 0.05), with a trend in BMI (p = 0.07) and zbmi (p = 0.07). The two-factor ANOVA on the stunted and non-stunted groups split up by treatment showed significance for change in weight (p = 0.015), change in BMI (p = 0.0067), change in zlen (p = 0.0008), change in zbmi (p = 0.0055), and change in zwfl (p = 0.021) (Supplemental Table S2a–g). The Tukey post hoc analysis indicated that this was primarily due to differences within the postbiotic group, which showed higher weight gain (non-stunted: 1.59 ± 0.73, stunted: 1.04 ± 0.84; q = 0.05), higher BMI gain (non-stunted: 0.77 ± 0.69, stunted: 0.12 ± 0.80; q = 0.023), higher delta zlen (non-stunted: 0.71 ± 0.63, stunted: 0.14 ± 0.70; trend q = 0.051), higher delta zbmi (non-stunted: 0.74 ± 0.63, stunted: 0.18 ± 0.69; q = 0.015), and higher delta zwfl (non-stunted: 0.74 ± 0.61, stunted: 0.25 ± 0.70; q = 0.044) for the non-stunted children compared to the stunted children (Supplemental Table S2a–g).

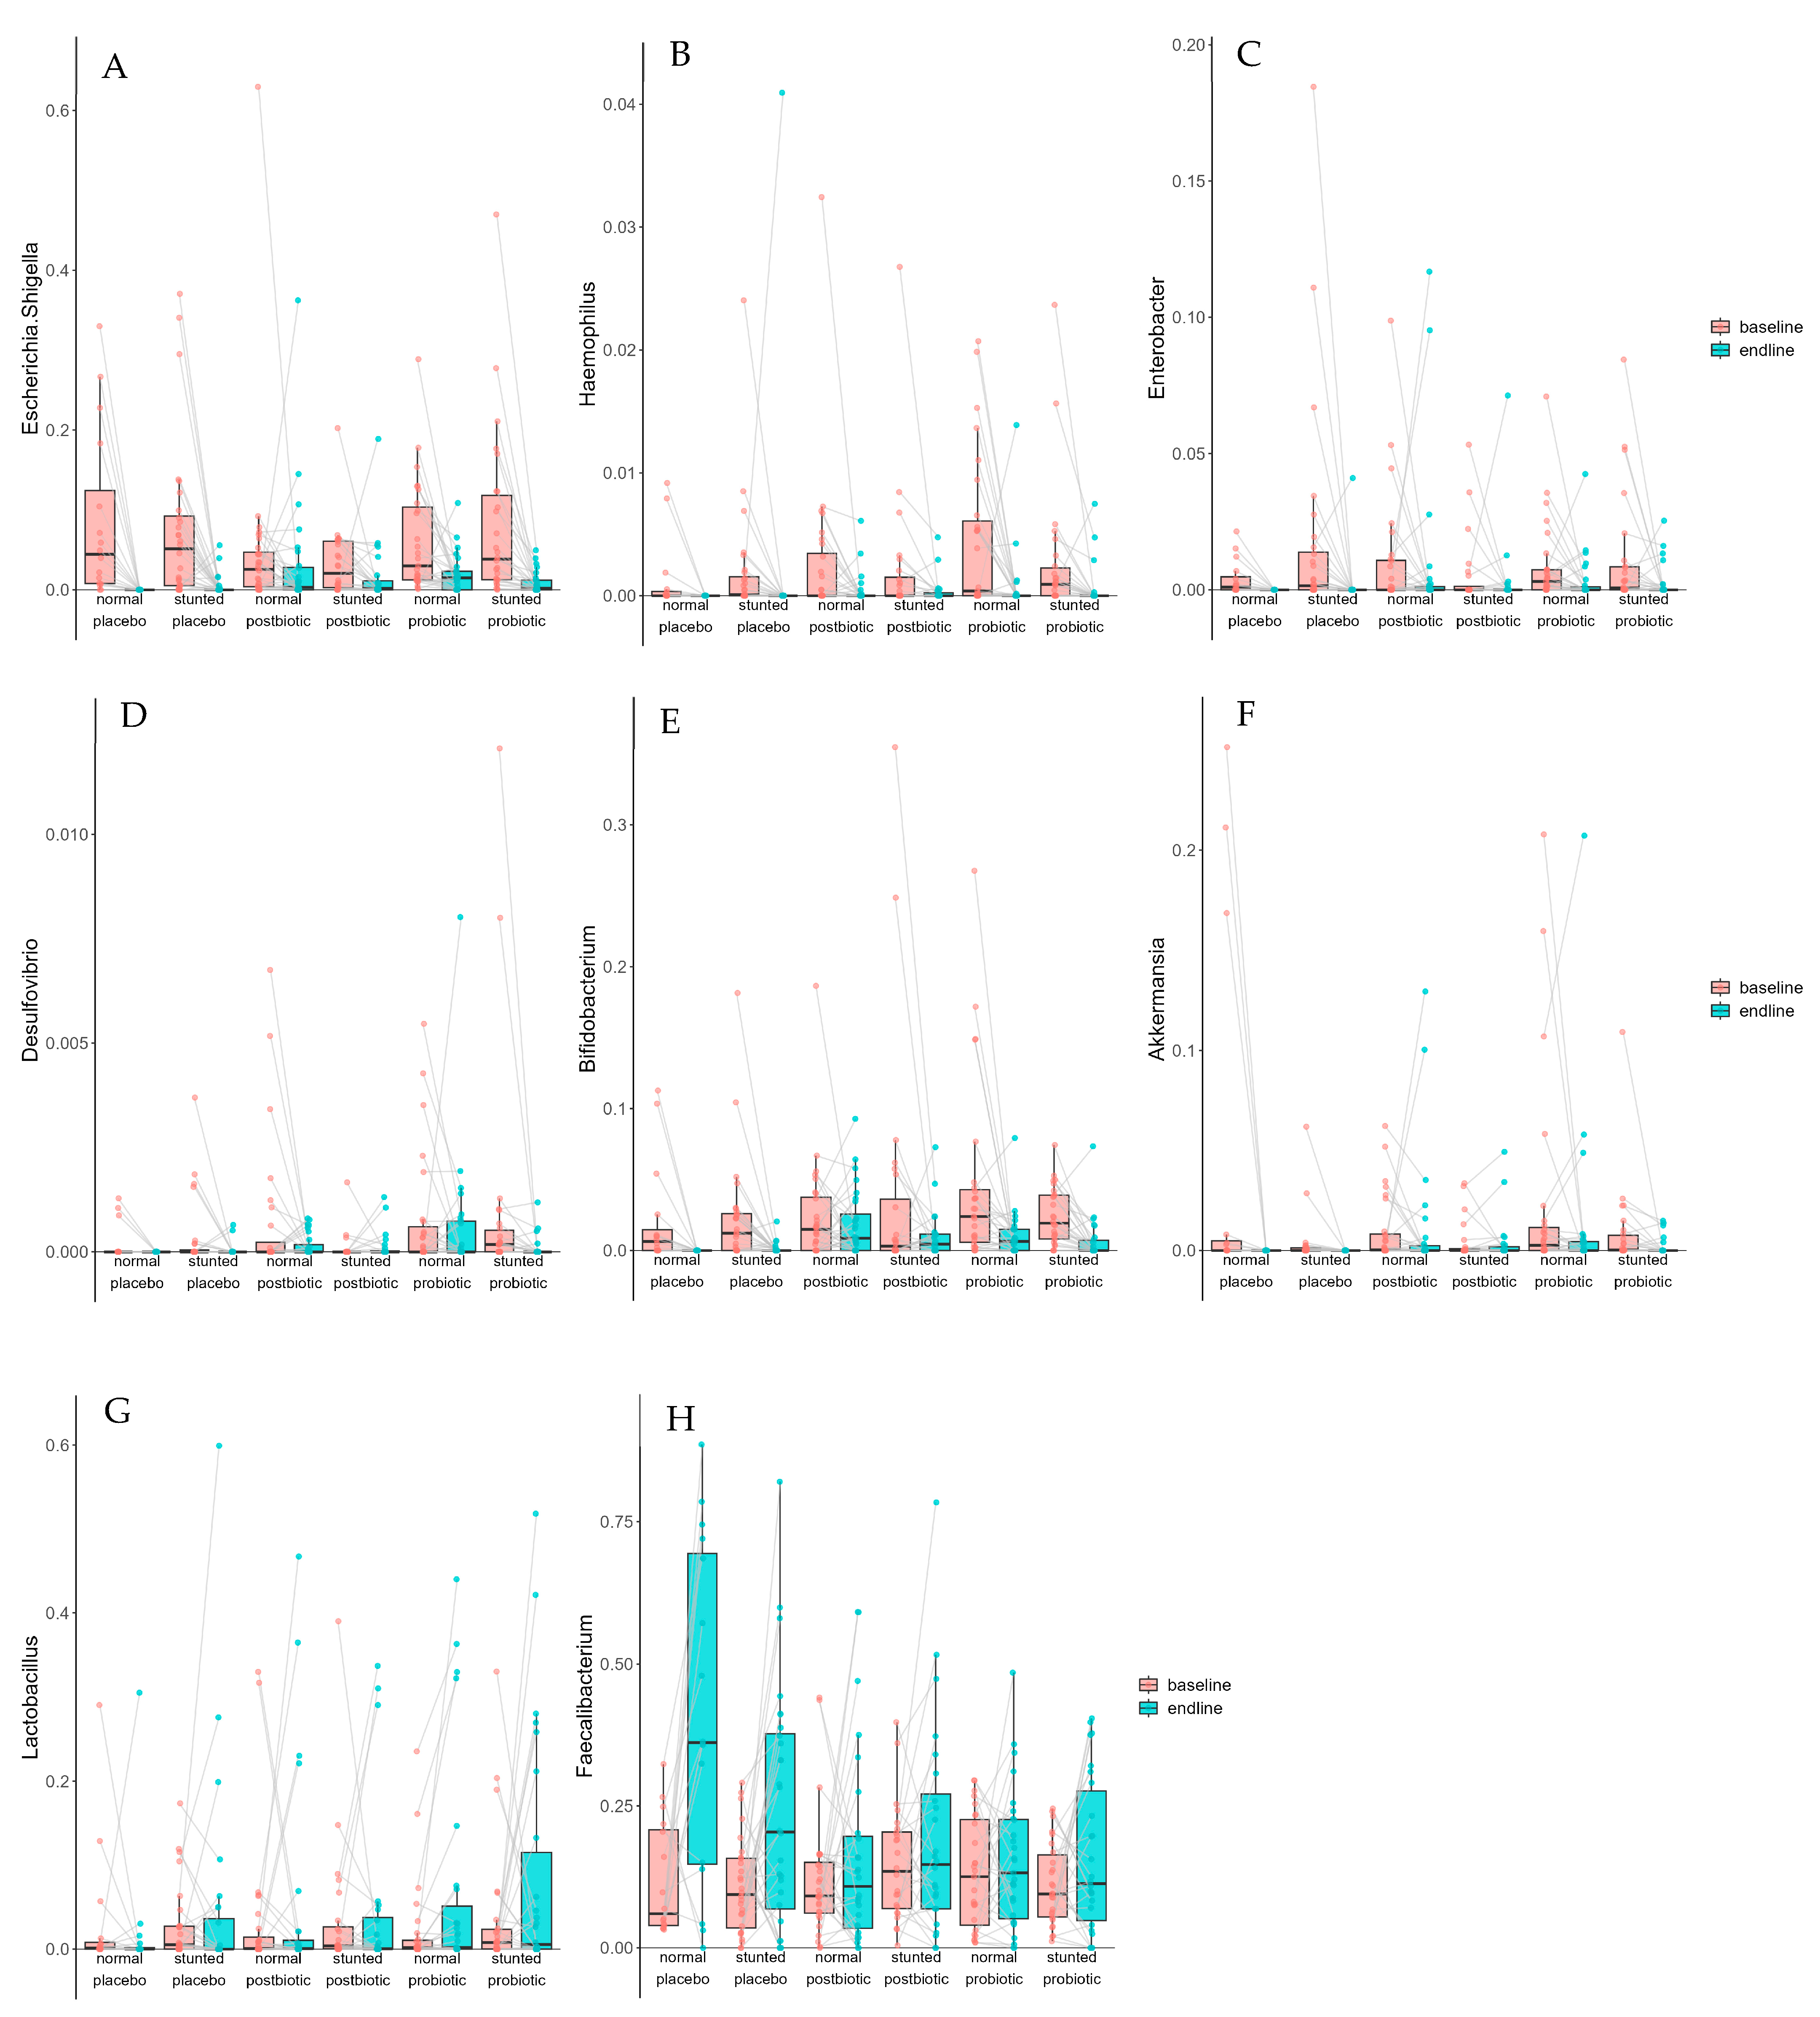
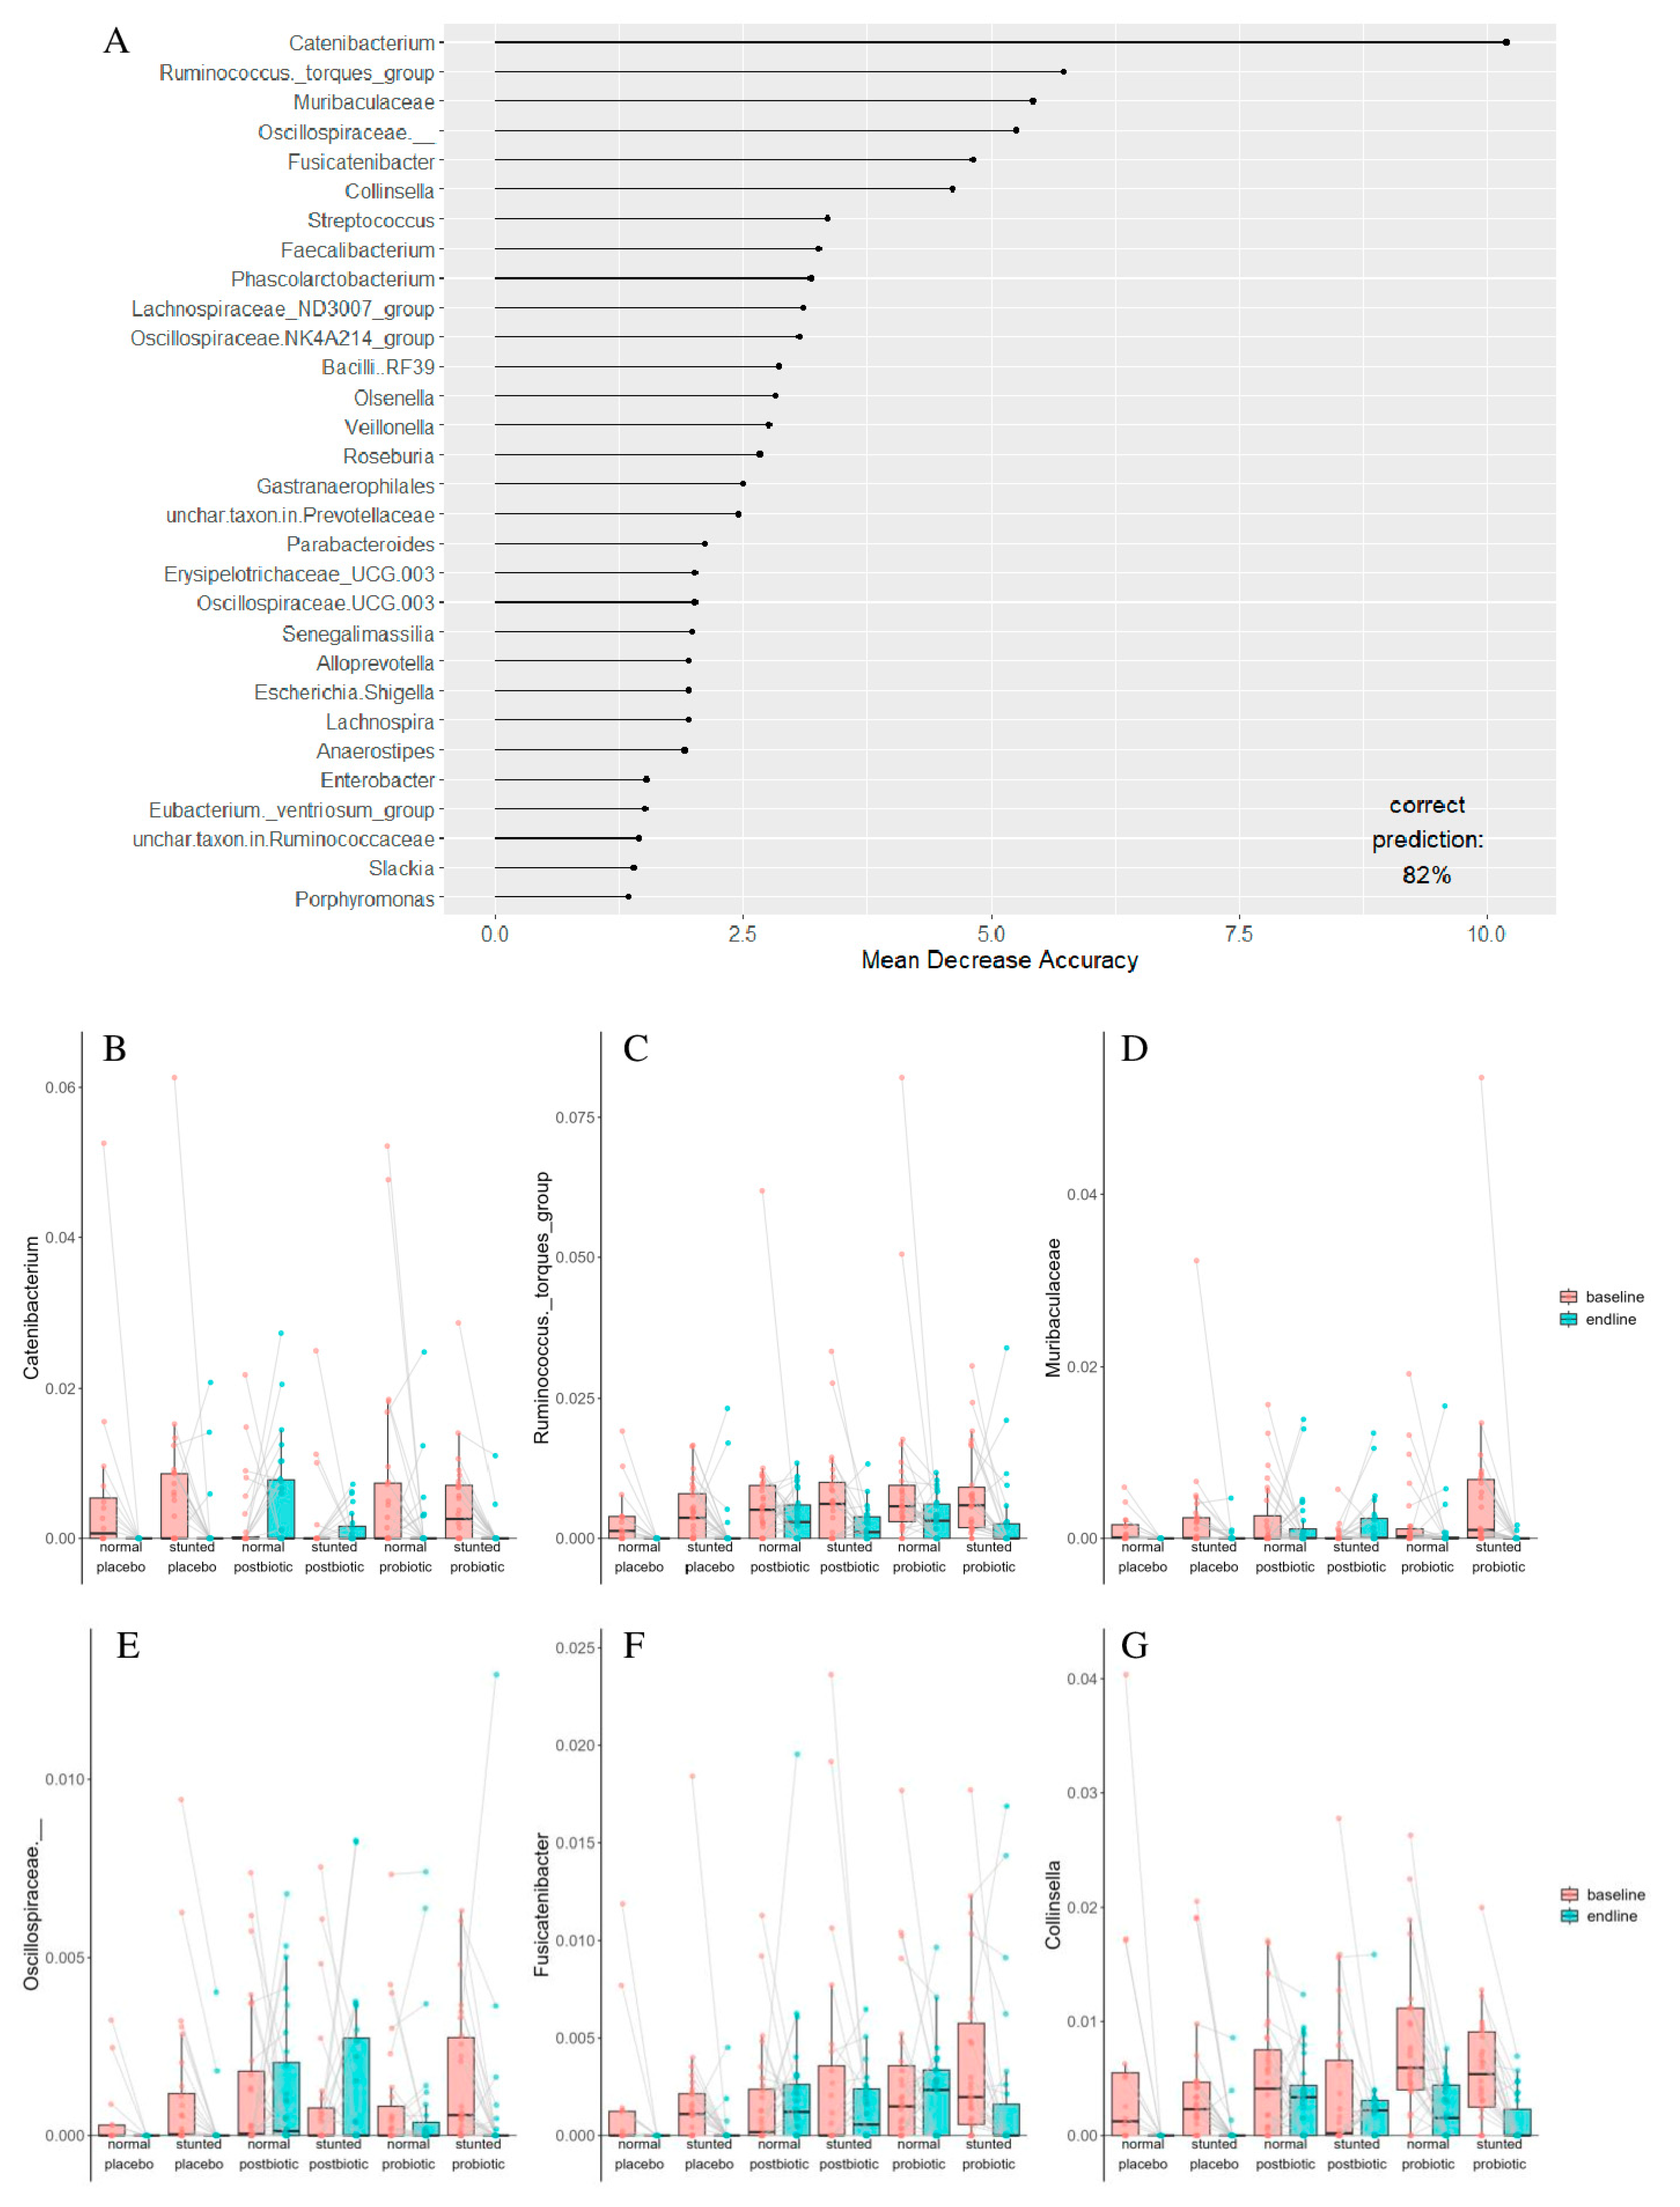
3.2. Microbiota Composition

At baseline, only three taxa were significantly different between non-stunted and stunted children as we reported before [10]: Lachnoclostridium, Faecalibacterium and Veillonella (Supplemental Figure S2). Of the 92 taxa that were prevalent in at least 20% of the samples, based on a Kruskal–Wallis analysis with Benjamini–Hochberg FDR correction, 85 taxa were significantly different between baseline and after intervention when split up in stunted and non-stunted children groups (q < 0.1). The most significant (by q-value and arguably also by biological relevance) was Escherichia/Shigella (the sequence of the V3–V4 region cannot discriminate between these two genera). The significant difference (q = 6.44 × 10⁻¹⁵) was between baseline and after intervention (endline) for all groups combined.
At baseline, Escherichia/Shigella was prevalent at an average of 6.4% relative abundance (RA) and not significantly different between stunted and non-stunted children (6.3% ± 9.7% for non-stunted children; 6.6% ± 9.1% for stunted children). After the 6-month intervention, the prevalence dropped to 1.5% RA, with the largest drop in the placebo group, but there were no differences in response between stunted and non-stunted children (2.0% ± 5.0% for non-stunted children; 1.1% ± 2.6% for stunted children; Figure 3A). On average, 28 taxa increased in relative abundance, whereas 64 decreased. Apart from Escherichia/Shigella, other potential/opportunistic pathogens decreased as well, such as Haemophilus (q = 2.0 × 10⁻⁹; Figure 3B), Enterobacter (q = 7.6 × 10⁻⁷; Figure 3C), and Desulfovibrio (q = 0.04; Figure 3D). Unfortunately, several taxa that are normally considered beneficial for health were reduced as well, such as Bifidobacterium (q = 9.7 × 10⁻⁹; Figure 3E), Akkermansia 7.7 × 10⁻⁵; Figure 3F), and several butyrate producers. On the other hand, Lactobacillus (q = 0.054; Figure 3G) and Faecalibacterium increased (q = 0.007), the latter primarily in the placebo group (Figure 3H). Linear mixed modelling also indicated some of these taxa to be significantly different. These are indicated with an * in the legend of Figure 3. Table 3 shows all taxa identified by linear mixed modelling to be significantly linked to baseline vs. after intervention (endline) or to be associated with the postbiotic or probiotic group. Paired boxplots (that are not already in Figure 3 and Figure 4) are in Supplemental Figure S3.
Random forest analysis was used to predict to which group a child belonged (stunted or non-stunted, one of the three interventions) based on the change in microbiota composition compared to baseline (Figure 4A). Catenibacterium was the taxon that explained most of the predictions into groups, primarily because it was high in the baseline placebo and probiotic groups (both stunted and non-stunted children) and was basically absent after intervention in these groups, whereas the reverse was true for the postbiotic groups (stunted and non-stunted), where Catenibacterium was basically absent at baseline but increased after the intervention (Figure 4B). Focusing on the taxa with a mean decrease accuracy of 4 or more, it can be observed that the Ruminococcus torques group decreased in all groups, but more so in the placebo treatment (Figure 4C). Moreover, Muribaculaceae was reduced in all groups after the intervention (Figure 4D). An uncharacterized taxon in the family Oscillospiraceae was also identified by random forest to be predictive for the groups. It was reduced in both placebo-treated groups and in both probiotic-treated groups, whereas it was slightly increased in both postbiotic-treated groups (Figure 4E). Fusicatenibacter was reduced in both placebo-treated groups and in the stunted probiotic-treated group, whereas it was increased in both postbiotic-treated groups and the non-stunted probiotic-treated group (Figure 4F). Lastly, Collinsella was reduced in all groups, except the stunted postbiotic-treated group (Figure 4G). Taxa with an asterisk in Figure 4 were also identified by linear mixed modelling to be significant (Table 3).

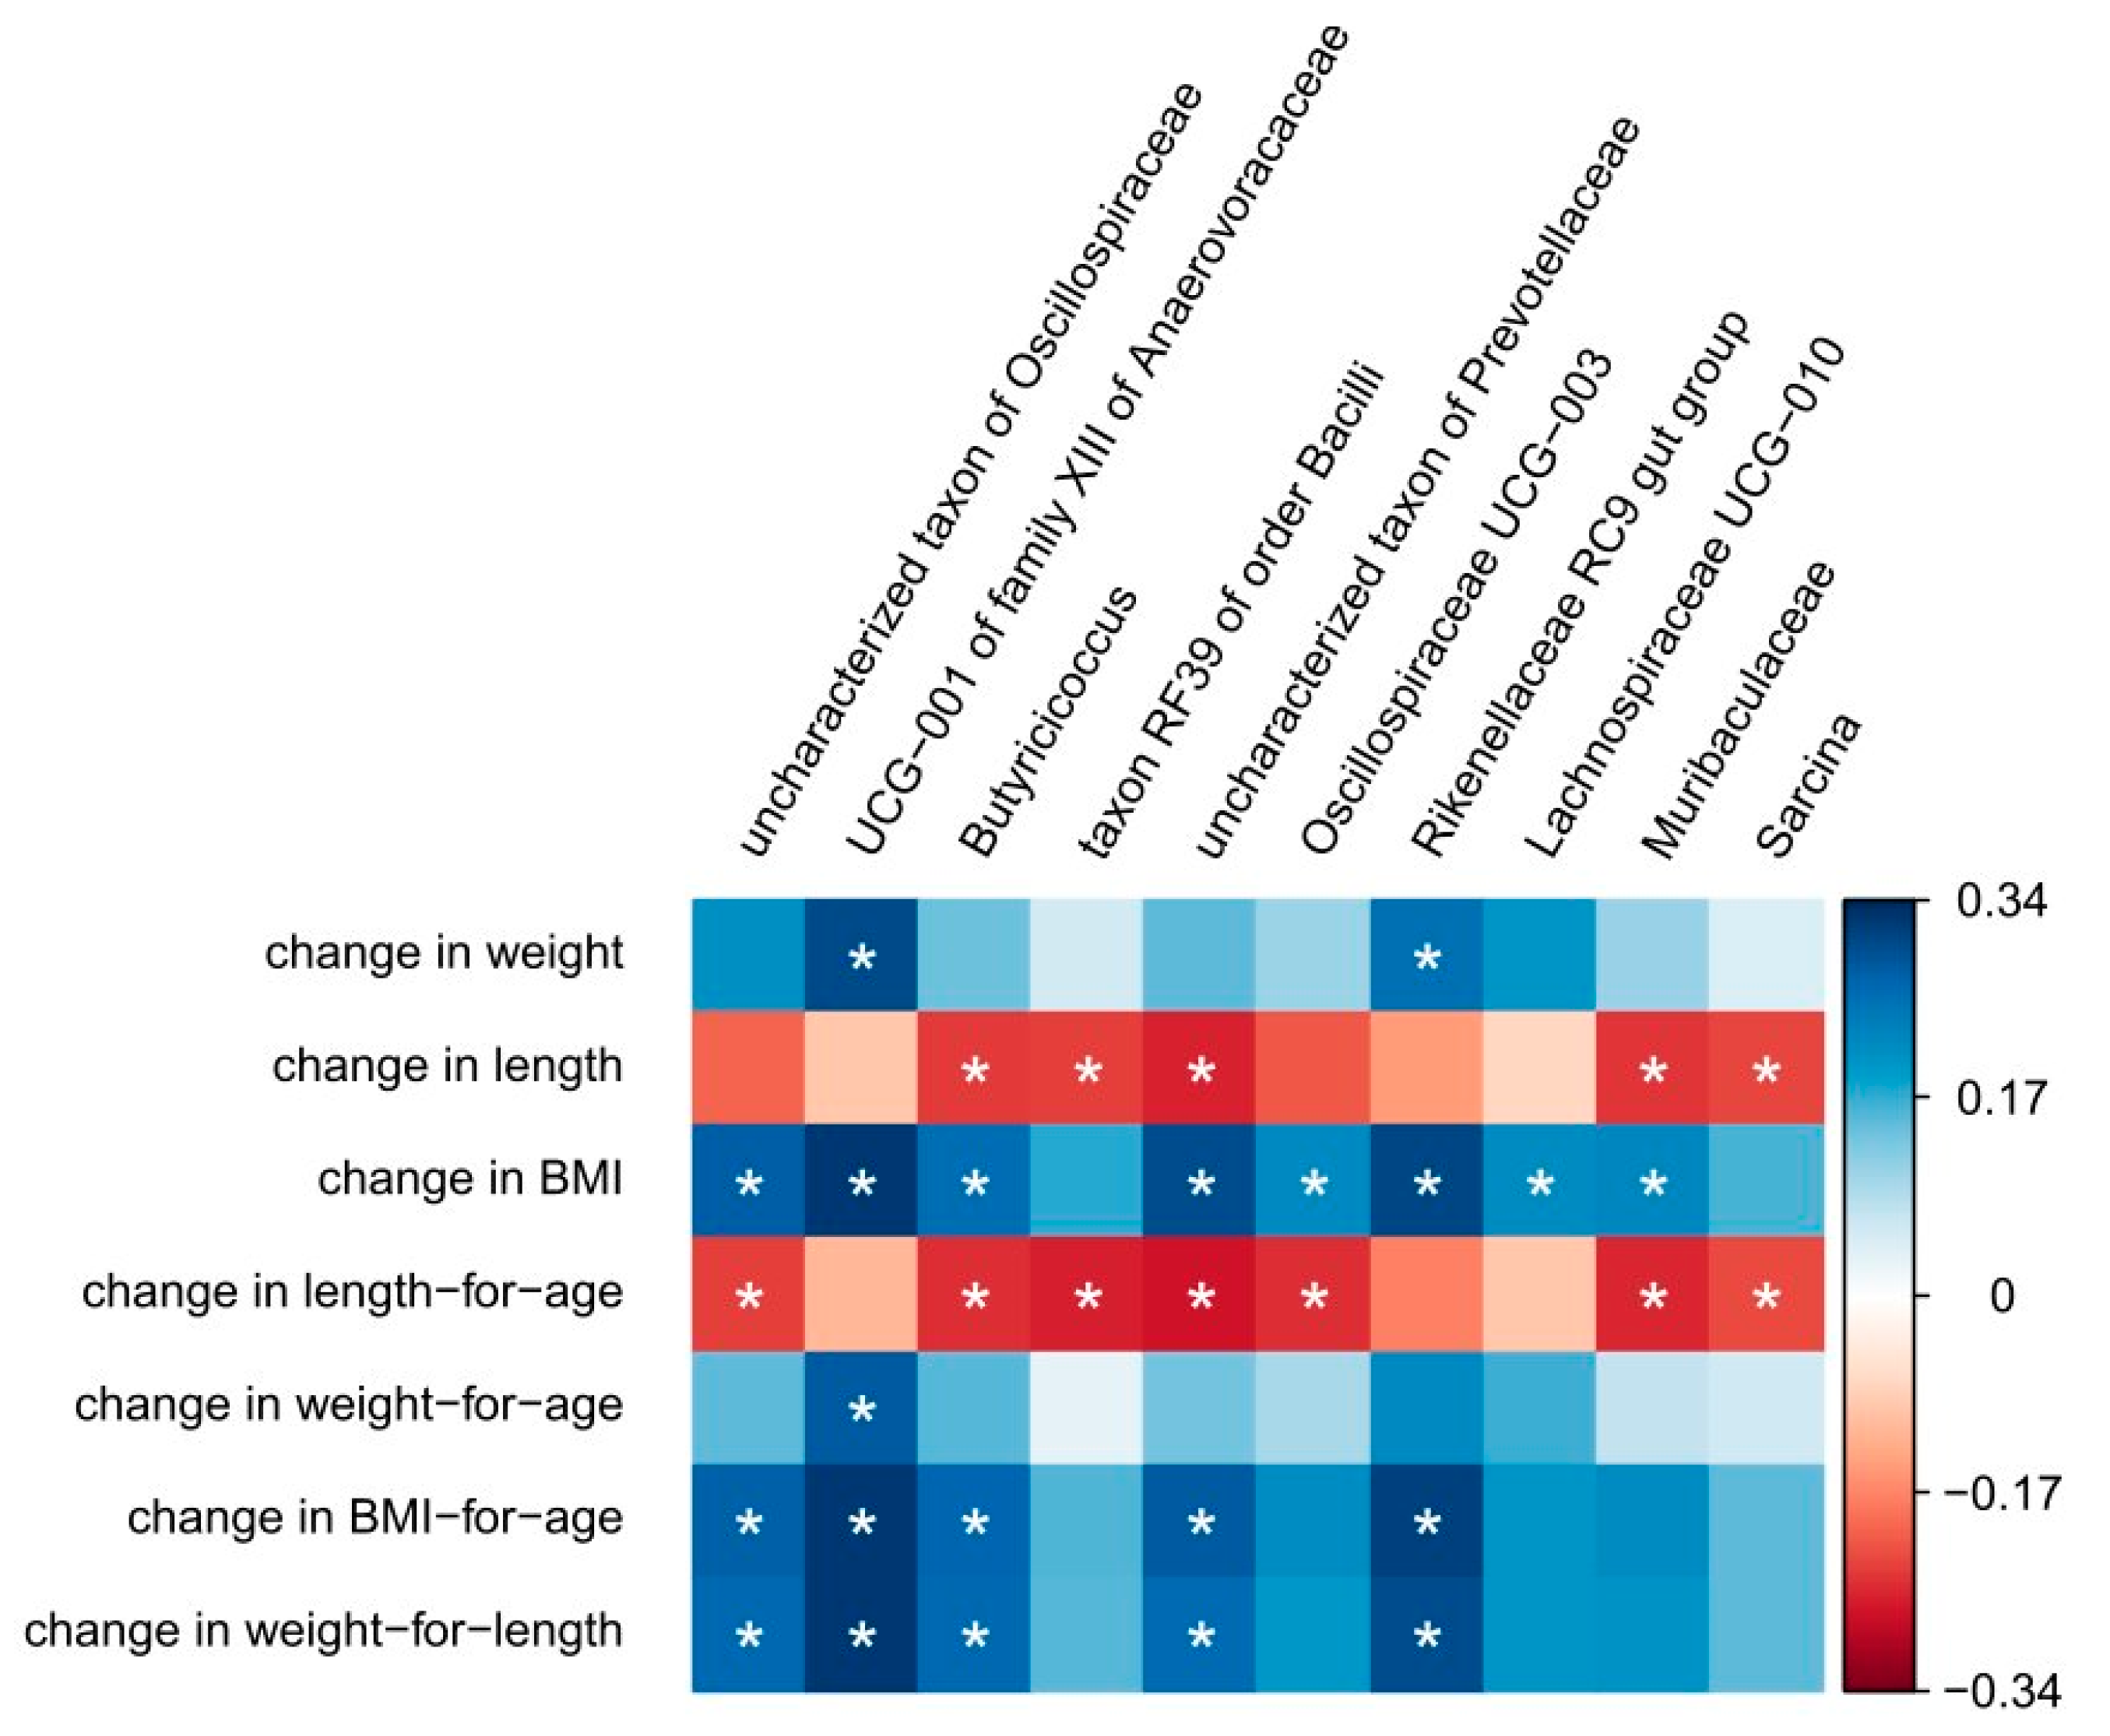
3.3. Correlation Between Anthropometric Measures and Changes in Microbiota Composition

The change in anthropometric measures from baseline to after intervention (endline) was correlated with the change in microbiota composition. Figure 5 shows the taxa that have one or more significant correlations with the anthropometric measures. Two of the taxa identified by random forest, the uncharacterized taxa in the family Oscillospiraceae and Muribaculaceae, both showed a negative correlation with the change in zlen (q- and rho-values in Supplemental Table S3). Moreover, Butyricicoccus, taxon RF39 of order Bacilli, an uncharacterized taxon of Prevotellaceae, Oscillospiraceae UCG−003, and Sarcina also showed a negative correlation with the change in zlen (Figure 5).

4. Discussion

The intricate relationship between dietary changes and microbiota composition plays a vital role in influencing growth outcomes in stunted children. Recent studies highlight that modifying dietary intake can significantly alter gut microbiota, which in turn impacts nutritional absorption and immune, metabolic, and gut health [8,12,13,14,17]. Dysbiosis, or an imbalance in the gut microbial community, has been linked to undernutrition and impaired growth, suggesting that the gut microbiota may play a pivotal role in the pathophysiology of stunting [33]. Research indicates that alterations in gut microbiota composition can precede observable stunting, highlighting the potential for early interventions to mitigate growth impairment [34]. Moreover, specific microbial metabolites, particularly short-chain fatty acids (SCFAs), are crucial for maintaining gut health and regulating growth, further establishing the gut microbiota’s influence on child development [35,36]. Furthermore, hygienic practices significantly impact the composition and diversity of gut microbiota, which are crucial for the growth and development of children, particularly those at risk of stunting. Poor hygienic conditions can lead to the disruption of beneficial microbial communities, resulting in dysbiosis—a state that has been linked to malnutrition and stunted growth. Effective hygiene interventions, including improved sanitation and food safety, can foster a healthier microbiota, which subsequently supports optimal nutritional outcomes in children. Recent studies highlight the interplay between hygiene, nutrition, and gut microbiota, suggesting that enhancing children’s microbiota through hygienic measures may help mitigate growth impairments associated with chronic malnutrition [37,38,39].
At baseline, our cohort contained high numbers of Escherichia/Shigella, irrespective of nutritional status [10]. Moreover, the stunted children contained more Gram-negative taxa and more potential pathogens [10]. The drastic reduction of Escherichia/Shigella upon intervention in all groups is likely reflective of the hygienic measures that were taken in the study, although the role of the functional biscuit cannot be ruled out, as also the placebo-treated children showed this reduction. Together with a reduction in other potential pathogens, such as Enterobacter, Haemophilus and Desulfovibrio, it is tempting to speculate that the (gut) health of the children was improved. Future studies will have to shed light on this.
The initial baseline microbiota composition did not significantly predict response to the intervention. Numerous taxa changed. The reduction in several of the Gram-negative taxa could have beneficial effects on immunological and metabolic functions. However, taxa that are also considered beneficial, such as Bifidobacterium and Akkermansia, were reduced. Several probiotic strains of Bifidobacterium species have been shown to be immunomodulatory e.g., [40,41]. As sequencing analysis of the V3–V4 region of the 16S rRNA gene only allows identification at the genus level, it is currently unclear which species of Bifidobacterium were reduced and what the effect of that is on immunological and metabolic functions. While Akkermansia is negatively correlated with overweight [42], its role in stunting has not been investigated before. Faecalibacterium, considered a biomarker for a healthy gut microbiota [43], was increased in all treatments. It has been shown to have anti-inflammatory effects (among others) due to production of butyrate and an extracellular MAM-protein [43,44].
Several studies have shown that probiotics have a limited effect on the composition of the gut microbiota [45,46,47]. Some studies have suggested that probiotics may impact the function of colonizing microbes, although this needs to be further studied. An alternative hypothesis is that probiotics may promote homeostasis of the gut microbiota, rather than change its composition [46]. In our study there were limited changes in the gut microbiota of the pro- and postbiotic group compared to the placebo. Even Lactobacillus levels did not rise significantly in the probiotic-treated children, despite protective microencapsulation [22]. Both groups had an equal distribution of children showing either an increase or a decrease (non-stunted and stunted; Figure 3G), but this was similar in the postbiotic and placebo groups. As the postbiotic was the UHT-killed probiotic, no effect on Lactobacillus counts was expected. Nevertheless, both treatments may affect host health by affecting, e.g., immune or metabolic parameters in the upper GI tract, as has been shown for this probiotic in numerous previous studies [18,19,48,49,50,51,52]. This was not investigated in the current study. Here, we aimed to study the effect of the interventions on growth. Only the postbiotic group showed measurable improvement (Supplementary Table S2), where the change in zlen for the stunted children was significantly higher than that of the non-stunted children. The probiotic treatment did not show significant differences. It is unclear why the postbiotic showed slightly more favorable trends. Beyond reducing the pathogen load in the children, as observed for Escherichica/Shigella, the probiotic/postbiotic could beneficially affect the immune system. The immune system, when activated (usually due to infections), consumes a lot of energy that cannot be used for linear growth. This might have been a mechanism by which this particular probiotic (and/or its postbiotic) could have contributed to reduced lag in growth. Probiotics should be alive upon ingestion. In tropical countries like Indonesia, distribution of cooled products containing live probiotics to remote areas such as East Nusa Tenggara is challenging. The use of inactivated cells of the probiotic can therefore be of paramount importance for this kind of application. Several studies have shown that inactivated cells (postbiotics) can be as efficacious as the live probiotics themselves e.g., [53]. Unfortunately, the current study could not discriminate the effect of the intervention with both ‘-biotics’ above the simultaneous intervention with the functional biscuit and hygienic measures.
Overall, when all treatments were combined, the stunted children grew a few centimeters more in those 6 months than the non-stunted children, which led to a highly significant higher increase in zlen (p < 0.0001). Although the change was minimal and surely did not lead to the stunted children catching up with the non-stunted children (the difference in height was, on average, 5.1 cm at baseline vs. 4.61 cm after the intervention), still they showed some catch-up due to the treatments. This is likely more due to the hygienic measures in combination with the functional biscuit and the provided chocolate milk (in which the placebo was also provided), then the pro- or postbiotic treatment. It is tempting to speculate that this +0.5 cm in 6 months may translate to meaningful better health later in life, certainly if this catch-up growth can be maintained, but this remains to be seen. It is unknown whether changes in the microbiota and anthropometric measures were sustained after cessation of the intervention, except that the little bit of catch-up growth that was seen for the stunted children will likely remain. The rate of catch-up may, however, have dropped again. This should be investigated in follow-up studies. There were no taxa that showed significant positive correlations with a change in zlen and/or height, but several taxa showed negative correlations with a change in these measures. These might be taxa that can be targeted by nutritional interventions early in life to mitigate the retardation in growth in stunted children. Which interventions are successful in targeting these taxa remain to be seen.
A strength of the study was that food intake was controlled, in the sense that all lunches and dinners were provided. Nevertheless, we could not isolate the effects of the probiotic/postbiotic interventions from other simultaneous interventions such as hygienic interventions (e.g., clean water, soap, and handwashing education), which could have been confounding factors. The placebo group also showed improvements, suggesting that non-specific intervention components (e.g., improved nutrition and hygiene) likely contributed substantially to outcomes. Including a true control group without nutritional or hygiene enhancements; using factorial or crossover designs to better understand and unravel each component’s contribution; and measuring health biomarkers (e.g., SCFAs, inflammatory markers) to differentiate functional effects more clearly in future trials are necessary steps. The influence of sex or using finer age intervals (e.g., 3 instead of 5 years) on growth or microbiota changes was not explored. These factors can explain heterogeneity in outcomes and modulate response to the intervention. However, this study used a similar setup as our earlier study in Java, with the same age interval. During that study, we did not observe any indications that a smaller age interval would have reduced heterogeneity.
The cyclical nature of stunting, where stunted mothers are likely to give birth to stunted children, underscores the intergenerational transmission of this condition [54] and the importance of tackling this issue. Ultimately, understanding the dynamics and the role of the gut microbiota in this process allows healthcare providers to develop targeted nutritional strategies aimed at optimizing health outcomes for children at risk of stunting, thereby addressing a critical global health issue. Improving the gut microbiota in conjunction with re-nutrition techniques has the potential to ameliorate growth and development impairments in these stunted children. Our future studies will focus on this.

Supplementary Materials

The following supporting information can be downloaded at https://www.mdpi.com/article/10.3390/foods14132218/s1, Figure S1. Paired boxplots of anthropometric measures before and after the 6-month intervention; Figure S2. Boxplots of the three taxa that were different between stunted and non-stunted children at baseline. Modified from [10]; Figure S3. Paired boxplots of taxa that were significant after linear mixed modelling (Table 3); only those taxa are plotted here that are not yet in Figure 3 or Figure 4. (A) Alistipes, (B) Barnesiella, (C) Butyricicoccus, (D) Christensenellaceae R-7 group, (E) Erysipelotrichaceae UCG-003, (F) Eubacterium hallii group, (G) Monoglobus, (H) Olsenella, (I) Oscillospiraceae UCG-003, (J) Senegalimassilia, (K) Turicibacter; Table S1. ANOVA results of microbiota changes in the three different treatment groups; Table S2. ANOVA results of microbiota changes in the three different treatment groups segregated by stunted and non-stunted children; Table S3. Q- and rho-values for the Spearman correlations of Figure 5. Only significant values are provided.

Author Contributions

Conceptualization, I.S.S., S.M. and K.V.; methodology, I.S.S., P.D.K. and K.V.; software, K.V.; formal analysis, K.V.; investigation, I.S.S. and P.D.K.; resources, I.S.S.; data curation, K.V.; writing—original draft preparation, K.V.; writing—review and editing, all authors; visualization, K.V.; supervision, I.S.S.; project administration, I.S.S.; funding acquisition, I.S.S. All authors have read and agreed to the published version of the manuscript.

Funding

This study was funded by (a) the National Research Priority (PRN) Scheme, Directorate General of Higher Education, Research, and Technology, Ministry of Education, Culture, contract Number: 022/E4.1/AK.04.PRN/2021, dated 14 September 2021, entitled “Profil Mikrobiota Saluran Cerna, Infeksi Parasit Dan Hygiene Practice Serta Skor Kognitif, Anak Sehat Dan Stunting Di Nusa Tenggara Timur”; (b) the Research and Innovation for Advanced Indonesia (RIIM) Scheme, National Research and Innovation Agency (BRIN), Indonesia, LPDP grant contract number: 89/IV/KS/11/2022; dated 30 November 2022, entitled “Studi Intervensi Pangan Fungsional bergizi terhadap profil Gut Mikrobiota usus, SCFA, Gut Integrity, status gizi, Kognitif dan respon imun anak stunting di Nusa Tenggara Timur: Mekanisme Molekuler”; (c) the World Class Professor 2023 Program, Directorate of Human Resources, Directorate General of Higher Education Research and Technology, Ministry of Education, Culture Research and Technology, Indonesia; and (d) the Centre for Healthy Eating and Food Innovation (HEFI) of Maastricht University—campus Venlo, which was made possible by the support of the Dutch Province of Limburg, grant number HEFI-1. The funders had no role in study design, data collection and analysis, decision to publish, or preparation of the manuscript.

Data Availability Statement

The datasets analyzed during the current study are available from the corresponding author on reasonable request. Sequence data has been deposited in the Sequence Read Archive under Bioproject number PRJNA1065733 (https://www.ncbi.nlm.nih.gov/bioproject/PRJNA1065733/, accessed on 18 June 2025).

Acknowledgments

We would like to express our gratitude to the people who helped to make this study feasible, particularly the young children and parents/guardians in Kupang and North Kodi; the village officials; Maria Karuniawati, the head of Public Health Center Oebobo, Kupang; Stepania M.G.kaka, A.Md, the head of Public Health Center Kori, North Kodi; the local government of East Nusa Tenggara Province; the midwives; the people of the various villages; and the pediatric department and laboratory technicians of Airlangga University, Indonesia. We thank Jessica Verhoeven and Sanne Verbruggen for their help with sequencing.

Conflicts of Interest

Author Koen Vennma is founder and CEO of the company Beneficial Microbes Consultancy. This company was not involved in set-up or funding of the study. The remaining authors declare that the research was conducted in the absence of any commercial or financial relationships that could be construed as a potential conflict of interest.

Abbreviations

The following abbreviations are used in this manuscript:
ASVsAmplified sequence variants
CFUsColony-forming units
ENTEast Nusa Tenggara
FDRFalse discovery rate
SCFAsShort-chain fatty acids
WHOWorld Health Organization
zbmiBMI for age
zlenHeight-for-age Z-score
zweiWeight for age
zwflWeight for length

References

  1. World Health Organization. WHO Child Growth Standards and the Identification of Severe Acute Malnutrition in Infants and Children—A Joint Statement by the World Health Organization and the United Nations Children’s Fund; World Health Organization: Geneva, Switzerland, 2009. Available online: https://www.who.int/publications/i/item/9789241598163 (accessed on 11 January 2024).
  2. Lefebo, B.K.; Kassa, D.H.; Tarekegn, B.G. Factors associated with stunting: Gut inflammation and child and maternal-related contributors among under-five children in Hawassa City, Sidama Region, Ethiopia. BMC Nutr. 2023, 9, 54. [Google Scholar] [CrossRef]
  3. Chibuye, M.; Mende, D.R.; Spijker, R.; Simuyandi, M.; Luchen, C.C.; Bosomprah, S.; Chilengi, R.; Schultsz, C.; Harris, V.C. Systematic review of associations between gut microbiome composition and stunting in under-five children. npj Biofilms Microbiomes 2024, 10, 46. [Google Scholar] [CrossRef] [PubMed]
  4. Beal, T.; Tumilowicz, A.; Sutrisna, A.; Izwardy, D.; Neufeld, L.M. A review of child stunting determinants in Indonesia. Matern. Child Nutr. 2018, 14, e12617. [Google Scholar] [CrossRef] [PubMed]
  5. Siramaneerat, I.; Astutik, E.; Agushybana, F.; Bhumkittipich, P.; Lamprom, W. Examining determinants of stunting in Urban and Rural Indonesian: A multilevel analysis using the population-based Indonesian family life survey (IFLS). BMC Public Health 2024, 24, 1371. [Google Scholar] [CrossRef]
  6. Central Bureau of Statistics-Ministry of Health Indonesia. Report on Integration of Economic Social Survey (Susenas) Implementation, March 2019 and Nutritional Status of Children Younger than Five Study in Indonesia (SSGBI). Available online: https://www.bps.go.id/en/statistics-table/2/MTYxNCMy/prevalensi-balita-sangat-pendek-dan-pendek-pada-kabupaten-kota-ssgbi.html (accessed on 11 January 2024).
  7. Hardjo, J.; Selene, N.B. Stunting and Gut Microbiota: A Literature Review. Pediatr. Gastroenterol. Hepatol. Nutr. 2024, 27, 137–145. [Google Scholar] [CrossRef] [PubMed]
  8. Kadia, B.M.; Ramsteijn, A.S.; Dasi, T.; Fahmida, U.; Kulkarni, B.; Faye, B.; Htet, M.K.; Sow, D.; Kalashikam, R.R.; Sharma, R.; et al. Assessment of the role of gut health in childhood stunting in a multisite, longitudinal study in India, Indonesia and Senegal: A UKRI GCRF Action Against Stunting Hub protocol. BMJ Paediatr. Open 2024, 8 (Suppl. S1), e001637. [Google Scholar] [CrossRef]
  9. Rinanda, T.; Riani, C.; Artarini, A.; Sasongko, L. Correlation between gut microbiota composition, enteric infections and linear growth impairment: A case–control study in childhood stunting in Pidie, Aceh, Indonesia. Gut Pathog. 2023, 15, 54. [Google Scholar] [CrossRef]
  10. Surono, I.S.; Popov, I.; Verbruggen, S.; Verhoeven, J.; Kusumo, P.D.; Venema, K.; Carbonero, F. Gut microbiota differences in stunted and normal-lenght children aged 36–45 months in East Nusa Tenggara, Indonesia. PLoS ONE 2024, 19, e0299349. [Google Scholar] [CrossRef]
  11. Kadia, B.M.; Otiti, M.I.; Ramsteijn, A.S.; Sow, D.; Faye, B.; Heffernan, C.; Hall, L.J.; Webster, J.P.; Walker, A.W.; Allen, S. Modulating the early-life gut microbiota using pro-, pre-, and synbiotics to improve gut health, child development, and growth. Nutr. Rev. 2024, 82, 244–247. [Google Scholar] [CrossRef]
  12. Raiten, D.J.; Bremer, A.A. Exploring the Nutritional Ecology of Stunting: New Approaches to an Old Problem. Nutrients 2020, 12, 371. [Google Scholar] [CrossRef]
  13. Mostafa, I.; Hibberd, M.C.; Hartman, S.J.; Rahman, H.H.; Mahfuz, M.; Hasan, S.T.; Ashorn, P.; Barratt, M.J.; Ahmed, T.; Gordon, J.I. A microbiota-directed complementary food intervention in 12–18-month-old Bangladeshi children improves linear growth. EBioMedicine 2024, 104, 105166. [Google Scholar] [CrossRef] [PubMed]
  14. Hibberd, M.C.; Webber, D.M.; Rodionov, D.A.; Henrissat, S.; Chen, R.Y.; Zhou, C.; Lynn, H.M.; Wang, Y.; Chang, H.-W.; Lee, E.M.; et al. Bioactive glycans in a microbiome-directed food for children with malnutrition. Nature 2024, 625, 157–165. [Google Scholar] [CrossRef]
  15. Roediger, R.; Hendrixson, D.T.; Manary, M.J. A roadmap to reduce stunting. Am. J. Clin. Nutr. 2020, 112 (Suppl. S2), 773S–776S. [Google Scholar] [CrossRef]
  16. Nijjar, J.K.; Stafford, D. Undernutrition and growth in the developing world. Curr. Opin. Endocrinol. Diabetes 2019, 26, 32–38. [Google Scholar] [CrossRef]
  17. Barratt, M.J.; Nuzhat, S.; Ahsan, K.; Frese, S.A.; Arzamasov, A.A.; Alam Sarker, S.; Islam, M.M.; Palit, P.; Islam, R.; Hibberd, M.C.; et al. Bifidobacterium infantis treatment promotes weight gain in Bangladeshi infants with severe acute malnutrition. Sci. Transl. Med. 2022, 14, eabk1107. [Google Scholar] [CrossRef] [PubMed]
  18. Umanets, A.; Surono, I.S.; Venema, K. I am better than I look: Genome based safety assessment of the probiotic Lactiplantibacillus plantarum IS-10506. BMC Genom. 2023, 24, 518. [Google Scholar] [CrossRef]
  19. Surono, I.S.; Pato, U.; Koesnandar; Hosono, A. In vivo antimutagenicity of dadih probiotic bacteria towards Trp-P1. Asian-Australas. J. Anim. Sci. 2009, 22, 119–123. [Google Scholar] [CrossRef]
  20. Mulyaningsih, T.; Mohanty, I.; Widyaningsih, V.; Gebremedhin, T.A.; Miranti, R.; Wiyono, V.H.; Metwally, A.M. Beyond personal factors: Multilevel determinants of childhood stunting in Indonesia. PLoS ONE 2021, 16, e0260265. [Google Scholar] [CrossRef] [PubMed]
  21. Wibowo, S.A.; Surono, I.S. Phenolic content and antioxidant activity of formulated biscuits with banana, tempeh and moringa flours. Braz. J. Food Technol. 2024, 27, e2023068. [Google Scholar] [CrossRef]
  22. Surono, I.; Verhoeven, J.; Verbruggen, S.; Venema, K. Microencapsulation increases survival of the probiotic Lactobacillus plantarum IS-10506, but not Enterococcus faecium IS-27526 in a dynamic, computer-controlled in vitro model of the upper gastrointestinal tract. J. Appl. Microbiol. 2018, 124, 1604–1609. [Google Scholar] [CrossRef]
  23. Bolyen, E.; Rideout, J.R.; Dillon, M.R.; Bokulich, N.A.; Abnet, C.C.; Al-Ghalith, G.A.; Alexander, H.; Alm, E.J.; Arumugam, M.; Asnicar, F.; et al. Reproducible, interactive, scalable and extensible microbiome data science using QIIME 2. Nat. Biotechnol. 2019, 37, 852–857. [Google Scholar] [CrossRef]
  24. Wickham, H.; Averick, M.; Bryan, J.; Chang, W.; McGowan, L.D.A.; François, R.; Grolemund, G.; Hayes, A.; Henry, L.; Hester, J.; et al. Welcome to the Tidyverse. J. Open Source Softw. 2019, 4, 1686. [Google Scholar] [CrossRef]
  25. Kassambara, A. ggpubr: “ggplot2” Based Publication Ready Plots. Available online: https://rpkgs.datanovia.com/ggpubr/ (accessed on 11 January 2024).
  26. Wei, T.; Simko, V. R package “corrplot”: Visualization of a Correlation Matrix. Available online: https://cran.r-project.org/web/packages/ggcorrplot/index.html (accessed on 11 January 2024).
  27. Bates, D.; Mächler, M.; Bolker, B.; Walker, S. Fitting Linear Mixed-Effects Models Using lme4. J. Stat. Softw. 2015, 67, 1–48. [Google Scholar] [CrossRef]
  28. Kuznetsova, A.; Brockhoff, P.B.; Christensen, R.H.B. lmerTest Package: Tests in Linear Mixed Effects Models. J. Stat. Softw. 2017, 82, 1–26. [Google Scholar] [CrossRef]
  29. Bolker, B.; Robinson, D. broom.mixed: Tidying Methods for Mixed Models. Available online: https://github.com/bbolker/broom.mixed (accessed on 5 January 2025).
  30. Breiman, L. Random Forests. Mach Learn. 2001, 45, 5–32. [Google Scholar] [CrossRef]
  31. Aphalo, P. ggpmisc: Miscellaneous Extensions to “ggplot2”. Available online: https://github.com/aphalo/ggpmisc (accessed on 5 January 2025).
  32. Surono, I.S.; Widiyanti, D.; Kusumo, P.D.; Venema, K.; Carbonero, F. Gut microbiota profile of Indonesian stunted children and children with normal nutritional status. PLoS ONE 2021, 16, e0245399. [Google Scholar] [CrossRef] [PubMed]
  33. Kumar, M.; Ji, B.; Babaei, P.; Das, P.; Lappa, D.; Ramakrishnan, G.; Fox, T.E.; Haque, R.; Petri, W.A.; Bäckhed, F.; et al. Gut microbiota dysbiosis is associated with malnutrition and reduced plasma amino acid levels: Lessons from genome-scale metabolic modeling. Metab. Eng. 2018, 49, 128–142. [Google Scholar] [CrossRef]
  34. Robertson, R.C.; Edens, T.J.; Carr, L.; Mutasa, K.; Gough, E.K.; Evans, C.; Geum, H.M.; Baharmand, I.; Gill, S.K.; Ntozini, R.; et al. The gut microbiome and early-life growth in a population with high prevalence of stunting. Nat. Commun. 2023, 14, 654. [Google Scholar] [CrossRef]
  35. Canfora, E.E.; Feitelson, M.A.; Arzumanyan, A. Editorial: Microbiome metabolites in health and disease. Front. Microbiol. 2023, 14, 1270001. [Google Scholar] [CrossRef]
  36. Blaak, E.E.; Canfora, E.E.; Theis, S.; Frost, G.; Groen, A.K.; Mithieux, G.; Nauta, A.; Scott, K.; Stahl, B.; Van Harsselaar, J.; et al. Short chain fatty acids in human gut and metabolic health. Benef. Microbes 2020, 11, 411–455. [Google Scholar] [CrossRef]
  37. Kwami, C.S.; Godfrey, S.; Gavilan, H.; Lakhanpaul, M.; Parikh, P. Water, Sanitation, and Hygiene: Linkages with Stunting in Rural Ethiopia. Int. J. Environ. Res. Public Health 2019, 16, 3793. [Google Scholar] [CrossRef] [PubMed]
  38. Batool, M.; Saleem, J.; Zakar, R.; Butt, M.S.; Iqbal, S.; Haider, S.; Fischer, F. Relationship of stunting with water, sanitation, and hygiene (WASH) practices among children under the age of five: A cross-sectional study in Southern Punjab, Pakistan. BMC Public Health 2023, 23, 2153. [Google Scholar] [CrossRef] [PubMed]
  39. Cumming, O.; Cairncross, S. Can water, sanitation and hygiene help eliminate stunting? Current evidence and policy implications. Matern. Child Nutr. 2016, 12 (Suppl. S1), 91–105. [Google Scholar] [CrossRef]
  40. Baglatzi, L.; Gavrili, S.; Stamouli, K.; Zachaki, S.; Favre, L.; Pecquet, S.; Benyacoub, J.; Costalos, C. Effect of Infant Formula Containing a Low Dose of the Probiotic Bifidobacterium lactis CNCM I-3446 on Immune and Gut Functions in C-Section Delivered Babies: A Pilot Study. Clin. Med. Insights Pediatr. 2016, 10, 11–19. [Google Scholar] [CrossRef]
  41. Singh, A.; Hacini-Rachinel, F.; Gosoniu, M.L.; Bourdeau, T.; Holvoet, S.; Doucet-Ladeveze, R.; Beaumont, M.; Mercenier, A.; Nutten, S. Immune-modulatory effect of probiotic Bifidobacterium lactis NCC2818 in individuals suffering from seasonal allergic rhinitis to grass pollen: An exploratory, randomized, placebo-controlled clinical trial. Eur. J. Clin. Nutr. 2013, 67, 161–167. [Google Scholar] [CrossRef]
  42. Depommier, C.; Everard, A.; Druart, C.; Plovier, H.; Van Hul, M.; Vieira-Silva, S.; Falony, G.; Raes, J.; Maiter, D.; Delzenne, N.M.; et al. Supplementation with Akkermansia muciniphila in overweight and obese human volunteers: A proof-of-concept exploratory study. Nat. Med. 2019, 25, 1096–1103. [Google Scholar] [CrossRef] [PubMed]
  43. Sokol, H.; Pigneur, B.; Watterlot, L.; Lakhdari, O.; Bermúdez-Humaran, L.G.; Gratadoux, J.-J.; Blugeon, S.; Bridonneau, C.; Furet, J.-P.; Corthier, G.; et al. Faecalibacterium prausnitzii is an anti-inflammatory commensal bacterium identified by gut microbiota analysis of Crohn disease patients. Proc. Natl. Acad. Sci. USA 2008, 105, 16731–16736. [Google Scholar] [CrossRef]
  44. Quévrain, E.; Maubert, M.A.; Michon, C.; Chain, F.; Marquant, R.; Tailhades, J.; Miquel, S.; Carlier, L.; Bermúdez-Humarán, L.G.; Pigneur, B.; et al. Identification of an anti-inflammatory protein from Faecalibacterium prausnitzii, a commensal bacterium deficient in Crohn’s disease. Gut 2016, 65, 415–425. [Google Scholar] [CrossRef]
  45. Ng, Q.X.; Lim, Y.L.; Yaow, C.Y.L.; Ng, W.K.; Thumboo, J.; Liew, T.M. Effect of Probiotic Supplementation on Gut Microbiota in Patients with Major Depressive Disorders: A Systematic Review. Nutrients 2023, 15, 1351. [Google Scholar] [CrossRef]
  46. Sanders, M.E. Probiotics and microbiota composition. BMC Med. 2016, 14, 82. [Google Scholar] [CrossRef]
  47. Mörschbächer, A.P.; Pappen, E.; Henriques, J.A.P.; Granada, C.E. Effects of probiotic supplementation on the gut microbiota composition of adults: A systematic review of randomized clinical trials. An. Acad. Bras. Cienc. 2023, 95, e20230037. [Google Scholar] [CrossRef]
  48. Athiyyah, A.F.; Brahmantya, H.; Dwiastuti, S.; Darma, A.; Puspitasari, D.; Husada, D.; Ranuh, R.; Endaryanto, A.; Surono, I.; Sudarmo, S.M. Effect of Lactobacillus plantarum IS-10506 on blood lipopolysaccharide level and immune response in HIV-infected children. Iran. J. Microbiol. 2019, 11, 137–144. [Google Scholar] [CrossRef]
  49. Kusumo, P.; Bela, B.; Wibowo, H.; Munasir, Z.; Surono, I. Lactobacillus plantarum IS-10506 supplementation increases faecal sIgA and immune response in children younger than two years. Benef. Microbes 2019, 10, 245–252. [Google Scholar] [CrossRef] [PubMed]
  50. Prakoeswa, C.; Herwanto, N.; Prameswari, R.; Astari, L.; Sawitri, S.; Hidayati, A.; Indramaya, D.; Kusumowidagdo, E.; Surono, I. Lactobacillus plantarum IS-10506 supplementation reduced SCORAD in children with atopic dermatitis. Benef. Microbes 2017, 8, 833–840. [Google Scholar] [CrossRef] [PubMed]
  51. Prakoeswa, C.R.S.; Bonita, L.; Karim, A.; Herwanto, N.; Umborowati, M.A.; Setyaningrum, T.; Hidayati, A.N.; Surono, I.S. Beneficial effect of Lactobacillus plantarum IS-10506 supplementation in adults with atopic dermatitis: A randomized controlled trial. J. Dermatol. Treat. 2022, 33, 1491–1498. [Google Scholar] [CrossRef] [PubMed]
  52. Surono, I.S.; Martono, P.D.; Kameo, S.; Suradji, E.W.; Koyama, H. Effect of probiotic L. plantarum IS-10506 and zinc supplementation on humoral immune response and zinc status of Indonesian pre-school children. J. Trace Elements Med. Biol. 2014, 28, 465–469. [Google Scholar] [CrossRef]
  53. Prendergast, A.J.; Humphrey, J.H. The stunting syndrome in developing countries. Paediatr. Int. Child Health 2014, 34, 250–265. [Google Scholar] [CrossRef]
  54. Wanitsuwan, W.; Pahumunto, N.; Surachat, K.; Thananimit, S.; Wonglapsuwan, M.; Laohawiriyakamol, S.; Teanpaisan, R. Comparison of the effects of postbiotics and live-probiotics containing Lacticaseibacillus paracasei SD1 and Lacticaseibacillus rhamnosus SD11 in patients with previous colorectal cancer: A randomized controlled trial. J. Funct. Foods 2024, 123, 106576. [Google Scholar] [CrossRef]
Figure 1. CONSORT flowchart of the study.
Foods 14 02218 g001
Figure 2. Change (delta) in anthropometric parameters (A) weight, (B) length, (C) BMI, (D) zlen, (E) zwei, (F) zbmi, and (G) zwfl after the 6-month intervention for the non-stunted and stunted group.
Foods 14 02218 g002
Figure 3. Response (in relative abundance) of several relevant taxa at baseline and at the end of the intervention (endline) with the three treatments, split up by children that were stunted or not: (A) Escherichia/Shigella *, (B) Haemophilus *, (C) Enterobacter *, (D) Desulfovibrio, (E) Bifidobacterium *, (F) Akkermansia, (G) Lactobacillus, and (H) Faecalibacterium *. The asterisk (*) indicates that these taxa were also significant when linear mixed modelling was applied (Table 3).
Foods 14 02218 g003
Figure 4. (A) Variable importance plot and response (in relative abundance) of taxa with a mean decrease accuracy of >4 in the random forest analysis at baseline and at the end of the intervention (endline) with the three treatments, split up by children that were stunted or not: (B) Catenibacterium *, (C) Ruminococcus torques group *, (D) Muribaculaceae *, (E) uncharacterized taxon in the family Oscillospiraceae, (F) Fusicatenibacter *, and (G) Collinsella *. The asterisk (*) indicates that these taxa were also significant when linear mixed modelling was applied (Table 3).
Foods 14 02218 g004
Figure 5. Heatmap of the significant Spearman correlations between taxa and anthropometric measures. * indicates significance (q < 0.1). A blue color indicates a positive correlation, red a negative correlation.
Foods 14 02218 g005
Table 1. Anthropometric scores of the children at baseline and after the 6-month intervention.
Baseline After Intervention
StuntedNon-Stuntedp-ValueStuntedNon-Stuntedp-Value
n = 79n = 78 n = 79n = 78
M/F (%)47/5346/541 47/5346/541
age (months)46.76 ± 4.8244.43 ± 5.070.00452.76 ± 10.8250.43 ± 11.070.004
weight (kg)11.79 ± 1.0913.13 ± 1.50<0.000112.93 ± 1.2314.60 ± 1.85<0.0001
length (cm)91.01 ± 3.2096.11 ± 4.05<0.000194.56 ± 3.5399.17 ± 3.98<0.0001
BMI (kg/cm2)14.22 ± 1.0014.20 ± 1.170.9114.46 ± 1.0514.80 ± 1.160.056
zlen−2.67 ± 0.51−1.12 ± 0.80<0.0001−2.18 ± 0.60−0.80 ± 0.81<0.0001
zwei−2.39 ± 0.63−1.36 ± 0.84<0.0001−1.89 ± 0.66−0.79 ± 0.89<0.0001
zbmi−0.90 ± 0.81−0.98 ± 0.980.63−0.68 ± 0.83−0.44 ± 0.890.087
zwfl−1.20 ± 0.80−1.05 ± 0.980.3−0.87 ± 0.83−0.47 ± 0.900.005
Pearson’s Chi-squared test with Yates’ continuity correction; other analyses: t-test.
Table 2. Changes in anthropometric scores of the children after the 6-month intervention.
StuntedNon-Stuntedp-Value
n = 79n = 78
Δ weight (kg)1.15 ± 0.661.46 ± 0.740.005
Δ length (cm)3.55 ± 1.513.06 ± 0.930.018
Δ BMI (kg/cm2)0.24 ± 0.800.60 ± 0.720.004
Δ zlen0.18 ± 0.36−0.04 ± 0.23<0.0001
Δ zwei0.31 ± 0.440.34 ± 0.380.57
Δ zbmi0.25 ± 0.660.65 ± 0.600.003
Δ zwfl0.33 ± 0.660.58 ± 0.580.015
Table 3. Taxa that are significantly correlated with differences between baseline and endline (light grey), postbiotic group (unshaded), or probiotic group (dark grey) using linear mixed modelling with fixed effects.
TaxonTermEstimateStd. ErrorStatisticp. Valuep. Adjusted
unchar. taxon in Lachnospiraceaebaseline–endline−0.00370.0012−3.19320.00170.0222
Enterobacterbaseline–endline−0.00660.0023−2.88490.00420.0414
Haemophilusbaseline–endline−0.00200.0005−3.72750.00020.0053
Olsenellabaseline–endline−0.00030.0001−2.91170.00410.0414
Faecalibacteriumbaseline–endline0.08500.01774.79822.53 × 10−60.0002
Escherichia/Shigellabaseline–endline−0.04920.0084−5.88071.09 × 10−81.51 × 10⁻⁶
Butyricicoccusbaseline–endline−0.00200.0006−3.52210.00050.0098
Christensenellaceae R-7 groupbaseline–endline−0.00360.0011−3.17490.00170.0222
Bifidobacteriumbaseline–endline−0.02160.0043−5.01261.50 × 10−60.0001
Oscillospiraceae UCG-003baseline–endline−0.00070.0002−3.08140.00250.0271
Senegalimassiliabaseline–endline−0.00080.0002−3.85570.00020.0052
Fusicatenibacterbaseline–endline−0.00110.0004−2.93480.00390.0410
Muribaculaceaebaseline–endline−0.00150.0005−2.82910.00500.0474
Alistipesbaseline–endline−0.00610.0015−4.16785.19 × 10−50.0021
Catenibacteriumbaseline–endline−0.00280.0009−3.11770.00220.0252
Collinsellabaseline–endline−0.00380.0005−6.94611.09 × 10−103.00 × 10⁻⁸
Turicibacterbaseline–endline−0.00130.0004−3.15660.00190.0232
Barnesiellabaseline–endline−0.00120.0003−3.66320.00030.0073
Monoglobusbaseline–endline−0.00220.0007−3.25750.00140.0222
Eubacterium hallii groupbaseline–endline−0.00570.0015−3.73080.00020.0053
Ruminococcus torques groupbaseline–endline−0.00440.0009−4.65114.97 × 10−60.0003
Erysipelotrichaceae UCG-003group postbiotic0.00250.00073.77910.00020.0053
unchar. taxon in Lachnospiraceaegroup probiotic0.00640.00183.49430.00060.0115
Faecalibacteriumgroup probiotic−0.06960.0220−3.15520.00180.0222
Butyricicoccusgroup probiotic0.00230.00073.18350.00160.0222
Fusicatenibactergroup probiotic0.00180.00063.26220.00140.0222
Eubacterium hallii groupgroup probiotic0.00730.00193.84330.00010.0051
Erysipelotrichaceae UCG-003group probiotic0.00280.00074.16475.26 × 10−50.0021
Ruminococcus torques groupgroup probiotic0.00370.00123.19700.00150.0222
Disclaimer/Publisher’s Note: The statements, opinions and data contained in all publications are solely those of the individual author(s) and contributor(s) and not of MDPI and/or the editor(s). MDPI and/or the editor(s) disclaim responsibility for any injury to people or property resulting from any ideas, methods, instructions or products referred to in the content.

