1. Introduction
Despite numerous efforts in recent years to manage wastes from agricultural activities and food by-products, these residues continue to pose environmental challenges and incur disposal costs for producers [
1,
2]. Over the past decade, numerous global institutions have called for more sustainable policy choices to address these issues, promoting the circular economy model as a strategy for achieving greater global sustainability [
3]. Ensuring the sustainability of the food production process remains one of the most critical challenges for the future [
4].
In this context, the olive oil industry holds substantial economic importance within the European Union (EU), producing over 6–7 million tons of oil annually [
5]. Olive cultivation is widespread in the Mediterranean basin, with Italy being one of the top producers [
6]. However, the olive sector generates substantial waste. The extraction process results in three by-products: olive paste, the fleshy part of the olive fruit remaining after oil extraction; olive pomace, the primary solid residue left after oil extraction; and olive oil mill wastewater (OOMW), the liquid waste produced during oil production [
7]. While olive paste and olive pomace are typically reused as soil fertilizers or combustible raw materials [
8], OOMW is more challenging to recycle due to its strong odor, dark brown color, and acidic pH [
9]. Nevertheless, OOMW is rich in bioactive compounds like polyphenols [
10], which are known for their health benefits [
11]. According to a review by Obied et al. [
12], it contains over 30 biophenols and related compounds with antioxidant properties and potential cardioprotective and cancer-preventive effects.
Given the growing need for more efficient and sustainable approaches, innovative non-conventional methods are gaining traction. These methods utilize low-cost raw materials to extract antioxidant compounds, which can be applied in food supply chains, as well as in the nutraceutical and cosmetics sectors. Additionally, the rising consumer demand for nutritionally rich and functional foods has caught the attention of food producers. In this context, cereals and cereal-based products are ideal candidates for fortification, as they are a staple in the daily diet and provide a significant amount of macronutrients and micronutrients, including vitamins and minerals. However, it is important to note that thermal treatments, such as baking and mechanical processes like milling, can significantly reduce or even eliminate dietary fiber and bioactive compounds, potentially diminishing the nutritional value of these products. Therefore, OOMW could be a promising by-product to enhance the positive properties of bread. In addition to its richness in bioactive compounds, it boosts dietary antioxidant levels, often diminished during baking, and introduces unique phytochemicals absent in conventional formulations. Its use supports the development of health-promoting foods, aligns with sustainability and circular economy principles by repurposing polluting agro-industrial waste, and reduces disposal costs due to its high organic load and phytotoxicity. Moreover, OOMW contributes to a more complex and appealing aroma profile through its volatile compounds.
Sourdough fermentation is a traditional and widely used technology in Italian bread making [
13]. This process primarily relies on the activity of lactic acid bacteria (LAB), particularly, the heterofermentative species [
14]. While yeasts also play a crucial role, especially in leavening, the presence of LAB is essential for developing the bread’s characteristic aroma and extending its shelf life [
15]. Despite typically resulting in lower loaf volume and reduced crumb porosity compared to baker’s yeast fermentation, sourdough technology offers several advantages, including improved flavor and preservation [
16]. In addition to sourdough, many Italian-baked products, such as bread and pizza, are also commonly produced using biga technology [
17]. This method involves a pre-fermentation step with a small amount of yeast, which is allowed to ferment slowly at room temperature before being incorporated into the final dough [
18].
This investigation aimed to create new functional bakery products by incorporating OOMW. In a previous study by Sciurba et al. [
19], the same bulk of OOMW was analyzed for pesticide residues and was found to contain four active compounds: Azoxystrobin (0.2 μg/L), Bromacil (5.29 μg/L), Imidacloprid (0.17 μg/L), and Simazine (0.21 μg/L). Regarding the toxicological implications of the detected pesticide residues in OOMW, Bromacil is mildly irritating to the eyes and skin but does not exhibit neurotoxic, genotoxic, reproductive, developmental, or immunotoxic effects; Simazine has been associated with fetal developmental delays, endocrine disruption, and mammary tumors; Azoxystrobin shows weak genotoxic responses in mammalian cells but is considered unlikely to pose a carcinogenic risk to humans; and Imidacloprid may cause symptoms such as drowsiness, dizziness, vomiting, disorientation, and fever. The effects of this incorporation were assessed by monitoring the acidification process, key rheological parameters, and the polyphenol and volatile organic compound contents of the final products. Fermentation was carried out using two different approaches: a sourdough starter and a biga-like inoculum. Additionally, in vitro digestion tests and sensory evaluations (without taste tests), which are crucial for launching a new product onto the market, were conducted.
2. Materials and Methods
2.1. Raw Materials and Fermenting Bacteria
A 10 L sample of olive oil mill wastewater (OOMW) was collected in a plastic container for food materials (Ecoplast S.r.l., Gela, Italy) shortly after milling at a facility in Partinico (Palermo province, Italy). Within 6 h, it was delivered to the Food and Agricultural Microbiology lab at the University of Palermo (Italy) using a portable cooler to prevent microbial growth. Upon arrival at the laboratory, the OOMW was transferred into 1 L sterile Durham bottles and frozen at −20 °C. The composition of OOMW consisted of approximately 84% (v/v) aqueous solution, 12.5% (v/v) pomace, and 3.5% (v/v) residual oil.
In this study,
Leuconostoc mesenteroides RC-UNIPASAAFM01342 (previously strain OMW 23) and
Lactiplantibacillus plantarum RC-UNIPASAAFM01341 (previously strain OMW 1), isolated from OOMW and intrinsically resistant to olive polyphenols [
19], were added to
Fructilactobacillus sanfranciscensis RC-UNIPASAAFM01100,
Weissella cibaria RC-UNIPASAAFM01109, and
Leuconostoc citreum RC-UNIPASAAFM01118, originating from sourdoughs used in Sicilian bakeries and part of the SAAF Department’s culture collection at the University of Palermo, and were employed to start the sourdough fermentation.
2.2. Sourdough Propagation
To prepare sourdough inoculums, all strains were defrosted from glycerol stocks stored at −80 °C and cultured twice in a modified de Man-Rogosa-Sharpe (mMRS) medium following the procedure outlined by Corsetti et al. [
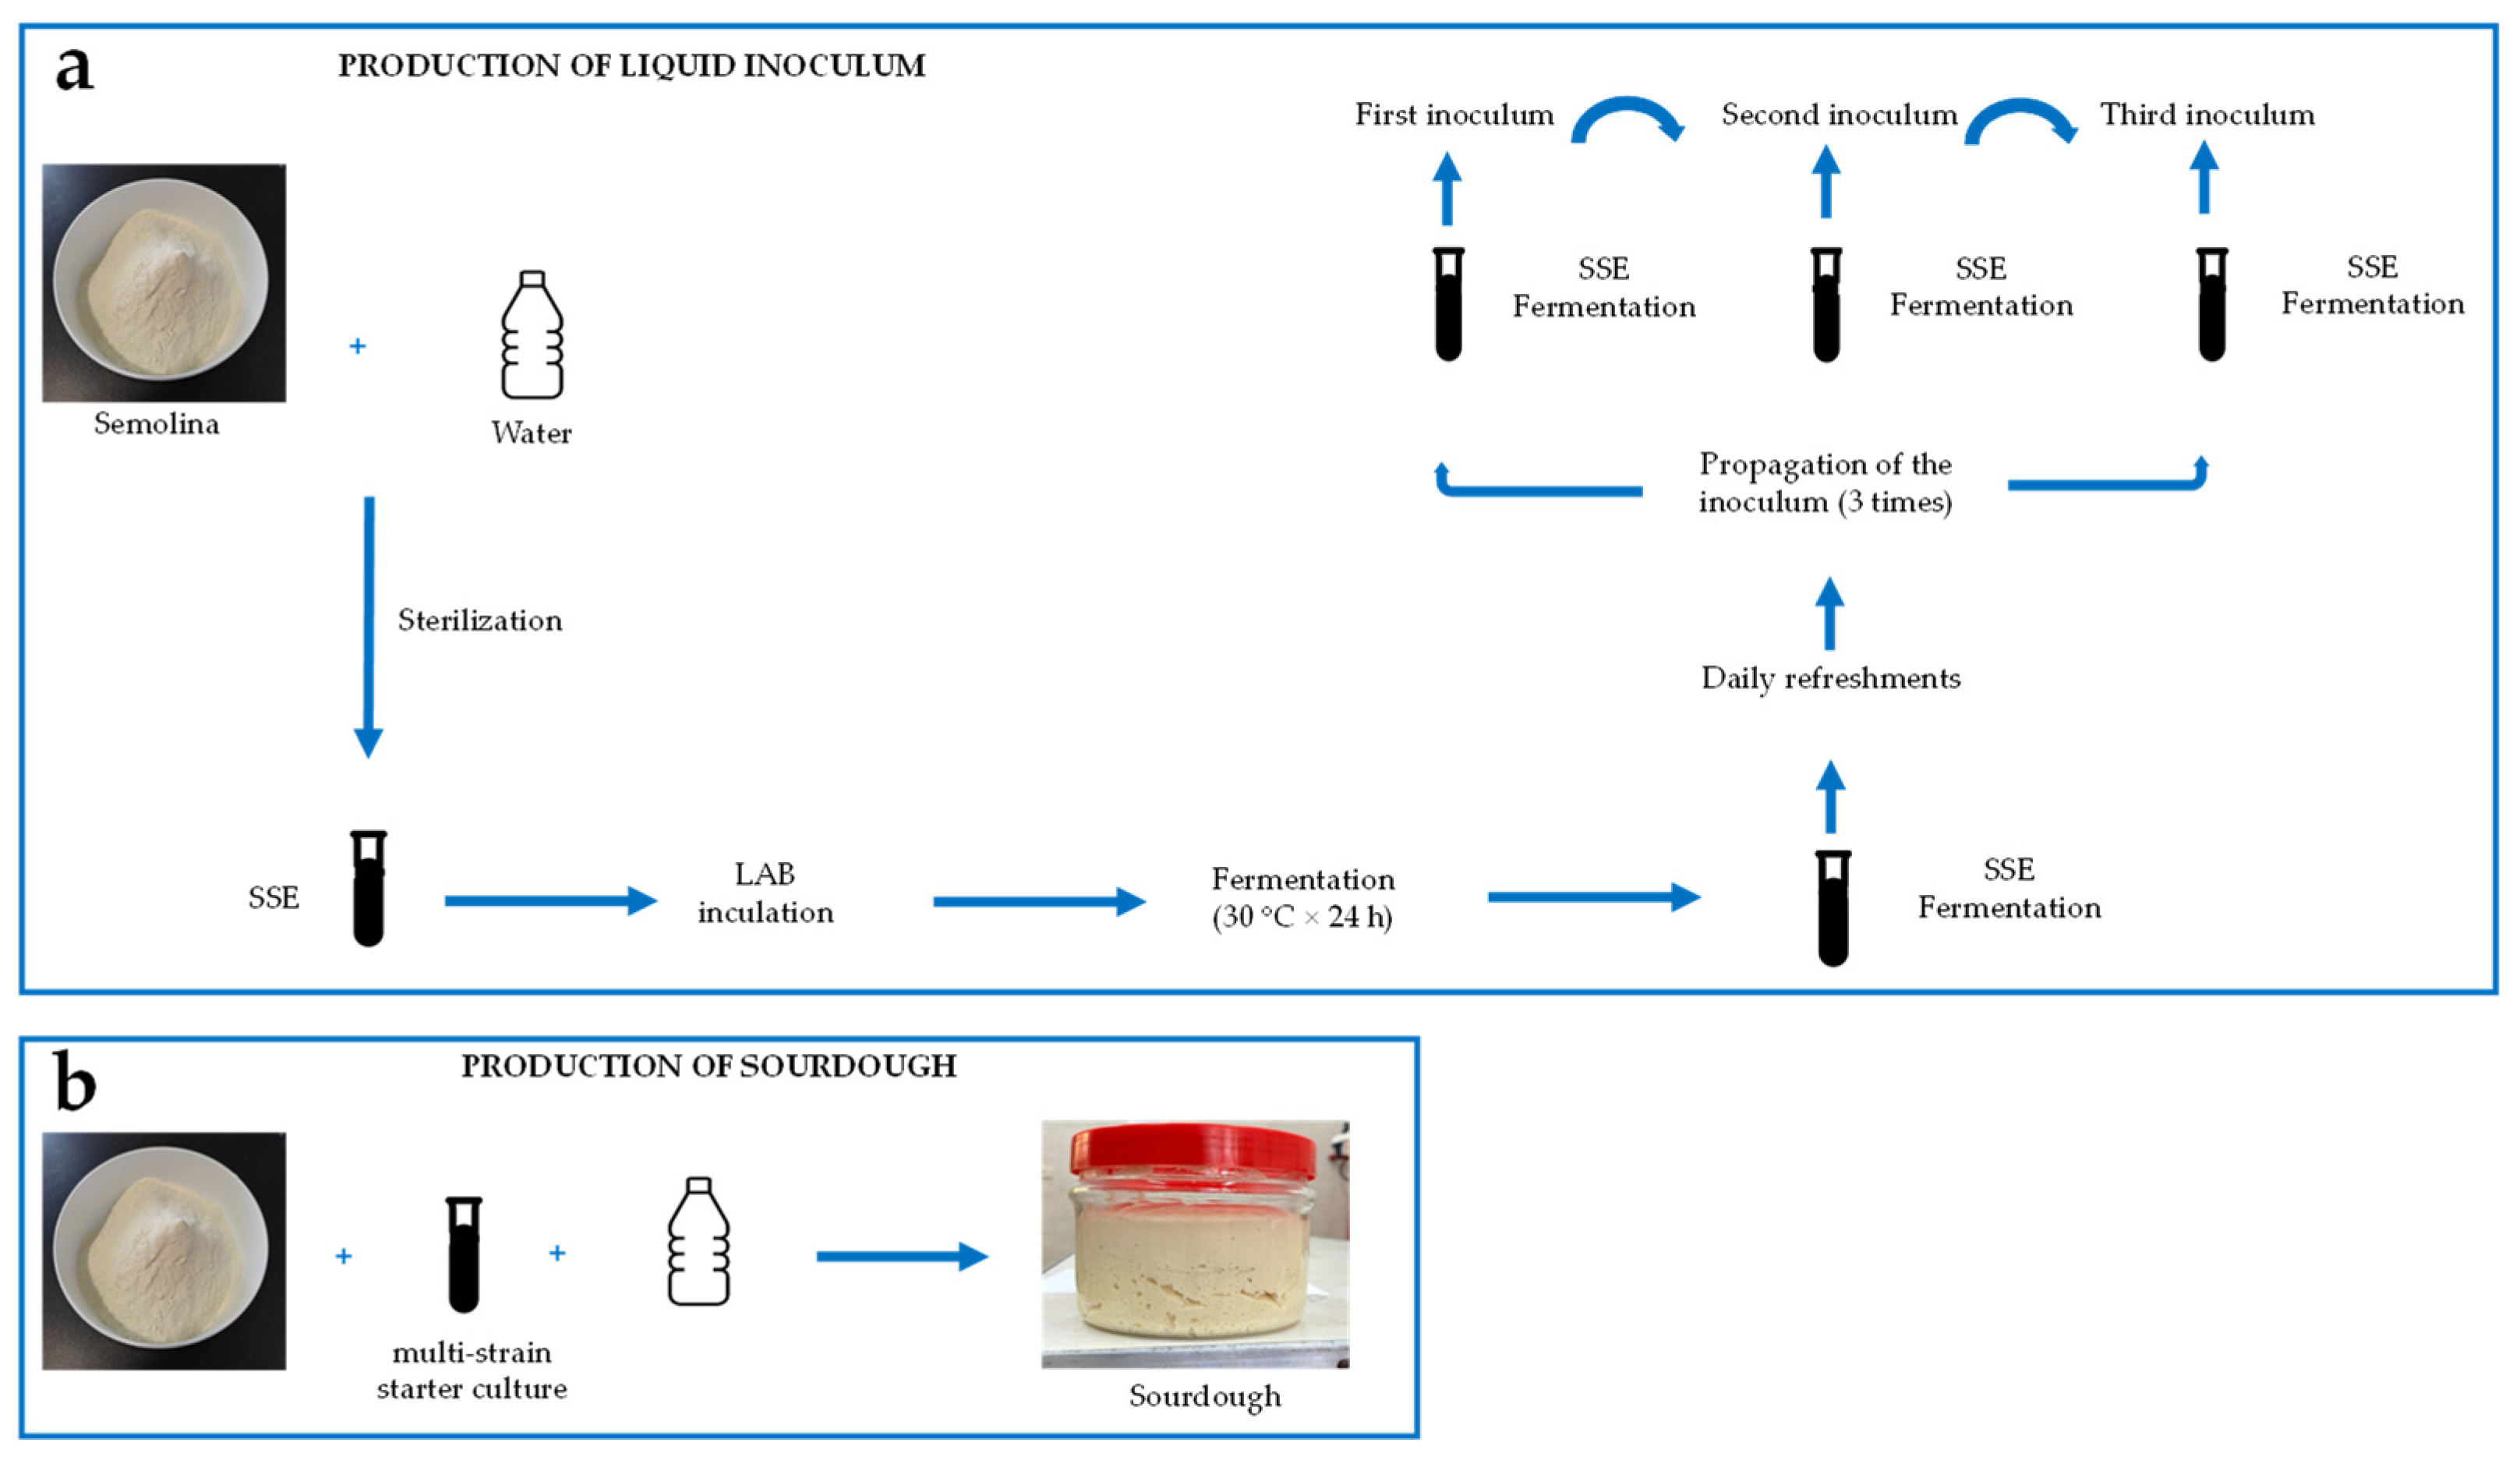
20]. Subsequently, the bacteria were incubated for about 24 h at 30 °C before being inoculated into a mixture with semolina to develop the sourdough. All LAB strains were inoculated individually and propagated in liquid form using a sterile semolina extract (SSE) as the growth medium, as it can support growth beyond 10
9 CFU/mL [
21]. All LAB strains were sub-cultivated three times and combined to prepare a multi-strain starter culture [
22] (
Figure 1a).
The cell suspension was diluted with sterile tap water to reach a final volume of 187.5 mL. This mixture was then combined with 312.5 g of semolina (La Molisana S.p.A., Ripalimosani, Italy) to form a 500 g dough. The dough had a dough yield (DY = weight of the dough/weight of semolina × 100) of 160 and a cell density of approximately 10
6 to 10
7 CFU/g. The dough underwent fermentation at 28 °C for 16 h and was refreshed daily over a period of seven days, following the method outlined by Corona et al. [
23], to produce a mature sourdough suitable for baking (
Figure 1b).
2.3. Dough Production and Baking
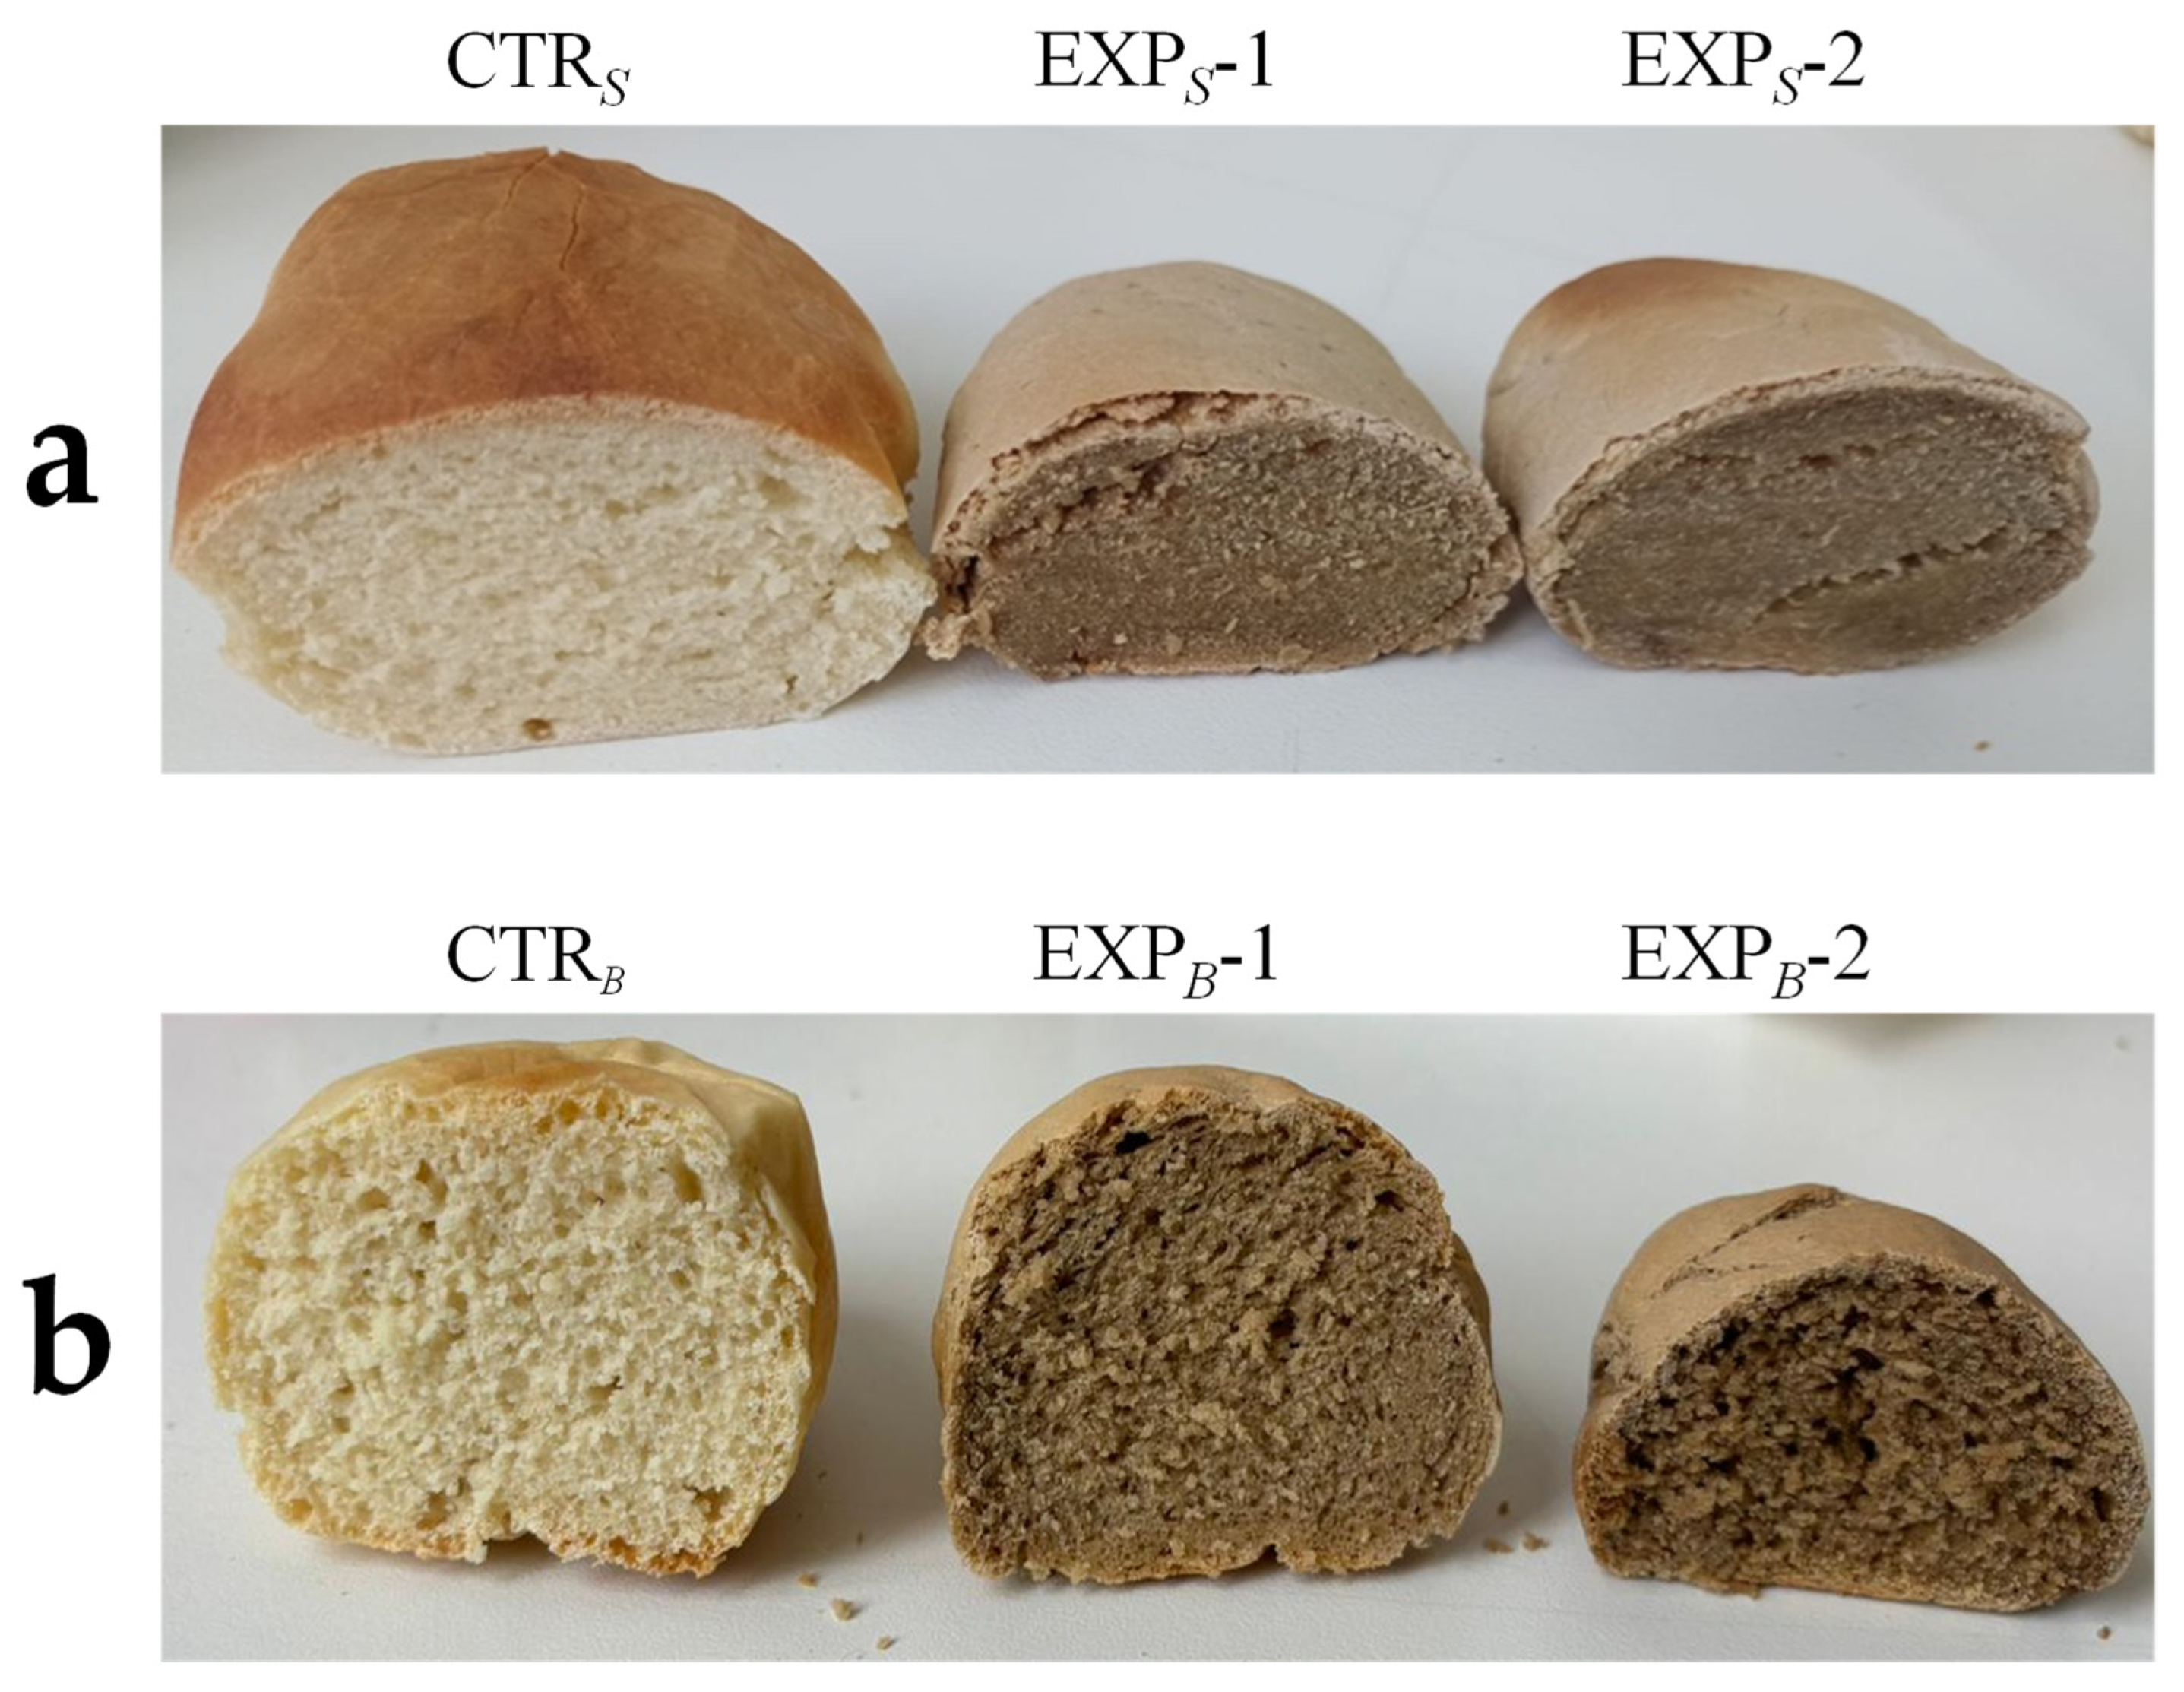
Two different processes were conducted to test the suitability of OOMW in bread production. The first process was carried out using only the sourdough (trials S) developed in this study as a leavening agent, while in the second process, commercial baker’s yeast was added to the sourdough to create a biga-like dough (trials B). For both processes (S and B), three 800 g tests with a DY of 175 were performed: CTR, control production; EXP-1, experimental 1 (50% OOMW in substitution of water); and EXP-2, experimental 2 (100% OOMW in substitution of water).
For the S process, the control production (CTRS) was prepared with the following recipe: 457.2 g of semolina, 228.6 mL of sterile tap water, and 114.2 g of the 7-day matured sourdough. The experimental tests were prepared as follows: EXPS-1 with 457.2 g of semolina, 114.3 mL of sterile tap water, 114.3 mL of OOMW, and 114.2 g of sourdough; EXPS-2 with 457.2 g of semolina, 228.6 mL of OOMW, and 114.2 g of sourdough. In the B process, 8 g of commercial baker’s yeast (Conad, Bologna, Italy) were added to each of the three recipes described above for CTRS, EXPS-1, and EXPS-2 to prepare CTRB, EXPB-1, and EXPB-2 productions.
A planetary mixer model XBM10S (Electrolux Professional, SpA, Pordenone, Italy) was used to blend all ingredients at speed 4 for 15 min. To better assess the impact of OOMW on the stability of LAB inoculums, no salt was included in the formulation. For each trial, 6 doughs were prepared, making a total of 18 doughs for the
S process and 18 for the
B process. The doughs (100 g each) were placed in stainless steel trays conforming to the trapezoidal dimensions indicated by the American Association of Cereal Chemists—AACC Method 10-10B [
24]. The trays were covered with aluminium foil during fermentation, which was conducted at 28 °C for 8 h for the
S process and at 28 °C for 2 h for the
B process. The rest of the doughs (200 g from each batch) were placed into sterile glass jars (Vetreria Borgonovo S.p.A., Borgonovo Val Tidone, Italy) to allow fermentation under controlled sterile conditions. The baking process took place in a semi-industrial Compact Combi oven (Electrolux, Pordenone, Italy) using a two-phase program based on the manufacturer’s guidelines: the doughs were initially subjected to hot air/steam treatment at 200 °C for 5 min, followed by 15 min of convective heating at the same temperature.
2.4. Acidification Process
Fermentation of the sourdough and the doughs intended for baking was monitored by measuring the pH, total titratable acidity (TTA), and the evolution of fermenting microorganisms. Both parameters were measured immediately after inoculation and during fermentation. Measurements were conducted at intervals of 0, 2, 4, 6, and 8 h for the S process (with sourdough inoculum) and at 0 and only after the first 2 h for the B process (with biga-like dough inoculum).
To measure pH, the probe of the pH meter (XS Instruments, Carpi, Italy) was directly inserted into the SSE test tubes containing 10 mL of sample or into 10 g of solid samples, such as sourdough, biga-like dough, and doughs prepared for baking, all collected under sterile conditions. Simultaneously, TTA measurements were taken. The same samples used for pH assessment were then placed into stomacher bags, combined with 90 mL of distilled water, and homogenized using a stomacher BagMixer® 400 (Interscience, Saint Nom, France) at its highest speed for 2 min. Following this, titration was performed with a 0.1 N NaOH solution. TTA values were reported as the volume of 0.1 N NaOH required per 10 g of dough.
To determine the viable count of fermenting groups, all samples were homogenized as previously described, but sterile Ringer’s solution (Sigma-Aldrich, Milan, Italy) was used in place of distilled water. The resulting homogenates were then subjected to serial decimal dilutions and inoculated on various media: plate count agar (PCA) for total mesophilic microorganisms (TMM), incubated aerobically at 30 °C for 72 h; mMRS agar for mesophilic rod-shaped lactic acid bacteria (LAB), incubated anaerobically at 30 °C for 48 h; on sourdough bacteria (SDB) agar for sourdough LAB [
25], incubated aerobically at 30 °C for 48 h; and yeast peptone dextrose (YPD) agar with chloramphenicol (0.1 g/L) for yeasts, incubated at 28 °C for 48 h. Additionally, Enterobacteriaceae were enumerated on violet red bile glucose agar (VRBGA), incubated at 37 °C for 24 h, and total coliforms on violet red bile agar (VRBA), also incubated at 37 °C for 24 h. All culture media were purchased from Oxoid. Microbiological analyses were performed in duplicate, and results were expressed as log CFU/g.
2.5. Bread Quality Parameter Determination
After baking, all bread samples were allowed to cool at room temperature for 30 min prior to quality assessment. Weight loss (WL) due to water evaporation during baking was calculated using the formula:
where “wd” represents the weight (g) of the dough and “wb” represents the weight (g) of the baked bread [
26].
Bread volume was measured using a 2 L volumeter designed for bakery products, with flax seeds placed in the appropriate container (ErreCi srl, Merate, Italy).
The color of the bread crust and crumb was assessed using a Chroma Meter CR-400 (Minolta, Osaka, Japan) based on the Hunter’s scale parameters (L*, a* and b*) [
27]. Specifically, three points on the crumb from the central slice and four points on the upper surface of each bread were analyzed.
Bread hardness was evaluated by measuring compression resistance (N/mm
2) using an Instron-5564 (Instron Corp., Canton, MA, USA), following the method described by Corsetti et al. [
28].
The central slice of each bread was analyzed using image processing techniques. Each slice was examined for void fraction (percentage of the total area occupied by alveoli), cell density (number of alveoli/cm2), and the average area of the alveoli (in mm2). The analysis was conducted after scanning the bread slices at a resolution of 350 dpi using an Epson Perfection 4180 Photo scanner (Seiko Epson Corp., Suwa, Japan). The scanned images, saved in TIFF format, were processed with ImageJ software (National Institutes of Health, Bethesda, MD, USA). Each image was cropped into squares of 207 × 207 pixels (representing an area of the bread slice of 15 × 15 mm), converted to 8-bit grayscale, and binary images were generated using Otsu’s thresholding method.
Additionally, the bread samples were tested for the presence of aerobic spore-forming bacteria. Each bread sample (25 g) was serially diluted in Ringer’s solution, following the same procedure used for the dough samples. The cell suspensions were then heated to 85 °C for 15 min, and 0.1 mL aliquots were spread on Nutrient Agar (NA) plates (Oxoid, Basingstoke, UK), which were incubated at 32 °C for 48 h [
29].
2.6. Volatile Organic Compound Analysis by SPME-GC/MS
Volatile compounds were analyzed using solid-phase microextraction (SPME) followed by GC/MS. Six grams of sample were equilibrated at 60 °C for 30 min in a sealed 40 mL vial. A DVB/CAR/PDMS fiber (50/30 µm, Supelco, Bellefonte, PA, USA) was exposed to the headspace for 30 min and then, thermally desorbed at 230 °C for 5 min in the GC injector. Fiber pre-conditioning was performed at 270 °C for 1 h prior to analysis. Analyses were conducted using a Trace 1310 GC coupled to a TSQ 800 triple quadrupole MS (Thermo Fisher Scientific, Milan, Italy). Volatiles were separated on a TG-XLBMS column (20 m × 0.18 mm i.d., 0.18 μm film thickness). Helium was used as carrier gas at 1.0 mL/min. The oven temperature was maintained at 35 °C for 5 min, then ramped up to 100 °C at a rate of 5 °C/min, held at this temperature for 2 min, and then increased to 180 °C at a rate of 6 °C/min and maintained for 2 min. The temperature was then further increased to 230 °C at the rate of 8 °C/min and held for an additional 2 min. (details in
Table S1). Electron ionization (EI) was performed at 70 eV with full scan acquisition (30–350
m/
z). Compound identification was based on NIST library matching and/or authentic standards. Analyses were performed in triplicate.
2.7. Analysis of Polyphenolic Compounds by LC-MS/MS
Polyphenols were extracted from 2 g of sample using 5 mL methanol/water (80:20
v/
v), followed by vortexing, sonication, and centrifugation. The supernatant was filtered (0.45 μm PTFE) and diluted 1:100 with methanol. A 5 µL aliquot was injected into an Ultimate 3000 LC system coupled to a TSQ Quantiva triple quadrupole MS (Thermo Fisher Scientific). Chromatographic separation was performed on a Hypersil GOLD C18 column (2.1 × 50 mm, 1.9 µm) at 30 °C, using a gradient elution with water (0.1% formic acid) and methanol. MS detection was carried out in negative ion mode with an HESI source. Selected Reaction Monitoring (SRM) transitions for 19 target polyphenols are reported in
Table S2. Quantification was based on external calibration curves (from 1 ppm to 5 ppb) with R
2 > 0.99. LODs, and LOQs were determined from the blank signal and the regression curve.
2.8. Determination of Functional Properties of Breads
Two grams of bread samples were homogenized using a Waring blender (Waring, New Hartford, CT, USA) equipped with a semi-micro stainless-steel jar in 10 mL of a pH 6.8 buffered solution designed to replicate the chemical composition of human saliva according to European Pharmacopoeia. The aqueous suspension was submitted to in vitro digestion following the standardized INFOGEST 2.0 method [
22]. To separate the bioaccessible fraction from the undigested material, the post-intestinal mixture was subjected to ultracentrifugation at a force of 167,000×
g for 35 min at 4 °C, using a Beckman Optima TLX ultracentrifuge (Beckman Instruments, Inc., Palo Alto, CA, USA). This process yielded a supernatant consisting of the bioaccessible fraction isolated from the residual nonabsorbable particulate material.
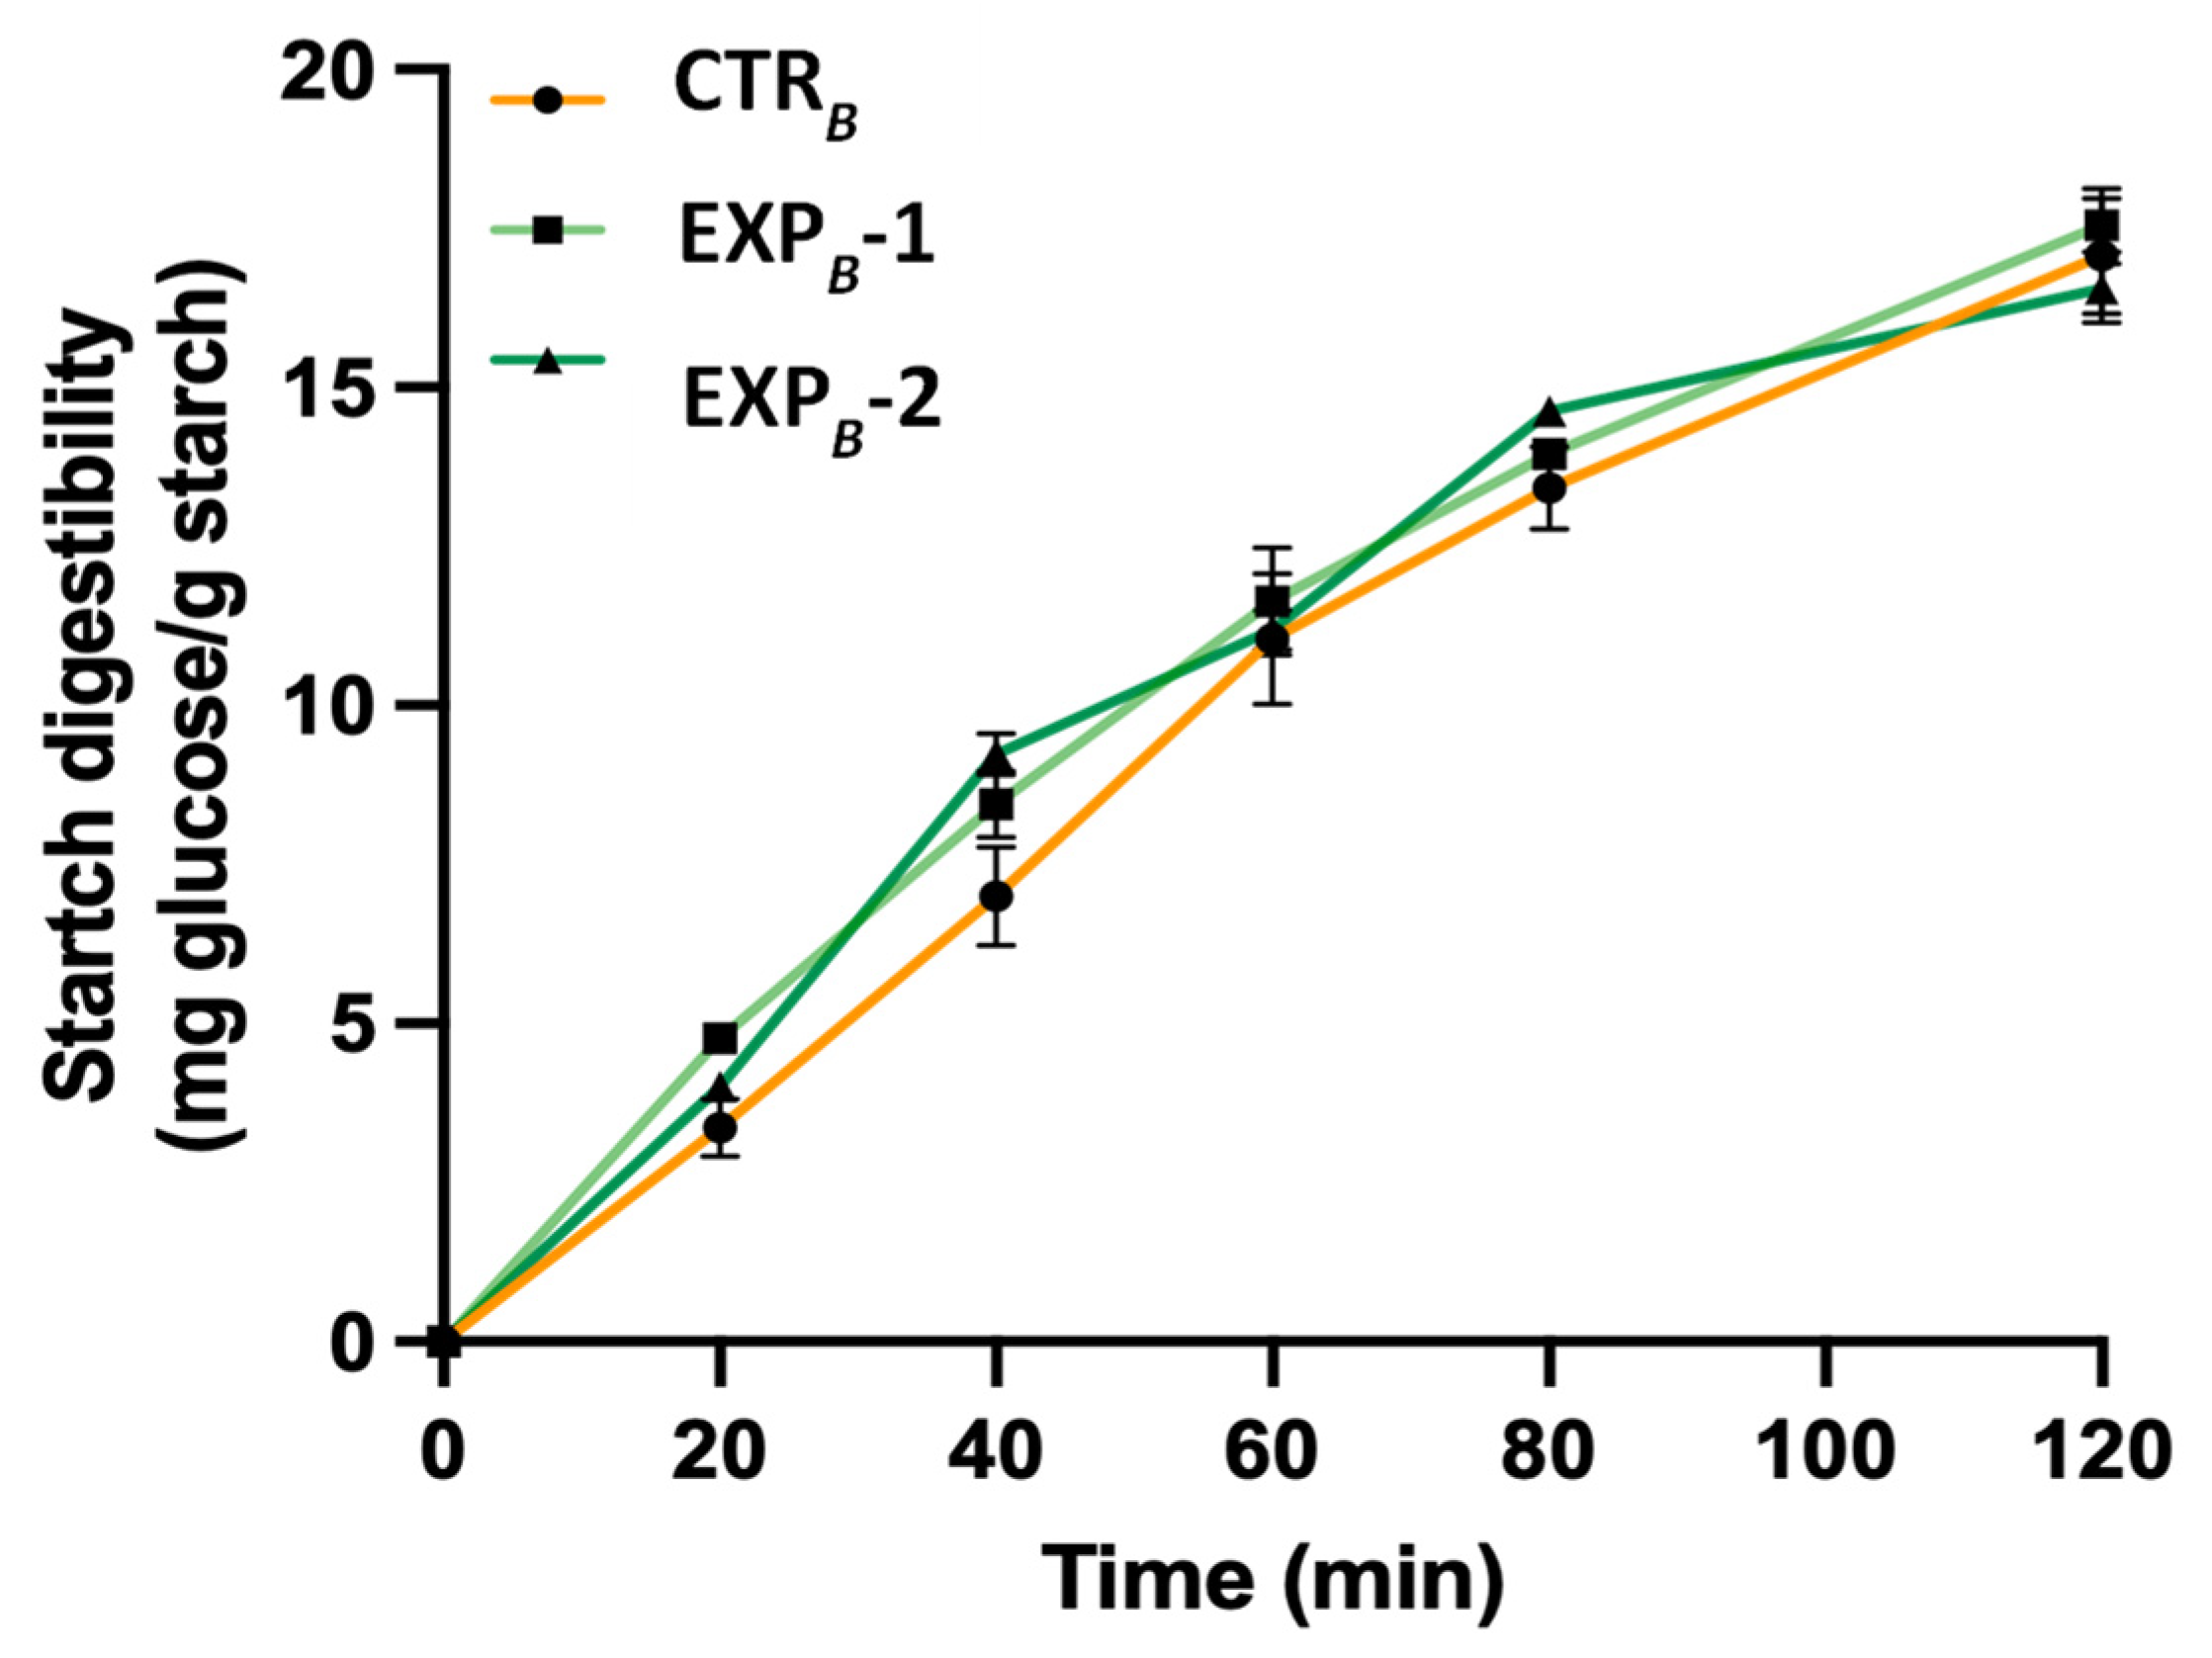
Bread samples were subjected to in vitro digestion following a previously established protocol. During the intestinal phase, 1 mL aliquots of the digesta were collected at intervals of 0, 20, 40, 60, 80, and 120 min after the addition of pancreatin. These aliquots were immediately transferred to tubes placed in boiling water for 4 min to stop enzymatic activity. Following ultracentrifugation, the glucose content in the supernatant was measured spectrophotometrically at 510 nm using a D-glucose assay kit (GOPOD Format, Megazyme International, Ltd., Bray, Ireland). The starch digestibility was expressed as mg of glucose per gram of initial starch.
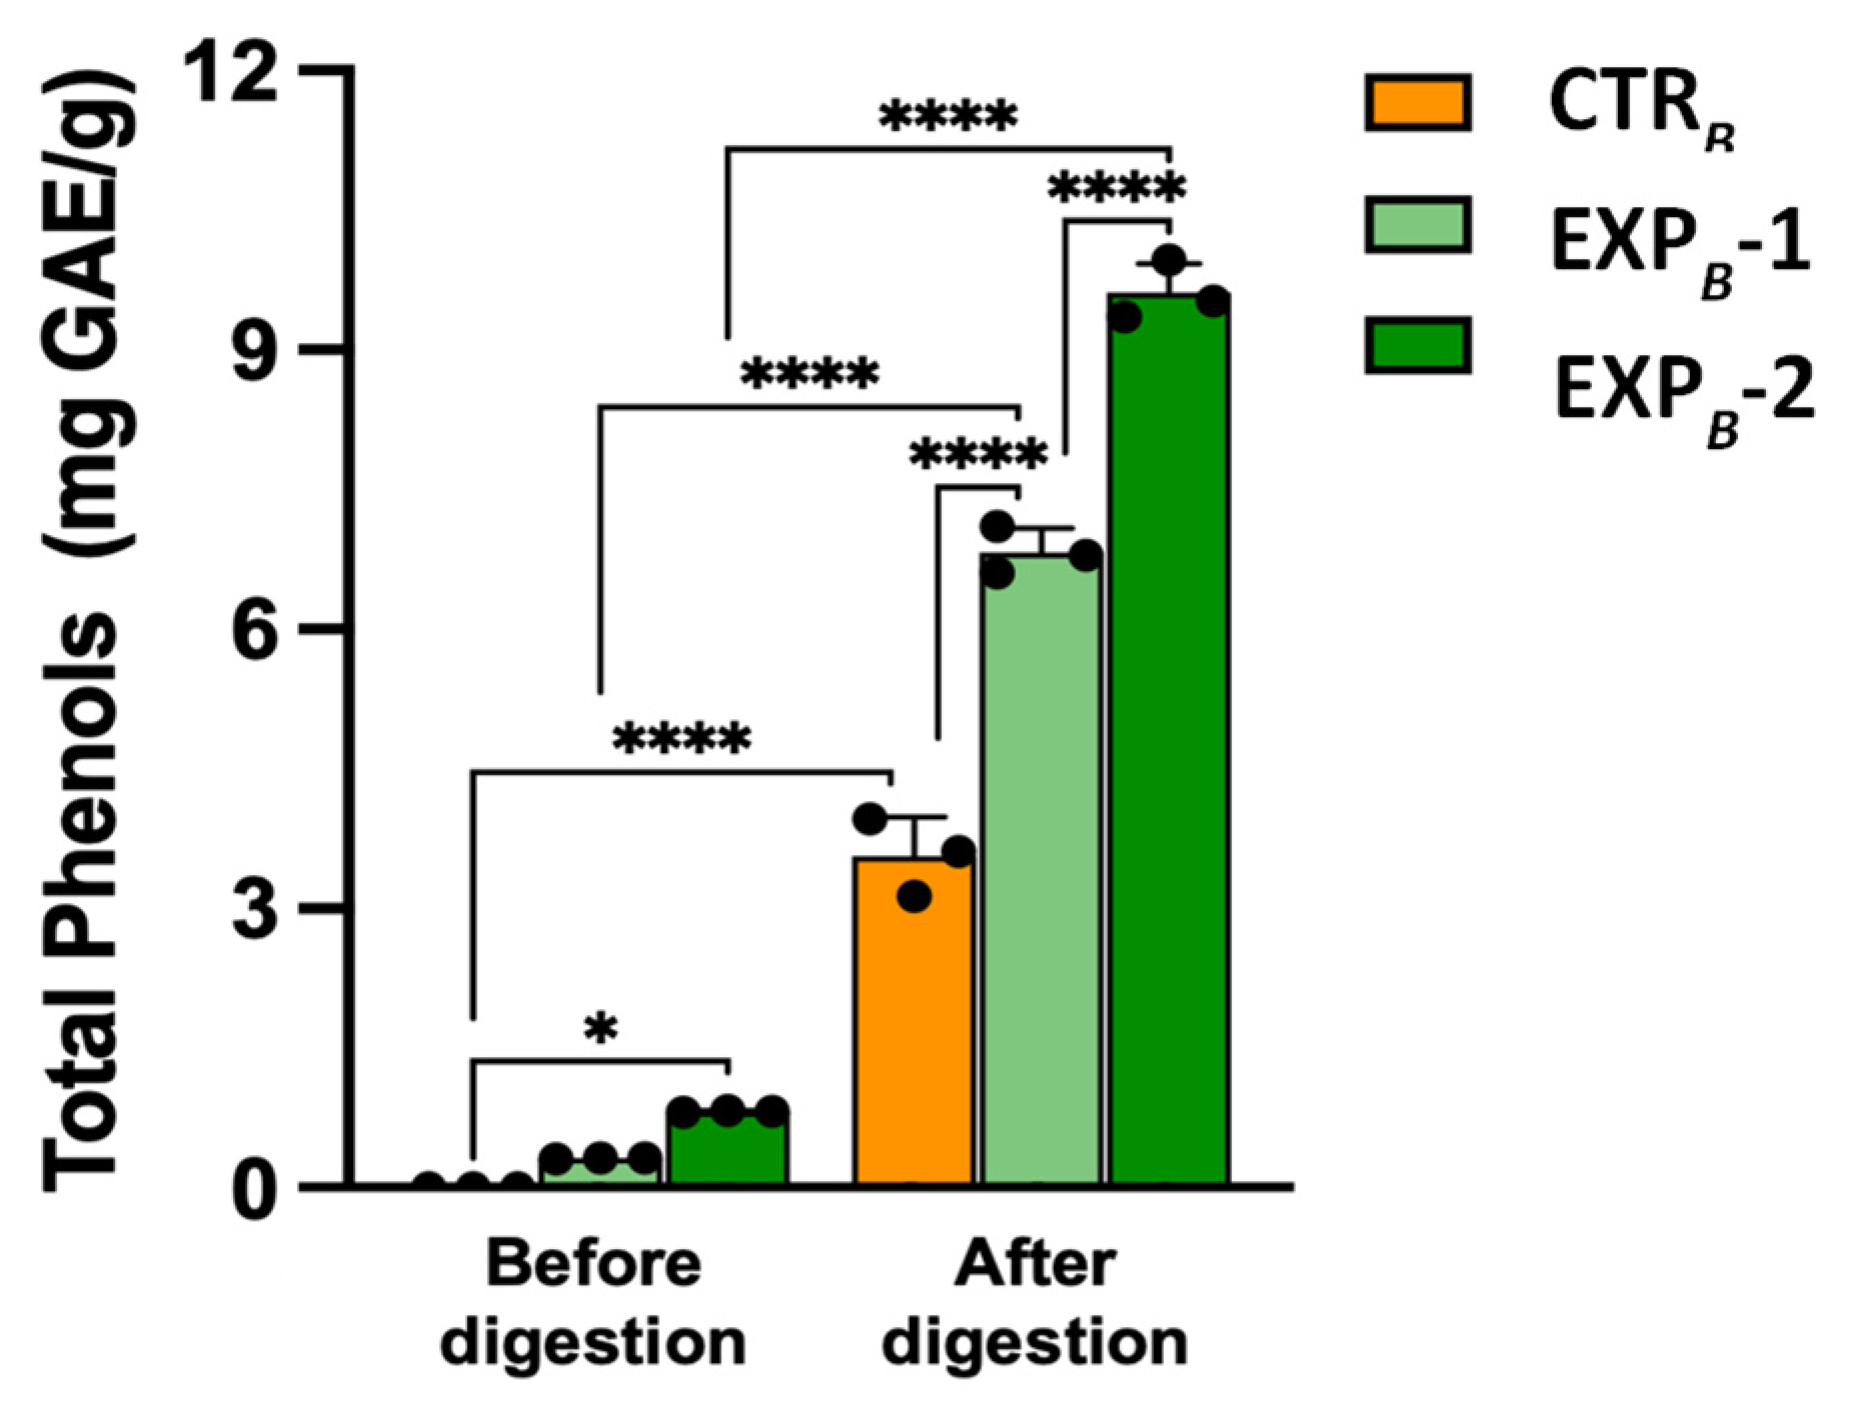
One milliliter of the aqueous suspension of bread, both before digestion and from the bio-accessible fractions obtained post in vitro digestion, was centrifuged at 1000× g for 15 min at 4 °C. This process effectively separated the soluble components from any particulate matter. The resulting soluble fractions were then processed to determine total phenolic content and assess radical scavenging activity.
For total phenol content determination, aliquots of 100 µL from each sample, prepared at three different dilutions to ensure accuracy across a range of concentrations, were mixed with 3 mL of 2% sodium carbonate (Na
2CO
3) solution [
30]. Then, 100 µL of the Folin–Ciocalteu reagent, pre-diluted in a 1:1 ratio with distilled water, was added to initiate the reaction. This mixture was left to incubate in the dark at room temperature for 60 min to allow color development. The absorbance of the resulting solutions was measured at 765 nm using a Beckman DU 640 spectrophotometer (Beckman Instruments, Milan, Italy). A blank solution was used as a reference to zero the instrument. The phenolic content in each sample was determined by measuring absorbance and comparing it to calibration curves created using gallic acid standards, with concentrations ranging from 5 to 100 µg/mL. The results were expressed as milligrams of gallic acid equivalents per gram of bread.
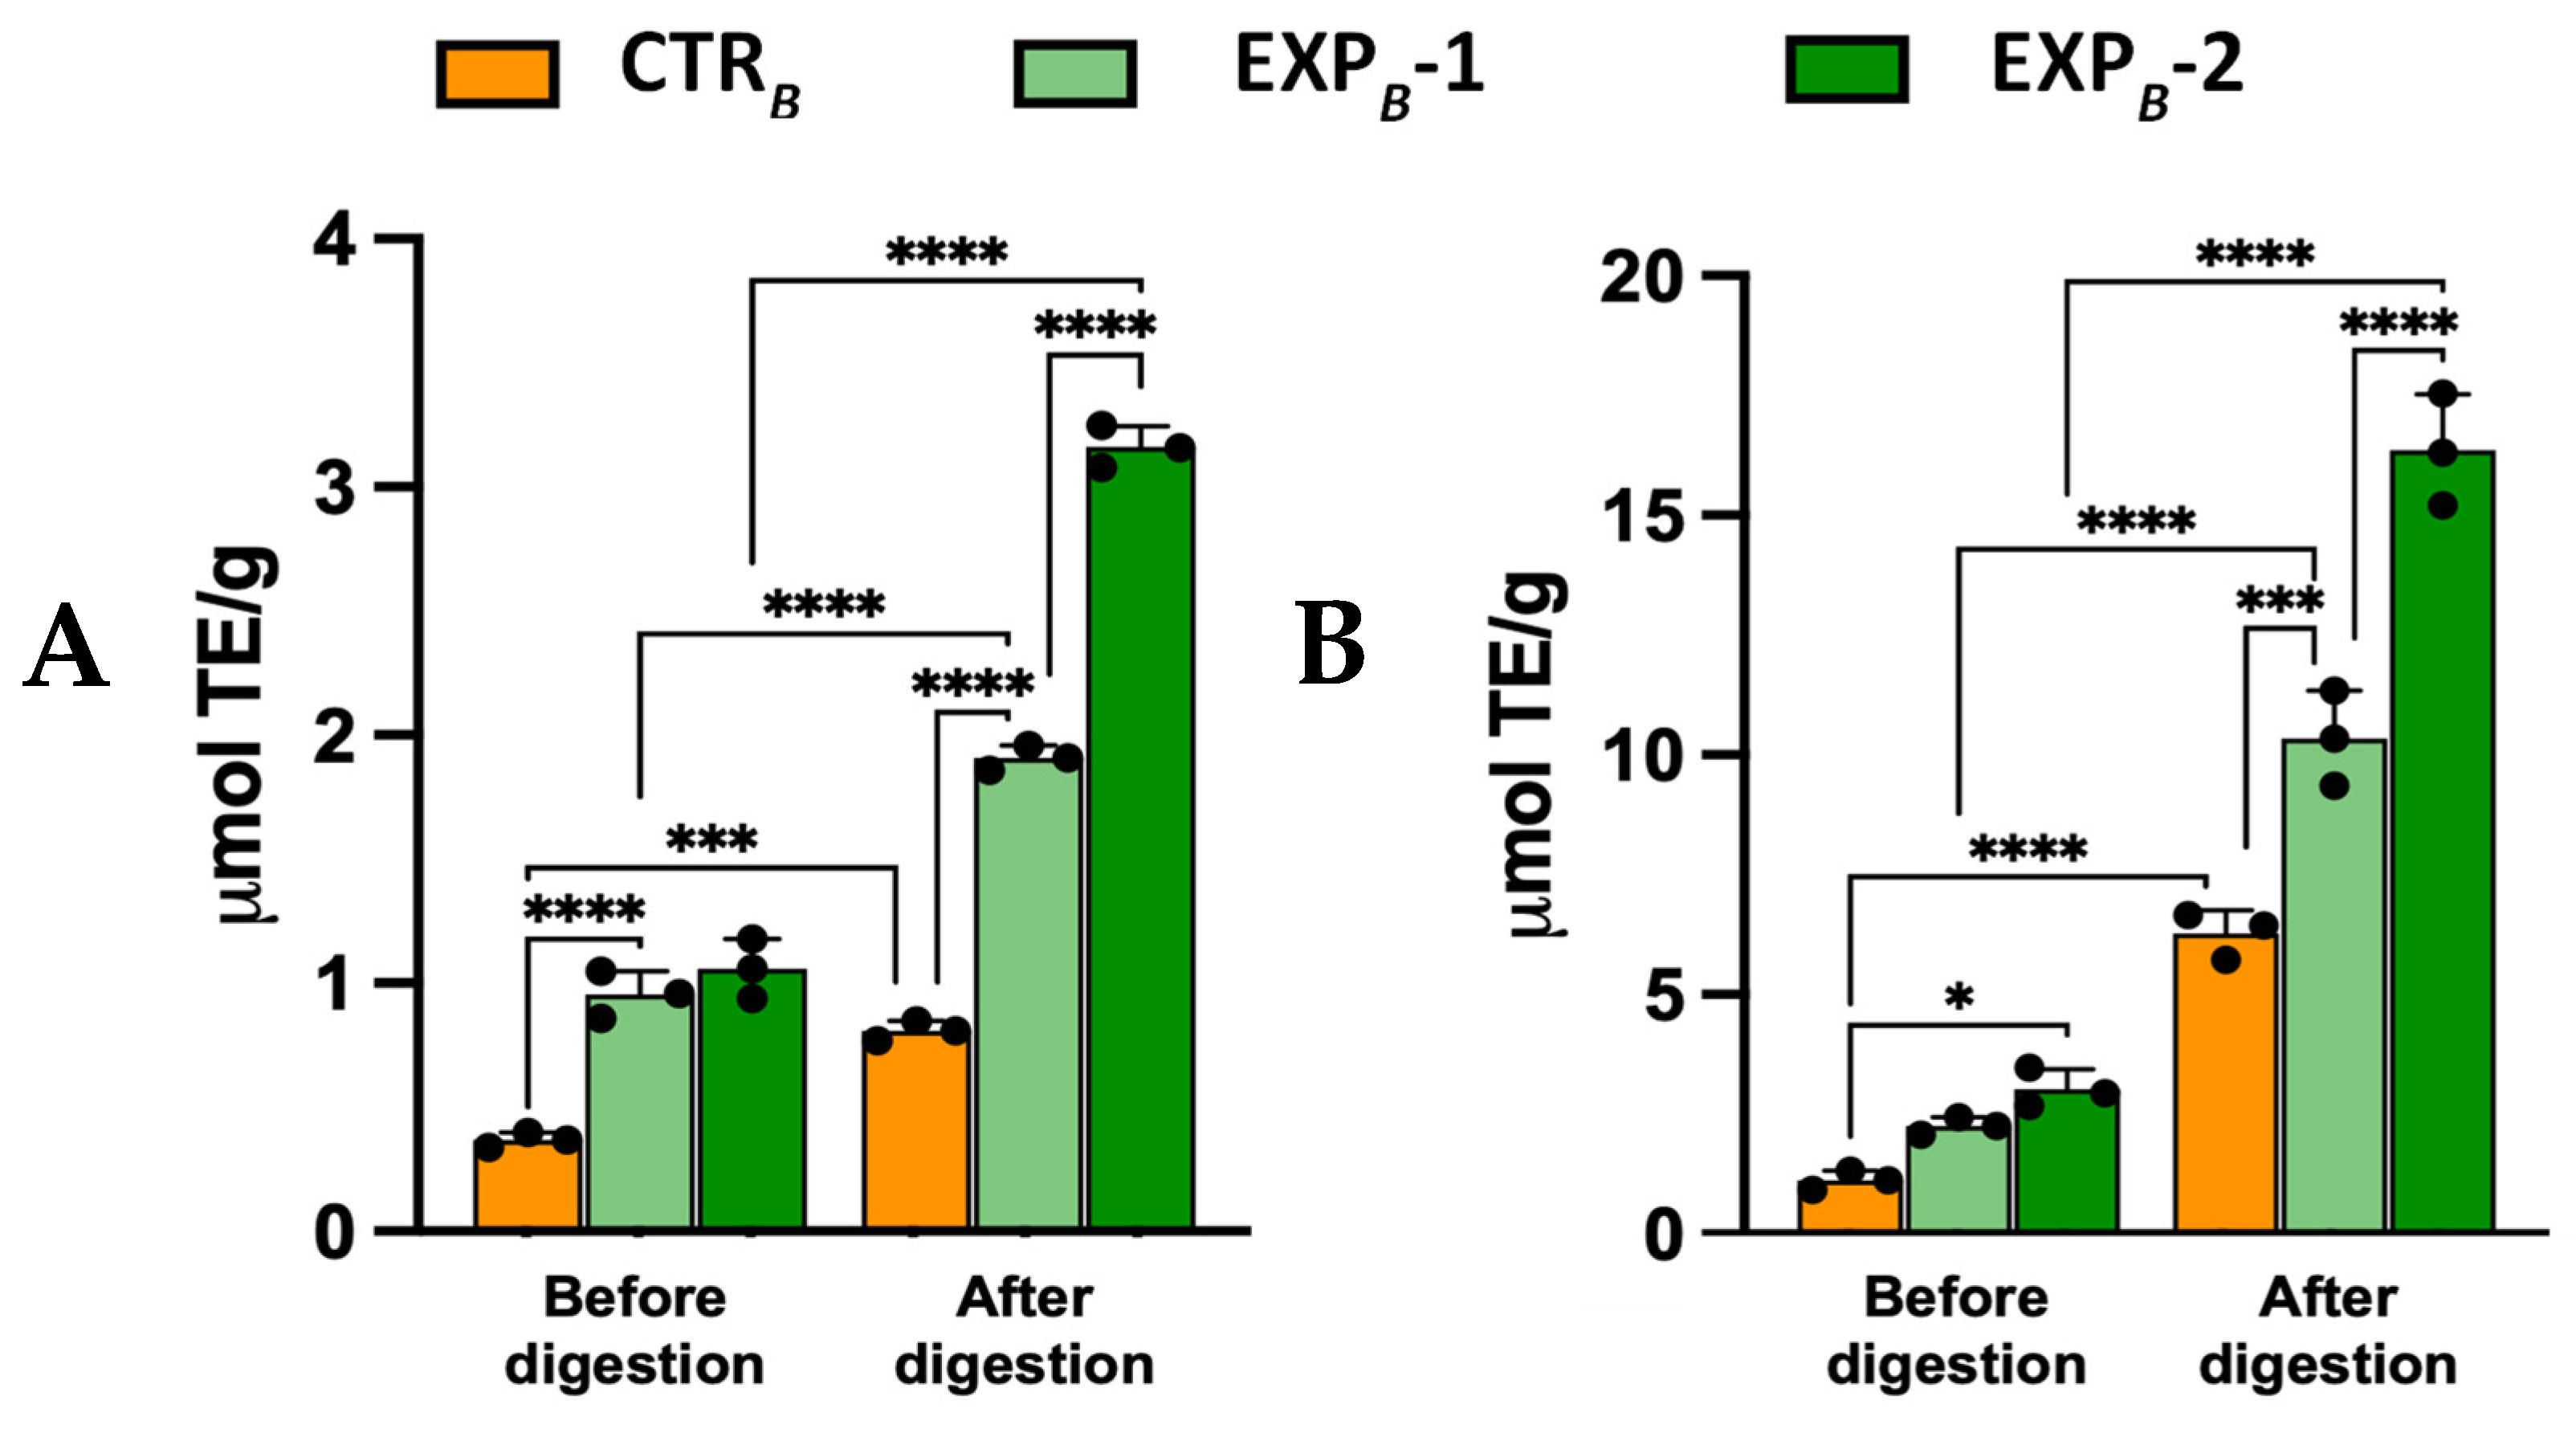
The radical-scavenging capacity of the bread was assessed through the decolorization assays of the 2,2′-azino-bis (3-ethylbenzothiazoline-6-sulfonic acid) (ABTS) radical cation and of the 2,2-diphenyl-1-picrylhydrazyl (DPPH) radical. The ABTS•+ radical was generated by oxidizing ABTS with potassium persulfate and diluted with 5 mM phosphate saline buffer to obtain an absorbance of 0.700 ± 0.020 units at 734 nm [
31]. Aliquots of properly diluted bread solution were added, and the absorbance registered again after 15 min.
The 2,2-diphenyl-1-picrylhydrazyl (DPPH) free radical scavenging activity was determined following the method described by Attanzio et al. [
32]. For the assay, 10 μL of bread solution was mixed with 1 mL of DPPH ethanol solution at a concentration of 1 × 10
−4 mol/L. The mixture was incubated at room temperature in the dark for 30 min, after which the absorbance was measured at 515 nm.
To ensure precision, each sample was analyzed in duplicate and at three different dilutions within the assay’s linear range. Calibration was performed using Trolox, a water-soluble analog of vitamin E, and the antioxidant activity was expressed as Trolox equivalents (TE), measured in μmol of Trolox equivalents per gram of bread.
2.9. Sensory Analysis
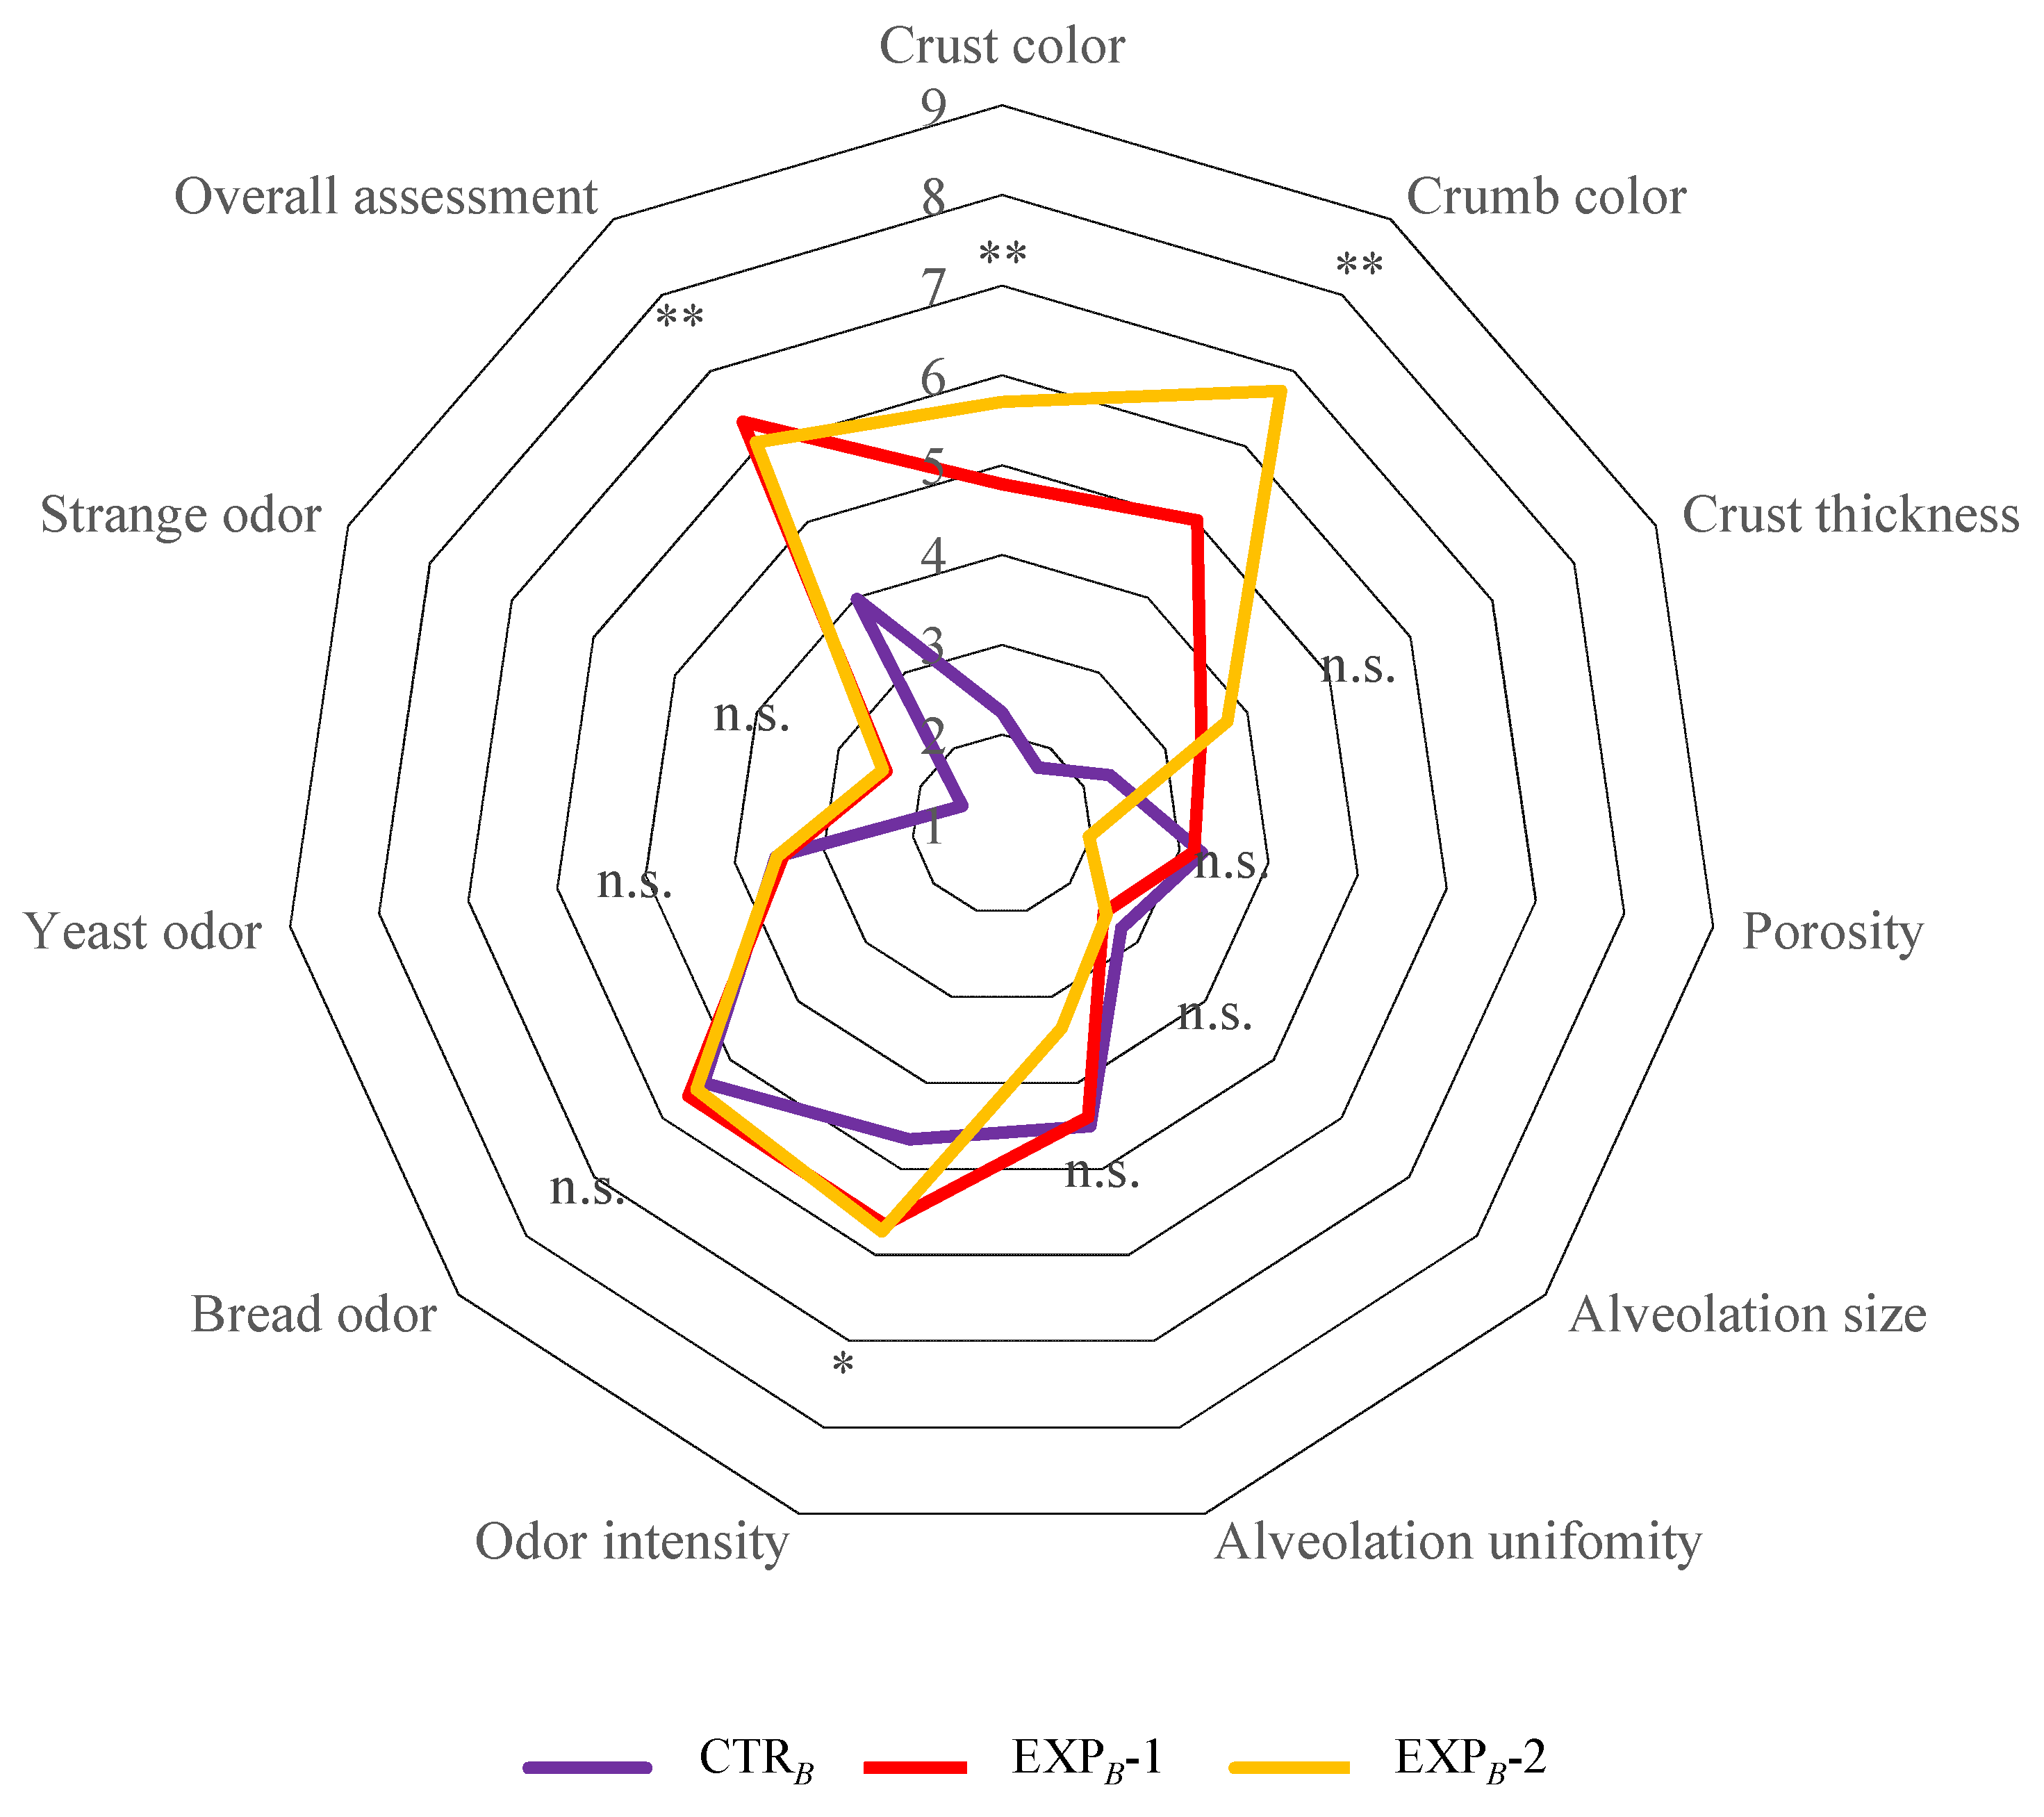
Only the final breads from the B process were evaluated through a descriptive sensory analysis by a panel of 13 trained judges, comprising 8 women and 5 men, aged between 23 and 55 years. The panelists were instructed to assess various attributes of the bread, including appearance, structure, and aroma, following the methodologies outlined by Comendador et al. [
33], Martins et al. [
34], and Rodrigues et al. [
35]. Each attribute was rated on a 9-point scale, where 1 represented extremely poor and 9 represented extremely good. Additionally, the judges provided an overall evaluation based on the combined scores of all attributes. The sensory analysis was conducted in individual booths in accordance with ISO 13299 [
36] standards. Taste parameters were excluded from the evaluation due to the presence of pesticide residues in the OOMW [
19], which precluded tasting the breads.
2.10. Statistical Analysis
A one-way analysis of variance (ANOVA) was conducted to detect differences in the microbiological and physicochemical data. Tukey’s test was subsequently employed for multiple mean comparisons, with statistical significance established at p < 0.05. All statistical analyses were performed using XLStat version 7.5.2 for Excel (Addinsoft, New York, NY, USA).


 ,
, 


