Article

Beyond Color Extraction: How Pulsed Electric Fields and Sulfites Affect Phenolic and Volatile Compounds of Primitivo Red Wine

by
Mirella Noviello
1,
Giusy Rita Caponio
2,
Giuseppe Corcione
3,
Luigi Tarricone
4,
Rosa Anna Milella
4,
Francesco Mazzone
4,
Luciano Mescia
5,
Claudio Maria Lamacchia
6,
Fatima Zohra Makhlouf
7,
Massimo Tripaldi
8,
Vito Michele Paradiso
3,*,
Gabriele Fioschi
3 and
Giacomo Squeo
1
1
Department of Soil, Plant and Food Science, University of Bari Aldo Moro, Via Amendola 165/a, I-70126 Bari, Italy
2
Department of Bioscience, Biotechnology and Environment, University of Bari Aldo Moro, Via Orabona 4, I-70125 Bari, Italy
3
Department of Biological and Environmental Sciences and Technologies, University of Salento, S.P. 6, Lecce-Monteroni, I-73100 Lecce, Italy
4
CREA, Council for Agricultural Research and Economics, Research Centre for Viniculture and Enology, Via Casamassima 148, 70010 Turi, Italy
5
Department of Electrical and Information Engineering, Polytechnic University of Bari, Via Orabona 4, I-70125 Bari, Italy
6
IAMAtek s.r.l., Via Nicholas Green 13/A, I-70127 Bari, Italy
7
Higher National School of Biotechnology Taoufik Khaznadar, Nouveau Pôle Universitaire Ali Mendjeli, BP. E66, Constantine 25100, Algeria
8
Centro Servizi Enologici s.a.s., Via per Avetrana 57, I-74024 Manduria, Italy
*
Author to whom correspondence should be addressed.
Foods 2025, 14(10), 1792; https://doi.org/10.3390/foods14101792
Submission received: 9 April 2025 / Revised: 13 May 2025 / Accepted: 15 May 2025 / Published: 18 May 2025

Abstract

The different impact and interaction of pulsed electric field (PEF) treatment and sulfite addition on the color, phenolic compounds, volatile profile, and sensory properties of a Primitivo wine were studied at bottling and after six months of storage. The results show that PEF treatment, promoting the electroporation of grape skin cells and the permeability of cell membranes, accelerated the extraction of anthocyanins and polyphenols only in the initial phase of maceration. After six months in bottles, wines treated only with PEF show lower levels of hydroxycinnamic acids and flavonols, but a significant increase in procyanidins B2, which are important for structure and color stability and a richer flavor profile, with higher concentrations of fruity esters and higher alcohols. The use of SO2 improves anthocyanin stabilization and facilitates the extraction of polyphenols. The wines from the PEF + SO2 combination maintain greater aromatic freshness, limiting the formation of oxidative compounds. Wines made from SO2 have a more balanced profile, with cherry, plum, and licorice aromas, although the combined PEF + SO2 treatment better preserves fresh fruit aromas, reducing the perception of dried fruits and herbaceous notes.

1. Introduction

The oenological sector, following new trends in wine consumption, is increasingly interested in innovative technologies to obtain higher-quality products, meet consumers’ sustainability expectations and improve production processes. In fact, innovative technologies such as ultrasound, microwave, pulsed electric fields (PEF), and high hydrostatic pressure have been developed and tested in wineries in the first steps of winemaking and during the aging process [1,2,3,4,5,6].
Among these technologies, PEF treatment is a non-thermal and environment-friendly approach tested as a novel technique to recover by-products (decreasing solvent usage, heating steps, and extraction time) [7] or in many food processing methods to preserve product or to increase the extraction rate in the food and nutraceutical industry [8,9,10,11,12]. PEF treatments induce a reversible/irreversible increment in cell membrane permeability, resulting in a process called electroporation, thanks to the application of very short electric pulses (in the range from μs to ms) at field strengths > 0.5 kV cm−1 to a product located between two electrodes [13].
In the oenological field, it has been proven that PEF technology accelerates the release of mannoproteins from Saccharomyces cerevisiae [14,15,16], and improves the malolactic fermentation performance [17,18] and wine qualities during the aging and storage period [19,20]. Moreover, when applying sufficiently strong electric fields, PEFs can exert antimicrobial activity, inactivating wine spoilage microorganisms [21,22,23], allowing a sanitization of must, and reducing the need for must sulfation [4,24,25]. Moreover, this technology has been mostly tested as new maceration trend in order to improve the extraction of phenolic and aromatic compounds from grape and reduce the maceration time and temperature [26,27].
The winemaking step known as maceration–fermentation is a crucial phase of red wine production. In this phase, the must of red grapes undergoes fermentation together with the solid parts of the grape berries, so that polyphenols and aroma compounds are extracted from the grape skin and the seeds [28]. The choice of the maceration–fermentation conditions or the different techniques used in this phase can modulate the rate of extraction and the amount of extracted phenolics and aromatic compounds [29]. When used in this winemaking step, PEF processing is applied to a mix of must, skin, and seeds obtained after destemming and light mechanical crushing. Thanks to the short pulses of high voltage and a sufficiently strong electric field, the cell membrane of grape skins undergoes electroporation, becoming permeable to compounds such as polyphenols that are otherwise unable to cross it [13]. In the last 10 years, several studies have confirmed that wines obtained from PEF-treated red grapes and macerated/fermented for a few hours or days had distinct sensory characteristics and were characterized by higher concentrations of anthocyanins, flavanols, tannins, stilbenes, hydroxycinnamic and hydroxybenzoic acids, and total polyphenols, which improve antioxidant activity, color intensity, and the formation of polymeric pigments [4,30,31,32,33]. However, in some cases, a cultivar-dependent effect of PEFs applied to maceration was reported [33,34]. López-Giral et al. (2015) reported different responses in the extraction of individual phenolic compounds in Graciano, Tempranillo, and Grenache musts [33]. López et al. (2008) also found different effects of PEF treatment at varying intensities on Graciano, Garnacha, and Mazuelo [34].
Few data are available, to the best of our knowledge, regarding the interaction of PEF treatment with must sulfiting. A previous paper evaluated their application for the microbial stabilization of white must [35]. No studies are available, instead, on the chemical effects of the interaction of PEF and sulfites in red winemaking.
The present work was therefore aimed at evaluating the different impacts and interactions of PEF treatment and sulfite addition on the color, phenolic compounds, volatile profile, and sensory properties of a Primitivo wine.

2. Materials and Methods

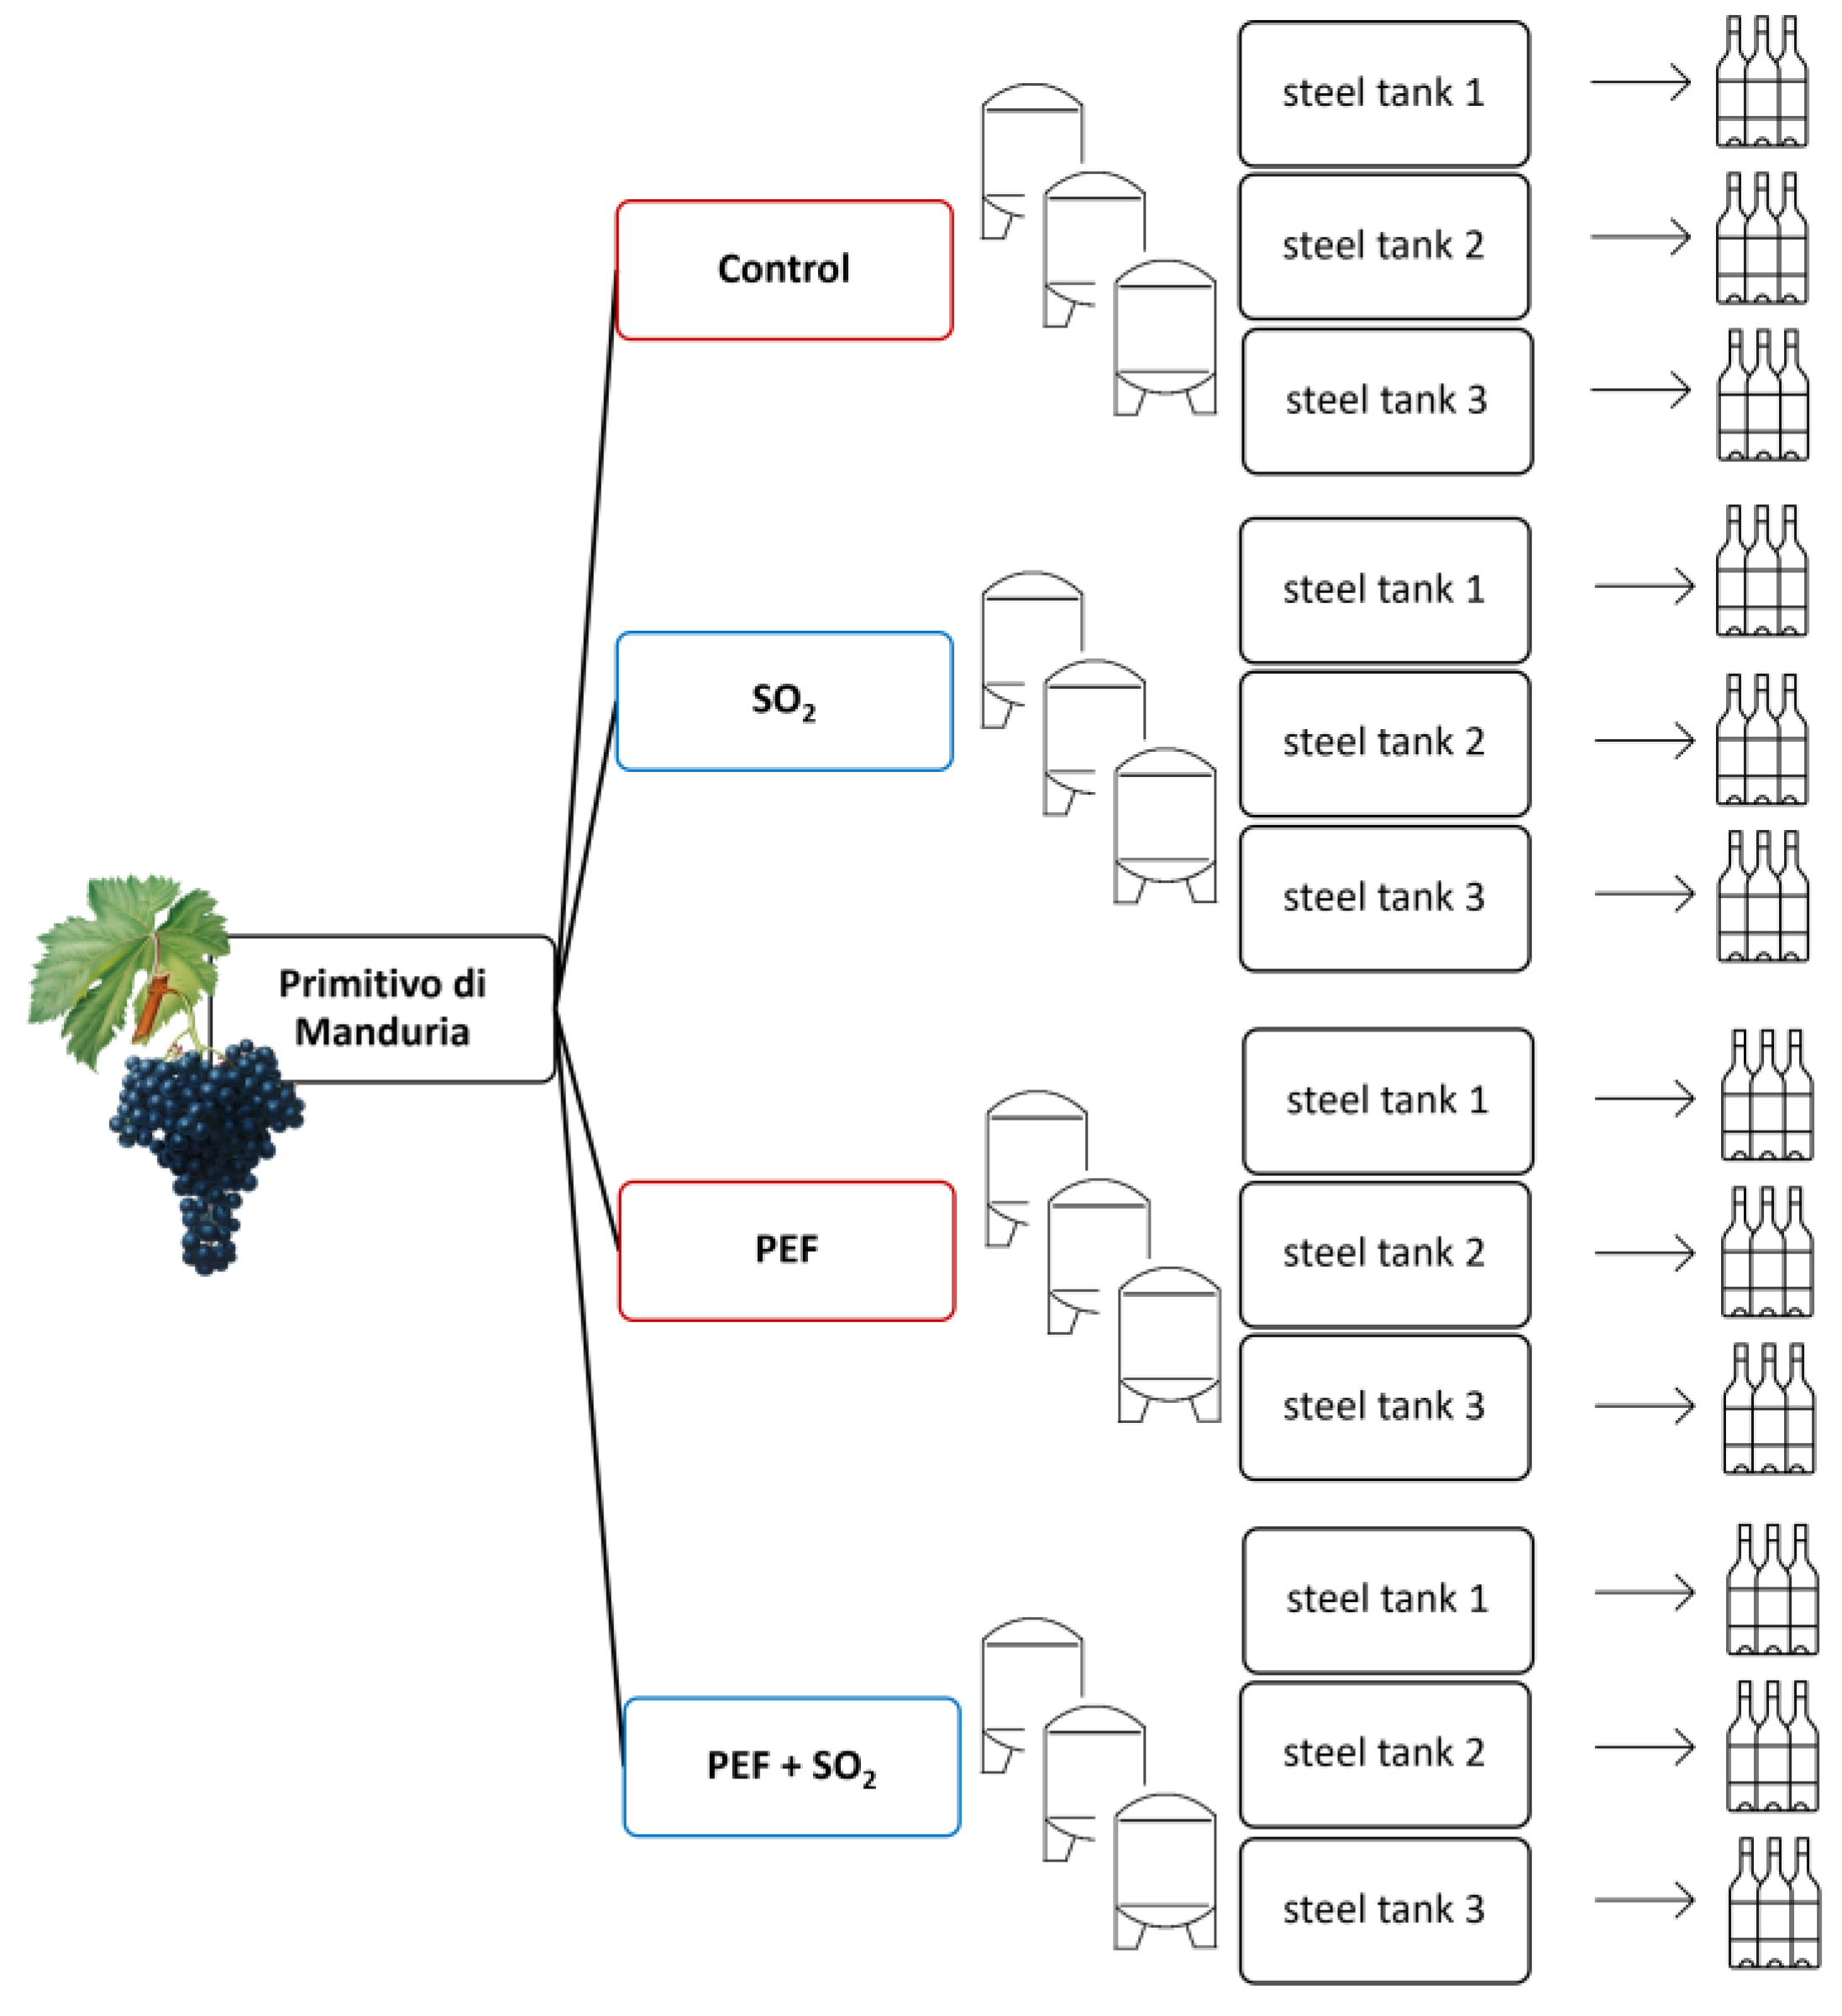
2.1. Grape Samples, PEF Equipment, and Processing

A batch of 400 kg of red grapes (Vitis vinifera var. Primitivo) was harvested in a vineyard in Manduria (Taranto, Apulia, Italy) and immediately carried out to the experimental winery of CREA (Council for Agricultural Research and Economics, Research Centre for Viniculture and Enology—Bari, Italy) for the winemaking trials.
The grapes were destemmed and crushed. Specifically, a part of the mash obtained was subjected to PEF processing in a PEF pilot plant (PULSEtek, IAMAtek s.r.l., Bari, Italy) with a chamber for batch treatments. The PEF parameters were the following: 2 kV cm−1 field strength, 20 μs pulse duration, 10 Hz pulse frequency, 6.5 kJ kg−1 total specific energy. Both PEF-treated and untreated mashes were divided into two aliquots, one of which was sulfited through the addition of 20 g hL−1 of potassium metabisulfite (Polsinelli s.r.l., Isola del Liri, Frosinone, Italy). Red winemaking was carried out in 25 L steel tanks. Each experimental condition was applied in triplicate.
Figure 1 shows a summary of the experimental trials.
Each tank was immediately supplemented with 20 g hL−1 of yeast Saccharomyces cerevisiae (FermivinP21, OENOBRANDS SAS, Montpellier Cedex 5, France). The fermentation took place under controlled conditions at 20 °C. For all samples, maceration was performed for 15 days with 2 punch-downs per day, monitoring the color parameters (color intensity and tonality), using Agilent 8453 (Agilent Technologies, Santa Clara, CA, USA), total phenolic content, and anthocyanin content of must after one, two, five, eight, and fifteen days of maceration. Then, free-run wine was recovered by draining, and the grape pomace was pressed to recover press-run wine using an 80 L stainless steel hydro press (Enotecnica Pillan, Camisano Vicentino, Italy). The free-run and press-run wines were blended and raked after two weeks to eliminate gross lees. In order to promote the malolactic fermentation, 30 g hL−1 of yeast parietal extract (Enolis Scorza P, L’Enotecnica s.r.l., Nizza Monferrato, Italy), 1 g hL−1 of a commercial strain of Oenococcus oeni (Enobacter red boost, L’Enotecnica s.r.l., Nizza Monferrato, Italy), combined with 30 g hL−1 of a formulation composed of yeast derivatives, vitamins (B2, B5, B6) (Merck S.r.l., Milan, Italy), and potassium caseinate (Enoactiv Bacter, L’Enotecnica s.r.l., Nizza Monferrato, Italy) were added. The malic acid decrease was monitored using a Foss WineScan FT 120, as described by the manufacturer (Foss, Hillerød, Denmark). Thirty days after the conclusion of malolactic fermentation, wines were racked into dark green Bordeaux bottles. The wines obtained were analyzed at bottling and after six months of storage (18 ± 1 °C).

2.2. Must Characterization During Fermentation

2.2.1. Determination of Total Phenolic Content, Total Anthocyanins, Color Hue, and Color Intensity

Total phenolic content (TPC) was determined using the microscale protocol [5]. Briefly, 1 mL of water, 0.02 mL of grape must, 0.2 mL of the Folin–Ciocalteu reagent (Merck S.r.l., Milan, Italy), and 0.8 mL of 10% sodium carbonate (Merck S.r.l., Milan, Italy) solution were mixed and brought to 3 mL. The absorbance was measured at 750 nm after 90 min at room temperature with a spectrophotometer Agilent 8453 (Agilent Technologies, Santa Clara, CA, USA). Results were expressed as milligrams of gallic acid equivalent per L based on a gallic acid calibration curve (50 to 500 mg L−1 with R2 = 0.998).
Total anthocyanins were determined using a pH differential protocol as previously described [36]. Appropriate grape must dilutions (1:25) were mixed with 0.025 M potassium chloride (Merck S.r.l., Milan, Italy) (pH 1) or 0.4 M sodium acetate (Merck S.r.l., Milan, Italy) (pH 4.5) buffers. Absorbance was measured at 520 and 700 nm with the Agilent 8453 spectrophotometer system (Agilent Technologies, Santa Clara, CA, USA). Results were expressed as milligram cyanidin 3-glucoside equivalents per L of grape must (mg Cy L−1).
The traditional method for the quantitative measurement of wine color is the Glories parameter method [37]. This method provides several parameters, the color hue (H) and the color intensity (CI), to express red wine color information through absorbance values visible at different specific wavelengths (420, 520, and 620 nm). The grape must samples were scanned and recorded using a spectrophotometer Agilent 8453 (Agilent Technologies, Santa Clara, CA, USA), with a 1 mm path length quartz cuvette. Deionized water was set as the blank reference. Each analysis was performed in triplicate.
CI = Abs420 + Abs520 + Abs620
H = Abs420/Abs520

2.3. Wine Characterization

2.3.1. General Oenological Parameters

Ethanol (E, % v/v), titratable acidity (TA, g L−1), pH, malic acid (MA, g L−1), lactic acid (LA, g L−1), citric acid (CA, g L−1), tartaric acid (Tar, g L−1), ashes (g L−1), and free (mg L−1) and total SO2 (mg L−1) in all wines were analyzed in triplicate using a Foss WineScan FT 120, as described by the manufacturer (Foss, Hillerød, Denmark).

2.3.2. Phenolic Composition and Color Indices

Total phenolic content (TPC as mg L−1 of gallic acid equivalents) was determined using the Folin–Ciocalteu reagent [38]. In a test tube, 100 µL of wine (diluted 50 times) was mixed with 100 µL of Folin–Ciocalteu reagent and, after 4 min, with 800 µL of Na2CO3 (5%). The mixture was then heated in a 40 °C water bath for 20 min, and the total phenol content was determined at 750 nm.
Total flavonoids (F, as mg L−1 of (+)-catechin), total anthocyanins (A, as mg L−1 of malvidin-3-glucoside), proanthocyanidins (Pr, as mg L−1 of cyanidin chloride), and flavans reactive with vanillin (FRV, as mg L−1 of (+)-catechin) were determined [39]. For flavonoid and anthocyanin determination, wine samples were diluted 50 times with ethanol–hydrochloric acid solution and evaluated using the absorbance spectrum in the range of 230–700 nm. The flavonoid content was calculated according to the following formula:
F = E280 × df × 82.4
E280 is a specific extinction coefficient at 280 nm assessed with the graphic method (absorbance corresponding to the segment, parallel to the y-axis, starting from the peak medium at 280 nm, and finishing on the tangent joining the points of the minimum on the left and right of the peak). df indicates the dilution factor, and 82.4 was the value determined considering the ratio between the concentration (mg L−1) and the corresponding E280 of pure (+)-catechin.
The anthocyanins content was evaluated using the following formula:
A = Emaximum × df × 26.6
Emaximum indicates the specific extinction coefficient at the maximum of the visible region (~520 nm) assessed with the graphic method as described before; 26.6 was the value determined considering the molar extinction coefficient of an anthocyanin mixture derived from grapes (Ɛ = 18800, MW medium = 500).
Absorbance at 500 nm was measured in the case of flavans reacting with vanillin. Their content in wine (diluted 5 times) was evaluated according to the following formula:
FRV = ΔE × df× 290.8
ΔE indicates the difference between the absorbance assessed at 500 nm (E500) of the sample with and without vanillin, and 290.8 was the value determined considering the ratio between the concentration (mg L−1) and the corresponding E500 of pure (+)-catechin.
The proanthocyanidin content was measured at 532 nm and calculated as follows:
Pr = ΔE/V × 1162.5
ΔE indicates the difference between the specific extinction coefficient assessed at 532 nm with the graphic method of the sample after and before acid hydrolysis by heat, and V is the wine volume (1 mL diluted 5 times); 1126.5 was the value determined considering the ratio between the concentration (expressed as mg L−1) and the corresponding ΔE of pure cyanidin chloride.
H and CI were determined using the same method described in Section 2.2.1, as well as the percentage of yellow (DO420(%) = DO420 × 100/CI), percentage of red (DO520(%) = DO520 × 100/CI), and percentage of blue (DO620(%) = DO620 × 100/CI). Moreover, the purity of the red color, dA(%), was also calculated as follows:
dA ( % )   1 D O 420 D O 620 2 D O 520 × 100
Condensed tannin (Tan) was determined using the precipitation with methyl cellulose, as described by Sarneckis et al. [40].
Three experimental replicates were analyzed for each wine, using an EVOLUTION 60S UV-visible spectrophotometer (ThermoFisher Scientific, Rodano, Italy).

2.3.3. Antioxidant Activity Evaluation

The DPPH (2,2-diphenyl-1-picrylhydrazyl) assay was performed on the wines according to the procedure of Tarantino et al. [41]. Briefly, each extract (50 μL) was combined with 950 μL DPPH solution (0.08 mM in ethanol) (Merck S.r.l., Milan, Italy). The decrease in absorbance was read at 517 nm using an Evolution 60S UV–visible spectrophotometer (ThermoFisher Scientific, Rodano, Italy). The results were expressed in μmol Trolox equivalents per L for all wine (μmol TE L−1). All determinations were carried out in triplicate. Antioxidant activity was also determined by ABTS-TEAC assay [41]. For spectrophotometry, the reaction took place directly in cuvettes by adding 50 μL of each sample to 950 μL of final ABTS + solution (Sacco S.r.l. Cadorago, Como, Italy). After 8 min, the decrease in absorbance was measured at 734 nm, using an Evolution 60S UV–visible spectrophotometer (ThermoFisher Scientific, Rodano, Italy). The results were expressed μmol Trolox equivalents per L for all wine (μmol TE L−1). Each sample was analyzed in triplicate.

2.3.4. Analysis of Phenolic Compounds by UHPLC-DAD-MS/MS

UHPLC-DAD-MS/MS analysis of phenolic compounds was carried out using an UHPLC Ultimate 3000RS Dionex interfaced with an H-ESI II probe with an LTQ Velospro linear ion trap mass spectrometer (Thermo Fisher Scientific, Waltham, MA, USA), according to Noviello et al. [5]. Specifically, analytical separation was achieved using an Hypersil GOLD aQ C18 column (100 mm in length, 2.1 mm in internal diameter, and 1.9 µm in particle size, Thermo Fisher Scientific, Waltham, MA, USA), held at 30 °C and at a constant flow of 0.3 mL min−1 with a solvent A composed of water–formic acid (Merck S.r.l., Milan, Italy) (90:10 v/v) and solvent B composed of acetonitrile–formic acid (Thermo Fisher Scientific, Segrate, Milan, Italy) (99.9:0.1 v/v). The gradient program of solvent A was as follows: 0–20 min from 98% to 30%; 20–24 min isocratic at 30%. Then, equilibration was performed at the initial conditions for 9 min. The PDA detector was set to scan from 220 to 600 nm of the wavelength managed by a 3D field.
Samples were analyzed in MS with two methods: a full-scan method from 100 to 1000 m/z and a data-dependent experiment to collect MS2 data. In this case, the data-dependent settings were full-scan from 140 to 800 m/z for negative ionization mode and from 200 to 1000 for positive ionization, with an activation level of 500 counts, isolation width of 2 Da, default charge state of 2, and CID energy of 35. Tentative identification of compounds was performed using mass spectra (MS2), λmax, and retention time accordingly to the literature [42,43,44,45,46].
Analytical-grade standards were used for quantitation with the external standard method (R2 = 0.9972–0.9999): (+)-catechin, (−)-epicatechin, malvidin-3-O-glucoside, and quercetin were purchased from phyproof® (PhytoLab, Dutendorfer, Germany); gallic acid and caftaric acid were purchased from Sigma-Aldrich (St. Louis, MO, USA). Results were expressed in mg of compound per L. All analyses were performed in triplicate.

2.3.5. Analysis of Volatile Organic Compounds by SPME-GC/MS

VOCs were analyzed by SPME-GC/MS according to Prezioso et al. [47] using a Trace1300 gas chromatograph equipped with a mass spectrometer ISQ Series 3.2 SP1. One milliliter of each sample was placed into 20 mL glass vials with a headspace screw cap containing 0.2 g mL−1 of NaCl (to increase the ionic strength) and 10 μL of internal standard solution (2-octanol, 820 ng) (Merck S.r.l., Milan, Italy) as an internal standard for semi-quantitation, and then they closed with a silicone/PTFE septum (Merck S.r.l., Milan, Italy) and an aluminum cap. Samples were loaded into an autosampler Triplus RSH (ThermoFisher Scientific, Rodano, Italy), in which a stabilization of the headspace in the vial was obtained via equilibration for 10 min at 50 °C. The extraction was performed using a divinylbenzene/carboxen/polydimethylsiloxane (DVB/CAR/PDMS) ((Merck S.r.l., Milan, Italy) 50/30 mm SPME fiber assembly (Supelco, Bellefonte, PA, USA) at 50 °C for 30 min. The compound separation took place in a Thermo capillary column VF-WAX MS (60 m, 0.25 mm, 0.25 μm) with an injection port temperature of 200 °C and oven temperatures of 40 °C for 0.5 min, and then 3 °C min−1 to 210 °C with a final isothermal for 2 min. The mass detector was set as follow: ionization energy, 70 eV; detector voltage, 1700 V; scan range, 33–150 amu; source temperature, 250 °C. The tentative identification of the peaks was performed with Xcalibur v2.0 using the reference mass spectra of the NIST library. The amounts were expressed as μg of 2-octanol equivalents per liter.

2.3.6. Sensory Analysis

After six months of storage, each wine was subjected to the sensory analysis following the method described by Noviello et al. [5]. The evaluation panel was composed of 7 expert tasters between 24 and 60 years of age, who knew of the ethical guidelines of the laboratory of the Food Science and Technology of the Department of Soil, Plant, and Food Science of the University of Bari (Italy). The wine samples were presented in a completely randomized order to each panelist without giving any information about their preparation. Before the first session, the descriptors to be used in the quantitative descriptive analysis (QDA) and in the list used for check-all-that-apply (CATA) analysis were defined in a preliminary consensus session with a blind simultaneous tasting of four wine samples. An evaluation sheet was provided to the judges, and the descriptors were grouped by visual (limpidity, color intensity, and viscosity), olfactory (frankness, intensity, persistence, balance), and taste (frankness, gustatory intensity, gustatory persistence, tannicity, gustatory balance, and body) characteristics; an overall judgment was also included in the evaluation sheet. Panelists rated each attribute on a scale from 0 (absence) to 10 (maximum perception). The olfactory profile was also valuated with the CATA approach: the judges reported the perception of odorous attributes (such as licorice, soft fruit, cherry, plum).

2.4. Statistical Analysis

Principal component analysis (PCA) was used to analyze the colorimetric index, total phenolic content, and total anthocyanins of must samples in different maceration–fermentation steps. One-way analysis of variance (one-way ANOVA), followed by Tukey’s test (p ≤ 0.05), was applied to determine significant differences in terms of oenological parameters between the samples. OriginPro 2024 (version 10.1.0.170 (SR0)) (OriginLab Corporation, Northampton, MA, USA) was applied for these statistical analyses. A clustering analysis with the construction of a heatmap (distance measure using Euclidean, and clustering algorithm using ward) was used to evaluate the phenolic composition, color indices, antioxidant activity, and phenolic and volatile profiles of the wine samples. Partial correlation analysis (metadata: PEF/SO2; covariate: SO2/PEF; correlation measure: point biserial correlation) was performed using Metaboanalyst 6.0. Correspondence analysis (minimum term frequency = 3) was carried out on the CATA analysis results using the KH coder software (version 3.Beta.07f) (http://khcoder.net/en/), accessed on 18 January 2025.

3. Results and Discussion

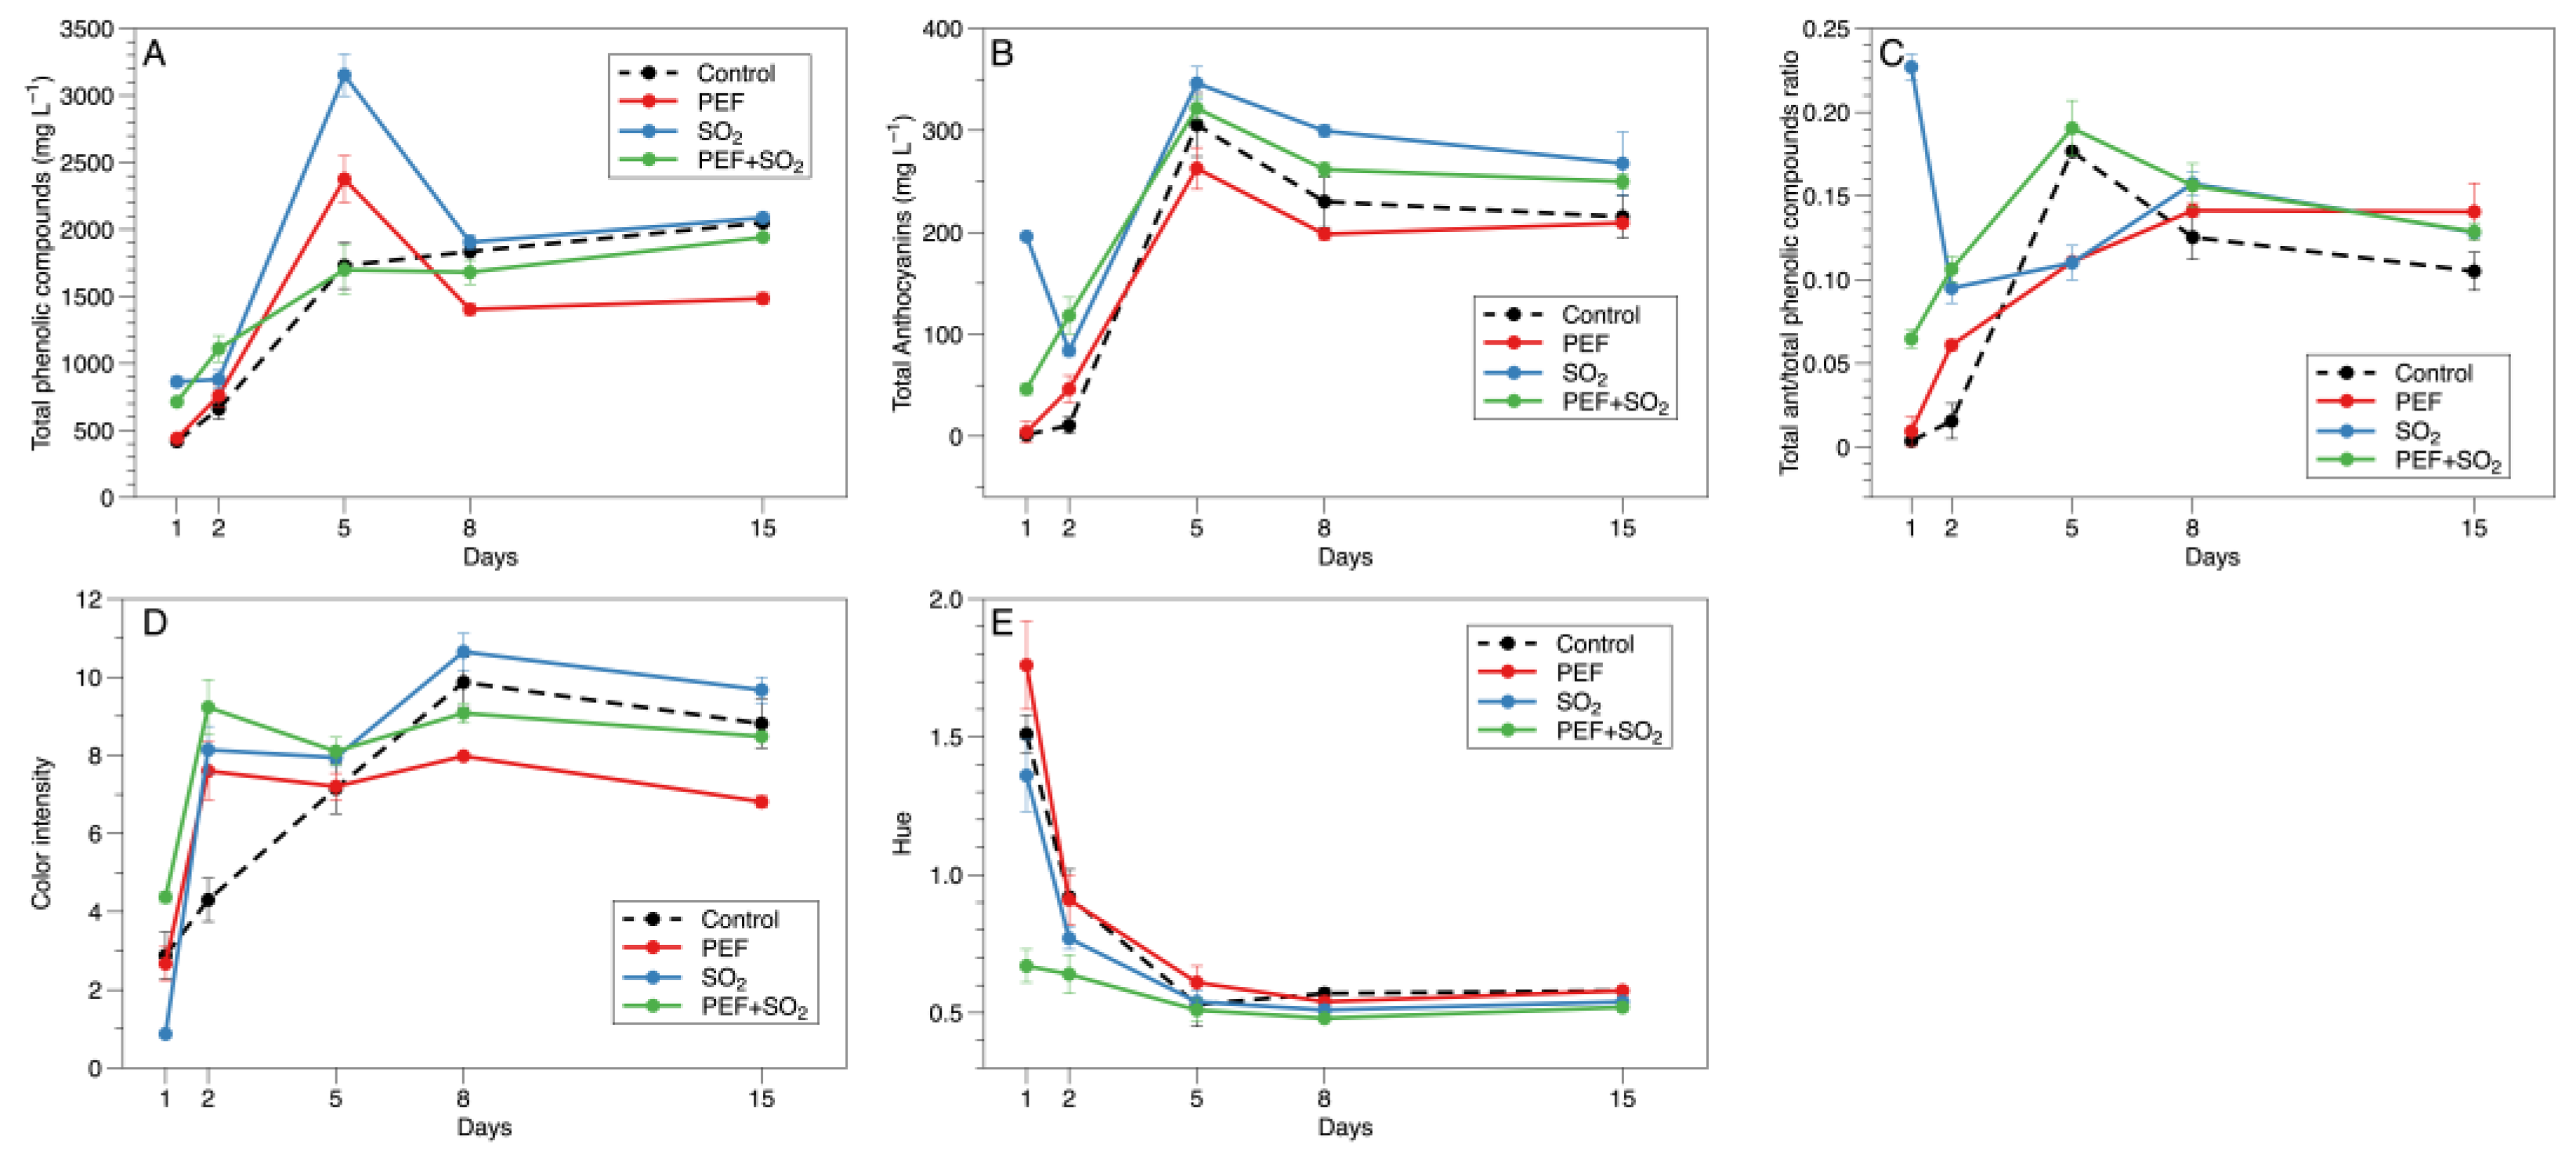
3.1. Color Trends During Maceration

Specifically, Figure 2 shows the evolution of the total phenolic compounds, total anthocyanins, total anthocyanins/total phenolic compound ratio, color intensity, and hue during the maceration–fermentation step of the Primitivo grapes treated and untreated with PEF and SO2. The Supplementary Materials report the results of two-way ANOVA followed by Tukey’s HSD test (Table S1). The extraction of total phenolics (Figure 2A) showed a steep increase in the first five days, probably attributable to the hydrophilic anthocyanins, followed by a further, moderate increase in the second part of maceration, probably related to tannins [34]. Both PEF-treated and SO2-added musts showed a peak of total phenolic compounds after five days of maceration, with the highest values in sulfited wines. The solubilizing effect of sulfur dioxide is well known, particularly in the early stages of maceration [48,49]. Similarly, Maza et al. [27] reported that an intense PEF treatment (5 kV cm−1, 52.9 kJ kg−1) promoted a rapid release of must anthocyanins after 24 h of maceration. Moreover, the addition of sulfur dioxide determined significantly higher extraction of phenolic compounds since the first day of maceration. However, a decrease in phenolic compounds occurred in PEF-treated and SO2-added musts, so that the second half of maceration showed trends similar to control samples in the case of SO2 addition, while PEF treatment determined lower phenolic contents in macerating musts. Further research is needed to assess the fate of the lost fraction of phenolic compounds. In fact, previous research has shown that suspended cell wall materials exert a great affinity toward phenolic compounds, and that adsorption phenomena can occur and hinder the effectiveness of disruptive treatments, such as ultrasound [50,51,52,53], during maceration. This effect has been documented for ultrasound-treated grapes [52], while no evidence is available for PEF-treated grapes. Therefore, the decrease in phenolic compounds following PEF treatments remains a matter for investigation. Moreover, our findings disagree with those from previous studies on the effect of PEF treatment during red winemaking [26,27,54], which reported improved extraction performances in PEF-assisted maceration. However, several factors could explain these contrasting outcomes: a varietal effect should be considered a source of variability in the response of grapes to non-thermal technologies, for example, due to differences in the cell wall composition of grapes skins [55]; also, operational parameters and equipment engineering could largely affect the results [11]. Finally, other studies combined PEF treatment with shorter maceration times and therefore could not investigate the effects of longer maceration times [27]. The combined application of PEF and sulfur dioxide did not lead to the peak of extraction after five days, though higher levels of phenolic compounds could be found in the early stage of maceration, as observed with SO2 alone. Also in this case, the second half of maceration provided an extraction curve almost overlaid on the control samples. Total anthocyanins (Figure 2B) showed analogous trends. The typical extraction curve, with a peak in early–medium stages and subsequent decrease due to diminuition, could be observed in all musts. SO2 addition, with or without PEF, determined higher extraction in the early maceration compared to the other treatments. In the second half of maceration, only the SO2 treatment determined higher levels of anthocyanins compared to the control and PEF treatment. When combining SO2 and PEF, no significant difference could be observed with the other treatments. Therefore, in terms of extracted amounts, PEF applied to Primitivo grapes may provide improvement only for short-term macerations [56].
However, another interesting effect of the tested treatments could be observed in plotting the ratio between total anthocyanins and total phenolic compounds (Figure 2C). Though this ratio cannot be considered with quantitative purposes, due to different quantitation references for these indices, it can be informative for comparison-only purposes. The plot highlights that all the treatments, compared to the control, determined a relatively high ratio of anthocyanins to total phenols. This difference is particularly relevant in early maceration, due to the higher release of anthocyanins. However, in the final stage of maceration, significant differences could also be observed. Sulfiting and PEF + SO2 treatment showed, on average, higher values of this ratio compared to the control, while PEF alone gave a significantly higher ratio at the end of maceration.
As a consequence, color indices during maceration were also significantly affected by the mash treatment. The control wines showed a steep increase in color intensity (Figure 2D) up to eight days of maceration, with a subsequent slight, not significant decrease at the end of maceration. This can be considered a typical color extraction trend, reaching a maximum in initial–medium stages of maceration. All the tested treatments determined an acceleration of color extraction kinetics, with a peak of color after only two days of maceration, followed by a second peak of intensity after eight days. In particular, color intensity was on average higher when SO2 or PEF + SO2 was applied, while hue (Figure 2E) was lower, with the lowest levels found in must submitted to PEF + SO2 treatment. The latter case probably combined extraction enhancement with oxidative protection, allowing us to obtain optimal color indices for a Primitivo wine [57].
Therefore, besides affecting extraction kinetics, the extraction profile from Primitivo grapes was also affected by the treatments under examination.

3.2. Wine Characterization

3.2.1. Oenological Parameters

Table 1 shows the oenological parameters of the wines at bottling and after six months of storage. In both cases, the oenological parameters evaluated showed some statistically significant differences among the theses considered, in some cases with oenological relevance. In particular, PEF treatment (with or without sulfiting) determined a significant decrease in ethanol content by around 1% vol. This could be an interesting result, considering current trends of decreasing ethanol in wines [58,59], and it suggests the opportunity to investigate the hypothesis that PEF treatment may enhance adsorption phenomena through cell wall materials, as documented for treatments with higher mechanical impact on tissues, such as ultrasounds [52,53]. On the other hand, an impact of PEF treatment on cell wall permeability, besides membrane permeability, has been well documented [60]. Evidence is documented for yeast cells, which show a strong coupling of membrane and cell wall permeability, affected by the application of PEF [60]. An analogous effect on vegetable cell walls can be postulated and should be investigated. Differences were also observed in pH and titratable acidity, though no oenological relevance could be observed [4,61]. In some studies conducted on different grape varieties, these oenological parameters were not influenced by the PEF treatment [4,27,56,62]. These results were in partial disagreement with those reported by Maza et al. [27], in which the pH, alcoholic content, and total acidity of wines (3 months after bottling) obtained from grapes of the Caladoc and Grenache varieties treated with PEF were not significantly different from control wines, also with the most intense PEF treatments.
Spontaneous malolactic fermentation started in wines during maceration, as can be observed from the data of malic and lactic acid. However, volatile acidity was still at acceptable levels, considering the pilot scale of winemaking. With regard to SO2, differences were observed among the wines, as expected, though the degree of difference was much lower compared to the added amounts. It should be considered that a large amount of SO2 is typically consumed during fermentation and bound to acetaldehyde. Therefore, the final levels of total SO2 were around 34 mg L−1 in sulfited wines and around 21 mg L−1 in non-sulfited wines. Correspondingly, freeSO2 was around 16 and 12 mg L−1 respectively.
The scenario after 6 months showed some relevant changes. Upon completion of malolactic fermentation, malic acid was found in traces in all wines. However, wines treated with PEF without added sulfites showed unacceptable levels of volatile acidity, indicating that PEF would have worsened the microbiological equilibrium of unprotected wines. Moreover, all wines showed a decrease in tartaric acid, related to tartaric salt precipitation. PEF-treated wines showed a more severe decrease. As the differences in ashes found among wines do not encourage us to hypothesize higher amounts of cations in PEF-treated wines, the higher precipitation rates of tartaric salts may be attributed to the higher bitartrate ion activity, as PEF-derived wines were poorer in binding counter ions such as anthocyanins [63]. Obviously, total and free SO2 decreased upon storage in all wines, but had similar differences compared to bottling.

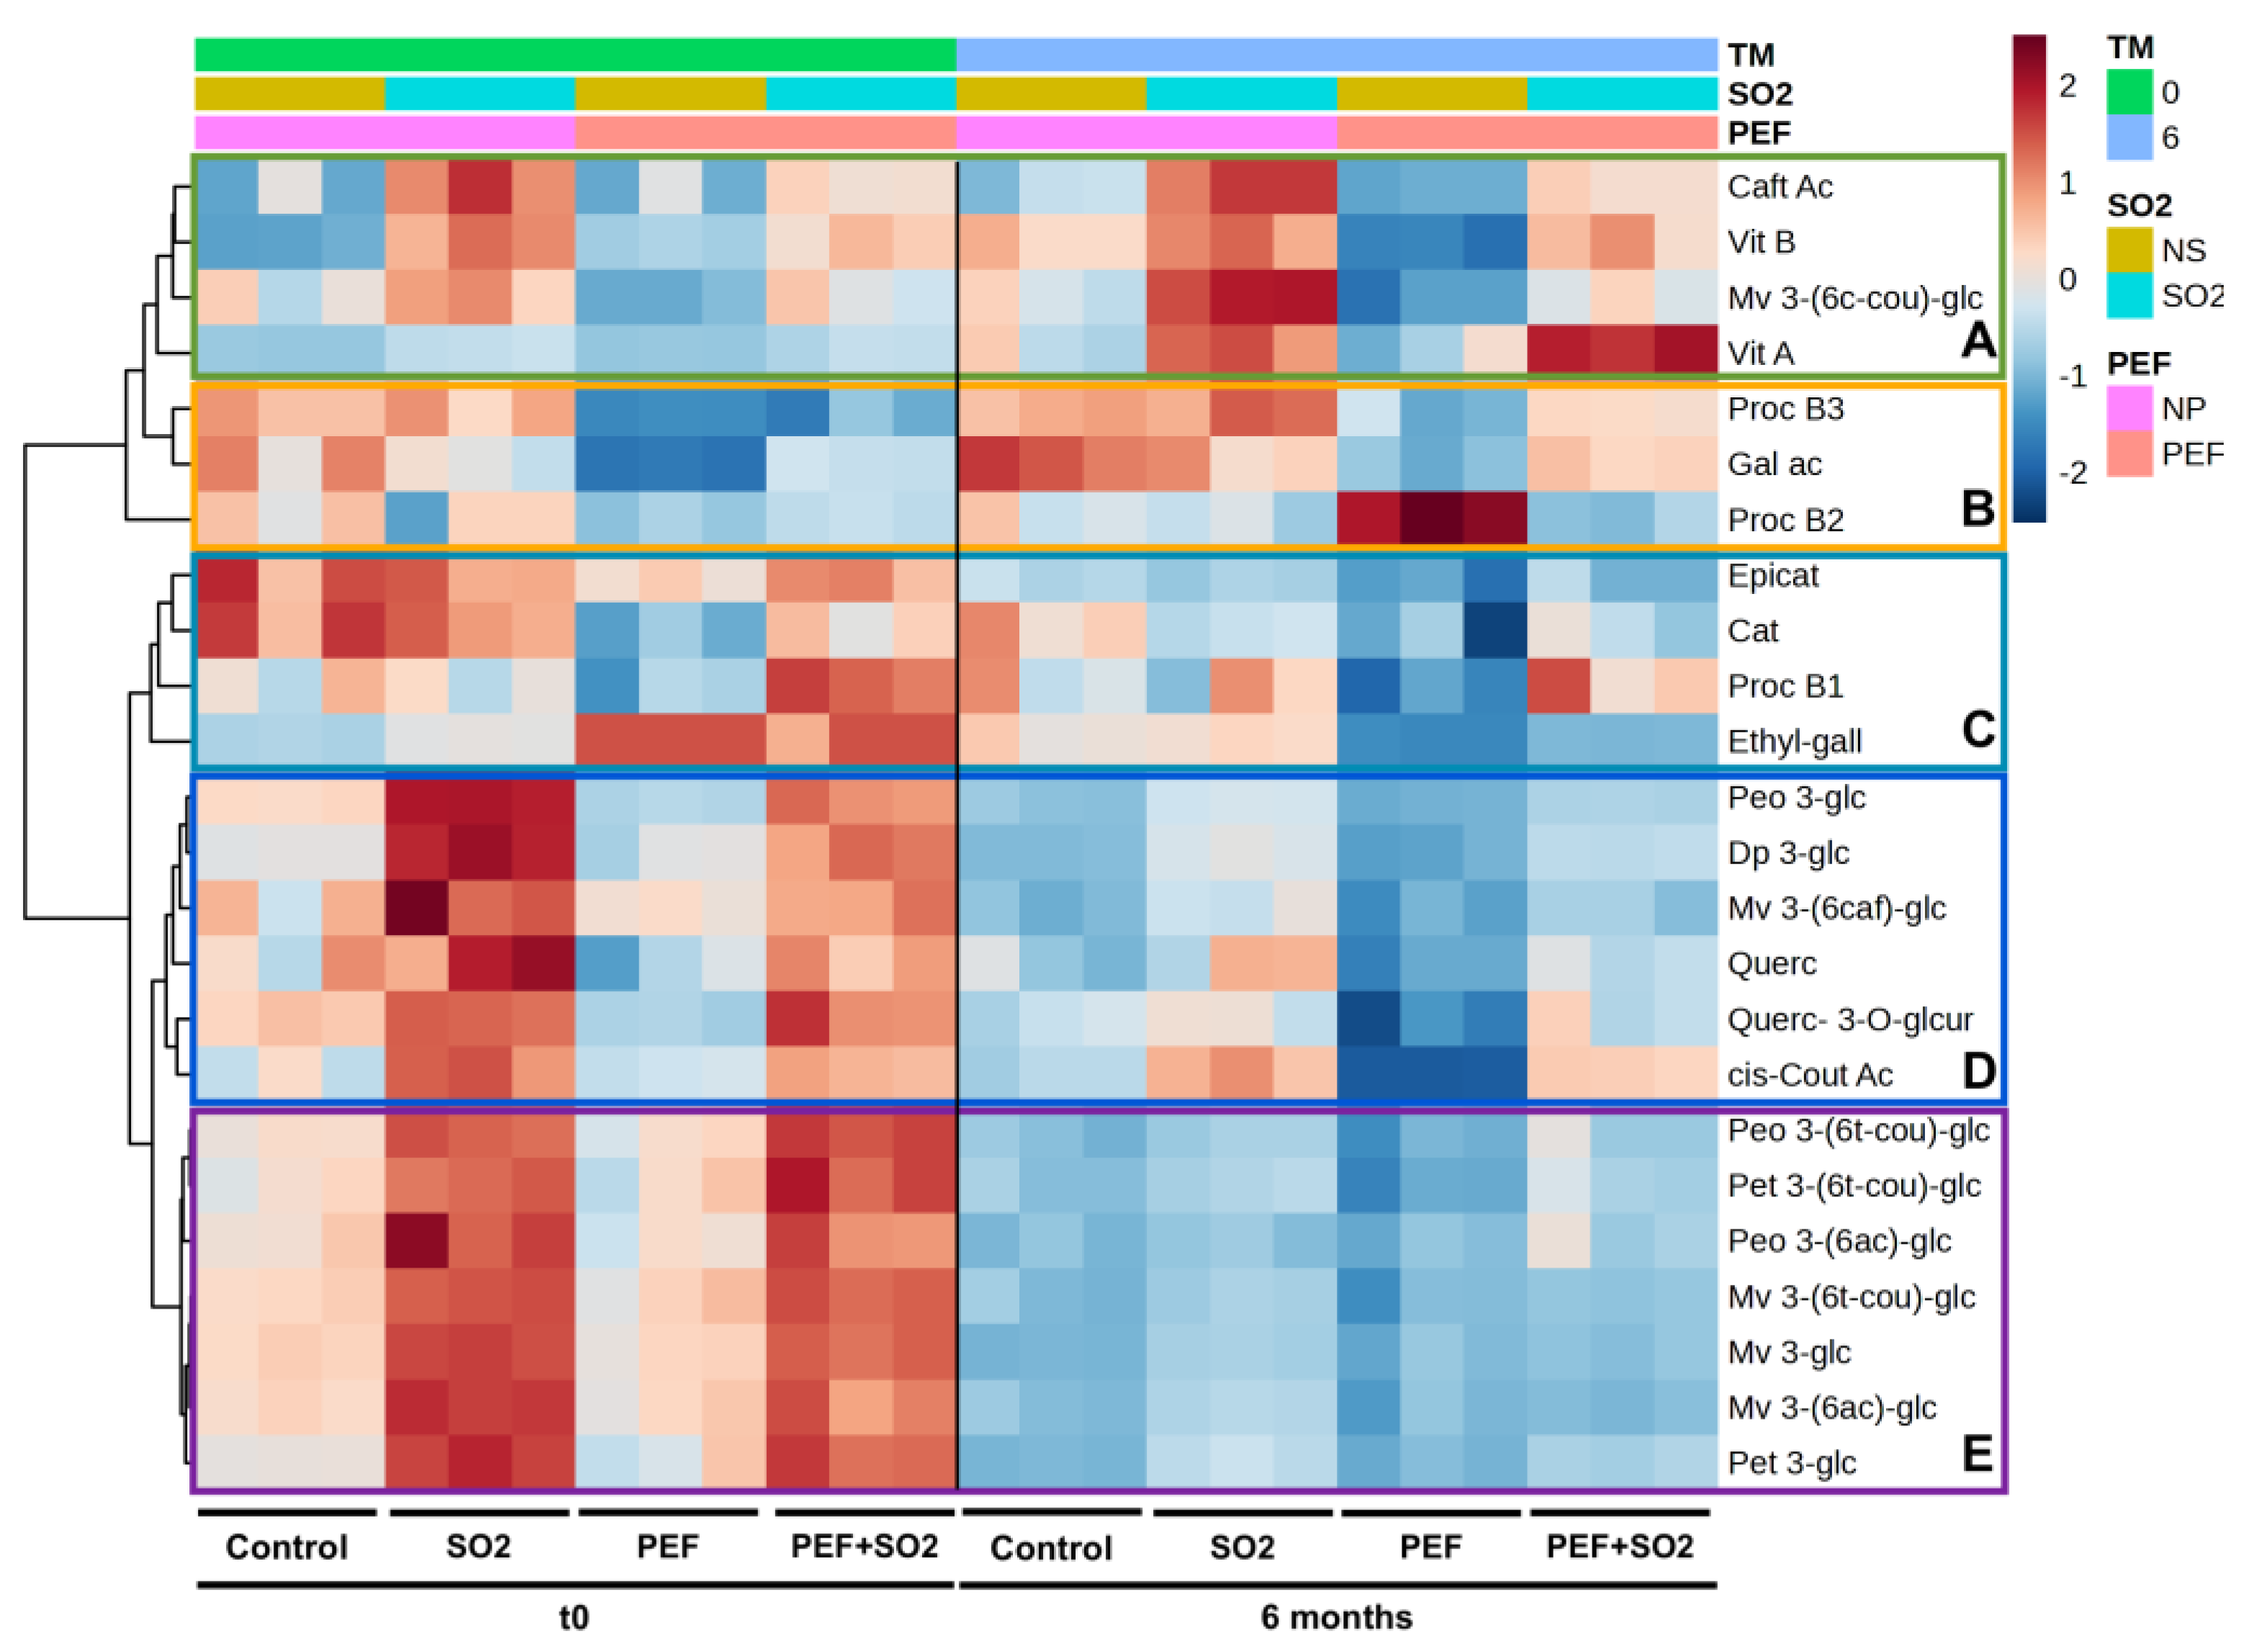
3.2.2. Phenolic Profile of Wines

Multivariate analysis was applied to the phenolic profiles of wines to better evaluate the influence of the interaction of PEF treatment with the use of SO2 [47,64]. The raw data are shown in Supplementary Table S2. Figure 3 shows the heatmap resulting from cluster analysis (Euclidean distance, Ward’s clustering algorithm) performed on the phenolic profile of individual replicates of control wine, wine treated with SO2, wine treated with only PEF, and wine treated with PEF and SO2, analyzed after bottling (t0) and 6 months after bottling. The color mapping corresponds to the relative concentration of the auto-scaled data, with the samples in the columns and the metabolites in the rows. The phenolic compounds were grouped into five main clusters, indicated with the letters A, B, C, D, and E.
Group A, including Vitisins A and B, caftaric acid, and acylated malvidin, clustered compounds were found in higher amounts in wines treated with SO2. Vitisins A and B are condensation pyrananthocyanins involving pyruvic acid and acetaldehyde, respectively [65], and are much more stable than the original anthocyanins helping to maintain the wine’s deep red color over time and reducing the risk of discoloration turning to brown or orange while maintaining garnet and purplish hues. Their presence indicates good fermentation and proper maturation [66,67]. The presence of sulfur dioxide probably prevented malolactic fermentation while maintaining a good presence of the precursors that in six months allowed for the formation of these condensation products [68]. This is also confirmed by the low levels of lactic acid in the theses with SO2 compared to those in the control theses (Table 1).
Bringing attention to clusters B and C, which group mainly flavanols (catechins and procyanidins), the increase in procyanidin B2 in the thesis using only PEF without sulfur dioxide six months after bottling is quite evident, bringing the value of this compound from 57.5 mg L−1 at time 0 to 88.5 mg L−1. This polyphenolic compound is a dimer of catechins (it consists of two molecules of (-)-epicatechin) and plays a key role in building the body and structure of wine, making it more robust. In addition, procyanidin B can interact with anthocyanins to form stable pigment complexes (this phenomenon contributes to color stability in aged red wines) and helps protect wine from oxidation, prolonging its longevity and preserving its organoleptic characteristics [69,70,71]. Procyanidin B1 is also more represented in the trials with PEF together with SO2 both in the analyses at time 0 (49.1 mg L−1) and in those carried out six months after bottling (44.9 mg L−1), while it is much less so with the use of PEF alone (35.5 mg L−1 and 25.2 mg L−1, respectively, at time 0 and after 6 months). Catechins, on the other hand, are mostly present in analyses performed at time 0 in descending order in the control (48.6 mg L−1 and 31.8 mg L−1 for catechin and epicatechin, respectively), trials with SO2 alone (46.2 mg L−1 and 29.5 mg L−1 for catechin and epicatechin, respectively), trials with PEF and SO2 together (40.7 mg L−1 and 29.0 mg L−1 for catechin and epicatechin, respectively), and trials with PEF alone (30.7 mg L−1 and 24.1 mg L−1 for catechin and epicatechin, respectively). Procyanidin B3 was more represented in the theses where there was no use of PEF (67.7 mg L−1 and 67.9 mg L−1 in control and SO2 theses, respectively, compared to 47.7 mg L−1 and 50.3 mg L−1 in PEF and PEF + SO2 theses, respectively). At zero time, however, greater presence of ethyl-gallate is shown with the use of PEF alone and with use of PEF and SO2. Therefore, wines obtained with PEF technology showed a phenolic profile characterized by lower levels of catechins.
As regards clusters D and E, which include mainly anthocyanins and flavonols, the heatmap showed a decrease after six months of maturation compared to time 0 for almost all the compounds, except for cis-coutaric acid and quercetin, which were more represented after six months in the theses with SO2 both with and without PEF. In the area of the time 0 heatmap of groups D and E, higher levels of anthocyanins and flavonols were determined through the use of sulfur dioxide, both with and without PEF. The addition of SO2 at the beginning of maceration increased, as expected, the concentration of individual anthocyanins, due to increased extractability and antioxidant protection [63], and oxidizable catechins. It is known that the addition of SO2 at crushing results in the transfer of polyphenols from the skins to the must, and their antioxidant effect changes the color structure of the final wine [72,73]. The wine obtained with the PEF treatment alone was similar to the control wine without SO2 in terms of the profile of phenolic compounds, although lower levels of flavonols (free and glycosylated quercetin), flavanols (catechin, procyanidin B1 and procyanidin B3), and peonidin 3-glucoside and delphinidin 3-glucoside were observed both at time 0 and after six months of bottling.
In addition, analyses showed low hydroxycinnamic acid levels (caftaric and cutaric acid) in trials using only PEF without sulfur dioxide, both immediately after fermentation and six months after bottling. These results are in disagreement with what has been reported in the literature where this technology has been applied to grape marc and grape skins during the early stages of winemaking to improve final wine quality or reduce maceration time [6]. In all these cases, PEF treatments resulted in a wine with a higher amount of phenolic compounds, but considering shorter maceration times (mainly in the range of 1–6 days) than those used in our study [27,33,74]. Therefore, this study highlights the need to investigate the fate of phenolic compounds when longer maceration times are adopted with PEF-treated grapes, since the increase in cell membrane and wall permeability caused by electroporation may induce a release of phenolic compounds during the first few days of maceration (see Figure 2), but subsequent phenomena occurring during prolonged maceration could lead to the loss of the advantage gained in the early phases [75,76]. The change in cell wall permeability induced by PEF in crushed grapes would contribute to also explaining the varietal response that was previously reported regarding the effect of PEF in red winemaking and that could also be hypothesized to explain the present results [26,31,77]. Primitivo, in particular, is well known for its thin skin [78,79]. Therefore, the effect derived from membrane and cell wall permeabilization induced by PEF to Primitivo grapes could have not been higher than that derived from the solubilizing activity of SO2.

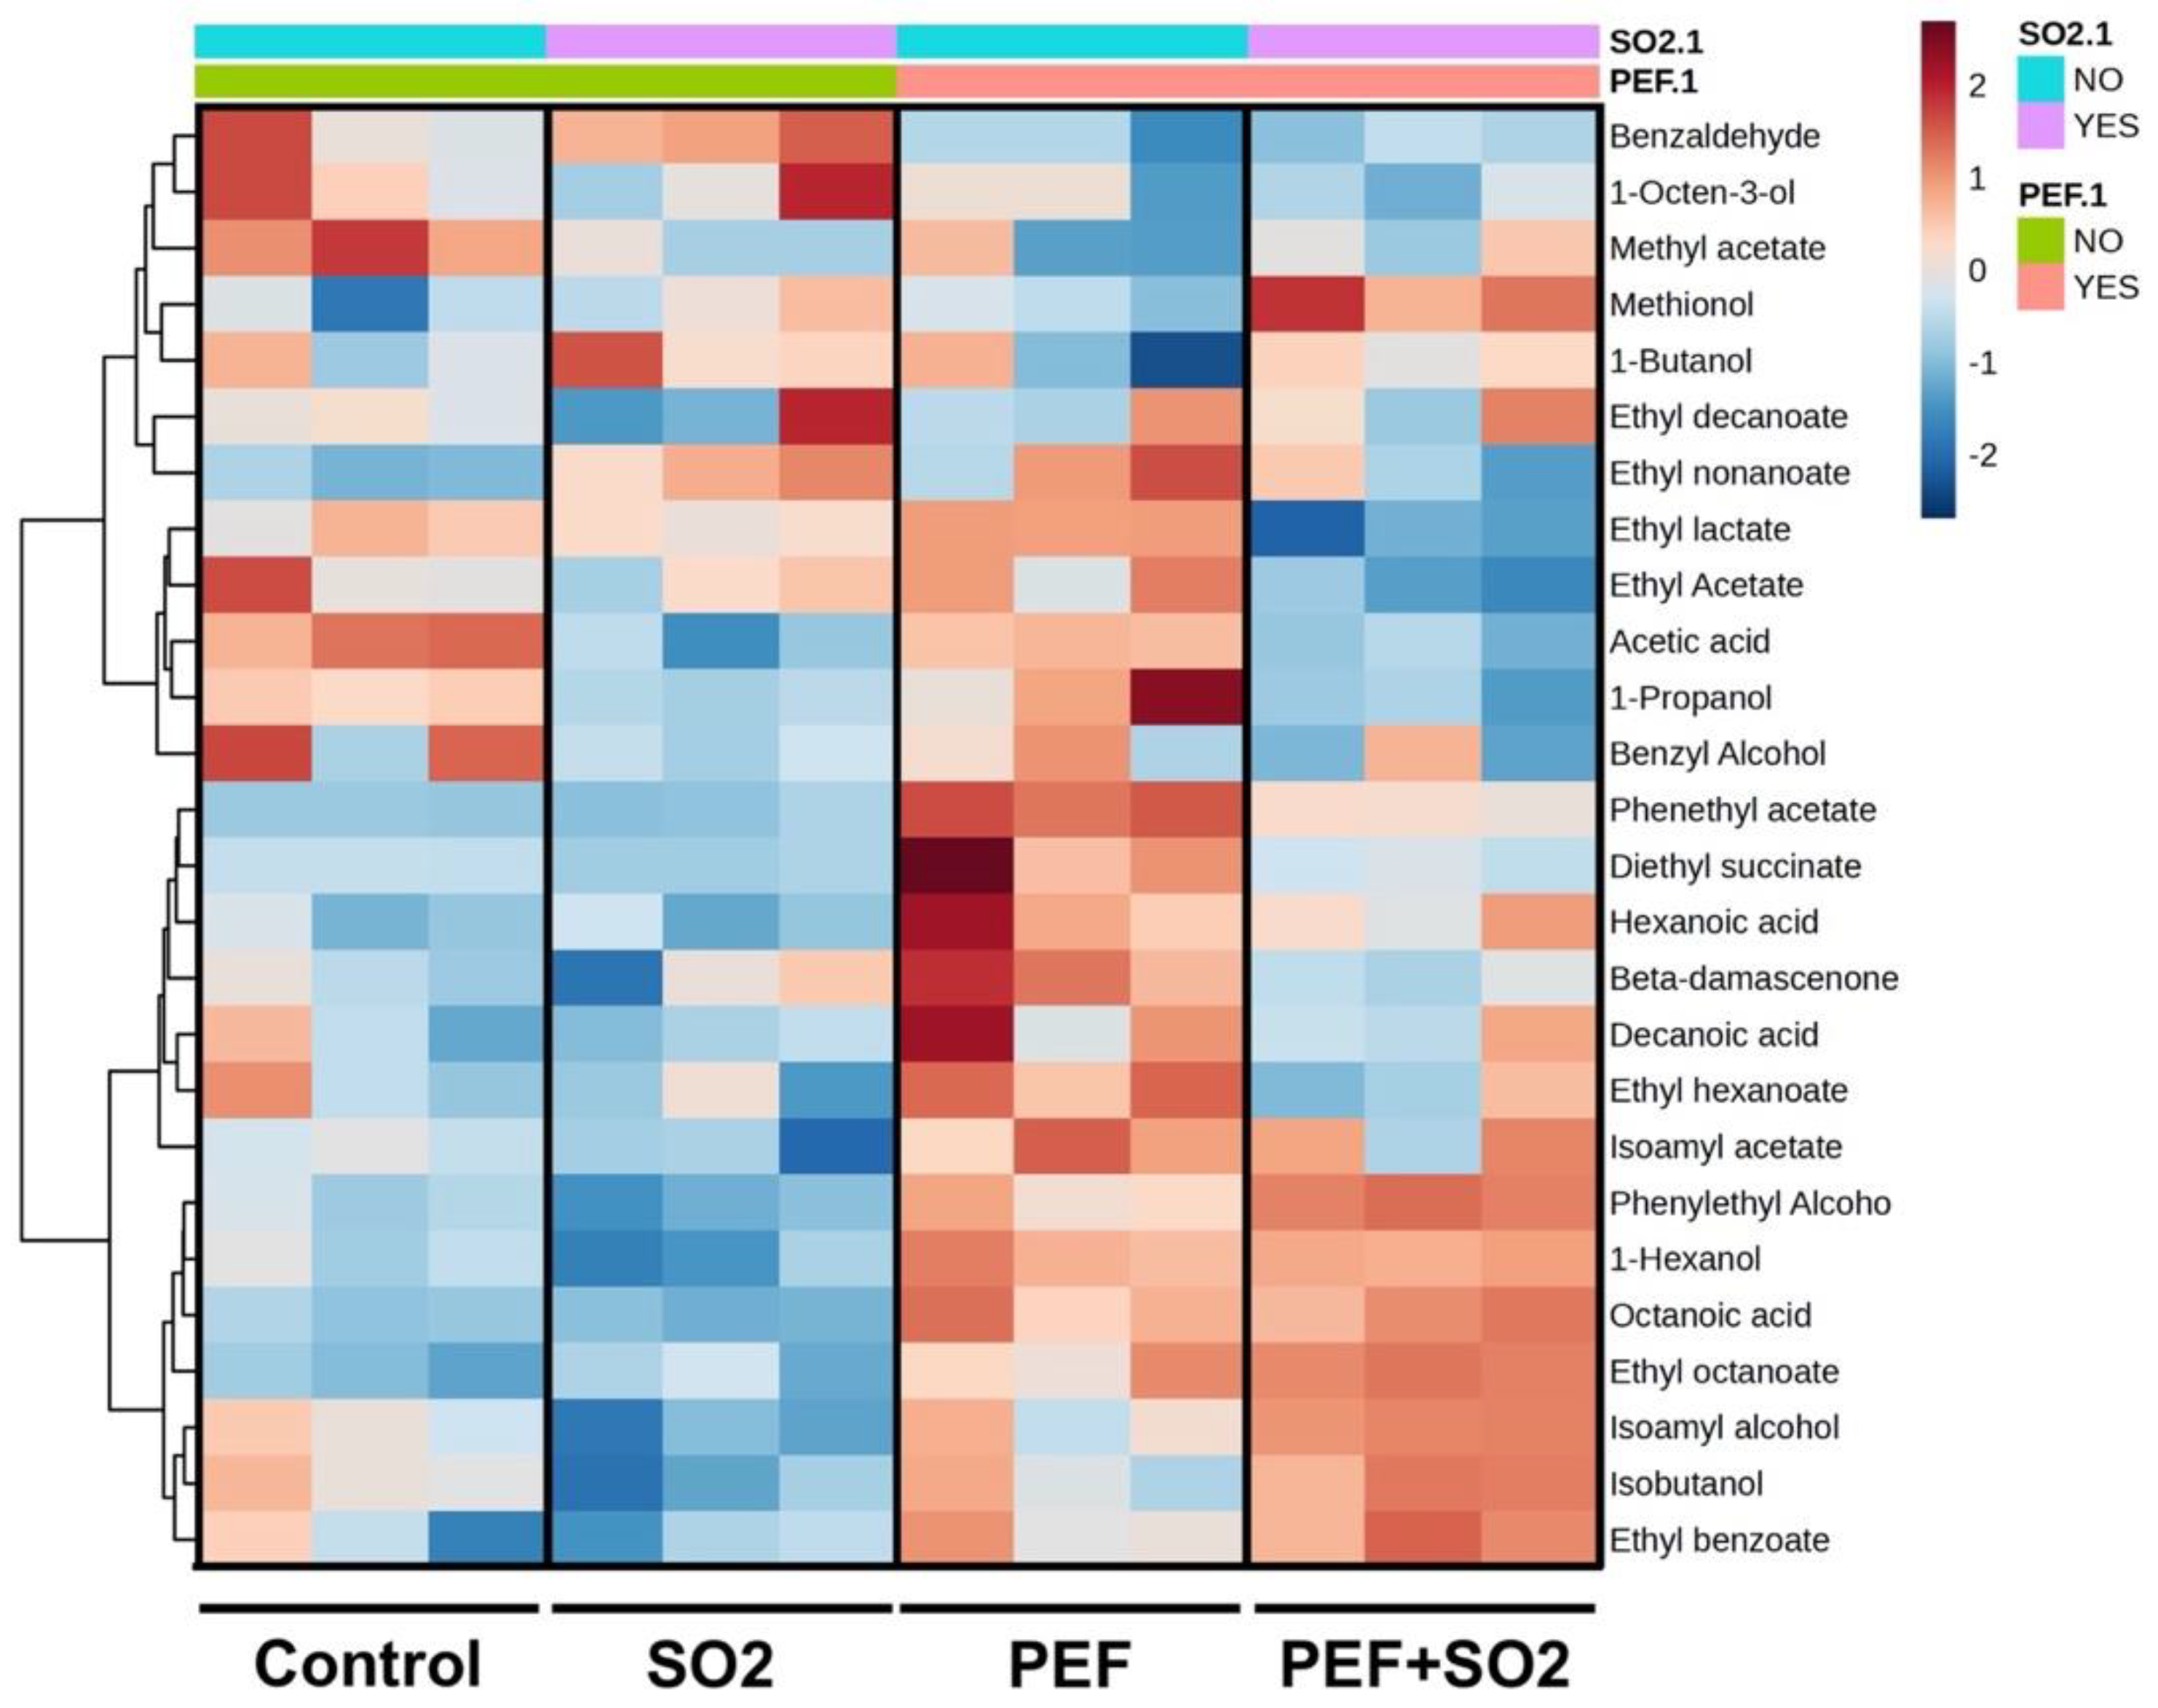
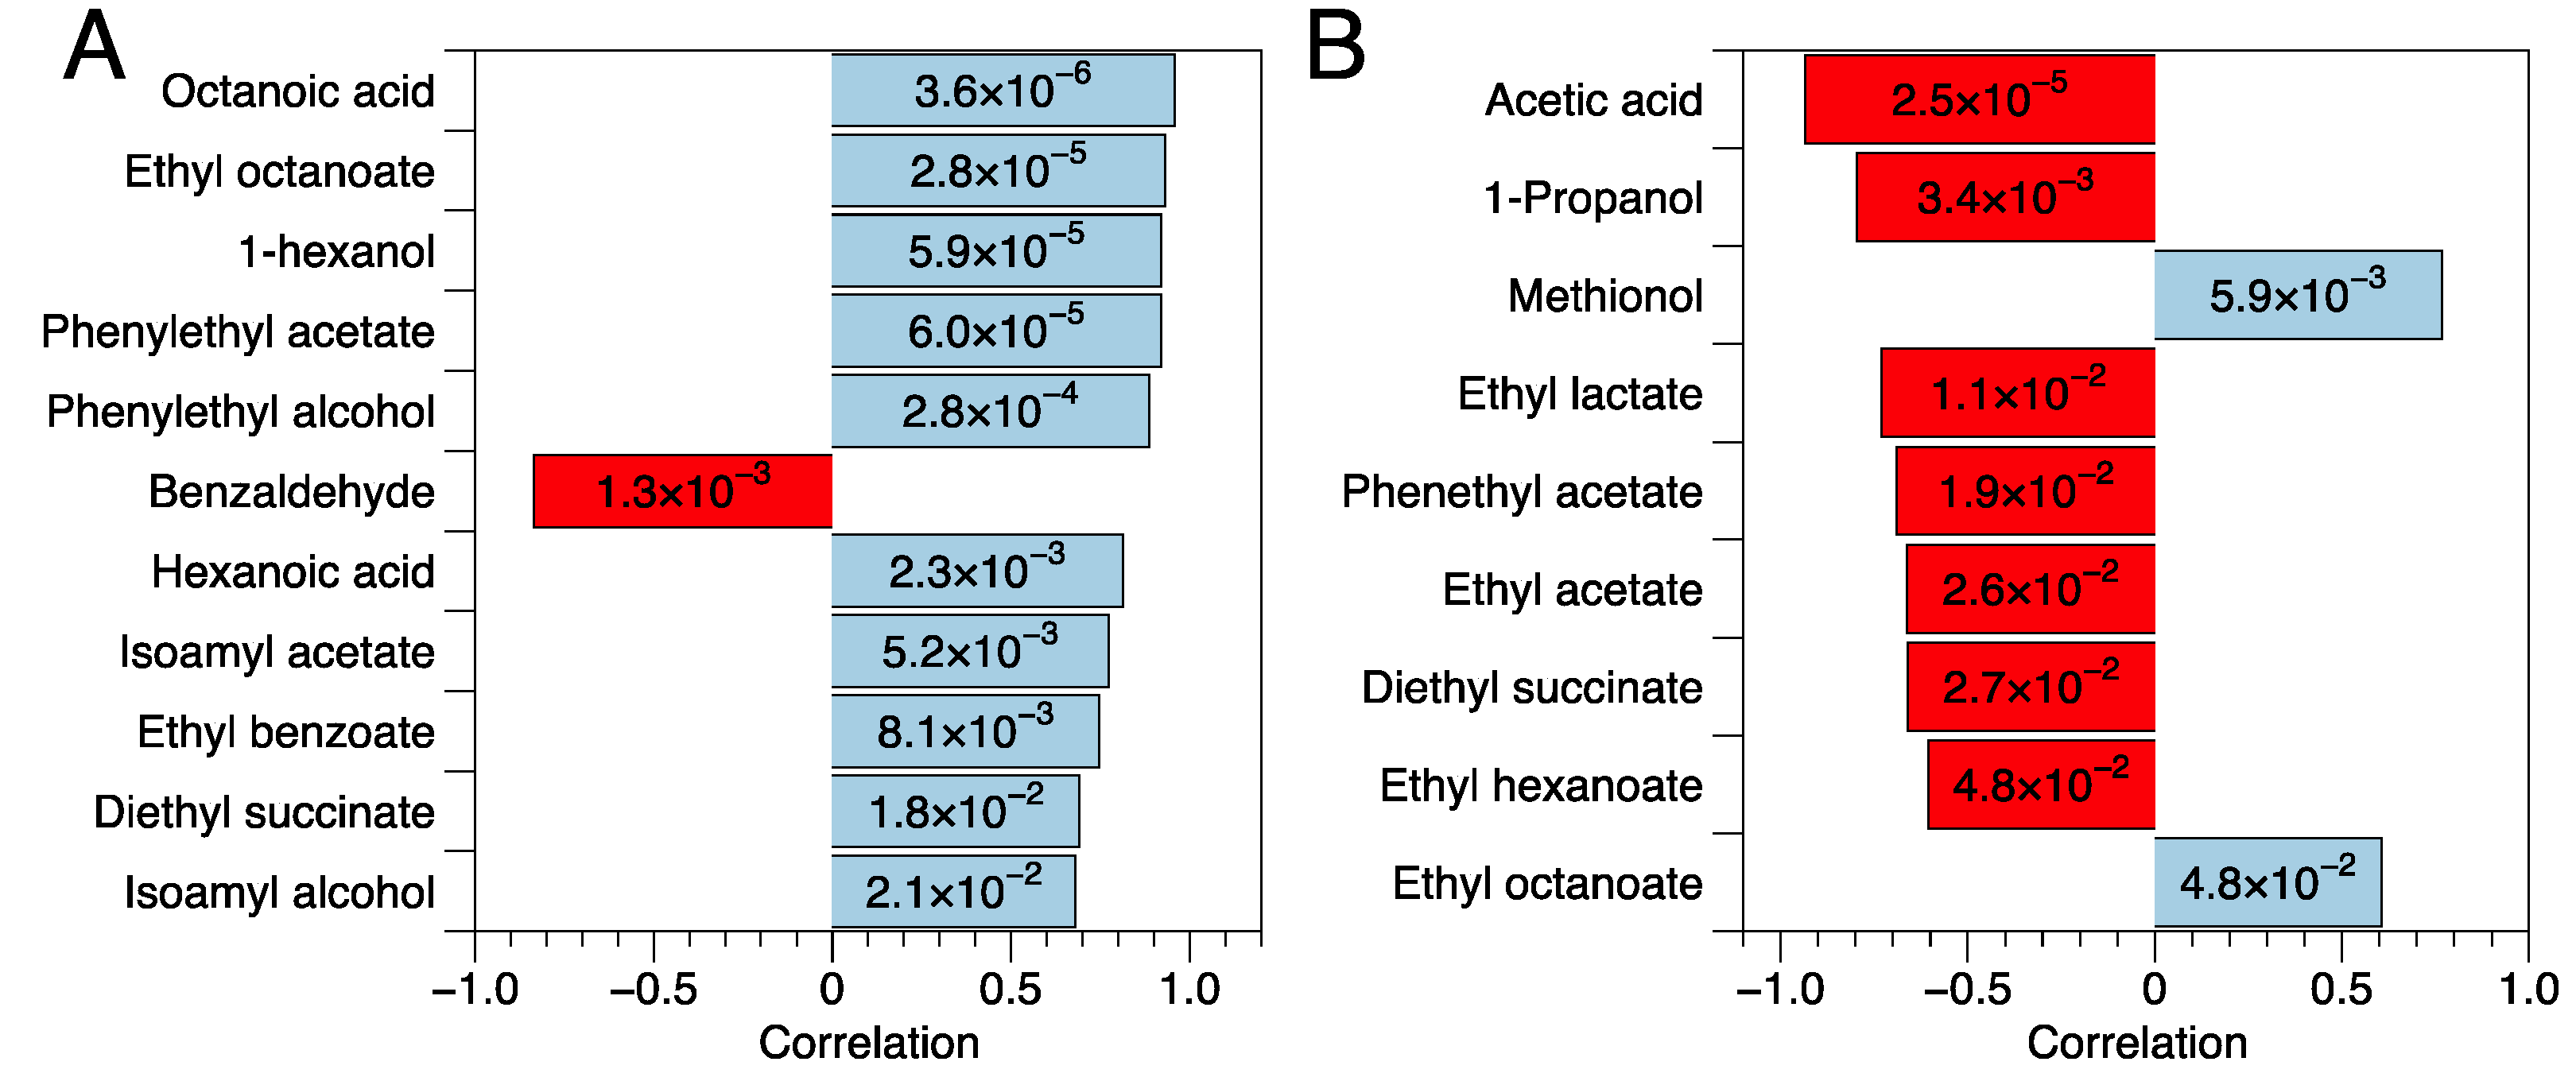
3.2.3. Volatile Profile

Figure 4 exhibits the clustering result shown as a heatmap (Euclidean distance, Ward clustering algorithm) based on the volatile profile of individual replicates (A,B,C) of control wine, wine sample with SO2 (SO2), wine treated with PEF and SO2 (PEF + SO2), and wine treated with PEF without SO2 (PEF) after 6 months. The heatmap clearly shows that after six months of storage the wine samples presented clearly different profiles, influenced by both PEF treatment and sulfitation.
The control wines showed profiles characterized by two clusters of compounds, mainly including fusel alcohols and some ethyl esters. A few compounds found in these clusters could be related to defects, of both microbiological and oxidative origin (1-octen-3-ol, acetic acid, ethyl acetate, benzaldehyde), or indicated enhanced bacterial activity (ethyl lactate). The use of SO2 did not substantially determine changes in the volatile profile of the wines, even though the low level of acetic acid could be related to the microbiological protection of sulfur dioxide. The wines from grapes that had undergone PEF treatment showed richer volatile profiles, compared to control wine and sulfited wine. PEF wines presented higher levels of the cluster of volatiles including acetic acid, ethyl acetate, and ethyl lactate, indicating a microbial complexity comparable to the control wine. On the other hand, PEF wines showed higher levels of β-damascenone (a norisoprenoid that enhances fruity notes) [80], isoamyl acetate, and ethyl esters of organic acids such as ethyl hexanoate and ethyl octanoate with fruity notes derived from yeast activity during fermentation [81], as well as 2-phenyl ethanol (a higher alcohol with notes of rose). β -damascenone, in particular, has been shown to be a molecule that amplifies the fruity notes of wines in addition to imparting its typical baked apple [80]. In addition to β-damascenone, isoamyl alcohol is also a compound that plays an important role in the olfactory profile of wine. Both amplify the fruity notes and their intensity [82]. Relevant levels of other acyl and ethyl esters such as phenyl-ethyl acetate (honey notes) and diethyl succinate could be observed. The presence of ethyl esters in PEF treatment samples may suggest that the treatment may have stimulated the esters’ production by the yeasts. Those compounds tend to diminish during aging due to hydrolysis reactions [83]: PEF-treated samples presented higher amounts than untreated ones after 6 months. Instead, the presence of 1-propanol, normally produced by yeasts due to complications in the uptake of nitrogen sources during fermentation [84], remains to be further investigated. The latter, along with acetic acid is also present in the control sample. Presumably, these may be products derived from the oxidative metabolism of indigenous yeasts and other microorganisms that sulfur dioxide is normally capable of limiting [85]. In addition, methylacetate was found at higher levels in the control samples, while control and SO2-only samples were characterized by the presence of 1-octen 3-ol, with the typical earthy mushroom odor that is usually produced by some fermenting yeasts and fungi. This compound results from the fatty acid metabolism of this microorganism that we normally find on the grape skin [86]. The PEF treatment combined with the addition of SO2 shares the presence of higher concentrations of ethyl-octanoate, 2-phenylethanol, and isoamyl acetate with the PEF-only treatment. Based on the results of this study, PEF treatment combined with reduced doses of SO2 could be evaluated in order to pursue the goal of optimized sensory properties along with sulfur dioside reduction, in accordance with the study of Lisanti et al. [85], which concluded that, currently, no single alternative matches the efficacy of SO2, which provides both antimicrobial protection and antioxidant action. This study shows that the extraction and preservation of noble compounds needs the combination of those alternative methods with the action of sulfur dioxide. The best approach could be, therefore, to reduce SO2 levels through a combined strategy with complementary methods.
Moreover, Figure 5 reports the results of point biserial partial correlation analysis of the volatile data with the PEF treatment variable (levels: wine with PEF, wine without PEF) and SO2 variable (levels: wine with SO2, wine without SO2) for the wines analyzed six months after bottling. The PEF treatment was positively correlated with some esters (i.e., ethyl octanoate, phenylethyl acetate, or isoamyl acetate), carboxylic acids (i.e., octanoic acid, hexanoic acid), higher alcohols (i.e., 1-hexanol, isoamyl alcohol, phenylethanol), and β-Damascenone. The positive correlation between the PEF treatment and most of the esters found in the wines (Figure 5) may suggest that the treatment may have stimulated the ester production of the yeasts, compounds that tend to diminish during aging due to hydrolysis reactions [83]. On the other hand, the PEF treatment was negatively correlated with benzaldehyde. Despite the functional group, a positive correlation emerged regarding some fermentation-related carbon backbones (C6–C8 straight chain, isoamyl chain, phenylethyl group): this suggests that the impact of PEF on the volatile profile may be due to an effect on yeast metabolism. A possible increase in oxidative stability should be investigated, as suggested by the negative correlation of PEF treatment with benzaldehyde.
Differently, the use of SO2 was positively correlated with methionol (related to the reductive environment) and ethyl octanoate. On the contrary, SO2 was negatively correlated with volatile related to bacterial activity (acetic acid, ethyl acetate, ethyl lactate), 1-propanol, and a few esters (i.e., phenyethyl acetate, diethyl succinate, ethyl hexanoate). The effect of SO2 on the synthesis of esters, mainly medium-chain fatty acid (MCFA) esters, has been reported previously [87,88,89,90], though the outcomes are not univocal, and both increases and decreases in MCFA esters have been observed. The hypothesized mechanisms underlying this effect are related to oxygen availability and fatty acid metabolism.

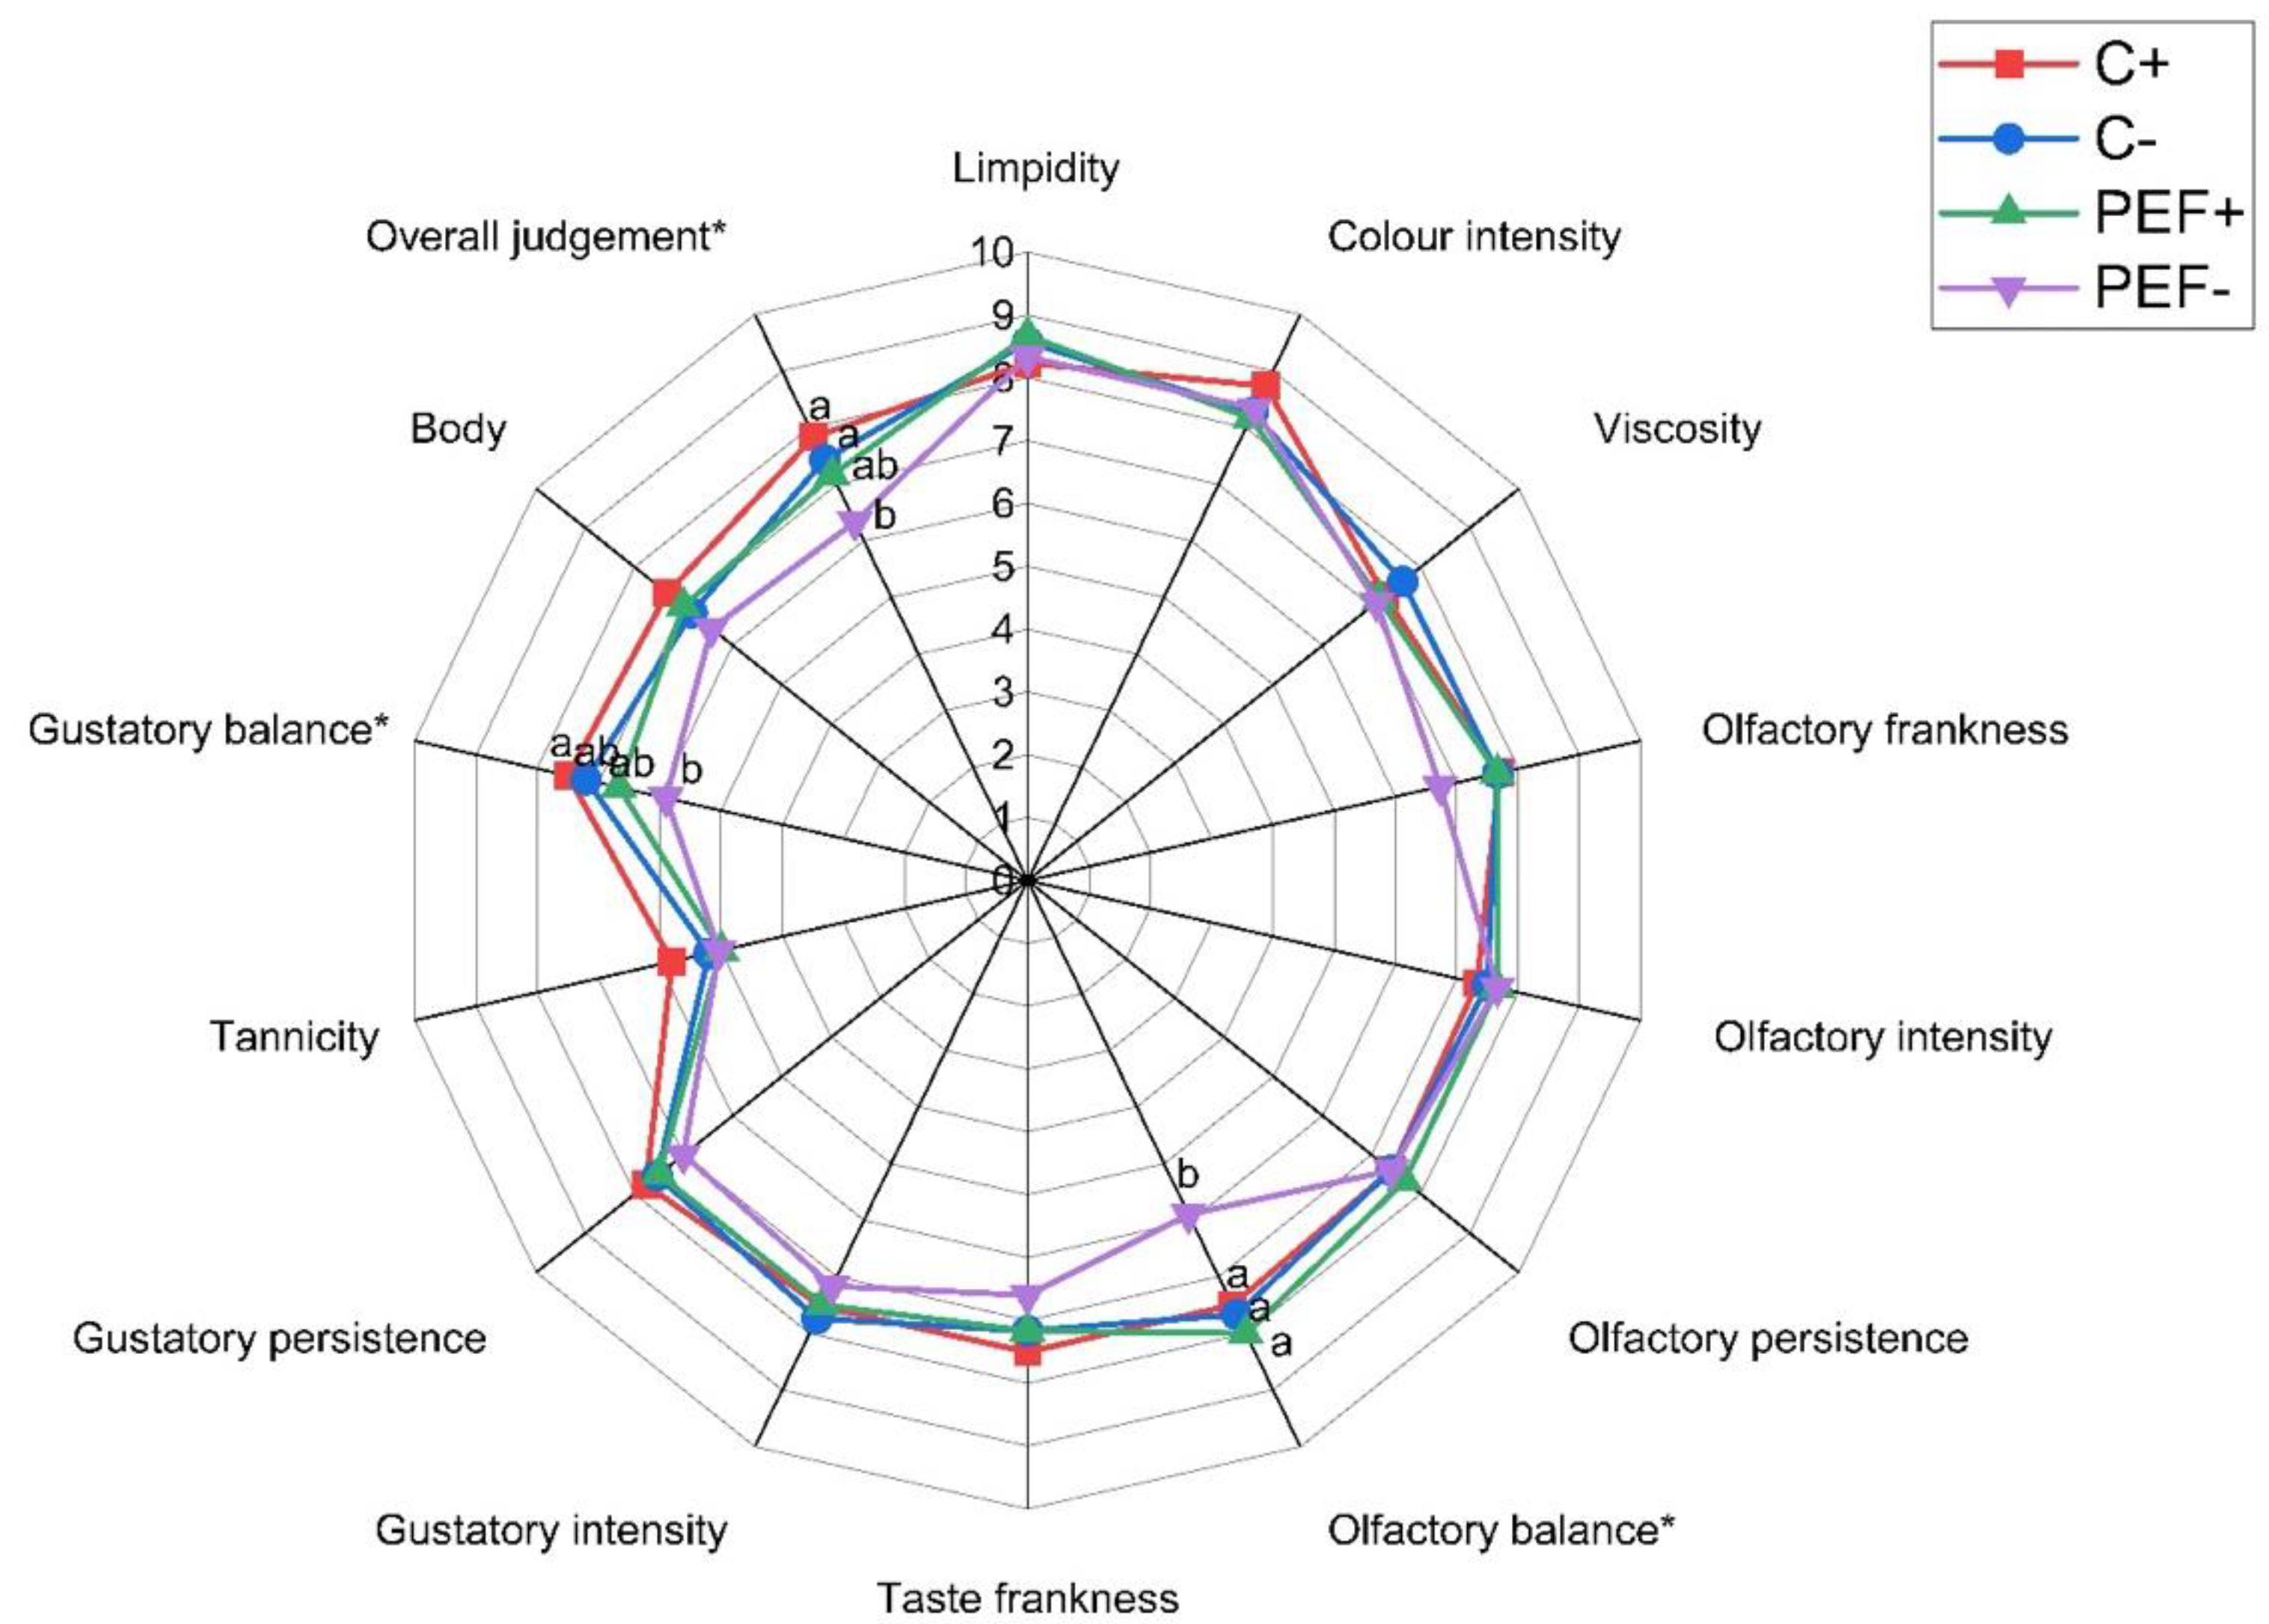
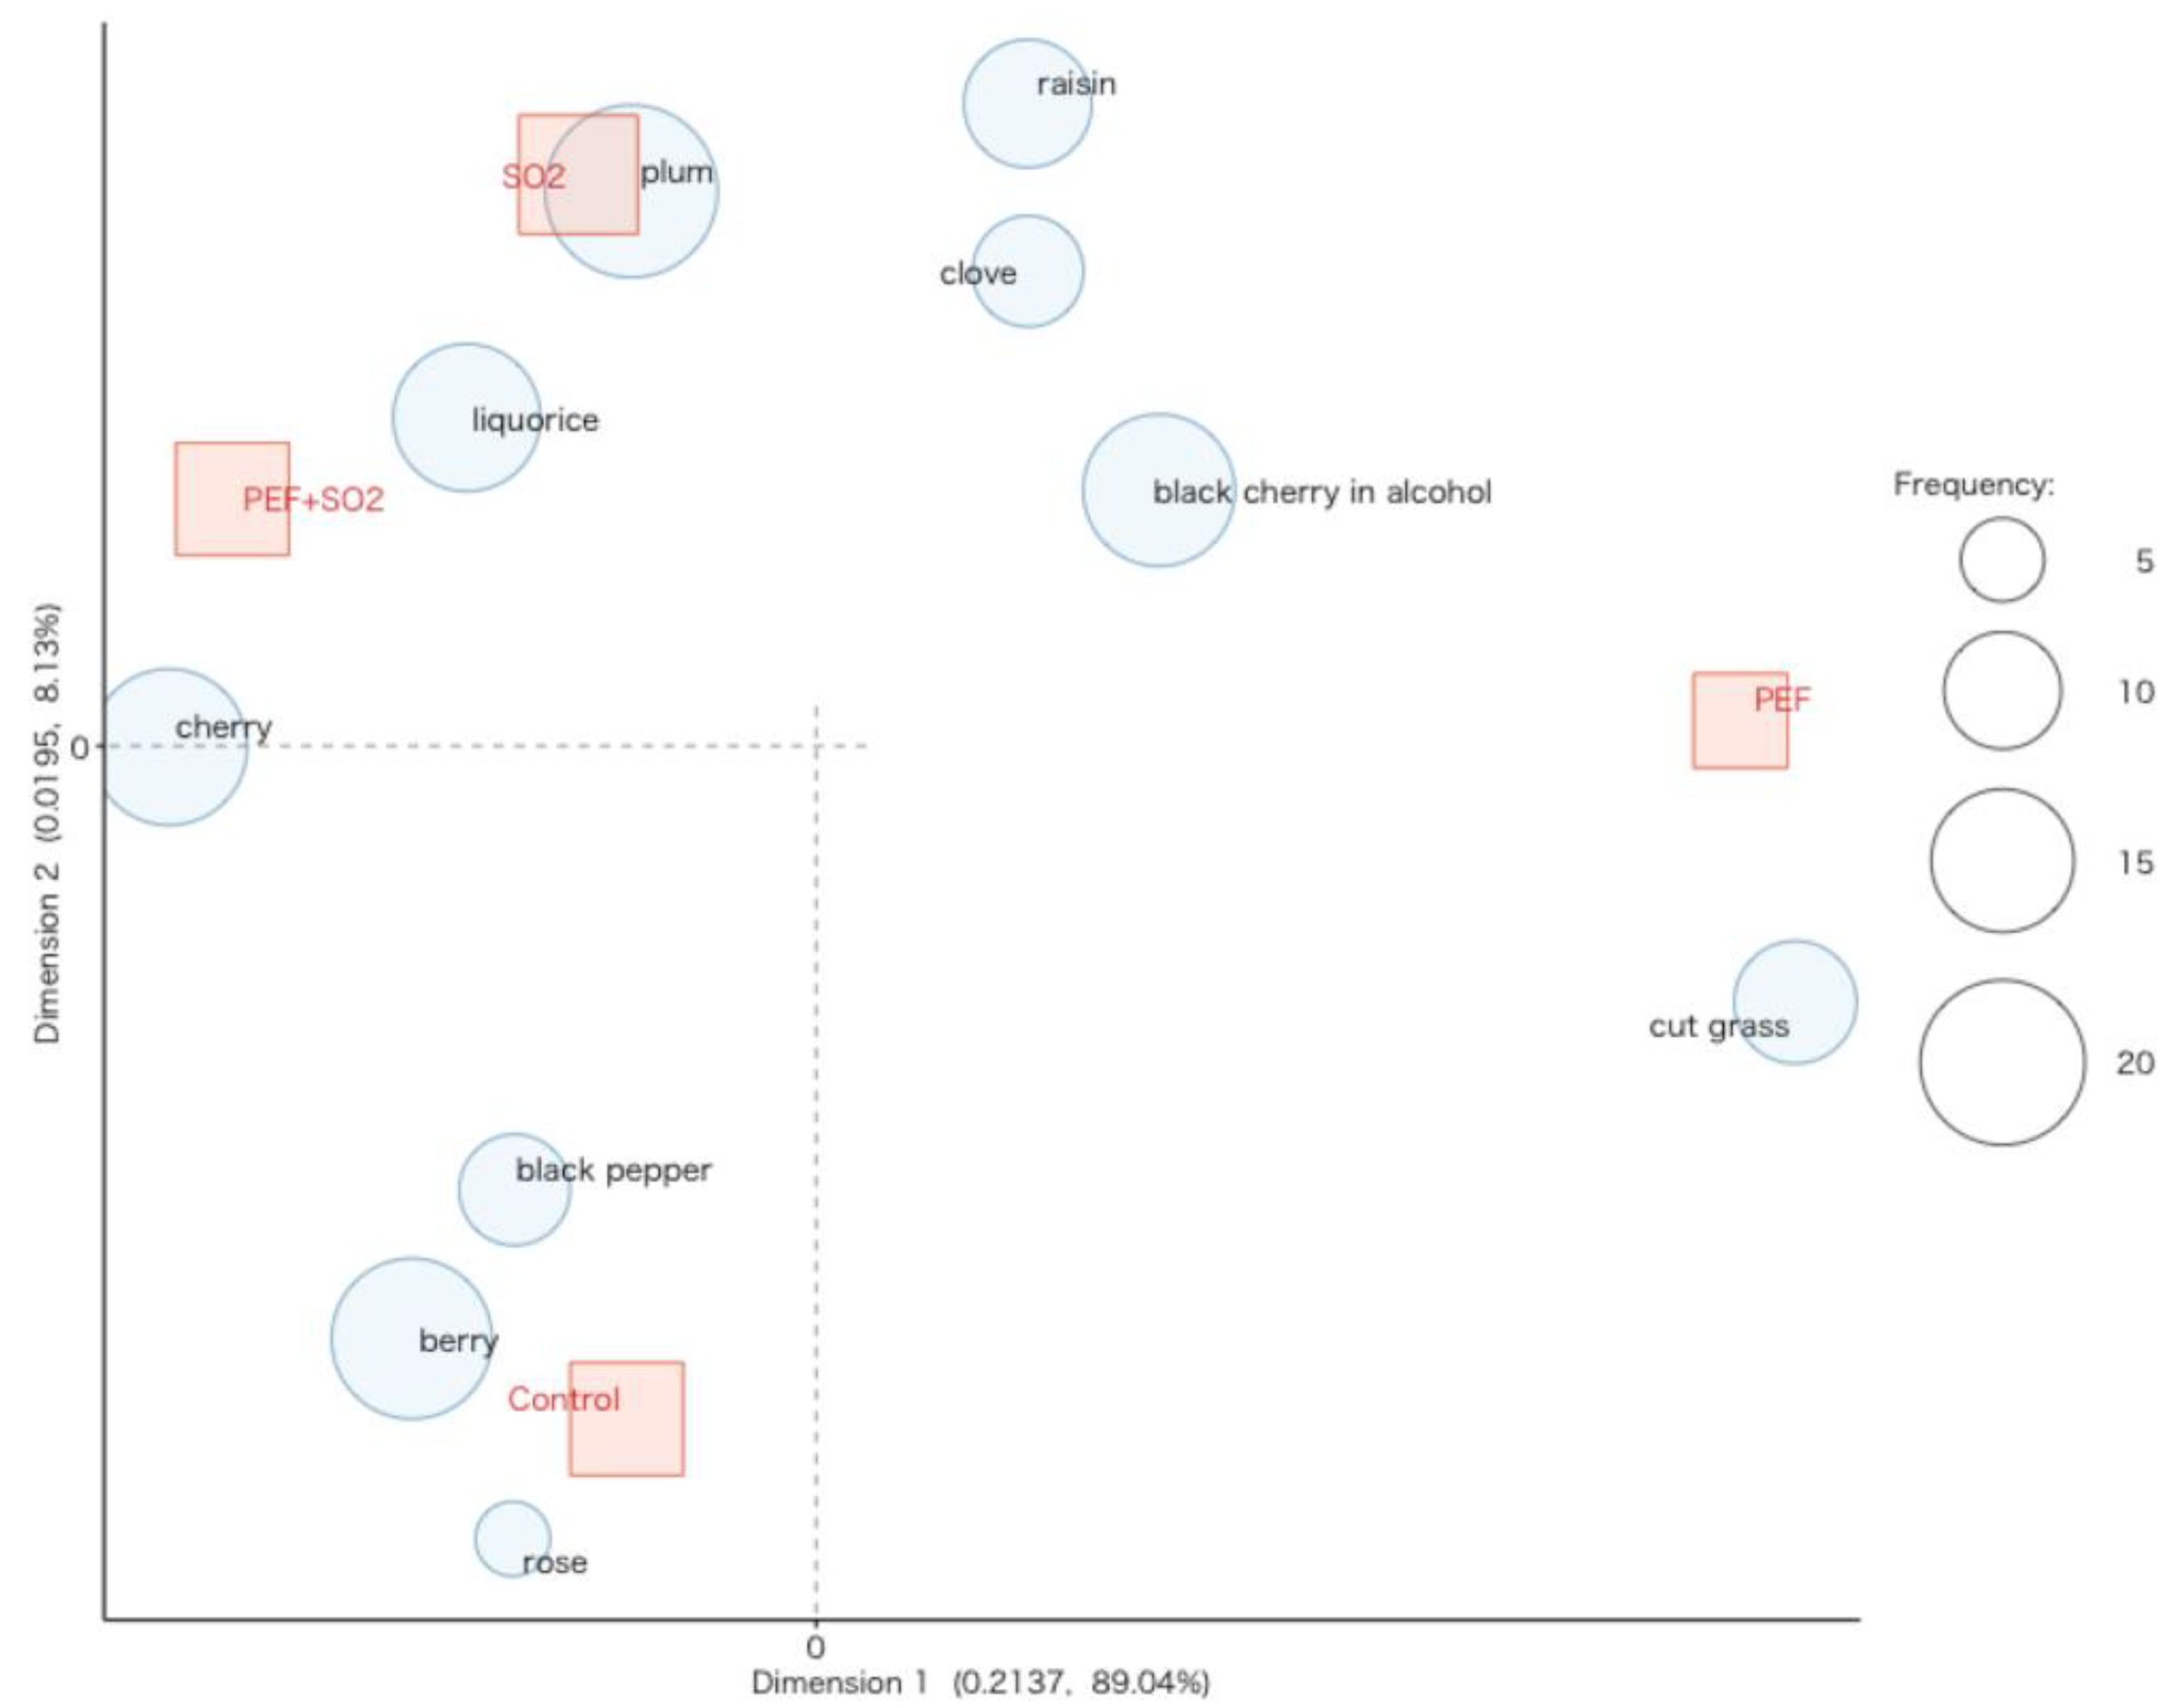
3.2.4. Sensory Analysis

The results of the sensory analysis of the quality parameters of wines after six months of storage are reported in Figure 6. The analysis of variance showed that no significant differences were found between the samples for most of the parameters considered, and the sensorial quality of the wines was almost comparable. Differences in color intensity were not perceived by the judges. However, the analysis of variance demonstrated statistically significant differences for three of the descriptors considered: olfactory and gustatory balance and overall judgment. The PEF-treated wine received the lowest score from the judges, while the other wines were comparable.
Figure 7 shows the results of the correspondence analysis applied to the citation frequencies of the aroma descriptors that the judges identified in each wine by smell during CATA analysis. The table of frequencies is reported as Table S3 in the Supplementary Materials. The largest part of variability, along dimension 1, was due to PEF wine, distinguished from the other wines by herbaceous notes described as cut grass. This may be the reason for the lower quality attributed to this wine by the panelists. Control wine is positioned in the lower-left quadrant, characterized by rose, berry, and black pepper descriptors. The upper-left quadrant includes wines with added SO2, whose characterizing descriptors referred to fresh fruit descriptors (cherry), processed fruit (black cherry in alcohol, plum, raisins), clove, and licorice. Interestingly, the combined use of PEF and SO2 was effective in keeping fresh fruit scents with respect to dried fruit scents (plum, raisins), which could not always be appreciated by consumers, being also associated with premature oxidation defects [91].

4. Conclusions

This study shows how the application of pulsed electric fields (PEFs) to Primitivo crushed grapes determined effects that go beyond the expected increase in extracted phenolic compounds and can interact with the use of SO2. Unexpected outcomes, in fact, were observed during two-week maceration. The results suggest that PEF treatment, promoting the electroporation of grape skin cells by increasing the permeability of cell membranes, accelerated the extraction of anthocyanins and polyphenols during the first few days of maceration, although we thereafter observed a loss in the early gain in extracted phenolic compounds, whose fate should be investigated to assess either reabsorption or degradation. The behavior observed in this study might be partially attributed to variety-dependent variables, as grape cultivars differ in skin thickness, cell wall composition, and phenolic profiles, all of which can influence the response to electroporation. It is worth noting that these observations were made on Primitivo grapes, and further investigations on different varieties could reveal different dynamics of extraction, stabilization, and reabsorption processes. However, the length of the maceration step could be a critical variable requiring optimization. The addition of SO2 compensates for these limitations by stabilizing the phenolic compounds and preventing their oxidation, thus ensuring greater overall process efficiency.
Further, treatment with PEF (both with and without SO2) resulted in a decrease in ethanol content of about 1% vol, a significant result in line with the wine consumer’s trend toward lower alcohol content wines. This may also be the result of ethyl alcohol reabsorption by the skins during maceration, along with the other compounds. After six months in bottles, wines obtained using the treatment with PEF and without SO2 showed high levels of volatile acidity, indicating microbiological problems in the absence of sulphites. The phenolic profile of the samples shows that wines treated only with PEF show lower levels of hydroxycinnamic acids and flavonols, but a significant increase in procyanidin B2, which are important for structure and color stability. Control wines show a stable phenolic profile, with flavanols well represented. The use of SO2 improved anthocyanin stabilization. The PEF + SO2 combination provides a balance between the extraction and stabilization of phenolic compounds. The volatile profile of the samples tested showed that PEF-treated wines had a richer flavor profile, with higher concentrations of fruity esters and higher alcohols. The wines from the PEF + SO2 combination, on the other hand, maintain greater aromatic freshness, limiting the formation of oxidative compounds. Wines made using SO2 alone or PEF + SO2 have a more balanced profile, with cherry, plum, and licorice aromas, although the combined PEF + SO2 treatment better preserves fresh fruit aromas, reducing the perception of dried fruits and herbaceous notes.

Supplementary Materials

The following Supporting Information can be downloaded at https://www.mdpi.com/article/10.3390/foods14101792/s1: Table S1: Results of two-way ANOVA and post hoc Tukey’s test for multiple comparisons related to the parameters reported in Figure 2; Table S2: Raw data of the analysis of phenolic compounds; Table S3: Frequency of descriptors reported by the panelists.

Author Contributions

Conceptualization, V.M.P. and G.S.; methodology, L.M., L.T. and V.M.P.; formal analysis, M.N., F.Z.M. and G.R.C.; investigation, M.N., G.R.C., G.C., R.A.M., F.M., G.F. and C.M.L.; resources, L.T., L.M. and V.M.P.; data curation, M.N., G.S., M.T. and R.A.M.; writing—original draft preparation, M.N., G.F. and G.C.; writing—review and editing, G.R.C., L.M., F.Z.M., M.T., V.M.P. and G.S.; visualization, M.N.; supervision, L.M., L.T., G.S. and V.M.P.; funding acquisition, V.M.P. All authors have read and agreed to the published version of the manuscript.

Funding

This study was carried out within the CeLeBre—Cell Level Breakthrough project, funded under the call PRIN PNRR 2022 by the European Union—Next Generation EU, Mission 4 Component 1, Project code P20225LMLW, CUP F53D2301219 000. This study was also carried out at the Agritech National Research Center and received funding from the European Union Next-Generation EU (PIANO NAZIONALE DI RIPRESA E RESILIENZA (PNRR)—MISSIONE 4 COMPONENTE 2, INVESTIMENTO 1.4—D.D. 1032 June 17, 2022, CN00000022). This manuscript reflects only the authors’ views and opinions, and neither the European Union nor the European Commission can be held responsible for them.

Institutional Review Board Statement

The manuscript reports on a sensory analysis carried out with the participation of winemakers and professionals, as trained panelists, matching requisites for sensory tests as described in (ISO) 8589:2007. Considering the current regulations for ethics in food science research, we collected informed consent, while assuring data protection and privacy maintenance. These data do not involve any novel food, or health claims, and no human experimentation was developed. For these reasons, as stated in the Ethics Review and Food-Related Research released by the European Commission (Alfonso Alfonsi; David Coles; Christine Hasle; Juraj Koppel; Miltos Ladikas; Joseph Schmucker von Koch; Doris Schroeder; Dominique Sprumont; Wim Verbeke; David Zaruk Guidande Note: Ethics and Food-Related Research; European Commission Ethics Review Sector: Brussels, Belgium, 2012), also in line with the Code of Ethics of the World Medical Association (Declaration of Helsinki) for experiments involving humans, we did not send our scientific project to an ethics committee for evaluation.

Informed Consent Statement

Informed consent was obtained from all subjects involved in the study.

Data Availability Statement

The original data presented in the study are openly available from FigShare at DOI: https://doi.org/10.6084/m9.figshare.28765742.v1.

Conflicts of Interest

Author Claudio Lamacchia was employed by the company IAMAtek s.r.l. and participated in the investigation process of this research by contributing to the setup of the PEF equipment and its operativity and critically discussing the operational parameters and conditions. Author Massimo Tripaldi was employed by the company Centro Servizi Enologici s.a.s. and participated in the investigation process of this research by contributing to the analysis of experimental data and their critical evaluation from an enological standpoint. However, we promise that this will not affect the authenticity and objectivity of the research results and data. The remaining authors declare that the research was conducted in the absence of any commercial or financial relationships that could be construed as a potential conflict of interest.

References

  1. Krüger, R.T.; Alberti, A.; Nogueira, A. Current Technologies to Accelerate the Aging Process of Alcoholic Beverages: A Review. Beverages 2022, 8, 65. [Google Scholar] [CrossRef]
  2. Luchian, C.E.; Scutarașu, E.C.; Colibaba, L.C.; Motrescu, I.; Cotea, V.V. Non-Thermal and Thermal Physical Procedures—Optimistic Solutions in the Winemaking Industry. Appl. Sci. 2024, 14, 7537. [Google Scholar] [CrossRef]
  3. Ma, T.; Wang, J.; Wang, H.; Zhao, Q.; Zhang, F.; Ge, Q.; Li, C.; Gamboa, G.G.; Fang, Y.; Sun, X. Wine Aging and Artificial Simulated Wine Aging: Technologies, Applications, Challenges, and Perspectives. Food Res. Int. 2022, 153, 110953. [Google Scholar] [CrossRef]
  4. Maza, M.A.; Martínez, J.M.; Hernández-Orte, P.; Cebrián, G.; Sánchez-Gimeno, A.C.; Álvarez, I.; Raso, J. Influence of Pulsed Electric Fields on Aroma and Polyphenolic Compounds of Garnacha Wine. Food Bioprod. Process. 2019, 116, 249–257. [Google Scholar] [CrossRef]
  5. Noviello, M.; Paradiso, V.M.; Natrella, G.; Gambacorta, G.; Faccia, M.; Caponio, F. Application of Toasted Vine-Shoot Chips and Ultrasound Treatment in the Ageing of Primitivo Wine. Ultrason. Sonochemistry 2024, 104, 106826. [Google Scholar] [CrossRef]
  6. Silva, F.V.M.; Van Wyk, S. Emerging Non-Thermal Technologies as Alternative to SO2 for the Production of Wine. Foods 2021, 10, 2175. [Google Scholar] [CrossRef]
  7. Arshad, R.N.; Abdul-Malek, Z.; Roobab, U.; Qureshi, M.I.; Khan, N.; Ahmad, M.H.; Liu, Z.; Aadil, R.M. Effective Valorization of Food Wastes and By-products through Pulsed Electric Field: A Systematic Review. J. Food Process Eng. 2021, 44, e13629. [Google Scholar] [CrossRef]
  8. Arshad, R.N.; Abdul-Malek, Z.; Roobab, U.; Munir, M.A.; Naderipour, A.; Qureshi, M.I.; El-Din Bekhit, A.; Liu, Z.-W.; Aadil, R.M. Pulsed Electric Field: A Potential Alternative towards a Sustainable Food Processing. Trends Food Sci. Technol. 2021, 111, 43–54. [Google Scholar] [CrossRef]
  9. Arshad, R.N.; Abdul-Malek, Z.; Munir, A.; Buntat, Z.; Ahmad, M.H.; Jusoh, Y.M.M.; Bekhit, A.E.-D.; Roobab, U.; Manzoor, M.F.; Aadil, R.M. Electrical Systems for Pulsed Electric Field Applications in the Food Industry: An Engineering Perspective. Trends Food Sci. Technol. 2020, 104, 1–13. [Google Scholar] [CrossRef]
  10. Brito, I.P.C.; Silva, E.K. Pulsed Electric Field Technology in Vegetable and Fruit Juice Processing: A Review. Food Res. Int. 2024, 184, 114207. [Google Scholar] [CrossRef]
  11. Naliyadhara, N.; Kumar, A.; Girisa, S.; Daimary, U.D.; Hegde, M.; Kunnumakkara, A.B. Pulsed Electric Field (PEF): Avant-Garde Extraction Escalation Technology in Food Industry. Trends Food Sci. Technol. 2022, 122, 238–255. [Google Scholar] [CrossRef]
  12. Roobab, U.; Inam-Ur-Raheem, M.; Khan, A.W.; Arshad, R.N.; Zeng, X.; Aadil, R.M. Innovations in High-Pressure Technologies for the Development of Clean Label Dairy Products: A Review. Food Rev. Int. 2023, 39, 970–991. [Google Scholar] [CrossRef]
  13. Cholet, C.; Delsart, C.; Petrel, M.; Gontier, E.; Grimi, N.; L’Hyvernay, A.; Ghidossi, R.; Vorobiev, E.; Mietton-Peuchot, M.; Gény, L. Structural and Biochemical Changes Induced by Pulsed Electric Field Treatments on Cabernet Sauvignon Grape Berry Skins: Impact on Cell Wall Total Tannins and Polysaccharides. J. Agric. Food Chem. 2014, 62, 2925–2934. [Google Scholar] [CrossRef]
  14. Martínez, J.M.; Cebrián, G.; Álvarez, I.; Raso, J. Release of Mannoproteins during Saccharomyces Cerevisiae Autolysis Induced by Pulsed Electric Field. Front. Microbiol. 2016, 7, 1435. [Google Scholar] [CrossRef]
  15. Martínez, J.M.; Delso, C.; Maza, M.A.; Álvarez, I.; Raso, J. Pulsed Electric Fields Accelerate Release of Mannoproteins from Saccharomyces Cerevisiae during Aging on the Lees of Chardonnay Wine. Food Res. Int. 2019, 116, 795–801. [Google Scholar] [CrossRef]
  16. Maza, M.A.; Delso, C.; Álvarez, I.; Raso, J.; Martínez, J.M. Effect of Pulsed Electric Fields on Mannoproteins Release from Saccharomyces Cerevisiae during the Aging on Lees of Caladoc Red Wine. LWT 2020, 118, 108788. [Google Scholar] [CrossRef]
  17. González-Arenzana, L.; López-Alfaro, I.; Garde-Cerdán, T.; Portu, J.; López, R.; Santamaría, P. Microbial Inactivation and MLF Performances of Tempranillo Rioja Wines Treated with PEF after Alcoholic Fermentation. Int. J. Food Microbiol. 2018, 269, 19–26. [Google Scholar] [CrossRef]
  18. González-Arenzana, L.; Portu, J.; López, N.; Santamaría, P.; Gutiérrez, A.R.; López, R.; López-Alfaro, I. Pulsed Electric Field Treatment after Malolactic Fermentation of Tempranillo Rioja Wines: Influence on Microbial, Physicochemical and Sensorial Quality. Innov. Food Sci. Emerg. Technol. 2019, 51, 57–63. [Google Scholar] [CrossRef]
  19. Drosou, F.; Yang, E.; Marinea, M.; Dourtoglou, E.G.; Chatzilazarou, A.; Dourtoglou, V.G. An Assessment of Potential Applications with Pulsed Electric Field in Wines. BIO Web Conf. 2017, 9, 02010. [Google Scholar] [CrossRef]
  20. Puértolas, E.; Saldaña, G.; Álvarez, I.; Raso, J. Effect of Pulsed Electric Field Processing of Red Grapes on Wine Chromatic and Phenolic Characteristics during Aging in Oak Barrels. J. Agric. Food Chem. 2010, 58, 2351–2357. [Google Scholar] [CrossRef]
  21. Delso, C.; Berzosa, A.; Sanz, J.; Álvarez, I.; Raso, J. Microbial Decontamination of Red Wine by Pulsed Electric Fields (PEF) after Alcoholic and Malolactic Fermentation: Effect on Saccharomyces Cerevisiae, Oenococcus Oeni, and Oenological Parameters during Storage. Foods 2023, 12, 278. [Google Scholar] [CrossRef] [PubMed]
  22. Delso, C.; Ospina, S.; Berzosa, A.; Raso, J.; Álvarez-Lanzarote, I. Defining Winery Processing Conditions for the Decontamination of Must and Wine Spoilage Microbiota by Pulsed Electric Fields (PEF). Innov. Food Sci. Emerg. Technol. 2023, 89, 103478. [Google Scholar] [CrossRef]
  23. Puértolas, E.; López, N.; Condón, S.; Raso, J.; Álvarez, I. Pulsed Electric Fields Inactivation of Wine Spoilage Yeast and Bacteria. Int. J. Food Microbiol. 2009, 130, 49–55. [Google Scholar] [CrossRef]
  24. Morata, A.; González, C.; Tesfaye, W.; Loira, I.; Suárez-Lepe, J.A. Maceration and Fermentation. In Red Wine Technology; Elsevier: Amsterdam, The Netherlands, 2019; pp. 35–49. ISBN 978-0-12-814399-5. [Google Scholar]
  25. Morata, A.; Escott, C.; Loira, I.; López, C.; Palomero, F.; González, C. Emerging Non-Thermal Technologies for the Extraction of Grape Anthocyanins. Antioxidants 2021, 10, 1863. [Google Scholar] [CrossRef]
  26. López-Giral, N.; López, R.; Santamaría, P.; González-Arenzana, L.; Garde-Cerdán, T. Phenolic and Colour Characteristics of Must and Wine Obtained from Red Grapes Treated by Pulsed Electric Fields. Efficacy of PEF to Reduce Maceration Time in Elaboration of Red Wines. Eur. Food Res. Technol. 2023, 249, 273–282. [Google Scholar] [CrossRef]
  27. Maza, M.A.; Pereira, C.; Martínez, J.M.; Camargo, A.; Álvarez, I.; Raso, J. PEF Treatments of High Specific Energy Permit the Reduction of Maceration Time during Vinification of Caladoc and Grenache Grapes. Innov. Food Sci. Emerg. Technol. 2020, 63, 102375. [Google Scholar] [CrossRef]
  28. Stocker, T.F.; Qin, D. Summary for Policymakers. In Climate Change 2013—The Physical Science Basis; Intergovernmental Panel On Climate Change, Ed.; Cambridge University Press: Cambridge, UK, 2014; pp. 1–30. ISBN 978-1-107-05799-9. [Google Scholar]
  29. Razungles, A. Extraction Technologies and Wine Quality. In Managing Wine Quality; Elsevier: Amsterdam, The Netherlands, 2010; pp. 589–630. ISBN 978-1-84569-798-3. [Google Scholar]
  30. Arcena, M.R.; Leong, S.Y.; Then, S.; Hochberg, M.; Sack, M.; Mueller, G.; Sigler, J.; Kebede, B.; Silcock, P.; Oey, I. The Effect of Pulsed Electric Fields Pre-Treatment on the Volatile and Phenolic Profiles of Merlot Grape Musts at Different Winemaking Stages and the Sensory Characteristics of the Finished Wines. Innov. Food Sci. Emerg. Technol. 2021, 70, 102698. [Google Scholar] [CrossRef]
  31. Comuzzo, P.; Voce, S.; Grazioli, C.; Tubaro, F.; Marconi, M.; Zanella, G.; Querzè, M. Pulsed Electric Field Processing of Red Grapes (Cv. Rondinella): Modifications of Phenolic Fraction and Effects on Wine Evolution. Foods 2020, 9, 414. [Google Scholar] [CrossRef]
  32. El Darra, N.; Rajha, H.N.; Ducasse, M.-A.; Turk, M.F.; Grimi, N.; Maroun, R.G.; Louka, N.; Vorobiev, E. Effect of Pulsed Electric Field Treatment during Cold Maceration and Alcoholic Fermentation on Major Red Wine Qualitative and Quantitative Parameters. Food Chem. 2016, 213, 352–360. [Google Scholar] [CrossRef]
  33. López-Giral, N.; González-Arenzana, L.; González-Ferrero, C.; López, R.; Santamaría, P.; López-Alfaro, I.; Garde-Cerdán, T. Pulsed Electric Field Treatment to Improve the Phenolic Compound Extraction from Graciano, Tempranillo and Grenache Grape Varieties during Two Vintages. Innov. Food Sci. Emerg. Technol. 2015, 28, 31–39. [Google Scholar] [CrossRef]
  34. López, N.; Puértolas, E.; Condón, S.; Álvarez, I.; Raso, J. Application of Pulsed Electric Fields for Improving the Maceration Process during Vinification of Red Wine: Influence of Grape Variety. Eur. Food Res. Technol. 2008, 227, 1099–1107. [Google Scholar] [CrossRef]
  35. Delso, C.; Berzosa, A.; Sanz, J.; Álvarez, I.; Raso, J. Pulsed Electric Field Processing as an Alternative to Sulfites (SO2) for Controlling Saccharomyces Cerevisiae Involved in the Fermentation of Chardonnay White Wine. Food Res. Int. 2023, 165, 112525. [Google Scholar] [CrossRef]
  36. Lee, J.; Durst, R.W.; E Wrolstad, R.; Collaborators; Eisele, T.; Giusti, M.M.; Hofsommer, H.; Koswig, S.; A Krueger, D.; Kupina, S.; et al. Determination of Total Monomeric Anthocyanin Pigment Content of Fruit Juices, Beverages, Natural Colorants, and Wines by the pH Differential Method: Collaborative Study. J. AOAC Int. 2005, 88, 1269–1278. [Google Scholar] [CrossRef]
  37. Glories, Y. La Couleur Des Vins Rouges. 2e Partie: Mesure, Origine et Interprétation. OENO One 1984, 18, 253–271. [Google Scholar] [CrossRef]
  38. Gambacorta, G.; Faccia, M.; Trani, A.; Lamacchia, C.; Gomes, T. Phenolic Composition and Antioxidant Activity of Southern Italian Monovarietal Virgin Olive Oils. Euro J. Lipid Sci. Technol. 2012, 114, 958–967. [Google Scholar] [CrossRef]
  39. Gambacorta, G.; Antonacci, D.; La Gatta, M.; Faccia, M.; La Gatta, B.; Pati, S.; Coletta, A.; La Notte, E. Phenolic Composition of Aglianico and Nero Di Troia Grapes and Wines as Affected by Cover Cropping and Irrigation. Ital. J. Food Sci. 2011, 23, 381–394. [Google Scholar]
  40. Sarneckis, C.J.; Dambergs, R.G.; Jones, P.; Mercurio, M.; Herderich, M.J.; Smith, P.A. Quantification of Condensed Tannins by Precipitation with Methyl Cellulose: Development and Validation of an Optimised Tool for Grape and Wine Analysis. Aust. J. Grape Wine Res. 2006, 12, 39–49. [Google Scholar] [CrossRef]
  41. Tarantino, A.; Difonzo, G.; Lopriore, G.; Disciglio, G.; Paradiso, V.M.; Gambacorta, G.; Caponio, F. Bioactive Compounds and Quality Evaluation of ‘Wonderful’ Pomegranate Fruit and Juice as Affected by Deficit Irrigation. J. Sci. Food Agric. 2020, 100, 5539–5545. [Google Scholar] [CrossRef]
  42. Ginjom, I.; D’Arcy, B.; Caffin, N.; Gidley, M. Phenolic Compound Profiles in Selected Queensland Red Wines at All Stages of the Wine-Making Process. Food Chem. 2011, 125, 823–834. [Google Scholar] [CrossRef]
  43. Marquez, A.; Dueñas, M.; Serratosa, M.P.; Merida, J. Identification by HPLC-MS of Anthocyanin Derivatives in Raisins. J. Chem. 2013, 2013, 274893. [Google Scholar] [CrossRef]
  44. Pérez-Navarro, J.; Izquierdo-Cañas, P.M.; Mena-Morales, A.; Martínez-Gascueña, J.; Chacón-Vozmediano, J.L.; García-Romero, E.; Hermosín-Gutiérrez, I.; Gómez-Alonso, S. Phenolic Compounds Profile of Different Berry Parts from Novel Vitis Vinifera L. Red Grape Genotypes and Tempranillo Using HPLC-DAD-ESI-MS/MS: A Varietal Differentiation Tool. Food Chem. 2019, 295, 350–360. [Google Scholar] [CrossRef] [PubMed]
  45. Topi, D.; Kelebek, H.; Guclu, G.; Selli, S. LC-DAD-ESI-MS/MS Characterization of Phenolic Compounds in Wines from Vitis ViniferaShesh i Bardhë ’ and ‘ Vlosh ’ Cultivars. Food Process. Preserv. 2022, 46, e16157. [Google Scholar] [CrossRef]
  46. Zhang, X.-K.; Li, S.-Y.; Zhao, X.; Pan, Q.-H.; Shi, Y.; Duan, C.-Q. HPLC-MS/MS-Based Targeted Metabolomic Method for Profiling of Malvidin Derivatives in Dry Red Wines. Food Res. Int. 2020, 134, 109226. [Google Scholar] [CrossRef]
  47. Prezioso, I.; Fioschi, G.; Rustioni, L.; Mascellani, M.; Natrella, G.; Venerito, P.; Gambacorta, G.; Paradiso, V.M. Influence of Prolonged Maceration on Phenolic Compounds, Volatile Profile and Sensory Properties of Wines from Minutolo and Verdeca, Two Apulian White Grape Varieties. LWT 2024, 192, 115698. [Google Scholar] [CrossRef]
  48. Giacosa, S.; Río Segade, S.; Cagnasso, E.; Caudana, A.; Rolle, L.; Gerbi, V. SO2 in Wines. In Red Wine Technology; Elsevier: Amsterdam, The Netherlands, 2019; pp. 309–321. ISBN 978-0-12-814399-5. [Google Scholar]
  49. Ribéreau-Gayon, P.; Dubourdieu, D.; Donèche, B.; Lonvaud, A. Handbook of Enology, Vol. 1: The Microbiology of Wine and Vinifications, 2nd ed; John Wiley & Sons, Limited: West Sussex, UK, 2006; Volume 1. [Google Scholar]
  50. Osete-Alcaraz, A.; Gómez-Plaza, E.; Martínez-Pérez, P.; Weiller, F.; Schückel, J.; Willats, W.G.T.; Moore, J.P.; Ros-García, J.M.; Bautista-Ortín, A.B. The Influence of Hydrolytic Enzymes on Tannin Adsorption-Desorption onto Grape Cell Walls in a Wine-Like Matrix. Molecules 2021, 26, 770. [Google Scholar] [CrossRef]
  51. Osete-Alcaraz, A.; Gómez-Plaza, E.; Martínez-Pérez, P.; Weiller, F.; Schückel, J.; Willats, W.G.T.; Moore, J.P.; Ros-García, J.M.; Bautista-Ortín, A.B. The Impact of Carbohydrate-Active Enzymes on Mediating Cell Wall Polysaccharide-Tannin Interactions in a Wine-like Matrix. Food Res. Int. 2020, 129, 108889. [Google Scholar] [CrossRef]
  52. Pérez-Porras, P.; Bautista-Ortín, A.B.; Martínez-Lapuente, L.; Guadalupe, Z.; Ayestarán, B.; Gómez-Plaza, E. The Generation of Suspended Cell Wall Material May Limit the Effect of Ultrasound Technology in Some Varietal Wines. Foods 2024, 13, 1306. [Google Scholar] [CrossRef]
  53. Aleixandre-Tudo, J.L.; Du Toit, W. Cold Maceration Application in Red Wine Production and Its Effects on Phenolic Compounds: A Review. LWT 2018, 95, 200–208. [Google Scholar] [CrossRef]
  54. Delso, C.; Berzosa, A.; Sanz, J.; Álvarez, I.; Raso, J. Two-Step PEF Processing for Enhancing the Polyphenol Concentration and Decontaminating a Red Grape Juice. Foods 2022, 11, 621. [Google Scholar] [CrossRef]
  55. Pérez-Porras, P.; Gómez Plaza, E.; Martínez-Lapuente, L.; Ayestarán, B.; Guadalupe, Z.; Jurado, R.; Bautista-Ortín, A.B. High-Power Ultrasound in Enology: Is the Outcome of This Technique Dependent on Grape Variety? Foods 2023, 12, 2236. [Google Scholar] [CrossRef]
  56. Ricci, A.; Parpinello, G.; Versari, A. Recent Advances and Applications of Pulsed Electric Fields (PEF) to Improve Polyphenol Extraction and Color Release during Red Winemaking. Beverages 2018, 4, 18. [Google Scholar] [CrossRef]
  57. Paradiso, V.M.; Fioschi, G.; Tripaldi, M.; Sanarica, L.; Pisarra, C.; Noviello, M.; Prezioso, I.; Gambacorta, G. Low-Pressure Continuous Dynamic Extraction from Oak Chips Combined with Passive Micro-Oxygenation to Tune Red Wine Properties. Heliyon 2024, 10, e36100. [Google Scholar] [CrossRef] [PubMed]
  58. Kumar, Y. Dealcoholized Wine: A Scoping Review of Volatile and Non-Volatile Profiles, Consumer Perception, and Health Benefits. Food Bioprocess Technol. 2024, 17, 3525–3545. [Google Scholar] [CrossRef]
  59. Akhtar, W.; Ceci, A.T.; Longo, E.; Marconi, M.A.; Lonardi, F.; Boselli, E. Dealcoholized Wine: Techniques, Sensory Impacts, Stability, and Perspectives of a Growing Industry. Comp. Rev. Food Sci. Food Safe 2025, 24, e70171. [Google Scholar] [CrossRef]
  60. Stirke, A.; Celiesiute-Germaniene, R.; Zimkus, A.; Zurauskiene, N.; Simonis, P.; Dervinis, A.; Ramanavicius, A.; Balevicius, S. The Link between Yeast Cell Wall Porosity and Plasma Membrane Permeability after PEF Treatment. Sci. Rep. 2019, 9, 14731. [Google Scholar] [CrossRef]
  61. Garde-Cerdán, T.; González-Arenzana, L.; López, N.; López, R.; Santamaría, P.; López-Alfaro, I. Effect of Different Pulsed Electric Field Treatments on the Volatile Composition of Graciano, Tempranillo and Grenache Grape Varieties. Innov. Food Sci. Emerg. Technol. 2013, 20, 91–99. [Google Scholar] [CrossRef]
  62. Delsart, C.; Cholet, C.; Ghidossi, R.; Grimi, N.; Gontier, E.; Gény, L.; Vorobiev, E.; Mietton-Peuchot, M. Effects of Pulsed Electric Fields on Cabernet Sauvignon Grape Berries and on the Characteristics of Wines. Food Bioprocess. Technol. 2014, 7, 424–436. [Google Scholar] [CrossRef]
  63. Waterhouse, A.L.; Sacks, G.L.; Jeffery, D.W. Understanding Wine Chemistry; Wiley: Chichester, UK, 2016; ISBN 978-1-118-62780-8. [Google Scholar]
  64. Prezioso, I.; Corcione, G.; Digiorgio, C.; Fioschi, G.; Paradiso, V.M. Ageing of Red Wine (Cv. Negroamaro) in Mediterranean Areas: Impact of Different Barrels and Apulian Traditional Amphorae on Phenolic Indices, Volatile Composition and Sensory Analysis. Foods 2025, 14, 650. [Google Scholar] [CrossRef]
  65. Morata, A.; Gómez-Cordovés, M.C.; Calderón, F.; Suárez, J.A. Effects of pH, Temperature and SO2 on the Formation of Pyranoanthocyanins during Red Wine Fermentation with Two Species of Saccharomyces. Int. J. Food Microbiol. 2006, 106, 123–129. [Google Scholar] [CrossRef]
  66. Bakker, J.; Timberlake, C.F. Isolation, Identification, and Characterization of New Color-Stable Anthocyanins Occurring in Some Red Wines. J. Agric. Food Chem. 1997, 45, 35–43. [Google Scholar] [CrossRef]
  67. Morata, A.; Calderón, F.; González, M.C.; Gómez-Cordovés, M.C.; Suárez, J.A. Formation of the Highly Stable Pyranoanthocyanins (Vitisins A and B) in Red Wines by the Addition of Pyruvic Acid and Acetaldehyde. Food Chem. 2007, 100, 1144–1152. [Google Scholar] [CrossRef]
  68. Asenstorfer, R.E.; Markides, A.J.; Iland, P.G.; Jones, G.P. Formation of Vitisin A during Red Wine Fermentation and Maturation. Aust. J. Grape Wine Res. 2003, 9, 40–46. [Google Scholar] [CrossRef]
  69. Jouin, A.; Zeng, L.; Canosa, M.R.; Teissedre, P.-L.; Jourdes, M. Evolution of the Crown Procyanidins’ Tetramer during Winemaking and Aging of Red Wine. Foods 2022, 11, 3194. [Google Scholar] [CrossRef]
  70. Malien-Aubert, C.; Dangles, O.; Amiot, M.J. Influence of Procyanidins on the Color Stability of Oenin Solutions. J. Agric. Food Chem. 2002, 50, 3299–3305. [Google Scholar] [CrossRef]
  71. Escribano-Bailón, T.; Álvarez-García, M.; Rivas-Gonzalo, J.C.; Heredia, F.J.; Santos-Buelga, C. Color and Stability of Pigments Derived from the Acetaldehyde-Mediated Condensation between Malvidin 3- O -Glucoside and (+)-Catechin. J. Agric. Food Chem. 2001, 49, 1213–1217. [Google Scholar] [CrossRef]
  72. Bakker, J.; Bridle, P.; Bellworthy, S.J.; Garcia-Viguera, C.; Reader, H.P.; Watkins, S.J. Effect of Sulphur Dioxide and Must Extraction on Colour, Phenolic Composition and Sensory Quality of Red Table Wine. J. Sci. Food Agric. 1998, 78, 297–307. [Google Scholar] [CrossRef]
  73. Gómez-Plaza, E.; Gil-Muñoz, R.; López-Roca, J.M.; Martı́nez-Cutillas, A.; Fernández-Fernández, J.I. Maintenance of Colour Composition of a Red Wine During Storage. Influence of Prefermentative Practices, Maceration Time and Storage. LWT-Food Sci. Technol. 2002, 35, 46–53. [Google Scholar] [CrossRef]
  74. Maza, M.A.; Martínez, J.M.; Delso, C.; Camargo, A.; Raso, J.; Álvarez, I. PEF-Dependency on Polyphenol Extraction during Maceration/Fermentation of Grenache Grapes. Innov. Food Sci. Emerg. Technol. 2020, 60, 102303. [Google Scholar] [CrossRef]
  75. Fourie, E.; Aleixandre-Tudo, J.L.; Mihnea, M.; Du Toit, W. Partial Least Squares Calibrations and Batch Statistical Process Control to Monitor Phenolic Extraction in Red Wine Fermentations under Different Maceration Conditions. Food Control. 2020, 115, 107303. [Google Scholar] [CrossRef]
  76. González-Neves, G.; Gil, G.; Barreiro, L. Influence of Grape Variety on the Extraction of Anthocyanins during the Fermentation on Skins. Eur. Food Res. Technol. 2008, 226, 1349–1355. [Google Scholar] [CrossRef]
  77. Saldaña, G.; Cebrián, G.; Abenoza, M.; Sánchez-Gimeno, C.; Álvarez, I.; Raso, J. Assessing the Efficacy of PEF Treatments for Improving Polyphenol Extraction during Red Wine Vinifications. Innov. Food Sci. Emerg. Technol. 2017, 39, 179–187. [Google Scholar] [CrossRef] [PubMed]
  78. Natrella, G.; Noviello, M.; Trani, A.; Faccia, M.; Gambacorta, G. The Effect of Ultrasound Treatment in Winemaking on the Volatile Compounds of Aglianico, Nero Di Troia, and Primitivo Red Wines. Foods 2023, 12, 648. [Google Scholar] [CrossRef] [PubMed]
  79. Riffle, V.L.; Arredondo, J.A.; LoMonaco, I.; Appel, C.; Catania, A.A.; Dodson Peterson, J.C.; Casassa, L.F. Vine Age Affects Vine Performance, Grape and Wine Chemical and Sensory Composition of Cv. Zinfandel from California. Am. J. Enol. Vitic. 2022, 73, 277–293. [Google Scholar] [CrossRef]
  80. Pineau, B.; Barbe, J.-C.; Van Leeuwen, C.; Dubourdieu, D. Which Impact for β-Damascenone on Red Wines Aroma? J. Agric. Food Chem. 2007, 55, 4103–4108. [Google Scholar] [CrossRef]
  81. Romano, P.; Braschi, G.; Siesto, G.; Patrignani, F.; Lanciotti, R. Role of Yeasts on the Sensory Component of Wines. Foods 2022, 11, 1921. [Google Scholar] [CrossRef]
  82. Reynolds, A.G. Viticultural Practices and Their Effects on Grape and Wine Quality. In The World of Niagara Wine; Ripmeester, M., Mackintosh, P.G., Fullerton, C., Eds.; Wilfrid Laurier Press: Waterloo, ON, USA, 2013; pp. 185–212. ISBN 978-1-55458-405-5. [Google Scholar]
  83. Garde-Cerdán, T.; Ancín-Azpilicueta, C. Review of Quality Factors on Wine Ageing in Oak Barrels. Trends Food Sci. Technol. 2006, 17, 438–447. [Google Scholar] [CrossRef]
  84. Hazelwood, L.A.; Daran, J.-M.; Van Maris, A.J.A.; Pronk, J.T.; Dickinson, J.R. The Ehrlich Pathway for Fusel Alcohol Production: A Century of Research on Saccharomyces Cerevisiae Metabolism. Appl. Environ. Microbiol. 2008, 74, 2259–2266. [Google Scholar] [CrossRef]
  85. Lisanti, M.T.; Blaiotta, G.; Nioi, C.; Moio, L. Alternative Methods to SO2 for Microbiological Stabilization of Wine. Comp. Rev. Food Sci. Food Safe 2019, 18, 455–479. [Google Scholar] [CrossRef]
  86. Dennis, E.G.; Keyzers, R.A.; Kalua, C.M.; Maffei, S.M.; Nicholson, E.L.; Boss, P.K. Grape Contribution to Wine Aroma: Production of Hexyl Acetate, Octyl Acetate, and Benzyl Acetate during Yeast Fermentation Is Dependent upon Precursors in the Must. J. Agric. Food Chem. 2012, 60, 2638–2646. [Google Scholar] [CrossRef]
  87. Moio, L.; Ugliano, M.; Genovese, A.; Gambuti, A.; Pessina, R.; Piombino, P. Effect of Antioxidant Protection of Must on Volatile Compounds and Aroma Shelf Life of Falanghina (Vitis Vinifera L.) Wine. J. Agric. Food Chem. 2004, 52, 891–897. [Google Scholar] [CrossRef]
  88. Santos, C.V.A.; Pereira, C.; Martins, N.; Cabrita, M.J.; Gomes Da Silva, M. Different SO2 Doses and the Impact on Amino Acid and Volatile Profiles of White Wines. Beverages 2023, 9, 33. [Google Scholar] [CrossRef]
  89. Sonni, F.; Cejudo Bastante, M.J.; Chinnici, F.; Natali, N.; Riponi, C. Replacement of Sulfur Dioxide by Lysozyme and Oenological Tannins during Fermentation: Influence on Volatile Composition of White Wines. J. Sci. Food Agric. 2009, 89, 688–696. [Google Scholar] [CrossRef]
  90. Sonni, F.; Chinnici, F.; Natali, N.; Riponi, C. Pre-Fermentative Replacement of Sulphur Dioxide by Lysozyme and Oenological Tannins: Effect on the Formation and Evolution of Volatile Compounds during the Bottle Storage of White Wines. Food Chem. 2011, 129, 1193–1200. [Google Scholar] [CrossRef]
  91. Allamy, L.; Van Leeuwen, C.; Pons, A. Impact of Harvest Date on Aroma Compound Composition of Merlot and Cabernet-Sauvignon Must and Wine in a Context of Climate Change: A Focus on Cooked Fruit Molecular Markers. OENO One 2023, 57, 99–112. [Google Scholar] [CrossRef]
Figure 1. Experimental trials.
Foods 14 01792 g001
Figure 2. Evolution of total phenolic content (A), total anthocyanins (B), total anthocyanin/total phenolic compounds ratio (C), color intensity (D), and hue (E) of Primitivo musts treated and untreated with PEF and SO2 after one, two, five, eight, and fifteen days of maceration.
Foods 14 01792 g002
Figure 3. Clustering result shown as heatmap (Euclidean distance, Ward clustering algorithm) based on the phenolic profile of individual replicates of control wine, wine sample with SO2 (SO2), wine treated with PEF and SO2 (PEF + SO2), and wine treated with PEF without SO2 (PEF) after bottling (t0) and after 6 months. Clusters of phenolic compounds are highlighted and identified by the letters A–E. Abbreviations: Caft Ac, Caftaric Acid; Vit B, Vitisin B; Mv 3-(6c-couU-glc, Malvidin 3-(6″-t-coumaroyl)-glucoside; Vit A, Vitisin A; Proc B3, Procyanidin B3; Gal ac, Gallic acid; Proc B2, Procyanidin B2; Epicat, (-)-epicatechin; Cat, (+)-catechin; Proc B1, Procyanidin B1; Ethyl-gall, Ethylgallate; Peo 3-glc, Peonidin 3-(6″-t-coumaroyl)-glucoside; Dp 3-glc, Delphinidin 3-glucoside; Mv 3-(6caf)-glc, Malvidin 3-(6″-caffeoyl)-; Querc, Quercetin; Quer-3-O-glcur, Quercetin- 3-O-glucuronide; cis-Cout Ac, cis-Coutaric acid; Peo 3-(6t-cou)-glu, Peonidin 3-(6″-t-coumaroyl)-glucoside; Pet 3-(6t-cou)-glc, Petunidin 3-(6″-t-coumaroyl)-glucoside; Peo 3-(6ac)-glu, Peonidin-3-(6″-acetyl)-glucoside; Mv 3-(6t-cou)-glc, Malvidin 3-(6″-t-coumaroyl)-glucoside; Mv 3-glc, Malvidin 3-glucoside; Mv 3-(6ac)-glc, Malvidin 3-(6″-acetyl)-glucoside; Pet 3-glc, Petunidin 3-glucoside.
Foods 14 01792 g003
Figure 4. Clustering result shown as a heatmap (Euclidean distance, Ward clustering algorithm) based on the volatile profile of individual replicates of control wine, wine sample with SO2 (SO2), wine treated with PEF and SO2 (PEF + SO2), and wine treated with PEF without SO2 (PEF) after 6 months.
Foods 14 01792 g004
Figure 5. Results of point biserial partial correlations of chemical parameters with the PEF treatment ((A), levels: wine with PEF, wine without PEF) and the use of SO2 ((B), levels: wine with SO2, wine without SO2). SO2 and PEF were considered covariates of interest for A and B, respectively. Only correlations with p-value < 0.05 (reported in labels) were included.
Foods 14 01792 g005
Figure 6. Results of sensory analysis and overall judgment of wines during storage. * Sensory parameters where there is a significant difference among the wines (Tukey test, p < 0.05). Abbreviations: C+, control sample with SO2; C−, control sample without SO2; PEF+, sample treated with PEF and SO2, PEF−, sample treated with PEF without SO2.
Foods 14 01792 g006
Figure 7. Correspondence analysis carried out on the results of the CATA analysis. Aroma descriptors perceived by the judges in control wine (Control); control wine with SO2 (SO2); wine treated with PEF (PEF), and wine treated with PEF and SO2 (PEF + SO2) after six months of storage.
Foods 14 01792 g007
Table 1. Oenological parameters of Primitivo di Manduria wine at bottling and after six months of storage a.
At Bottling 6 Months
ControlSO2PEF + SO2PEFControlSO2PEF + SO2PEF
E (% v/v) b16.51 ± 0.29 a16.7 ± 0.1 a15.77 ± 0.02 b15.38 ± 0.11 b16.53 ± 0.37 a16.88 ± 0.08 a15.87 ± 0.02 b15.51 ± 0.10 b
VA (g L−1)0.51 ± 0.04 bc0.44 ± 0.01 a b0.41 ± 0.00 c0.56 ± 0.05 a0.67 ± 0.02 a0.51 ± 0.02 a0.55 ± 0.08 a1.02 ± 0.41 a
TA (g L−1)4.95 ± 0.12 a b4.97 ± 0.05 a b5.12 ± 0.03 a4.81 ± 0.06 b4.69 ± 0.01 a4.77 ± 0.02 a4.73 ± 0.11 a5.46 ± 0.84 a
pH3.87+0.01 a3.86 ± 0.01 a b3.80 ± 0.01 c3.84 ± 0.01 b3.89 ± 0.02 a3.84 ± 0.02 a b3.79 ± 0.02 b3.78 ± 0.06 b
MA (g L−1)0.12 ± 0.02 bc0.19 ± 0.04 a b0.23 ± 0.03 a0.06 ± 0.01 c0.02 ± 0.02 a0.07 ± 0.01 a0.05 ± 0.05 a0.04 ± 0.02 a
LacA (g L−1)0.69 ± 0.01 a0.66 ± 0.03 a0.51 ± 0.02 b0.71 ± 0.09 a0.86 ± 0.03 a b0.67 ± 0.03 b0.69 ± 0.07 b1.59 ± 0.67 a
TarA (g L−1)2.41 ± 0.01 b2.59 ± 0.01 a2.32 ± 0.01 b2.31 ± 0.09 b2.06 ± 0.07 a b2.22 ± 0.08 a1.82 ± 0.04 c1.84 ± 0.14 bc
CitA (g L−1)0.14 ± 0.01 b0.15 ± 0.01 b0.17 ± 0.01 a0.13 ± 0.01 b0.09 ± 0.01 b0.13 ± 0.01 a b0.14 ± 0.02 a0.13 ± 0.02 a b
Ashes (g L−1)3.11 ± 0.06 b3.30 ± 0.01 a3.04 ± 0.03 bc3.01 ± 0.02 c3.12 ± 0.10 a3.18 ± 0.09 a2.85 ± 0.02 a b2.61 ± 0.28 b
Free SO2 (mg L−1)12.0 ± 1.0 b16.5 ± 0.5 a15.3 ± 0.6 a11.7 ± 0.6 b9.5 ± 0.7 b13.7 ± 1.2 a12.0 ± 1.0 a8.7 ± 0.6 b
Total SO2 (mg L−1)21.0 ± 1.0 b34.5 ± 0.5 a34.3 ± 2.3 a20.7 ± 0.6 b16.0 ± 3.0 b26.3 ± 2.5 a24.0 ± 1.7 a16.3 ± 1.5 b
TPC (mg L−1 gallic acid)2774.1 ± 70.8 a2777.7 ± 67.9 a2504.1 ± 46.7 b1970.8 ± 30.2 c2559.1 ± 26.4 a2932.2 ± 242.4 a2522.2 ± 111.8 a1941.9 ± 55.5 b
DPPH (µmol troloxeq L−1)9863.1 ± 111.4 a10,103.0 ± 104.5 a8368.2 ± 51.6 b6499.5 ± 272.6 c8979.3 ± 283.6 a9037.4 ± 69.6 a9110.6 ± 309.1 a7714.1 ± 721.1 a
ABTS (µmol troloxeq L−1)11,488.9 ± 375.4 a11,627.8 ± 677.9 a10,946.3 ± 373.4 a8725.9 ± 375.2 b11,975.9 ± 74.9 a11,731.5 ± 86.1 a11,998.1 ± 396.5 a8742.6 ± 456.8 b
A (mg L−1)360.2 ± 51.1 b445.5 ± 49.4 a b457.5 ± 19.4 a300.5 ± 6.7 c226.07 ± 11.1 b297.4 ± 4.0 a260.2 ± 32.4 a b188.5 ± 6.8 c
F (mg L−1 (+)-Catechin)1866.5 ± 84.5 a1870 ± 150.8 a1664.2 ± 74.1 a1339.6 ± 53.9 b1646.6 ± 51.5 a1681.3 ± 17.2 a1433.7 ± 58.0 b1114.0 ± 38.37 c
Pr (mg L−1 Cyanidin Chloride)1470.9 ± 142.7 a15,519 ± 38.2 a1481.1 ± 166.0 a1119.3 ± 40.8 b1664.0 ± 62 a1783.4 ± 162.1 a1641.7 ± 80.5 a1182.0 ± 38.3 b
Tan (mg L−1 Epicatechin)1569.6 ± 101.4 b1538.7 ± 23.8 b1847.9 ± 155.2 a1099.2 ± 29.1 c1625.8 ± 90.3 a1618.7 ± 142.5 a1292.5 ± 56.9 b984.6 ± 67.4 c
FRV (mg L−1 (+)-Catechin)764.9 ± 80.0 a628.9 ± 52.3 a b496.1 ± 593.4 a b498.2 ± 75.7 b620.5 ± 39.7 a667.3 ± 31.0 a373.7 ± 397.6 b364.6 ± 96.3 b
FRV/Pr0.52 ± 0.04 a0.41 ± 0.03 a0.40 ± 0.08 a0.44 ± 0.06 a0.37 ± 0.03 a b0.38 ± 0.02 a0.24 ± 0.02 b0.31 ± 0.09 a b
CI0.92 ± 0.03 b1.08 ± 0.02 a0.89 ± 0.04 b0.67 ± 0.03 c0.91 ± 0.04 b1.12 ± 0.05 a0.90 ± 0.07 b0.68 ± 0.02 c
T0.69 ± 0.01 a0.63 ± 0.01 b0.64 ± 0.01 b0.71 ± 0.01 a0.74 ± 0.01 a0.66 ± 0.01 b0.67 ± 0.01 b0.72 ± 0.01 a
DO420 (%)35.64 ± 0.06 b33.75 ± 0.39 b34.01 ± 0.18 a35.97 ± 0.45 a37.07 ± 0.05 a34.41 ± 0.28 b35.09 ± 0.38 b36.64 ± 0.58 a
DO520 (%)68.92 ± 1.37 b90.61 ± 4.12 a73.47 ± 2.41 b48.48 ± 2.02 c61.47 ± 2.61 b88.48 ± 5.89 a69.60 ± 7.32 b47.16 ± 1.86 c
DO620 (%)0.33 ± 0.02 b0.42 ± 0.01 a0.34 ± 0.03 b0.24 ± 0.02 c0.31 ± 0.02 b0.43 ± 0.02 a0.33 ± 0.03 b0.24 ± 0.02 c
dA (%)77.83 ± 0.09 b80.53 ± 0.44 a80.15 ± 0.23 a77.35 ± 0.81 b75.78 ± 0.09 b79.86 ± 0.36 a78.61 ± 0.49 a76.42 ± 1.17 b
a Average ± standard deviation (n = 3). In the rows and for each time considered, different letters following data indicate statistically significant differences at p < 0.05 according to one-way ANOVA followed by Tukey’s test. b Abbreviations: SO2, wine sample with SO2; PEF + SO2, sample treated with PEF and SO2; PEF, sample treated with PEF without SO2; E, ethanol; VA, volatile acidity; TA, titratable acidity; pH; MA, malic acid; LacA, lactic acid; TarA, tartaric acid; CitA, citric acid; TPC, total phenolic content; DPPH and ABTS antioxidant activity assays; A, total anthocyanins; F, total flavonols; Pr, proanthocyanins; Tan, condensed tannins; FRV, flavans reactive with vanillin; CI, color intensity; T, tonality; DO420 (%), DO520 (%), DO620 (%), percentage of yellow, red, and blue color; dA (%), purity of red color.
Disclaimer/Publisher’s Note: The statements, opinions and data contained in all publications are solely those of the individual author(s) and contributor(s) and not of MDPI and/or the editor(s). MDPI and/or the editor(s) disclaim responsibility for any injury to people or property resulting from any ideas, methods, instructions or products referred to in the content.

