
Evaluation of 3D Printing of Cereal–Legume Starch-Based Gels Formulated with Red Adzuki Bean and Germinated Brown Rice Flour


Abstract
1. Introduction
2. Materials and Methods
2.1. Preparation of the Gel
2.2. Characterization of Gel Properties
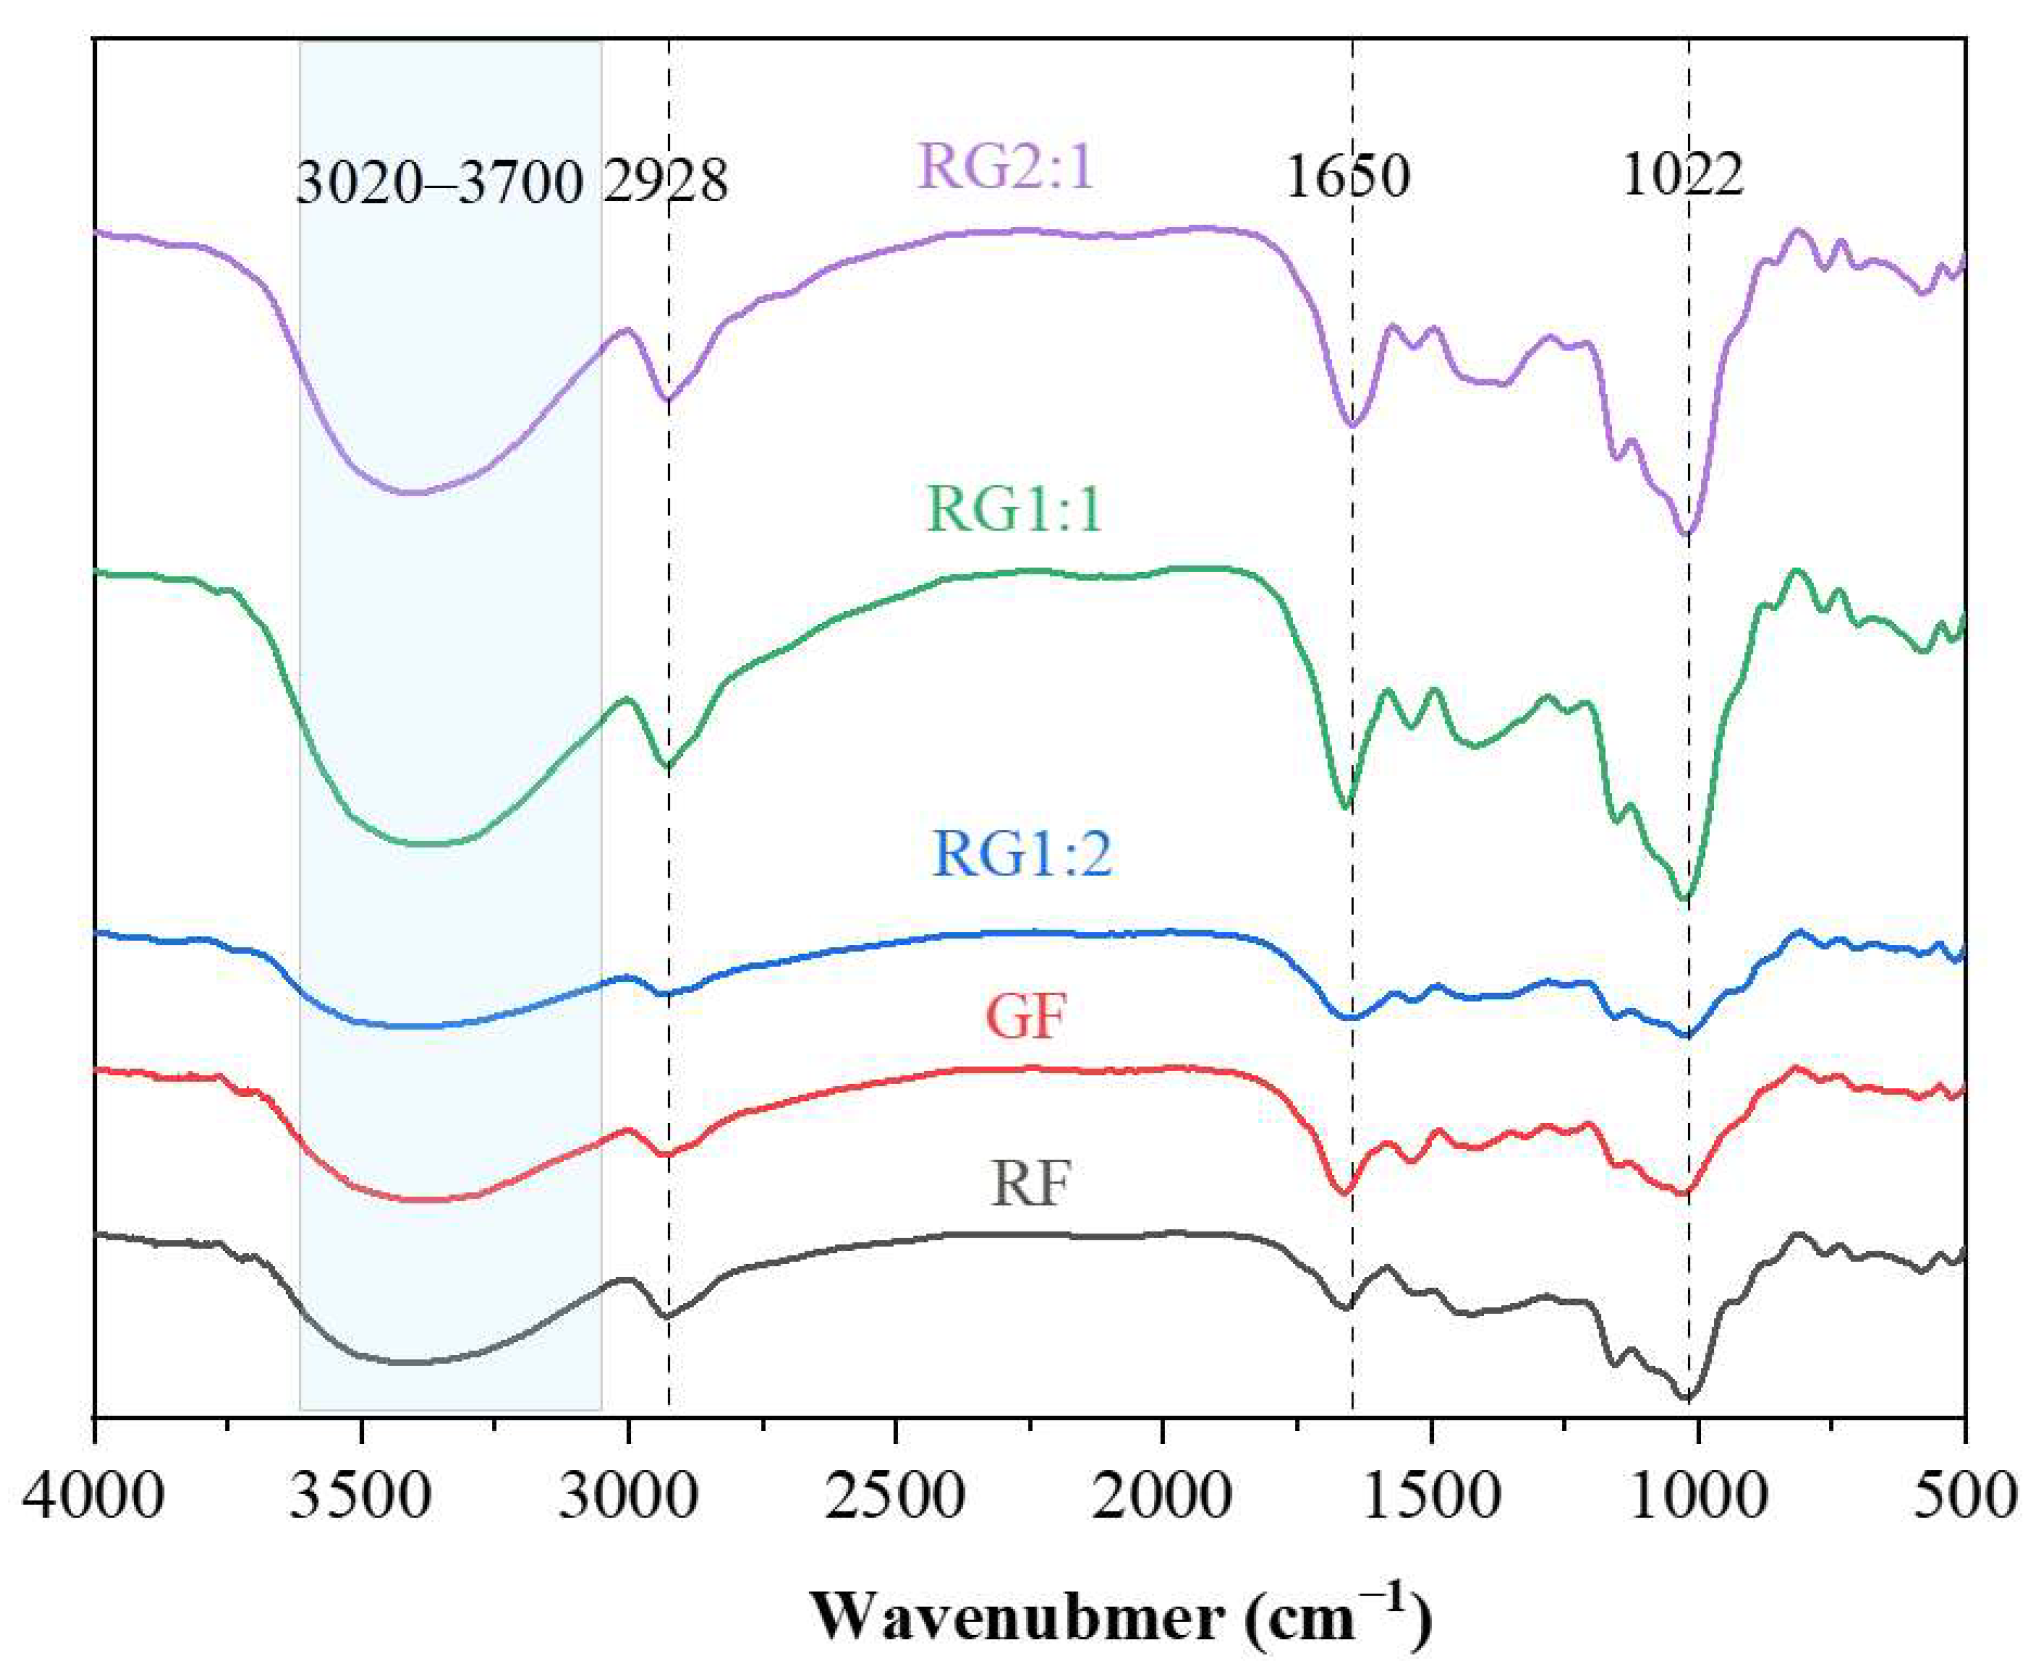
2.2.1. Fourier Transform Infrared Spectroscopy (FT-IR)
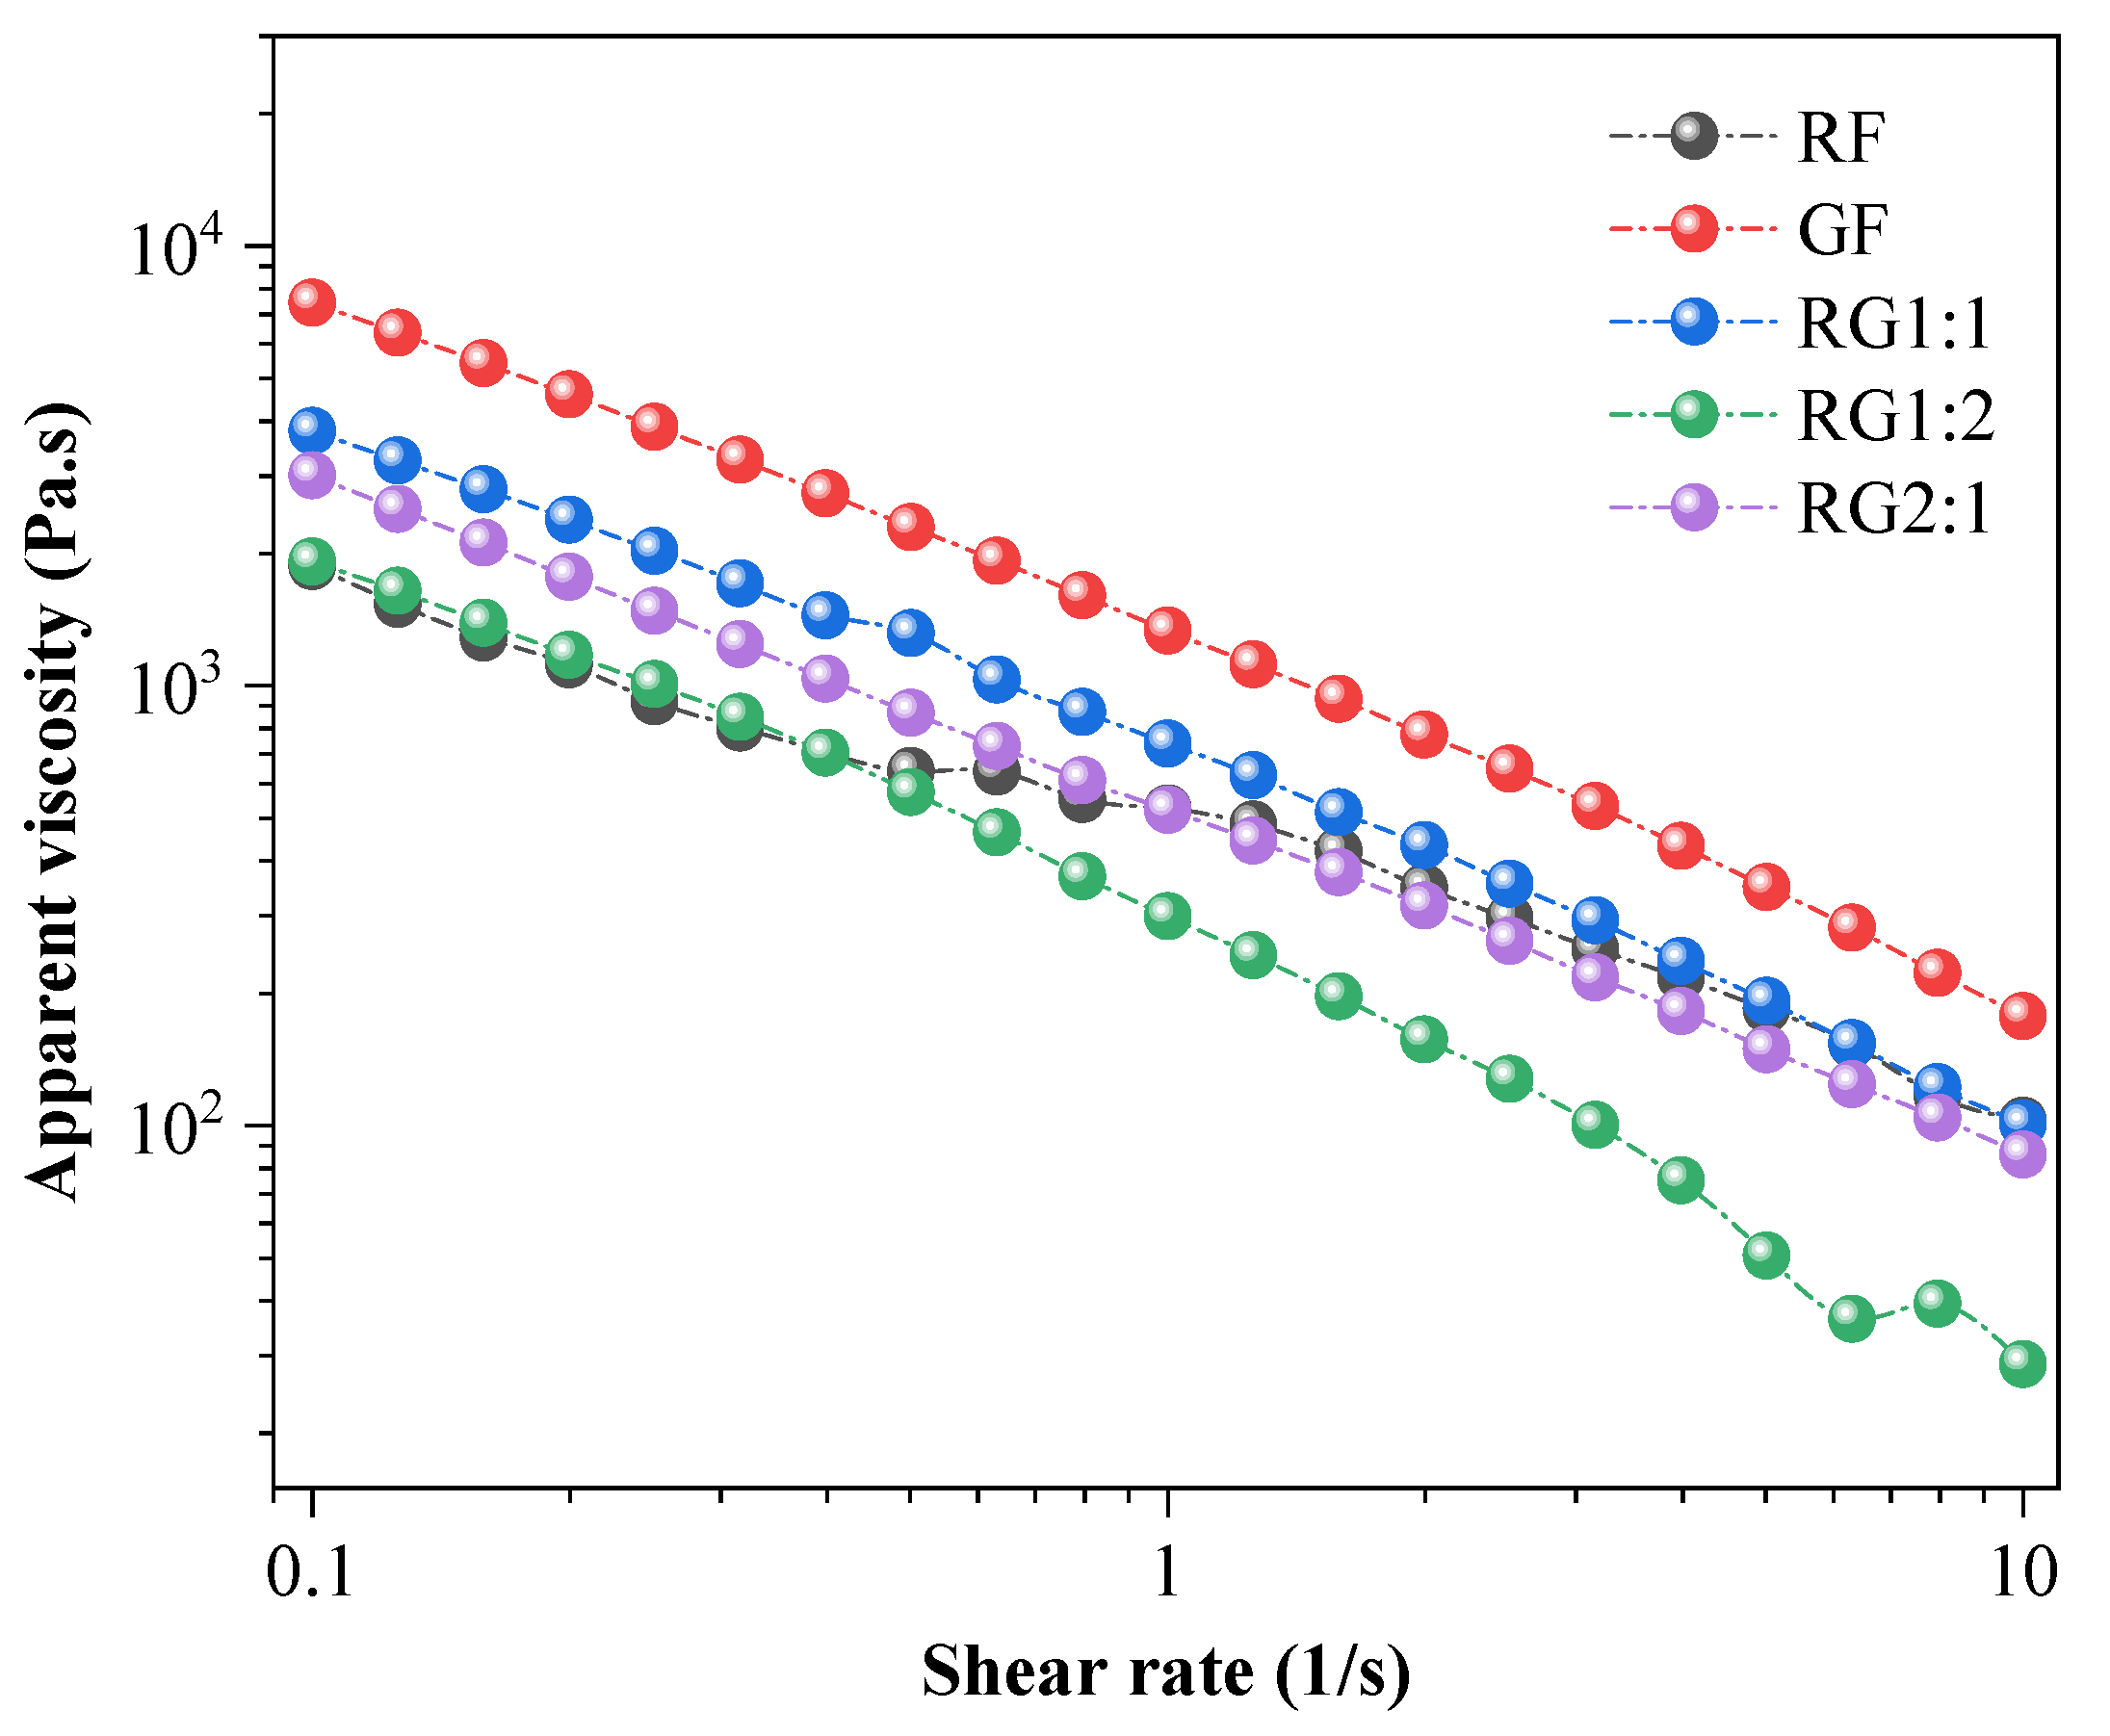
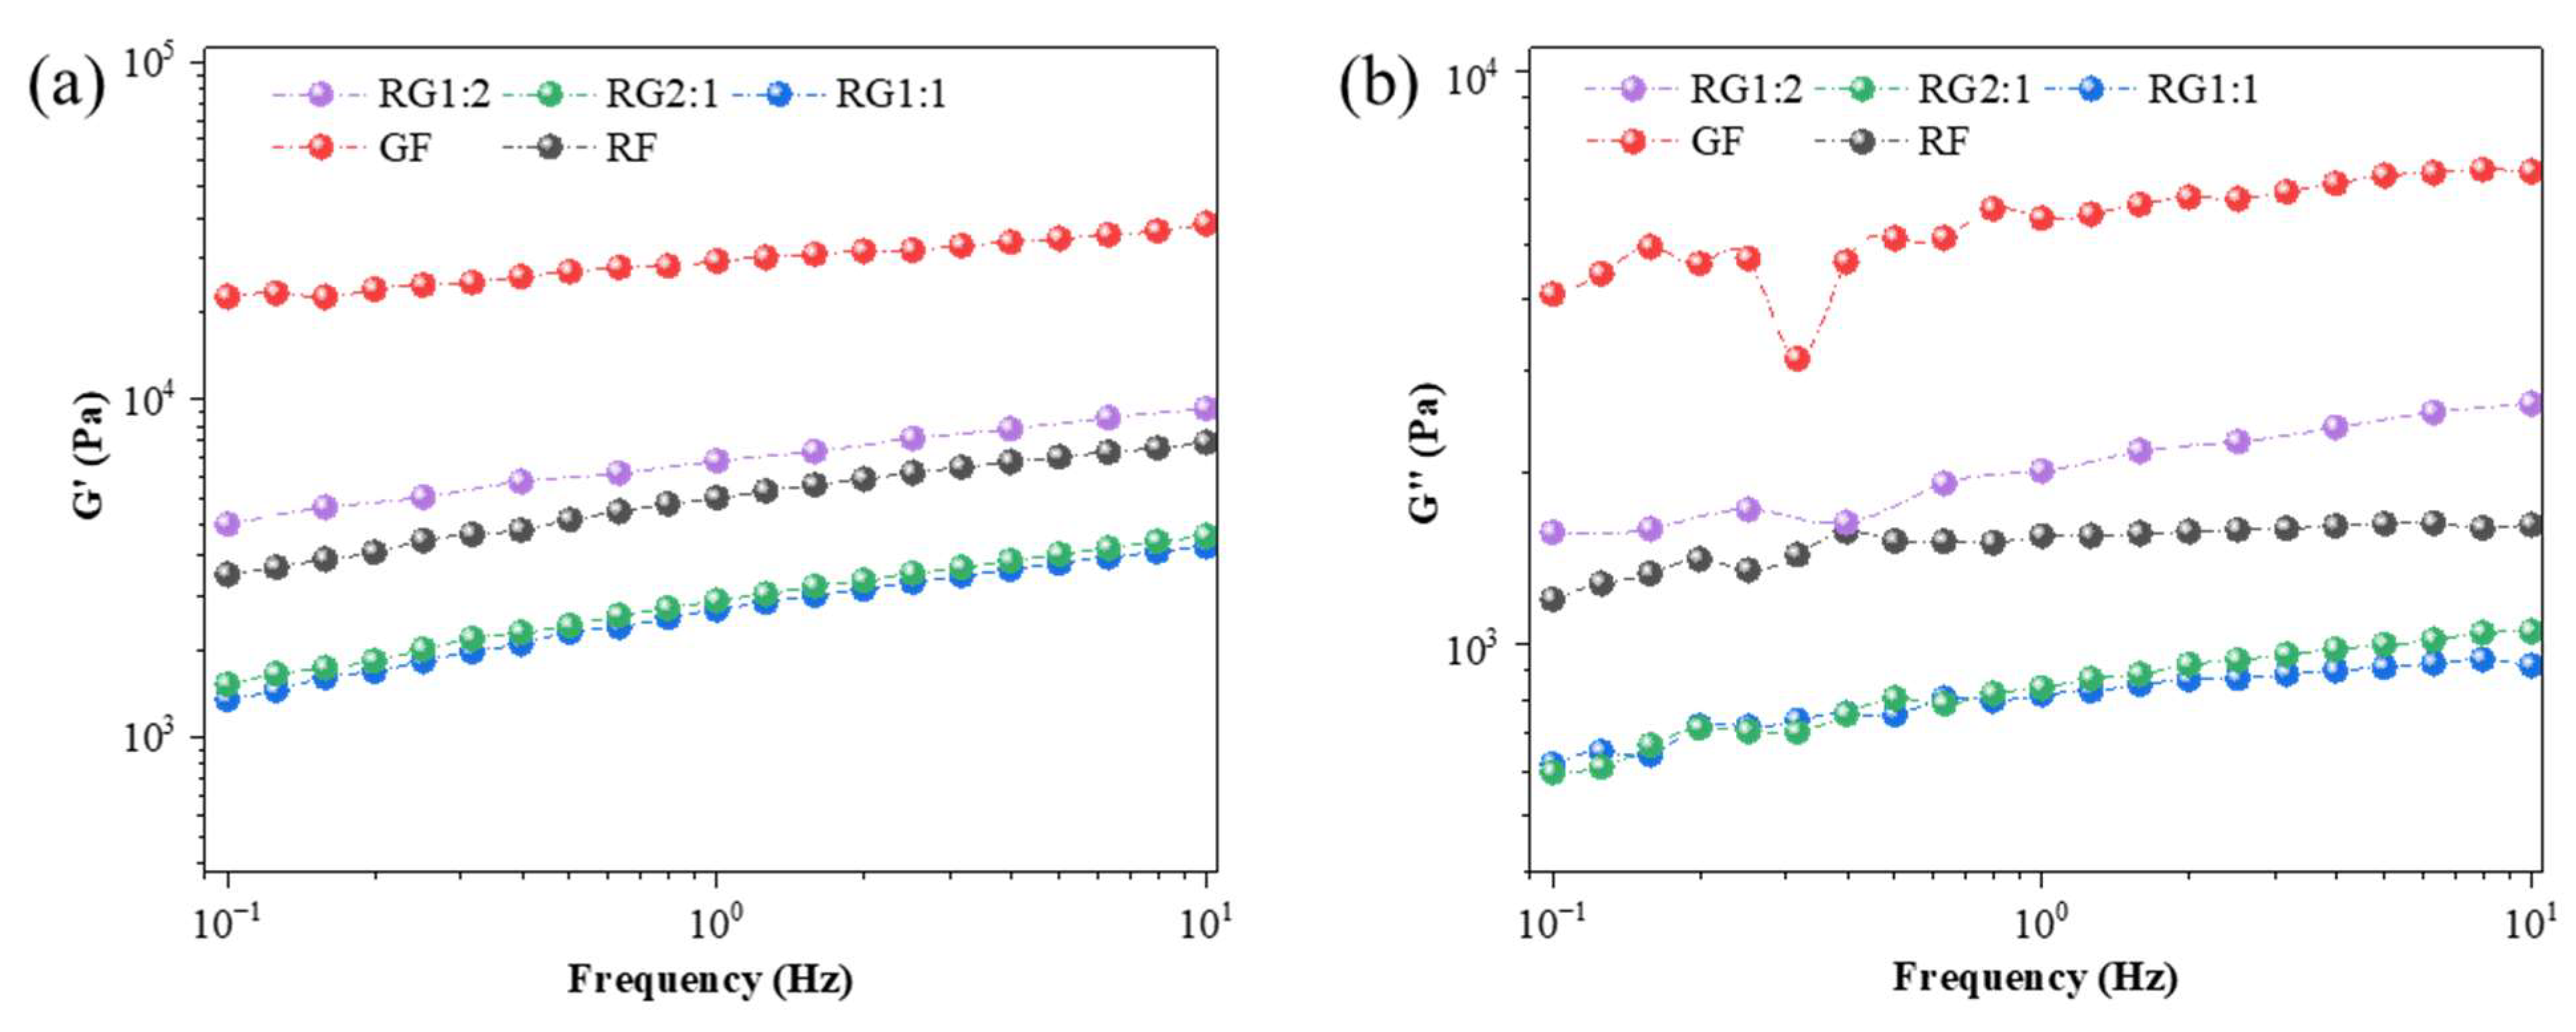
2.2.2. Static and Dynamic Rheological Properties
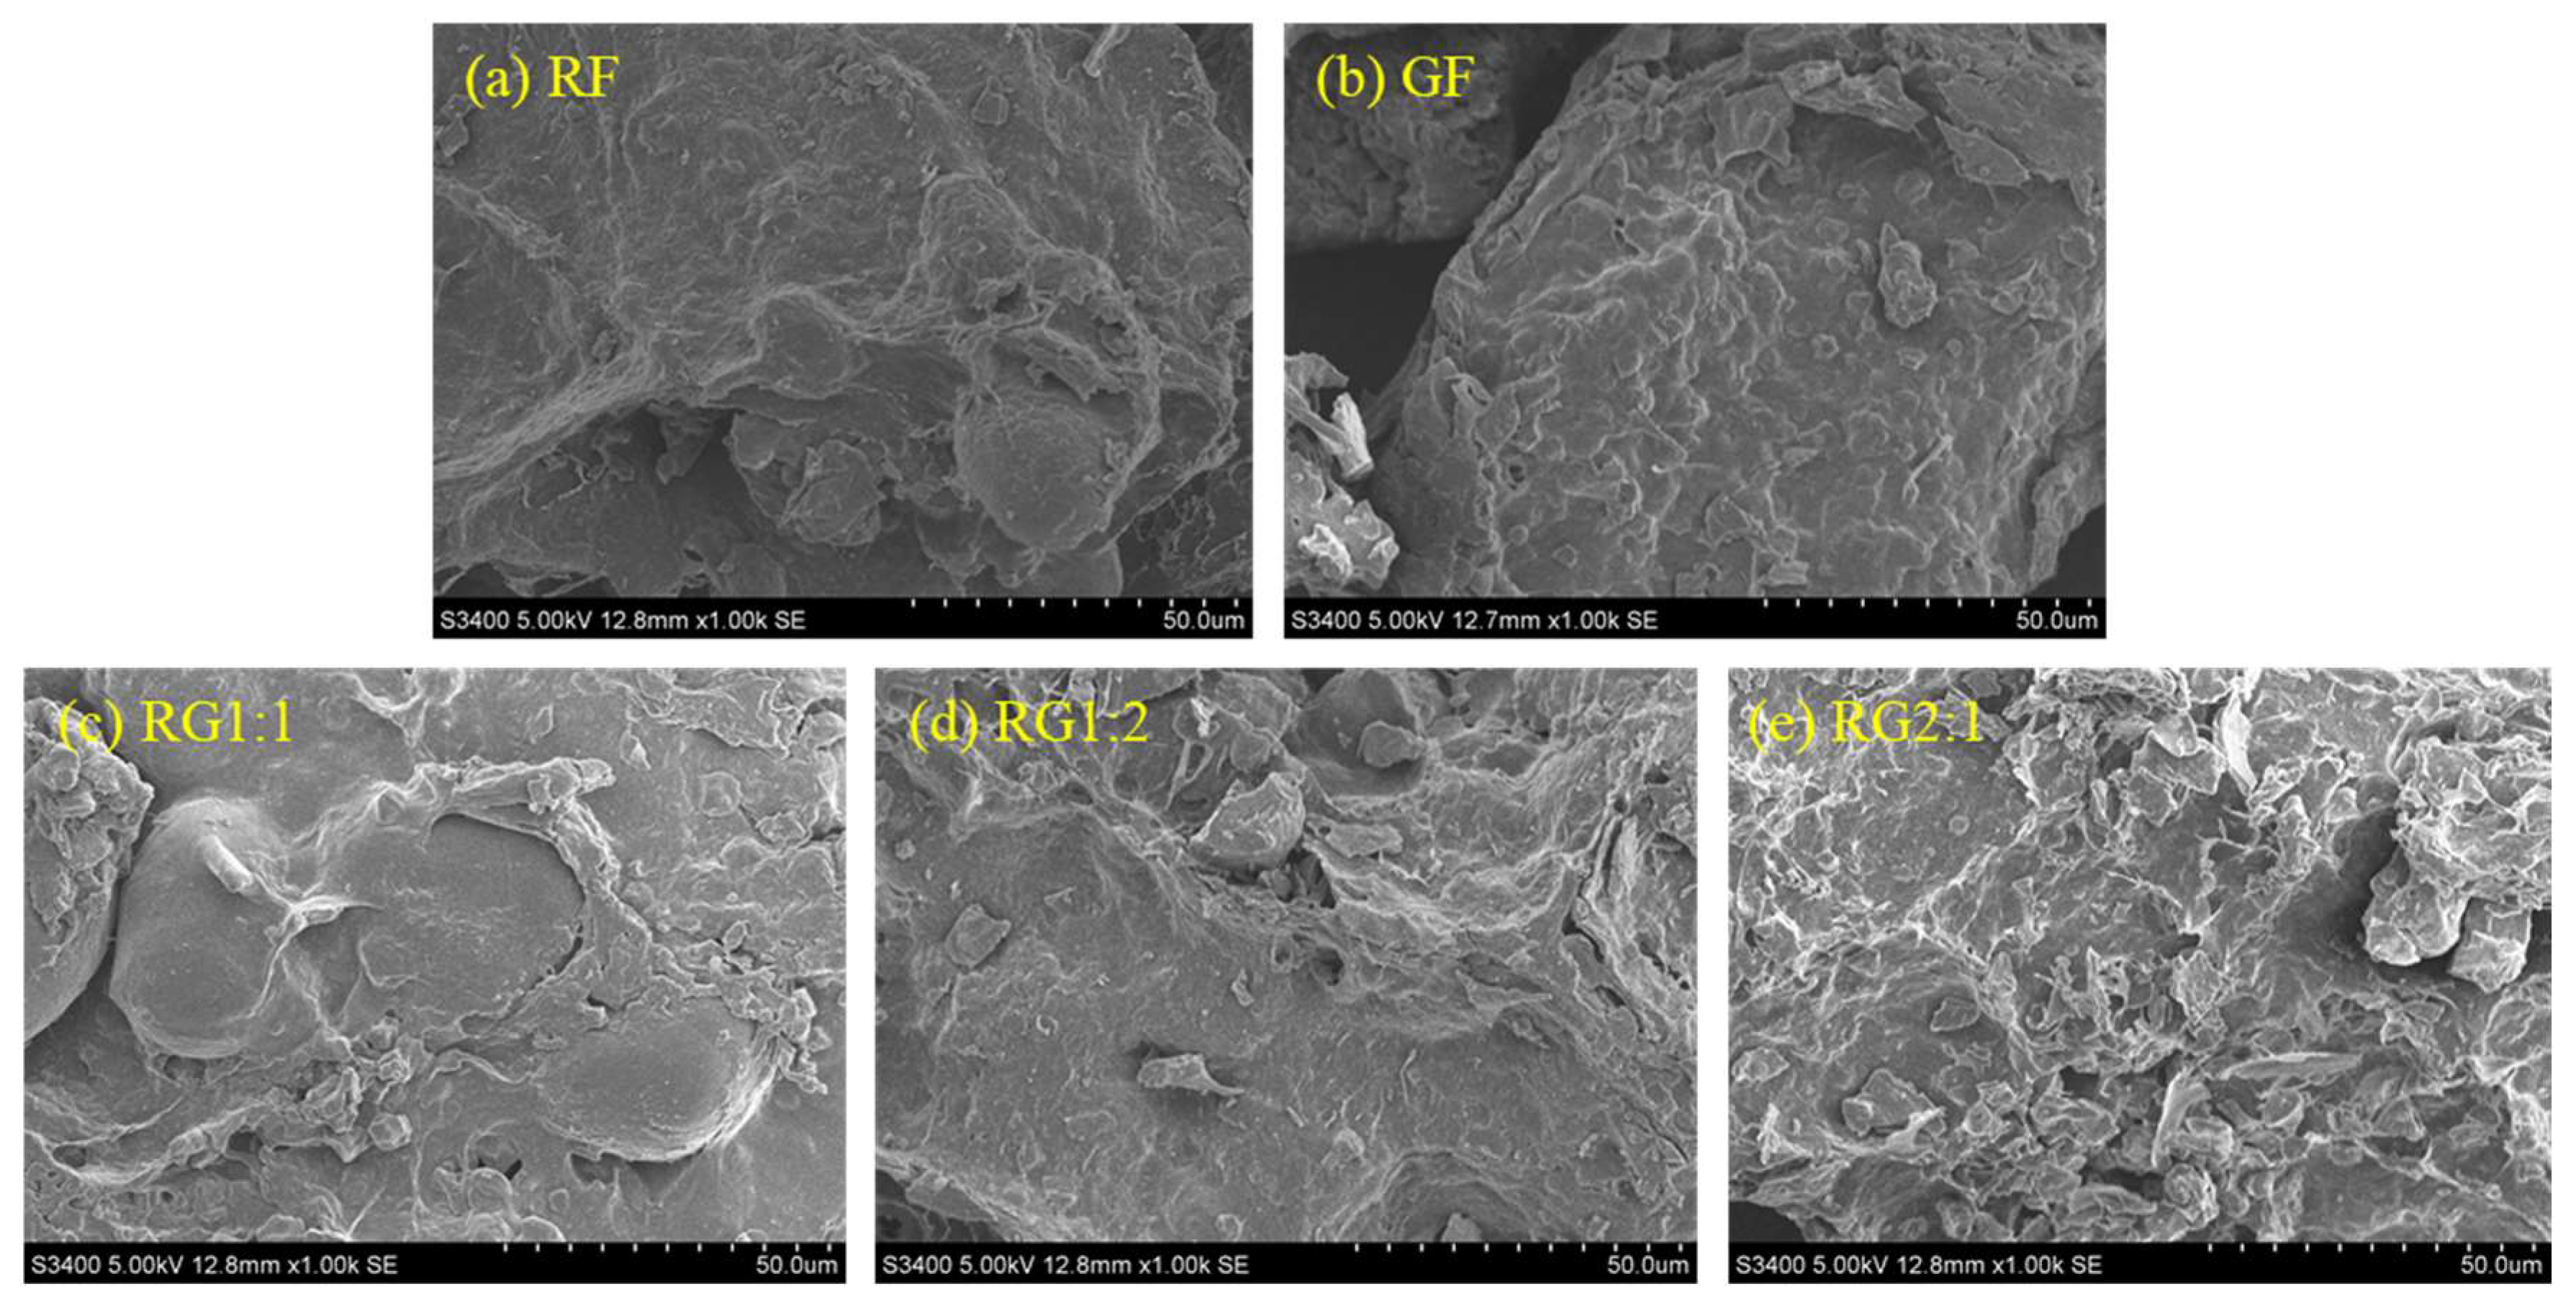
2.2.3. Scanning Electron Microscopy (SEM)
2.3. Color Measurement of the Gel
2.4. 3D Printing Process of the Gel
2.4.1. Determination of Printing Fidelity
2.4.2. Determination of Gel Texture
2.5. Sensory Evaluation
2.6. Statistical Analysis
3. Results and Discussion
3.1. FT-IR Analysis of the Gel
3.2. Static Rheological Properties
3.3. Dynamic Rheological Properties
3.4. Microstructure Changes of the Gel
3.5. Color Changes in the Gel
3.6. 3D Printing of the Gel
3.6.1. Printing Fidelity
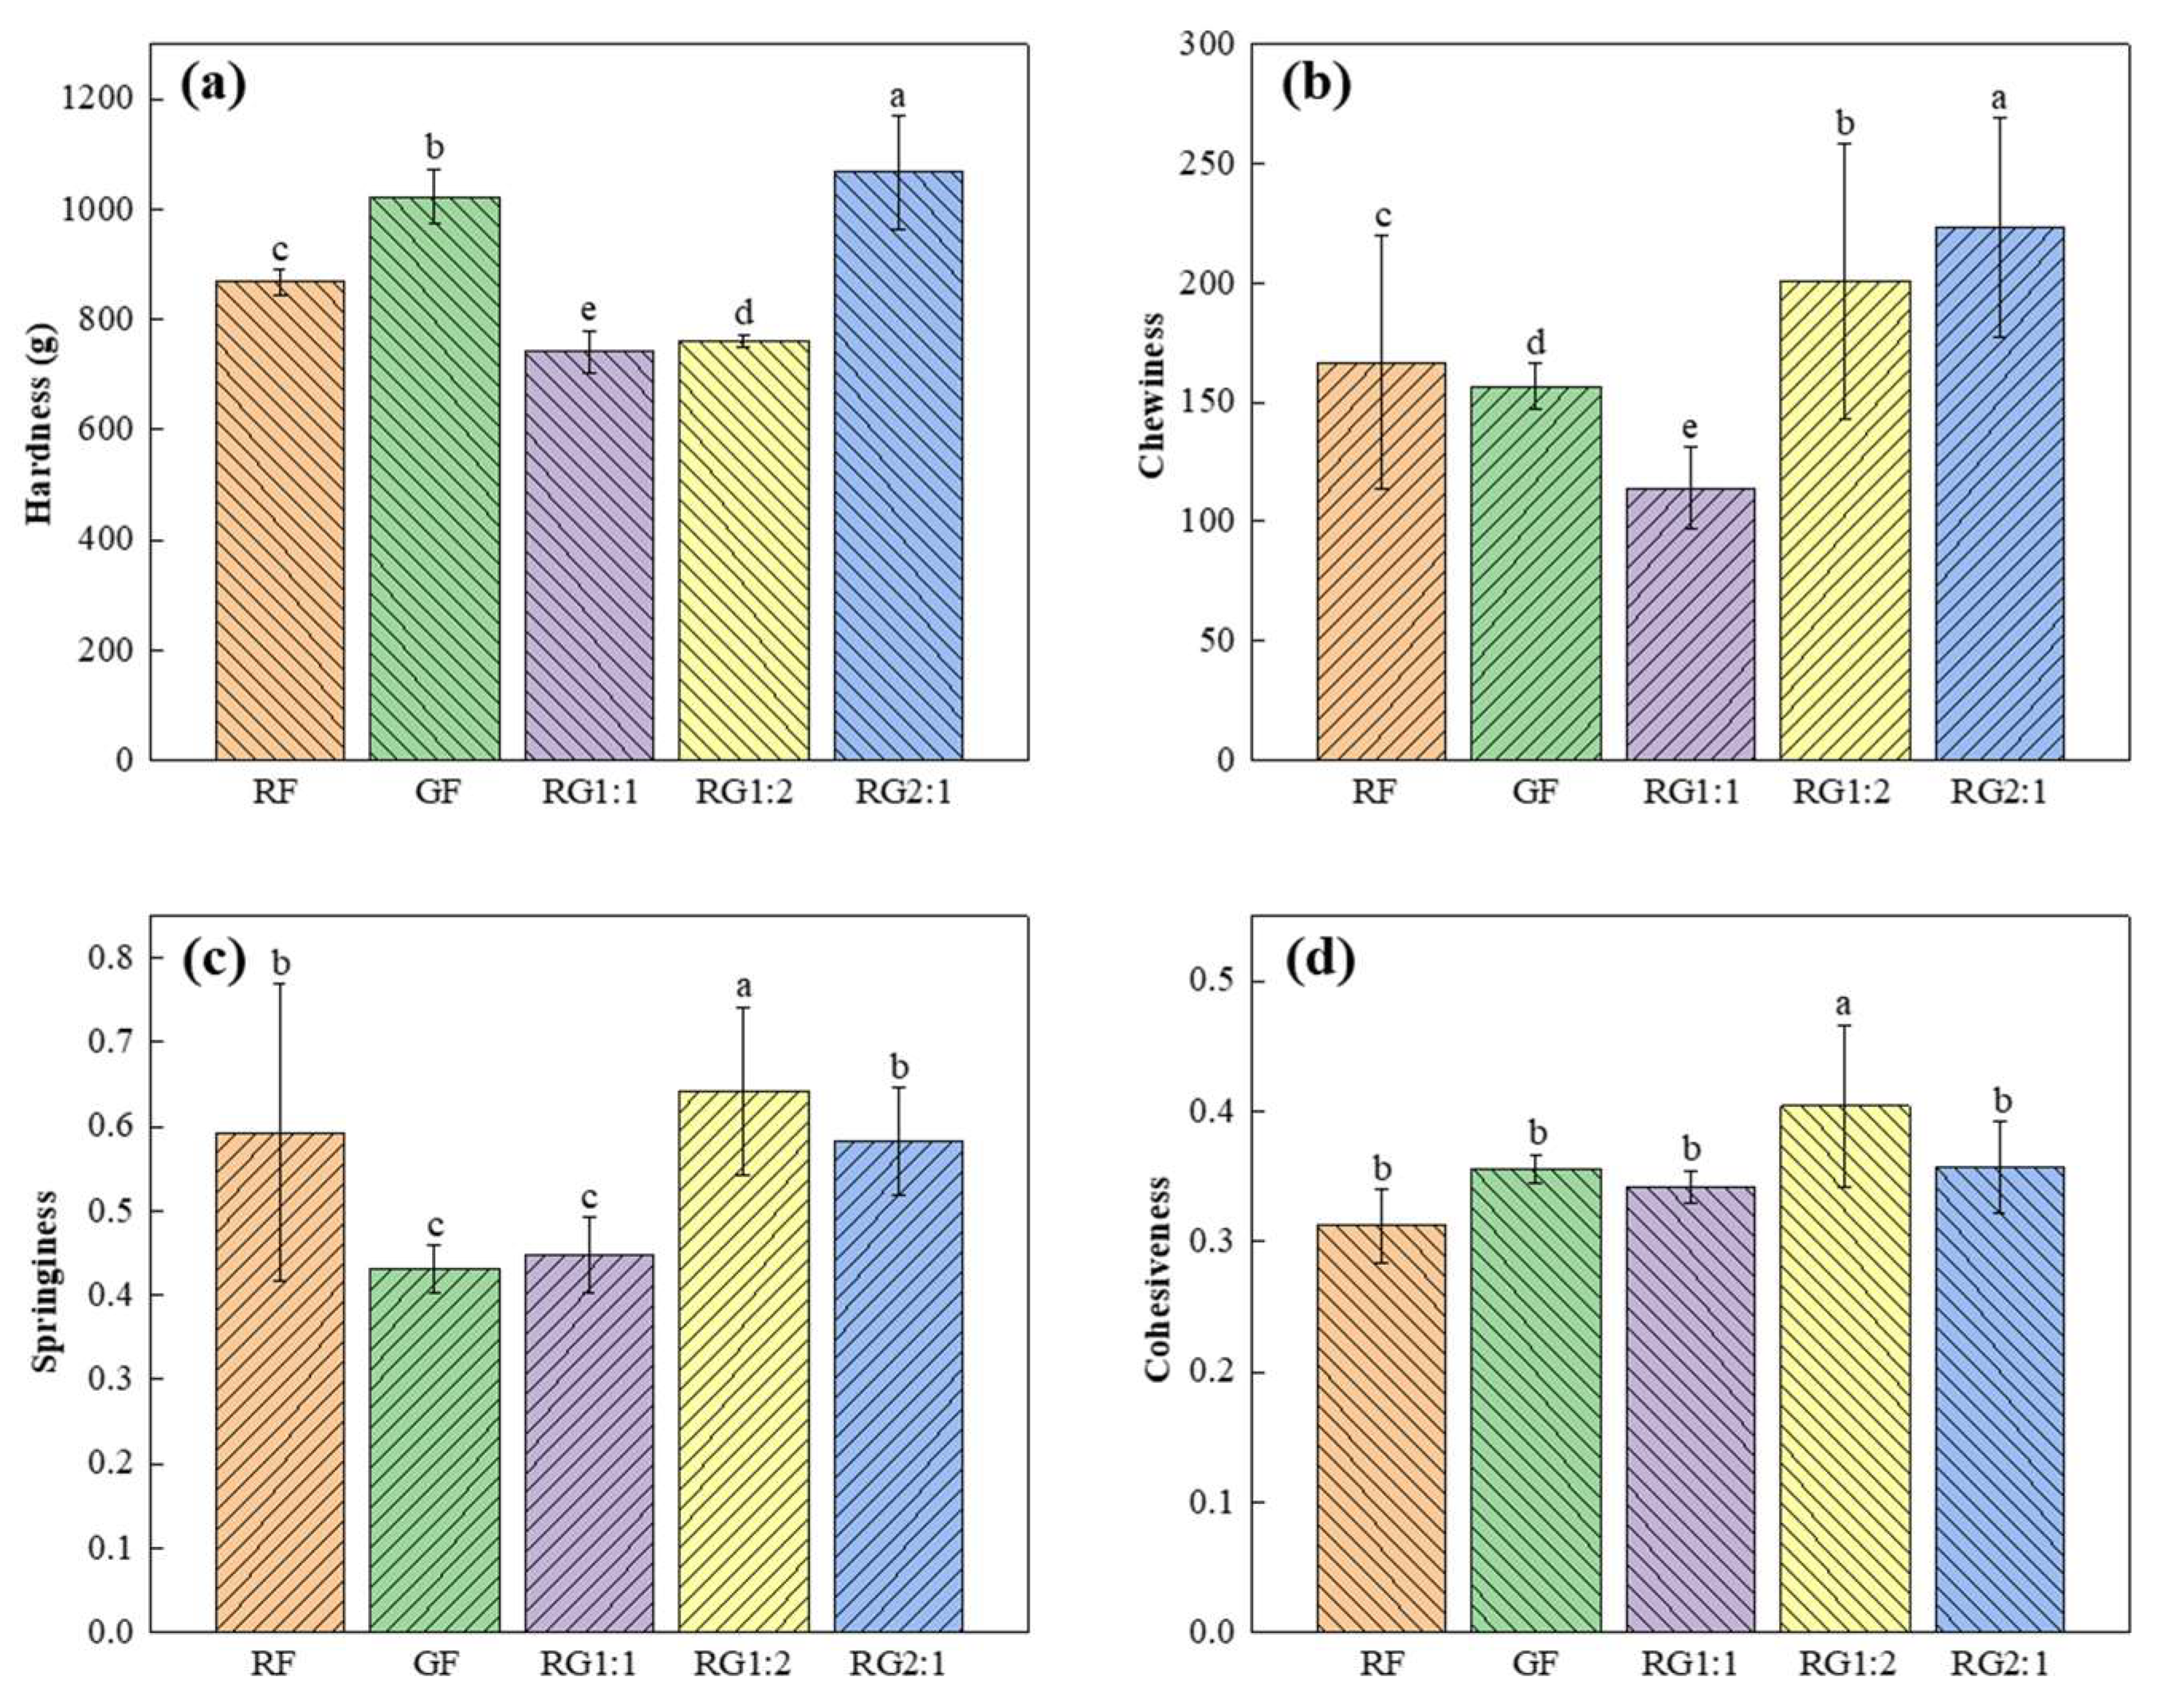
3.6.2. Texture Properties
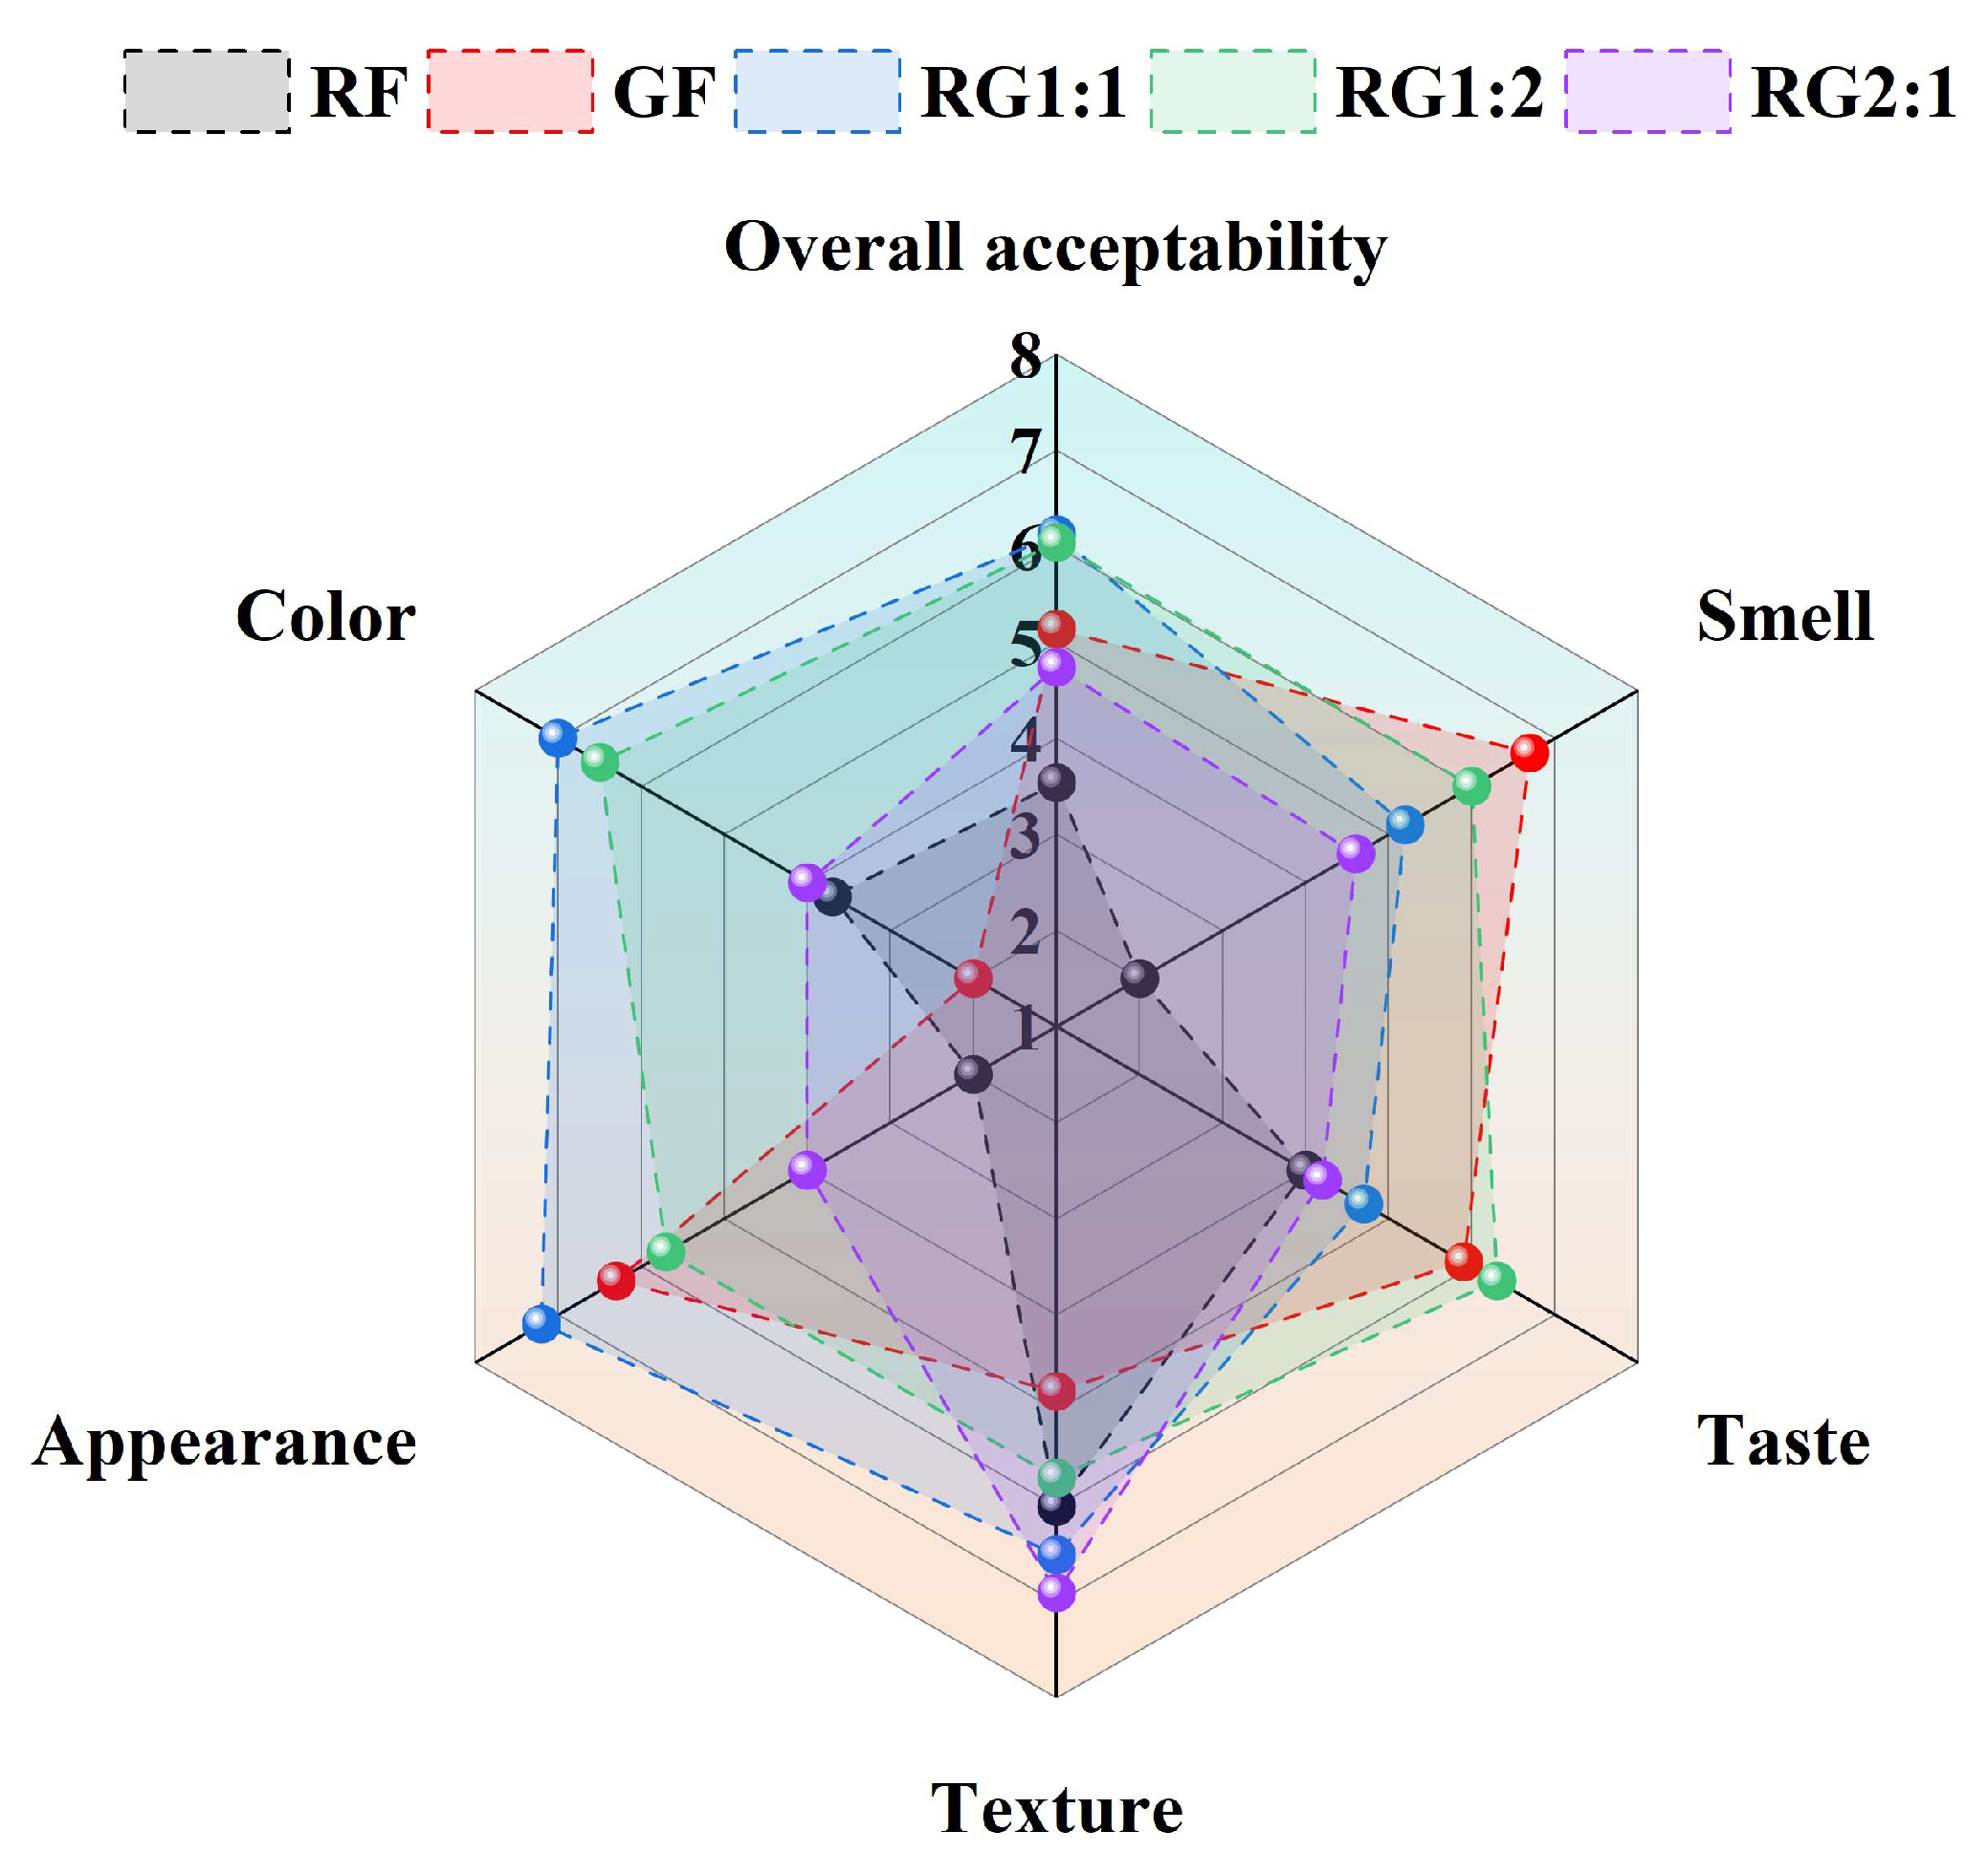
3.7. Sensory Evaluation of 3D-Printed Gel Samples
4. Conclusions
Author Contributions
Funding
Institutional Review Board Statement
Informed Consent Statement
Data Availability Statement
Conflicts of Interest
References
- Godoi, F.C.; Prakash, S.; Bhandari, B.R. 3D printing technologies applied for food design: Status and prospects. J. Food Eng. 2016, 179, 44–54. [Google Scholar] [CrossRef]
- Ganguly, S.; Tang, X.S. 3D Printing of High Strength Thermally Stable Sustainable Lightweight Corrosion-Resistant Nanocomposite by Solvent Exchange Postprocessing. ACS Sustain. Chem. Eng. 2024, 13, 423–435. [Google Scholar] [CrossRef]
- Sharma, R.; Chandra Nath, P.; Kumar Hazarika, T.; Ojha, A.; Kumar Nayak, P.; Sridhar, K. Recent advances in 3D printing properties of natural food gels: Application of innovative food additives. Food Chem. 2024, 432, 137196. [Google Scholar] [CrossRef]
- Dankar, I.; Haddarah, A.; Omar, F.E.L.; Sepulcre, F.; Pujolà, M. 3D printing technology: The new era for food customization and elaboration. Trends Food Sci. Technol. 2018, 75, 231–242. [Google Scholar] [CrossRef]
- Derossi, A.; Husain, A.; Caporizzi, R.; Severini, C. Manufacturing personalized food for people uniqueness. An overview from traditional to emerging technologies. Crit. Rev. Food Sci. Nutr. 2020, 60, 1141–1159. [Google Scholar] [CrossRef]
- Baiano, A. 3D printed foods: A comprehensive review on technologies, nutritional value, safety, consumer attitude, regulatory framework, and economic and sustainability issues. Food Rev. Int. 2020, 38, 986–1016. [Google Scholar] [CrossRef]
- Kewuyemi, Y.O.; Kesa, H.; Adebo, O.A. Trends in functional food development with three-dimensional (3D) food printing technology: Prospects for value-added traditionally processed food products. Crit. Rev. Food Sci. Nutr. 2021, 62, 7866–7904. [Google Scholar] [CrossRef] [PubMed]
- Ma, T.; Zhang, Y.; Ruan, K.; Guo, H.; He, M.; Shi, X.; Guo, Y.; Kong, J.; Gu, J. Advances in 3D Printing for Polymer Composites: A Review. InfoMat 2024, 6, e12568. [Google Scholar] [CrossRef]
- Hübner, F.; Arendt, E.K. Germination of cereal grains as a way to improve the nutritional value: A review. Crit. Rev. Food Sci. Nutr. 2013, 53, 853–861. [Google Scholar] [CrossRef]
- Beaulieu, J.C.; Boue, S.M.; Goufo, P. Health-promoting germinated rice and value-added foods: A comprehensive and systematic review of germination effects on brown rice. Crit. Rev. Food Sci. Nutr. 2023, 63, 11570–11603. [Google Scholar] [CrossRef]
- Yuan, L.; Zheng, X.; Shen, L. Continuous microwave drying of germinated red adzuki bean: Effects of various drying conditions on drying behavior and quality attributes. J. Food Process. Preserv. 2022, 46, e17090. [Google Scholar] [CrossRef]
- Portanguen, S.; Tournayre, P.; Sicard, J.; Astruc, T.; Mirade, P. Toward the design of functional foods and biobased products by 3D printing: A review. Trends Food Sci. Technol. 2019, 86, 188–198. [Google Scholar] [CrossRef]
- Mantihal, S.; Prakash, S.; Bhandari, B. Textural modification of 3D printed dark chocolate by varying internal infill structure. Food Res. Int. 2019, 121, 648–657. [Google Scholar] [CrossRef]
- Wang, D.; Guo, J.; Wang, Y.; Yang, Y.; Jiang, B.; Li, D.; Feng, Z.; Liu, C. Whey protein isolate nanofibrils as emulsifying agent to improve printability of Cheddar cheese for 3D printing. Food Hydrocoll. 2023, 142, 108807. [Google Scholar] [CrossRef]
- Derossi, A.; Caporizzi, R.; Paolillo, M.; Severini, C. Programmable texture properties of cereal-based snack mediated by 3D printing technology. J. Food Eng. 2021, 289, 110160. [Google Scholar] [CrossRef]
- Wilson, A.; Anukiruthika, T.; Moses, J.A.; Anandharamakrishnan, C. Customized shapes for chicken meat–based products: Feasibility study on 3D-printed nuggets. Food Bioprocess Technol. 2020, 13, 1968–1983. [Google Scholar] [CrossRef]
- Escalante-Aburto, A.; Trujillo-De Santiago, G.; Álvarez, M.M.; Chuck-Hernández, C. Advances and prospective applications of 3D food printing for health improvement and personalized nutrition. Compr. Rev. Food Sci. Food Saf. 2021, 20, 5722–5741. [Google Scholar] [CrossRef]
- Khemacheevakul, K.; Wolodko, J.; Nguyen, H.; Wismer, W. Temporal Sensory Perceptions of Sugar-Reduced 3D Printed Chocolates. Foods 2021, 10, 2082. [Google Scholar] [CrossRef]
- Riantiningtyas, R.R.; Sager, V.F.; Chow, C.Y.; Thybo, C.D.; Bredie, W.L.; Ahrné, L. 3D printing of a high protein yoghurt-based gel: Effect of protein enrichment and gelatine on physical and sensory properties. Food Res. Int. 2021, 147, 110517. [Google Scholar] [CrossRef]
- Yu, X.; Wang, Y.; Zhao, W.; Li, S.; Pan, J.; Prakash, S.; Dong, X. Hydrophilic colloids (Konjac gum/Xanthan gum) in 3D printing of transitional food from fish paste. Food Hydrocoll. 2023, 137, 108333. [Google Scholar] [CrossRef]
- Rong, L.; Chen, X.; Shen, M.; Yang, J.; Qi, X.; Li, Y.; Xie, J. The application of 3D printing technology on starch-based product: A review. Trends Food Sci. Technol. 2023, 134, 149–161. [Google Scholar] [CrossRef]
- Waghmare, R.; Suryawanshi, D.; Karadbhajne, S. Designing 3D printable food based on fruit and vegetable products—Opportunities and challenges. J. Food Sci. Technol. 2022, 60, 1447–1460. [Google Scholar] [CrossRef] [PubMed]
- Jiang, H.; Zheng, L.; Zou, Y.; Tong, Z.; Han, S.; Wang, S. 3D food printing: Main components selection by considering rheological properties. Crit. Rev. Food Sci. Nutr. 2019, 59, 2335–2347. [Google Scholar] [CrossRef] [PubMed]
- Nsengiyumva, E.M.; Alexandridis, P. Xanthan gum in aqueous solutions: Fundamentals and applications. Int. J. Biol. Macromol. 2022, 216, 583–604. [Google Scholar] [CrossRef]
- Thombare, N.; Jha, U.; Mishra, S.; Siddiqui, M. Guar gum as a promising starting material for diverse applications: A review. Int. J. Biol. Macromol. 2016, 88, 361–372. [Google Scholar] [CrossRef]
- Strother, H.; Moss, R.; Mcsweeney, M.B. Comparison of 3D printed and molded carrots produced with gelatin, guar gum and xanthan gum. J. Texture Stud. 2020, 51, 852–860. [Google Scholar] [CrossRef] [PubMed]
- Zhu, H.; Liu, C.; Bai, C.; Chen, Q.; Zhao, X.; Liu, C.; Zheng, X.; Shen, L. Effects of Microwave Vacuum Drying on Drying Characteristics, Quality Attributes and Starch Structure of Germinated Brown Rice. Int. J. Biol. Macromol. 2024, 282, 137153. [Google Scholar] [CrossRef]
- Huang, M.-S.; Zhang, M.; Bhandari, B. Assessing the 3D Printing Precision and Texture Properties of Brown Rice Induced by Infill Levels and Printing Variables. Food Bioprocess Technol. 2019, 12, 1185–1196. [Google Scholar] [CrossRef]
- Chen, H.; Xie, F.; Chen, L.; Zheng, B. Effect of rheological properties of potato, rice and corn starches on their hot-extrusion 3D printing behaviors. J. Food Eng. 2019, 244, 150–158. [Google Scholar] [CrossRef]
- Liu, Z.; Zhang, M.; Bhandari, B. Effect of gums on the rheological, microstructural and extrusion printing characteristics of mashed potatoes. Int. J. Biol. Macromol. 2018, 117, 1179–1187. [Google Scholar] [CrossRef]
- Shen, L.; Gao, M.; Zhu, Y.; Liu, C.; Wang, L.; Kamruzzaman, M.; Liu, C.; Zheng, X. Microwave drying of germinated brown rice: Correlation of drying characteristics with the final quality. Innov. Food Sci. Emerg. Technol. 2021, 70, 102673. [Google Scholar] [CrossRef]
- Yang, Z.; Lu, K.; Zhao, Y.; Shi, X.; Mao, W.; Zheng, B.; Xu, Y.; Gao, P.; Zhou, R. Effects of different heat-induced setting methods on the structural stability and properties of 3D-printed surimi gels. LWT 2024, 198, 115957. [Google Scholar] [CrossRef]
- Sanusi, M.S.; Sunmonu, M.O.; Alasi, S.O.; Adebiyi, A.A.; Tajudeen, A.A. Composition, bioactive constituents and glycemic index of brown rice-watermelon seeds extruded snacks as stimulated by extrusion conditions. Appl. Food Res. 2023, 3, 100287. [Google Scholar] [CrossRef]
- Shen, L.; Zhu, Y.; Wang, L.; Liu, C.; Liu, C.; Zheng, X. Improvement of cooking quality of germinated brown rice attributed to the fissures caused by microwave drying. J. Food Sci. Technol. 2019, 56, 2737–2749. [Google Scholar] [CrossRef]
- Li, Y.; Zhang, J.; Wang, J.; Ren, J.; Cao, C.; Liu, Q.; Huang, X. Evaluation of drying characteristics and quality attributes for microwave vacuum drying of pork skin crisps. Foods 2024, 13, 4020. [Google Scholar] [CrossRef]
- Islam, M.F.; Islam, S.; Miah, M.A.S.; Bhuiyan, M.N.I.; Abedin, N.; Mondol, M.M.H.; Sultana, S.; Linkon, K.M.M.R. Quality assessment and sensory evaluation of green banana starch enriched instant noodles. Appl. Food Res. 2024, 4, 100431. [Google Scholar] [CrossRef]
- Bai, J.; Dong, M.; Li, J.; Tian, L.; Xiong, D.; Jia, J.; Yang, L.; Liu, X.; Duan, X. Effects of egg white on physicochemical and functional characteristics of steamed cold noodles (a wheat starch gel food). LWT 2022, 169, 114057. [Google Scholar] [CrossRef]
- Jiang, X.; Dai, W.; Yan, Q.; Chen, D.; Li, Z.; Sun, X.; Ding, J.; Li, Z.; Fang, Y. Glutinous rice gel as all-natural ink supply for extrusion-based food 3D printing—the chemical basis of gel printability. Food Chem. 2025, 467, 142310. [Google Scholar] [CrossRef] [PubMed]
- Li, J.; Xu, X.; Zhao, Q.; Zhang, J.; Zhu, P.; Xu, D.; Jin, Y.; Wu, F. Effects of ratios of A- and B-type wheat starch on liangpi (a starch gel food) quality and its potential mechanism. Carbohydr. Polym. 2025, 352, 123194. [Google Scholar] [CrossRef]
- Liu, Y.; Tang, T.; Duan, S.; Qin, Z.; Li, C.; Zhang, Z.; Liu, A.; Wu, D.; Chen, H.; Han, G. Effects of sodium alginate and rice variety on the physicochemical characteristics and 3D printing feasibility of rice paste. LWT 2020, 127, 109360. [Google Scholar] [CrossRef]
- Chuanxing, F.; Qi, W.; Hui, L.; Quancheng, Z.; Wang, M. Effects of pea protein on the properties of potato starch-based 3D printing materials. Int. J. Food Eng. 2018, 14, 20170297. [Google Scholar] [CrossRef]
- Bareen, M.A.; Sahu, J.K.; Prakash, S.; Bhandari, B.; Naik, S. A novel approach to produce ready-to-eat sweetmeats with variable textures using 3D printing. J. Food Eng. 2023, 344, 111410. [Google Scholar] [CrossRef]
- Mantihal, S.; Prakash, S.; Godoi, F.C.; Bhandari, B. Effect of additives on thermal, rheological and tribological properties of 3D printed dark chocolate. Food Res. Int. 2019, 119, 161–169. [Google Scholar] [CrossRef] [PubMed]
- Ma, S.; Zhu, P.; Wang, M. Effects of konjac glucomannan on pasting and rheological properties of corn starch. Food Hydrocoll. 2019, 89, 234–240. [Google Scholar] [CrossRef]
- Liu, Y.; Sun, Q.; Wei, S.; Xia, Q.; Pan, Y.; Liu, S.; Ji, H.; Deng, C.; Hao, J. LF-NMR as a tool for predicting the 3D printability of surimi-starch systems. Food Chem. 2022, 374, 131727. [Google Scholar] [CrossRef]
- Paxton, N.; Smolan, W.; Böck, T.; Melchels, F.; Groll, J.; Jungst, T. Proposal to assess printability of bioinks for extrusion-based bioprinting and evaluation of rheological properties governing bioprintability. Biofabrication 2017, 9, 44107. [Google Scholar] [CrossRef]
- Zhang, M.; Vora, A.; Han, W.; Wojtecki, R.J.; Maune, H.; Le, A.B.A.; Thompson, L.E.; McClelland, G.M.; Ribet, F.; Engler, A.C.; et al. Dual-Responsive Hydrogels for Direct-Write 3D Printing. Macromolecules 2015, 48, 6482–6488. [Google Scholar] [CrossRef]
- Liu, Z.; Bhandari, B.; Prakash, S.; Mantihal, S.; Zhang, M. Linking rheology and printability of a multicomponent gel system of carrageenan-xanthan-starch in extrusion based additive manufacturing. Food Hydrocoll. 2019, 87, 413–424. [Google Scholar] [CrossRef]
- Cheng, Y.; Yuqing, H.; Xiao, L.; Gao, W.; Kang, X.; Sui, J.; Cui, B. Impact of Starch Amylose and Amylopectin on the Rheological and 3D Printing Properties of Cornstarch. Int. J. Biol. Macromol. 2024, 278, 134403. [Google Scholar] [CrossRef]
- Maldonado-Rosas, R.; Tejada-Ortigoza, V.; Cuan-Urquizo, E.; Mendoza-Cachú, D.; Morales-de La Pena, M.; Alvarado-Orozco, J.M.; Campanella, O.H. Evaluation of rheology and printability of 3D printing nutritious food with complex formulations. Addit. Manuf. 2022, 58, 103030. [Google Scholar] [CrossRef]
- Huang, M.-S.; Zhang, M.; Guo, C.-F. 3D printability of brown rice gel modified by some food hydrocolloids. J. Food Process. Preserv. 2020, 44, e14502. [Google Scholar] [CrossRef]
- Mantihal, S.; Prakash, S.; Godoi, F.C.; Bhandari, B. Optimization of chocolate 3D printing by correlating thermal and flow properties with 3D structure modeling. Innov. Food Sci. Emerg. Technol. 2017, 44, 21–29. [Google Scholar] [CrossRef]
- Zhang, G.; Chen, Y.; Pan, J.; Qiu, Y.; Cui, P.; Lyu, F.; Zhang, J. Effect of guar gum on the physicochemical properties and in vitro digestive characteristics of extruded starches. Int. J. Biol. Macromol. 2024, 275, 133176. [Google Scholar] [CrossRef] [PubMed]
- Yang, C.; Zhong, F.; Douglas Goff, H.; Li, Y. Study on starch-protein interactions and their effects on physicochemical and digestible properties of the blends. Food Chem. 2019, 280, 51–58. [Google Scholar] [CrossRef]
- Liu, Y.; Tang, T.; Duan, S.; Qin, Z.; Zhao, H.; Wang, M.; Li, C.; Zhang, Z.; Liu, A.; Han, G. Applicability of rice doughs as promising food materials in extrusion-based 3D printing. Food Bioprocess Technol. 2020, 13, 548–563. [Google Scholar] [CrossRef]
- Wijesekara, T.; Xu, B. A critical review on the stability of natural food pigments and stabilization techniques. Food Res. Int. 2024, 179, 114011. [Google Scholar] [CrossRef]
- Lan, T.; Qian, S.; Song, T.; Zhang, H.; Liu, J. The chromogenic mechanism of natural pigments and the methods and techniques to improve their stability: A systematic review. Food Chem. 2023, 407, 134875. [Google Scholar] [CrossRef]
- Liu, Y.; Sun, Q.; Wei, S.; Xia, Q.; Pan, Y.; Ji, H.; Deng, C.; Hao, J.; Liu, S. Insight into the correlations among rheological behaviour, protein molecular structure and 3D printability during the processing of surimi from golden pompano (Trachinotus ovatus). Food Chem. 2022, 371, 131046. [Google Scholar] [CrossRef]
- Liu, Y.; Li, D.; Hu, J.; Li, P.; He, L.; Yang, N.; Nishinari, K. New insight into synergistic interaction between the backbone or side chain of xanthan gum and the backbone of Gleditsia sinensis polysaccharide. Int. J. Biol. Macromol. 2024, 279, 135396. [Google Scholar] [CrossRef]
- Wanjun, X.; Qingqing, Y.; Yaqi, Z.; Yu, F.; Qiaoyu, C.; Ruichang, G.; Yulong, B. Insight into the mechanism of the decrease in mechanical strength and water-holding capacity of gels made from oxidized gelatin. Int. J. Biol. Macromol. 2024, 258, 128842. [Google Scholar] [CrossRef]
- Jiang, Q.; Wei, X.; Liu, Q.; Zhang, T.; Chen, Q.; Yu, X.; Jiang, H. Rheo-fermentation properties of bread dough with different gluten contents processed by 3D printing. Food Chem. 2024, 433, 137318. [Google Scholar] [CrossRef] [PubMed]
- Zhong, Y.; Zeng, S.; Lv, Y.; Lv, W.; Xiao, H.; Sheng, S. Effect of guar gum on the rheological properties, microstructure and 3D printing performance of egg yolk powder-potato starch composite gel. Food Hydrocoll. 2024, 153, 110018. [Google Scholar] [CrossRef]
- Yan, X.; Jia, Y.; Man, H.; Liu, L.; Sun, S.; Qi, B.; Li, Y. Intermolecular interactions and gel properties of composite agglomerative networks based on oppositely charged polymers: Effects of pH and ionic strength. Food Hydrocoll. 2023, 139, 108557. [Google Scholar] [CrossRef]
- Jie, Y.; Chen, F. Progress in the Application of Food-Grade Emulsions. Foods 2022, 11, 2883. [Google Scholar] [CrossRef]
- Zhao, N.; Guo, C.; Liu, Z.; Chen, L.; Hu, Y.; Han, M.; Huang, F.; Kang, Z.; Feng, X. Effects of different hydrocolloids on the 3D printing and thermal stability of chicken paste. Int. J. Biol. Macromol. 2024, 277, 134006. [Google Scholar] [CrossRef] [PubMed]
- Carvajal-Mena, N.; Tabilo-Munizaga, G.; Pérez-Won, M.; Herrera-Lavados, C.; Lemus-Mondaca, R.; Moreno-Osorio, L. Evaluation of physicochemical properties of starch-protein gels: Printability and postprocessing. LWT 2023, 182, 114797. [Google Scholar] [CrossRef]
- Guénard-Lampron, V.; Masson, M.; Leichtnam, O.; Blumenthal, D. Impact of 3D printing and post-processing parameters on shape, texture and microstructure of carrot appetizer cake. Innov. Food Sci. Emerg. Technol. 2021, 72, 102738. [Google Scholar] [CrossRef]


| Formulations | Ingredients of Base Material | Mass of Base Material (g) | Mass of XG-GG (g) | Mass of Distilled Water (g) |
|---|---|---|---|---|
| RF | RABF | 36 | 3 | 108 |
| GF | GBRF | 36 | ||
| RG1:1 | RABF/GBRF (1:1) | 18:18 | ||
| RG1:2 | RABF/GBRF (1:2) | 12:24 | ||
| RG2:1 | RABF/GBRF (2:1) | 24:12 |
| Sensory Item | Scoring Criteria | Score |
|---|---|---|
| Color | Too light or too dark, failure to stimulate appetite | 0–2 |
| Normal color and even distribution | 3–5 | |
| Evenly distributed and can arouse appetite | 6–8 | |
| Smell | Unacceptable odor | 0–2 |
| No odor or light aroma | 3–5 | |
| Strong aroma | 6–8 | |
| Taste | Unacceptable taste or no taste | 0–2 |
| Light sweet taste, within the acceptable range | 3–5 | |
| Sweet and delicious taste | 6–8 | |
| Texture | Print lines are rough or broken in large areas | 0–2 |
| Print lines are even or have some small breaks | 3–5 | |
| Printed lines are even and smooth, with no obvious fracture on the surface | 6–8 | |
| Appearance | Large areas of missing parts on the surface and accumulation at the corners | 0–2 |
| Relatively slight depressions, a small amount of corner accumulation, and a clear shape | 3–5 | |
| No obvious dent on the whole, no corner accumulation, and with a distinct honeycomb structure | 6–8 | |
| Overall acceptability | Overall evaluation is poor | 0–2 |
| Overall evaluation is average | 3–5 | |
| Overall evaluation is good | 6–8 |
| Group | Non-Newtonian Index (n) | Consistency Factor (K) | R2 |
|---|---|---|---|
| RF | 0.281 ± 0.01 c | 538.967 ± 14.97 b | 0.984 |
| GF | 0.246 ± 0.01 b | 899.287 ± 87.83 d | 0.997 |
| RG1:1 | 0.209 ± 0.01 a | 994.867 ± 96.74 e | 0.996 |
| RG1:2 | 0.213 ± 0.01 a | 500.397 ± 61.67 a | 0.991 |
| RG2:1 | 0.256 ± 0.01 b | 704.853 ± 92.73 c | 0.999 |
| Group | L* | a* | b* | ΔE* | Actual Color |
|---|---|---|---|---|---|
| RF | 54.98 ± 0.80 e | 5.77 ± 0.12 a | 8.88 ± 0.14 d | 0.677 ± 0.60 b | 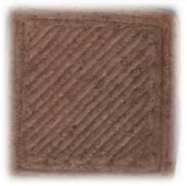 |
| GF | 76.17 ± 0.52 a | 1.67 ± 0.18 d | 12.47 ± 0.36 a | 0.623 ± 0.66 c | 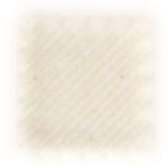 |
| RG1:1 | 59.43 ± 1.60 c | 4.73 ± 0.14 b | 9.30 ± 0.22 c | 0.403 ± 0.22 d | 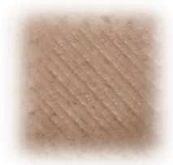 |
| RG1:2 | 62.36 ± 0.50 b | 4.28 ± 0.24 c | 9.60 ± 0.32 b | 0.603 ± 0.86 c | 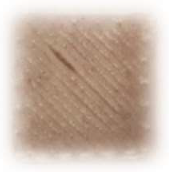 |
| RG2:1 | 57.70 ± 1.02 d | 5.72 ± 0.35 a | 9.65 ± 0.45 b | 1.872 ± 1.39 a | 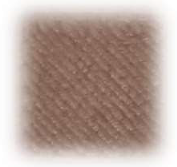 |
| Groups | SSI (%) | ||||
|---|---|---|---|---|---|
| 0.5 h | 1 h | 1.5 h | 2 h | Mean ± SD | |
| RF | 97.56 ± 0.31 c | 96.98 ± 0.12 d | 94.79 ± 0.04 d | 97.17 ± 0.22 d | 96.63 ± 1.14 b |
| GF | 99.21 ± 0.11 b | 99.87 ± 0.06 a | 99.69 ± 0.16 a | 99.92 ± 0.08 a | 99.68 ± 0.31 a |
| RG1:1 | 99.20 ± 0.07 b | 98.44 ± 0.05 c | 99.14 ± 0.11 b | 98.88 ± 0.10 c | 98.92 ± 0.32 a |
| RG1:2 | 99.83 ± 0.05 a | 98.80 ± 0.05 b | 97.55 ± 0.10 c | 99.79 ± 0.05 a | 98.99 ± 0.97 a |
| RG2:1 | 99.55 ± 0.09 ab | 98.75 ± 0.04 b | 99.67 ± 0.09 a | 99.51 ± 0.07 b | 99.37 ± 0.39 a |
Disclaimer/Publisher’s Note: The statements, opinions and data contained in all publications are solely those of the individual author(s) and contributor(s) and not of MDPI and/or the editor(s). MDPI and/or the editor(s) disclaim responsibility for any injury to people or property resulting from any ideas, methods, instructions or products referred to in the content. |
© 2025 by the authors. Licensee MDPI, Basel, Switzerland. This article is an open access article distributed under the terms and conditions of the Creative Commons Attribution (CC BY) license (https://creativecommons.org/licenses/by/4.0/).
Share and Cite
Liu, R.; Zhuang, Y.; Song, J.; Shen, L.; Yin, Y. Evaluation of 3D Printing of Cereal–Legume Starch-Based Gels Formulated with Red Adzuki Bean and Germinated Brown Rice Flour. Foods 2025, 14, 1791. https://doi.org/10.3390/foods14101791
Liu R, Zhuang Y, Song J, Shen L, Yin Y. Evaluation of 3D Printing of Cereal–Legume Starch-Based Gels Formulated with Red Adzuki Bean and Germinated Brown Rice Flour. Foods. 2025; 14(10):1791. https://doi.org/10.3390/foods14101791
Chicago/Turabian StyleLiu, Ran, Yu Zhuang, Jiakai Song, Liuyang Shen, and Yanling Yin. 2025. "Evaluation of 3D Printing of Cereal–Legume Starch-Based Gels Formulated with Red Adzuki Bean and Germinated Brown Rice Flour" Foods 14, no. 10: 1791. https://doi.org/10.3390/foods14101791
APA StyleLiu, R., Zhuang, Y., Song, J., Shen, L., & Yin, Y. (2025). Evaluation of 3D Printing of Cereal–Legume Starch-Based Gels Formulated with Red Adzuki Bean and Germinated Brown Rice Flour. Foods, 14(10), 1791. https://doi.org/10.3390/foods14101791