
Preliminary Exploration on the Regulatory Mechanism of Ionic Strength on Conformation and Hydration of Silver Carp Myosin

 ,
,  and
and
Abstract
1. Introduction
2. Materials and Methods
2.1. Materials
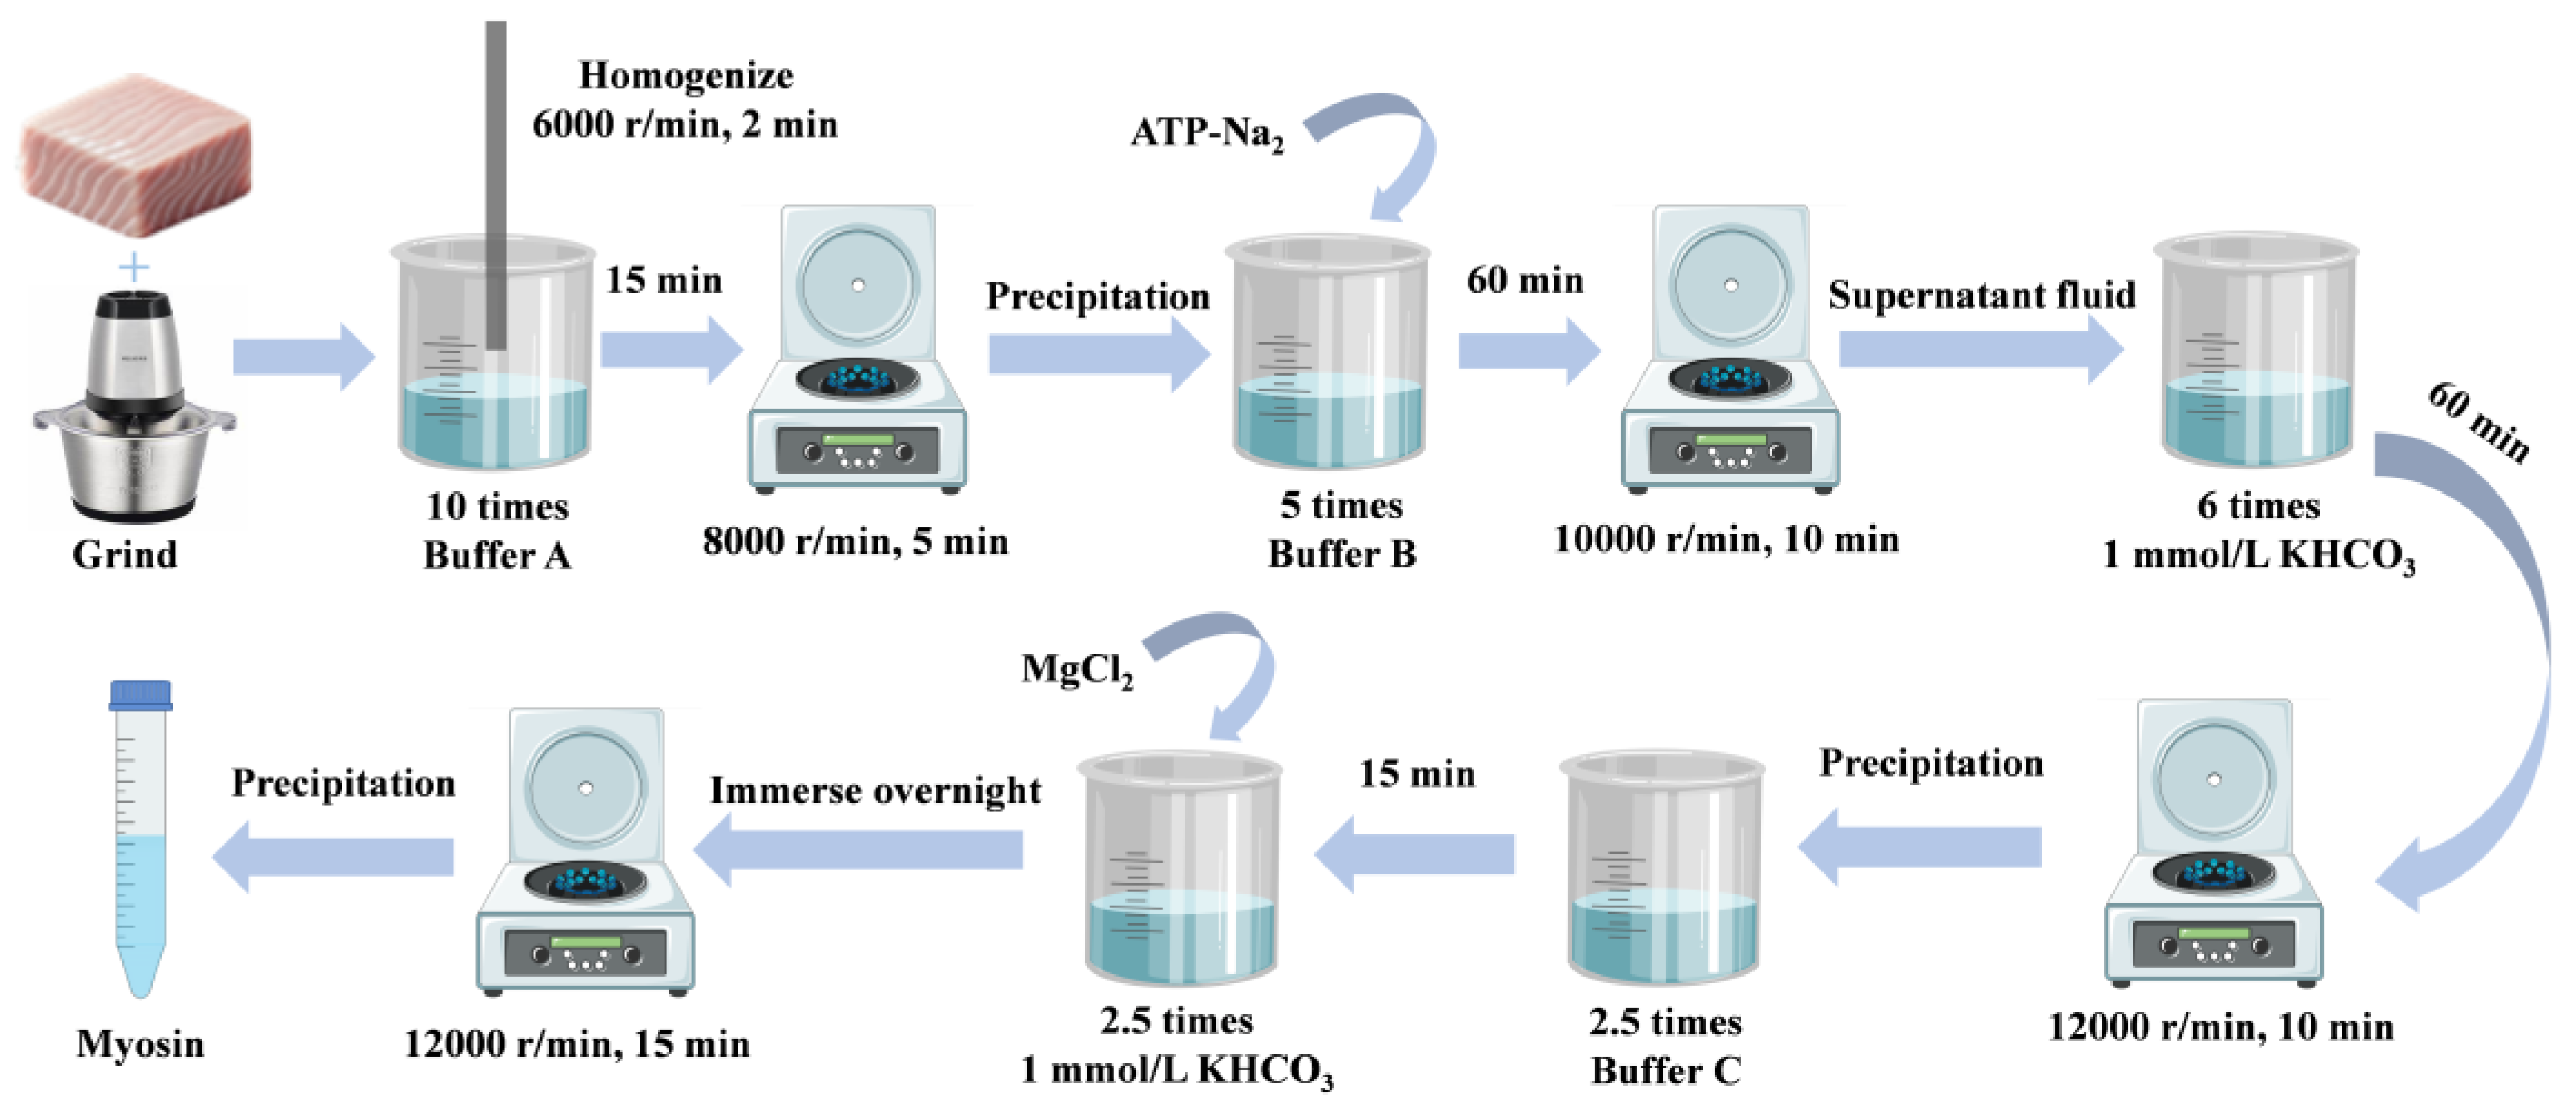
2.2. Myosin Extraction
2.3. Determination of Solubility
2.4. Determination of Turbidity
2.5. Determination of Particle Size
2.6. Determination of Zeta Potential
2.7. Observation of Microstructure
2.8. Determination of the Secondary Structure
2.9. Determination of the Tertiary Structure
2.9.1. Determination of UV Absorption Spectra and Second Derivatives
2.9.2. Determination of Fluorescence Spectra
2.10. Determination of Surface Hydrophobicity (S0-ANS)
2.11. Determination of Hydration Behavior
2.11.1. Determination of Thermal Changes in the Interaction of Myosin with NaCl
2.11.2. Determination of the Interaction of Myosin with NaCl
2.11.3. Determination of Thermal Characteristics of Melting Phase Transition
2.12. Molecular Dynamics Simulation (MD)
2.13. Statistical Analysis
3. Results
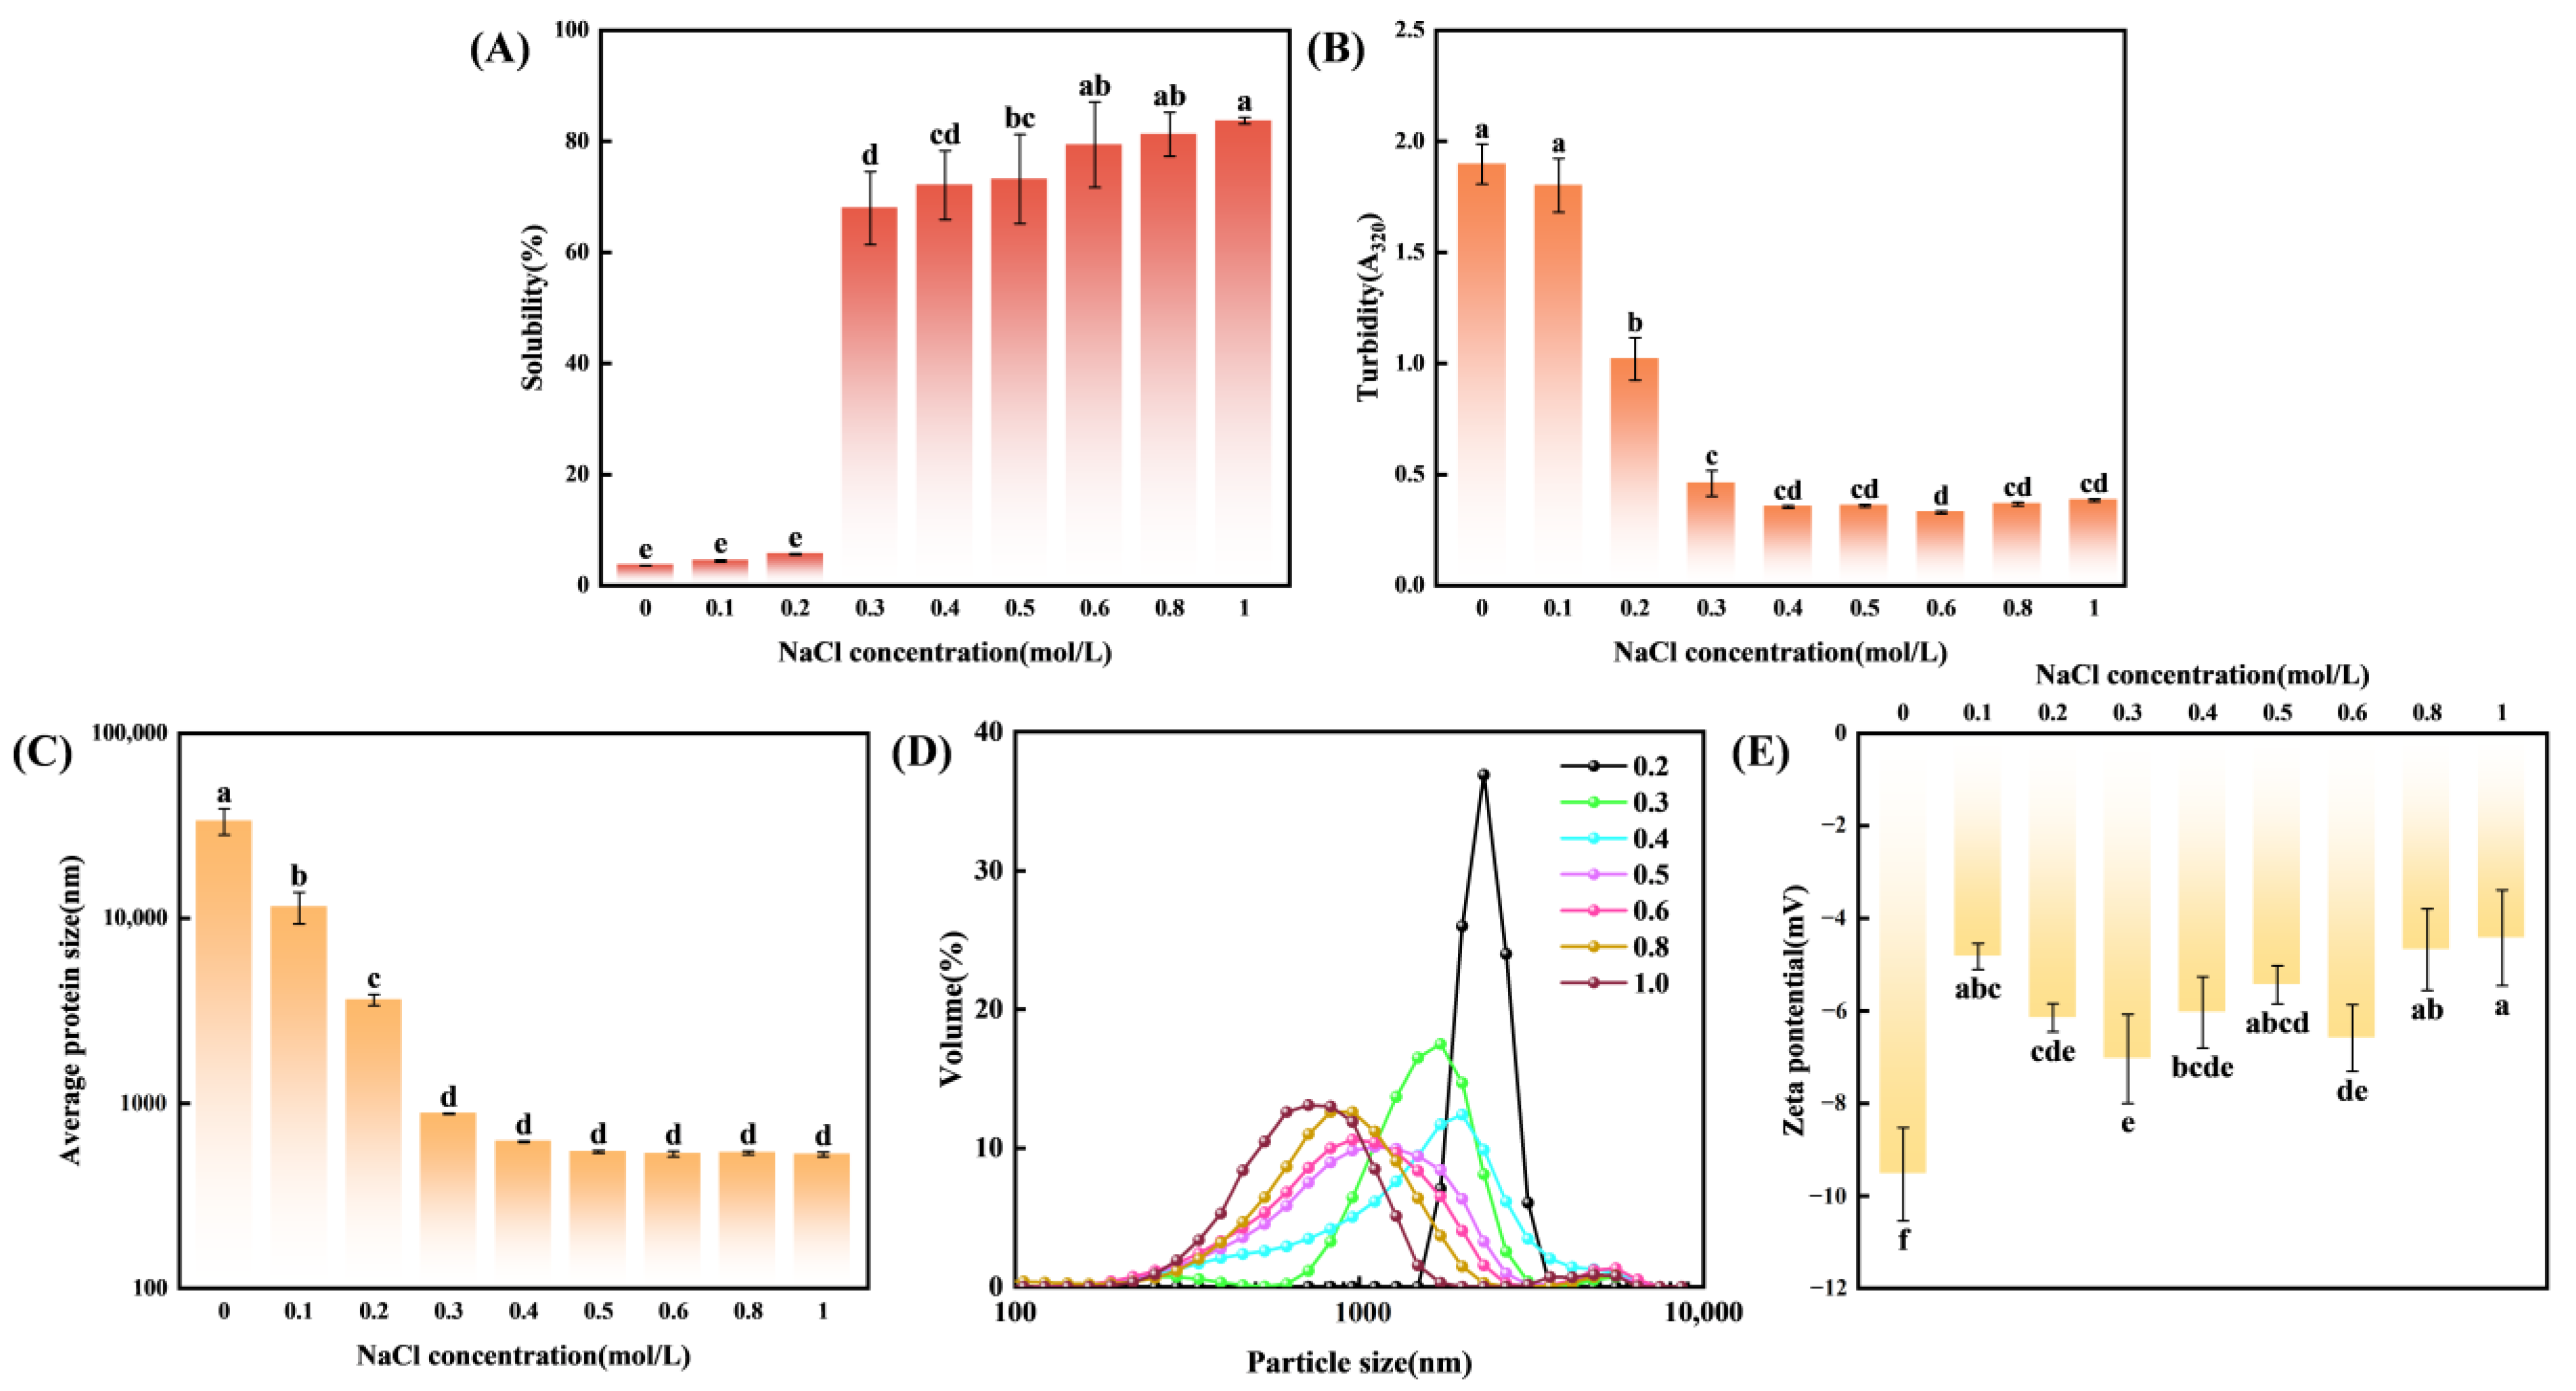
3.1. Solubility
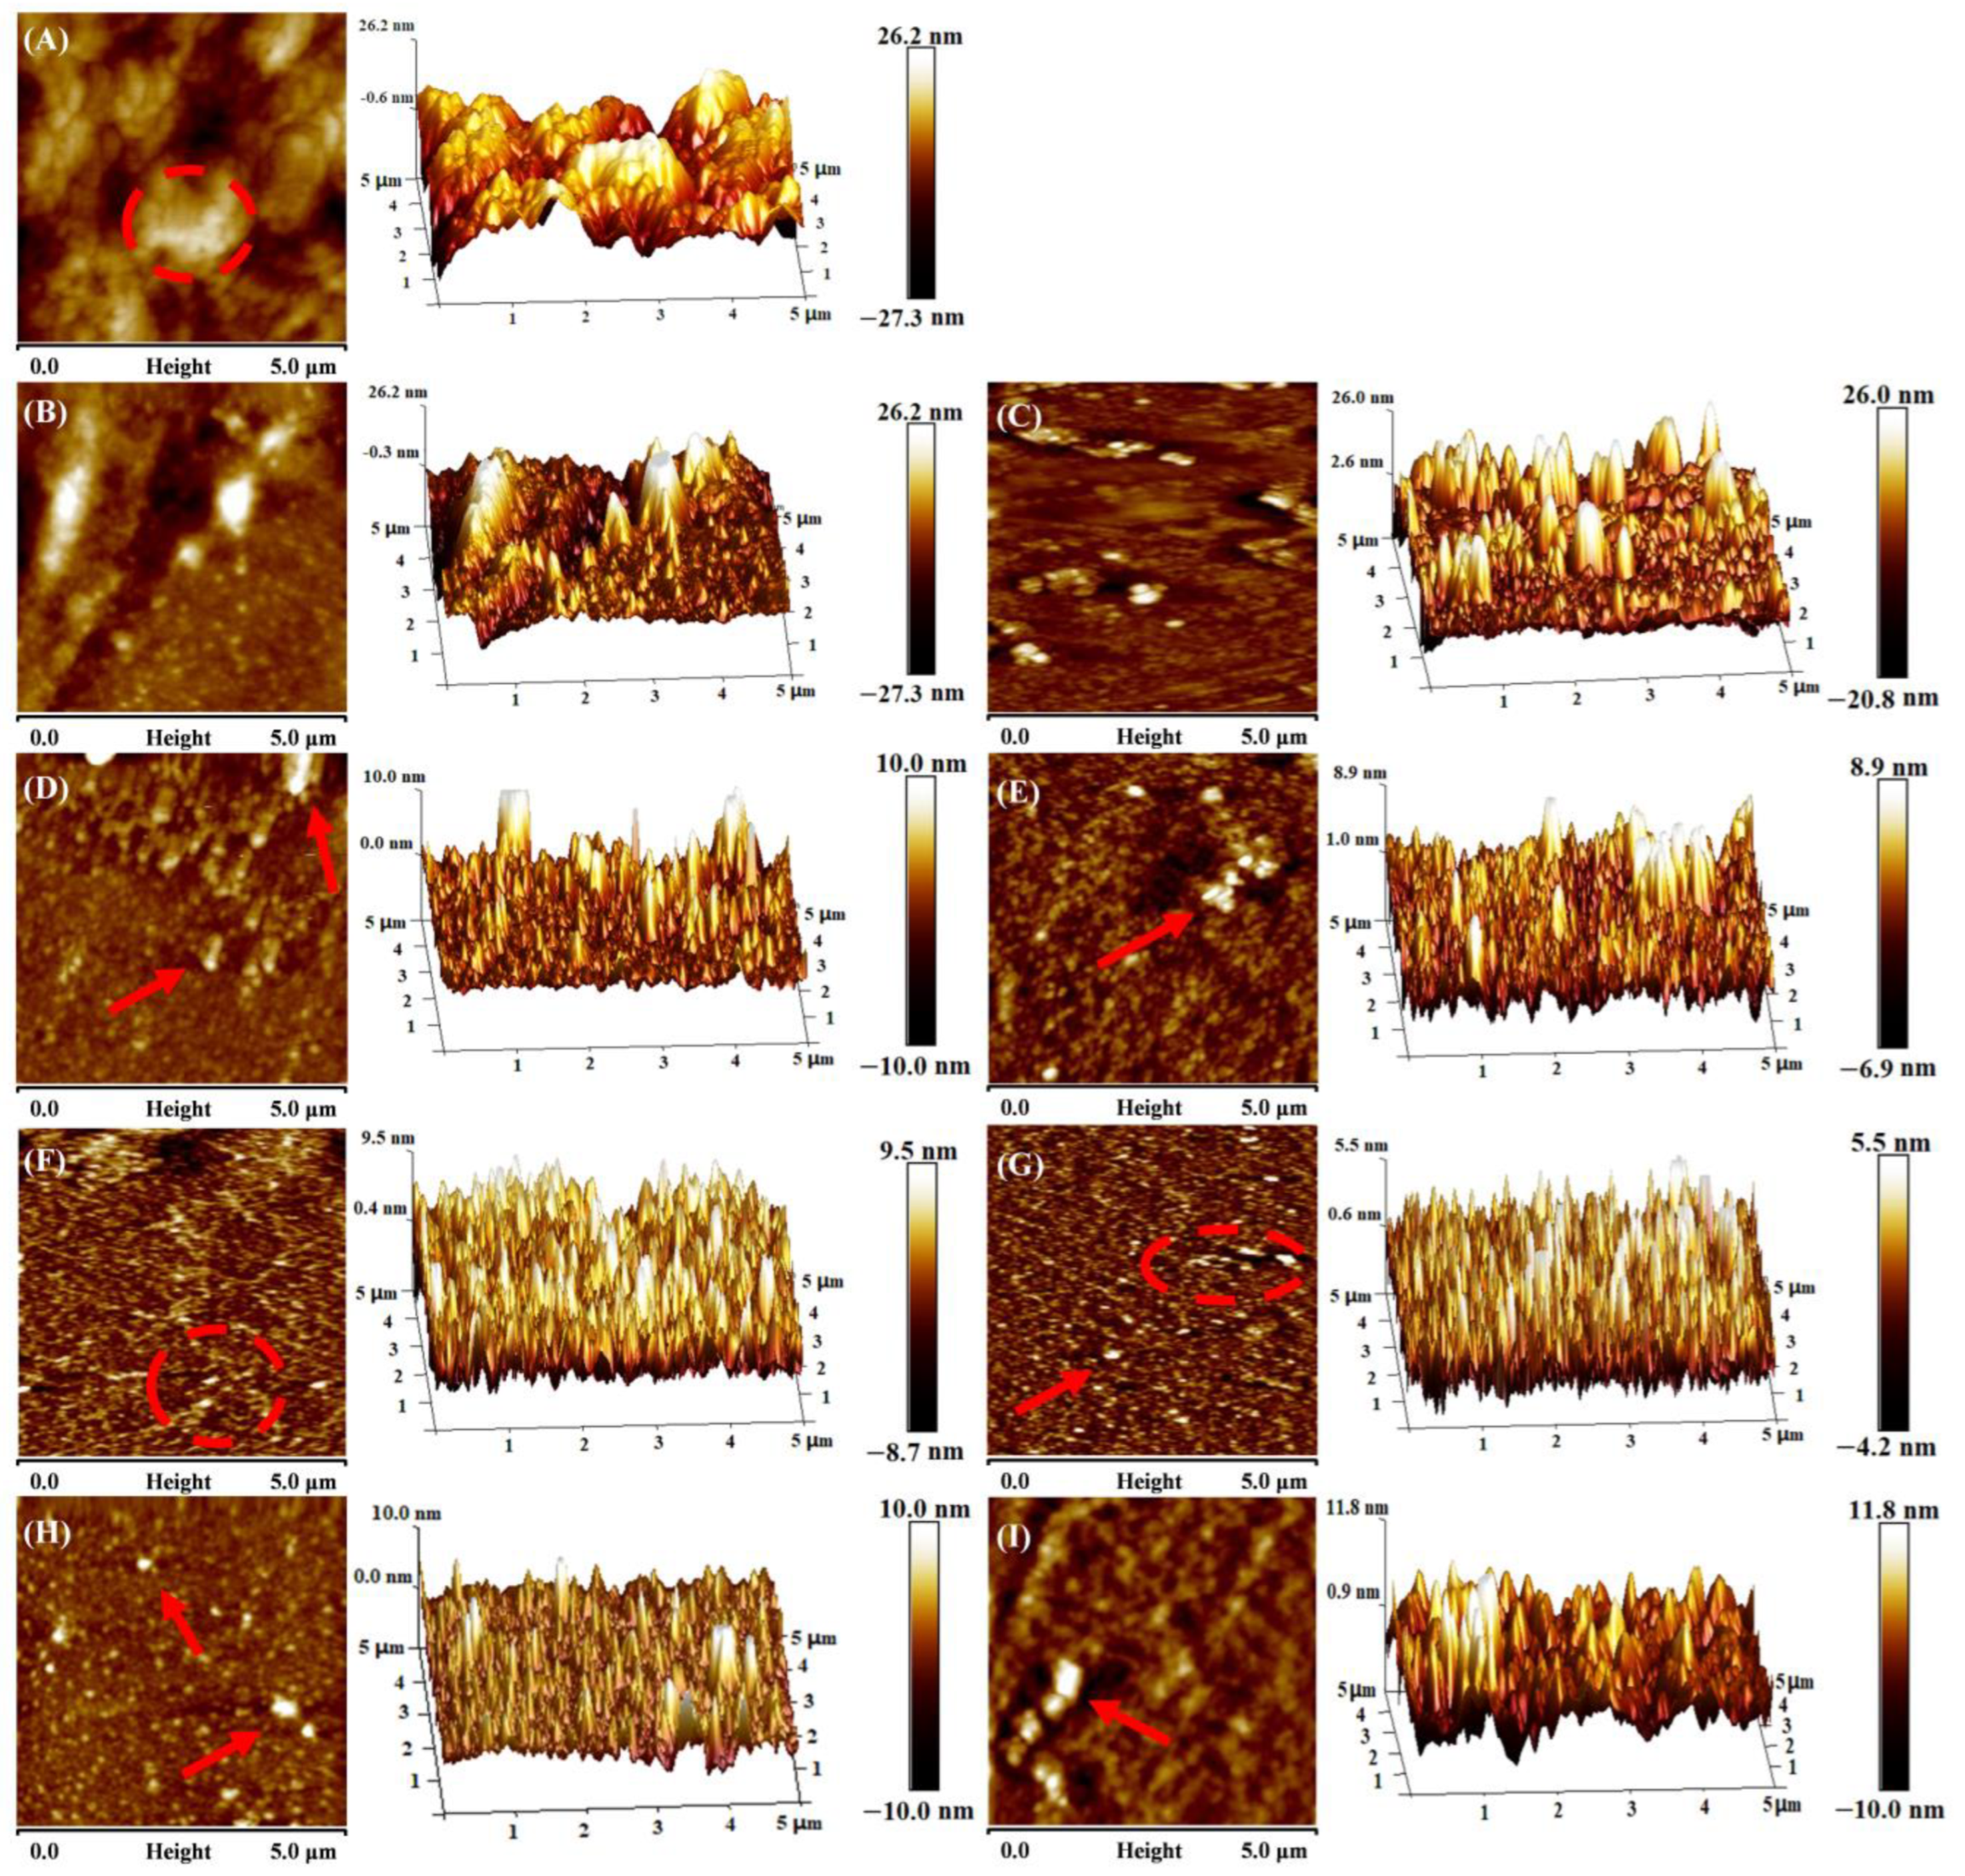
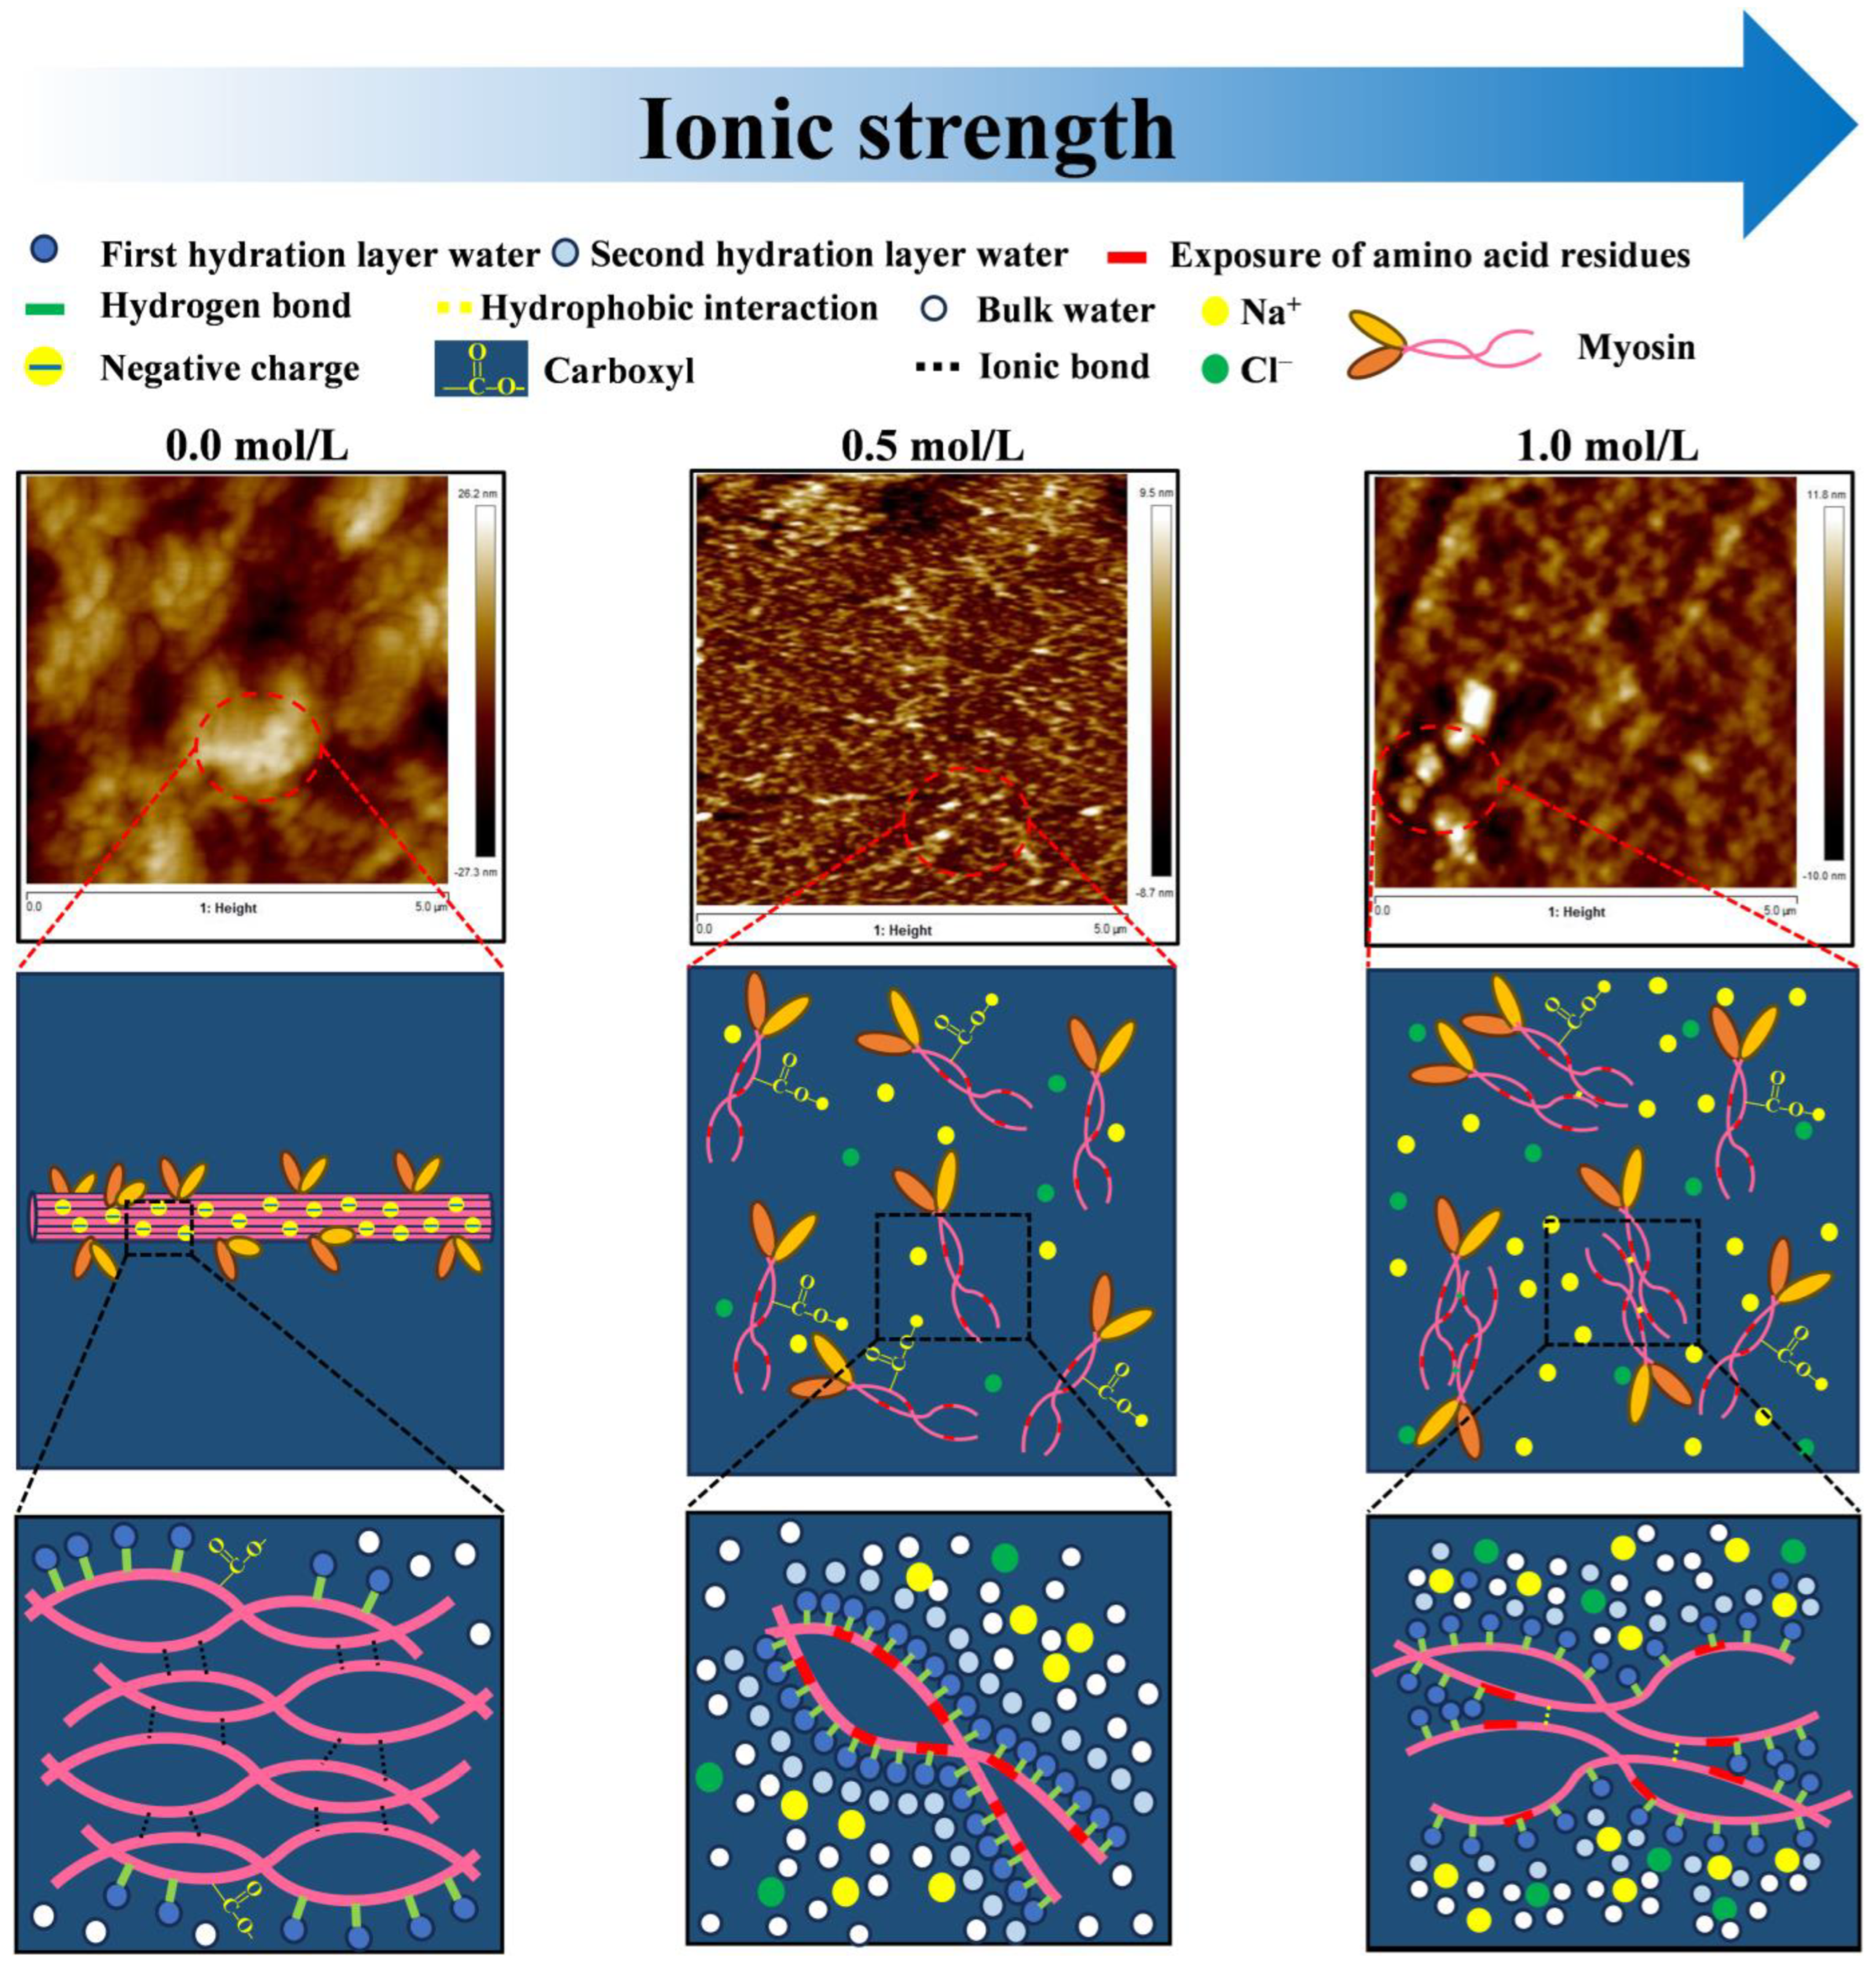
3.2. Microorphology
3.3. Spatial Structure
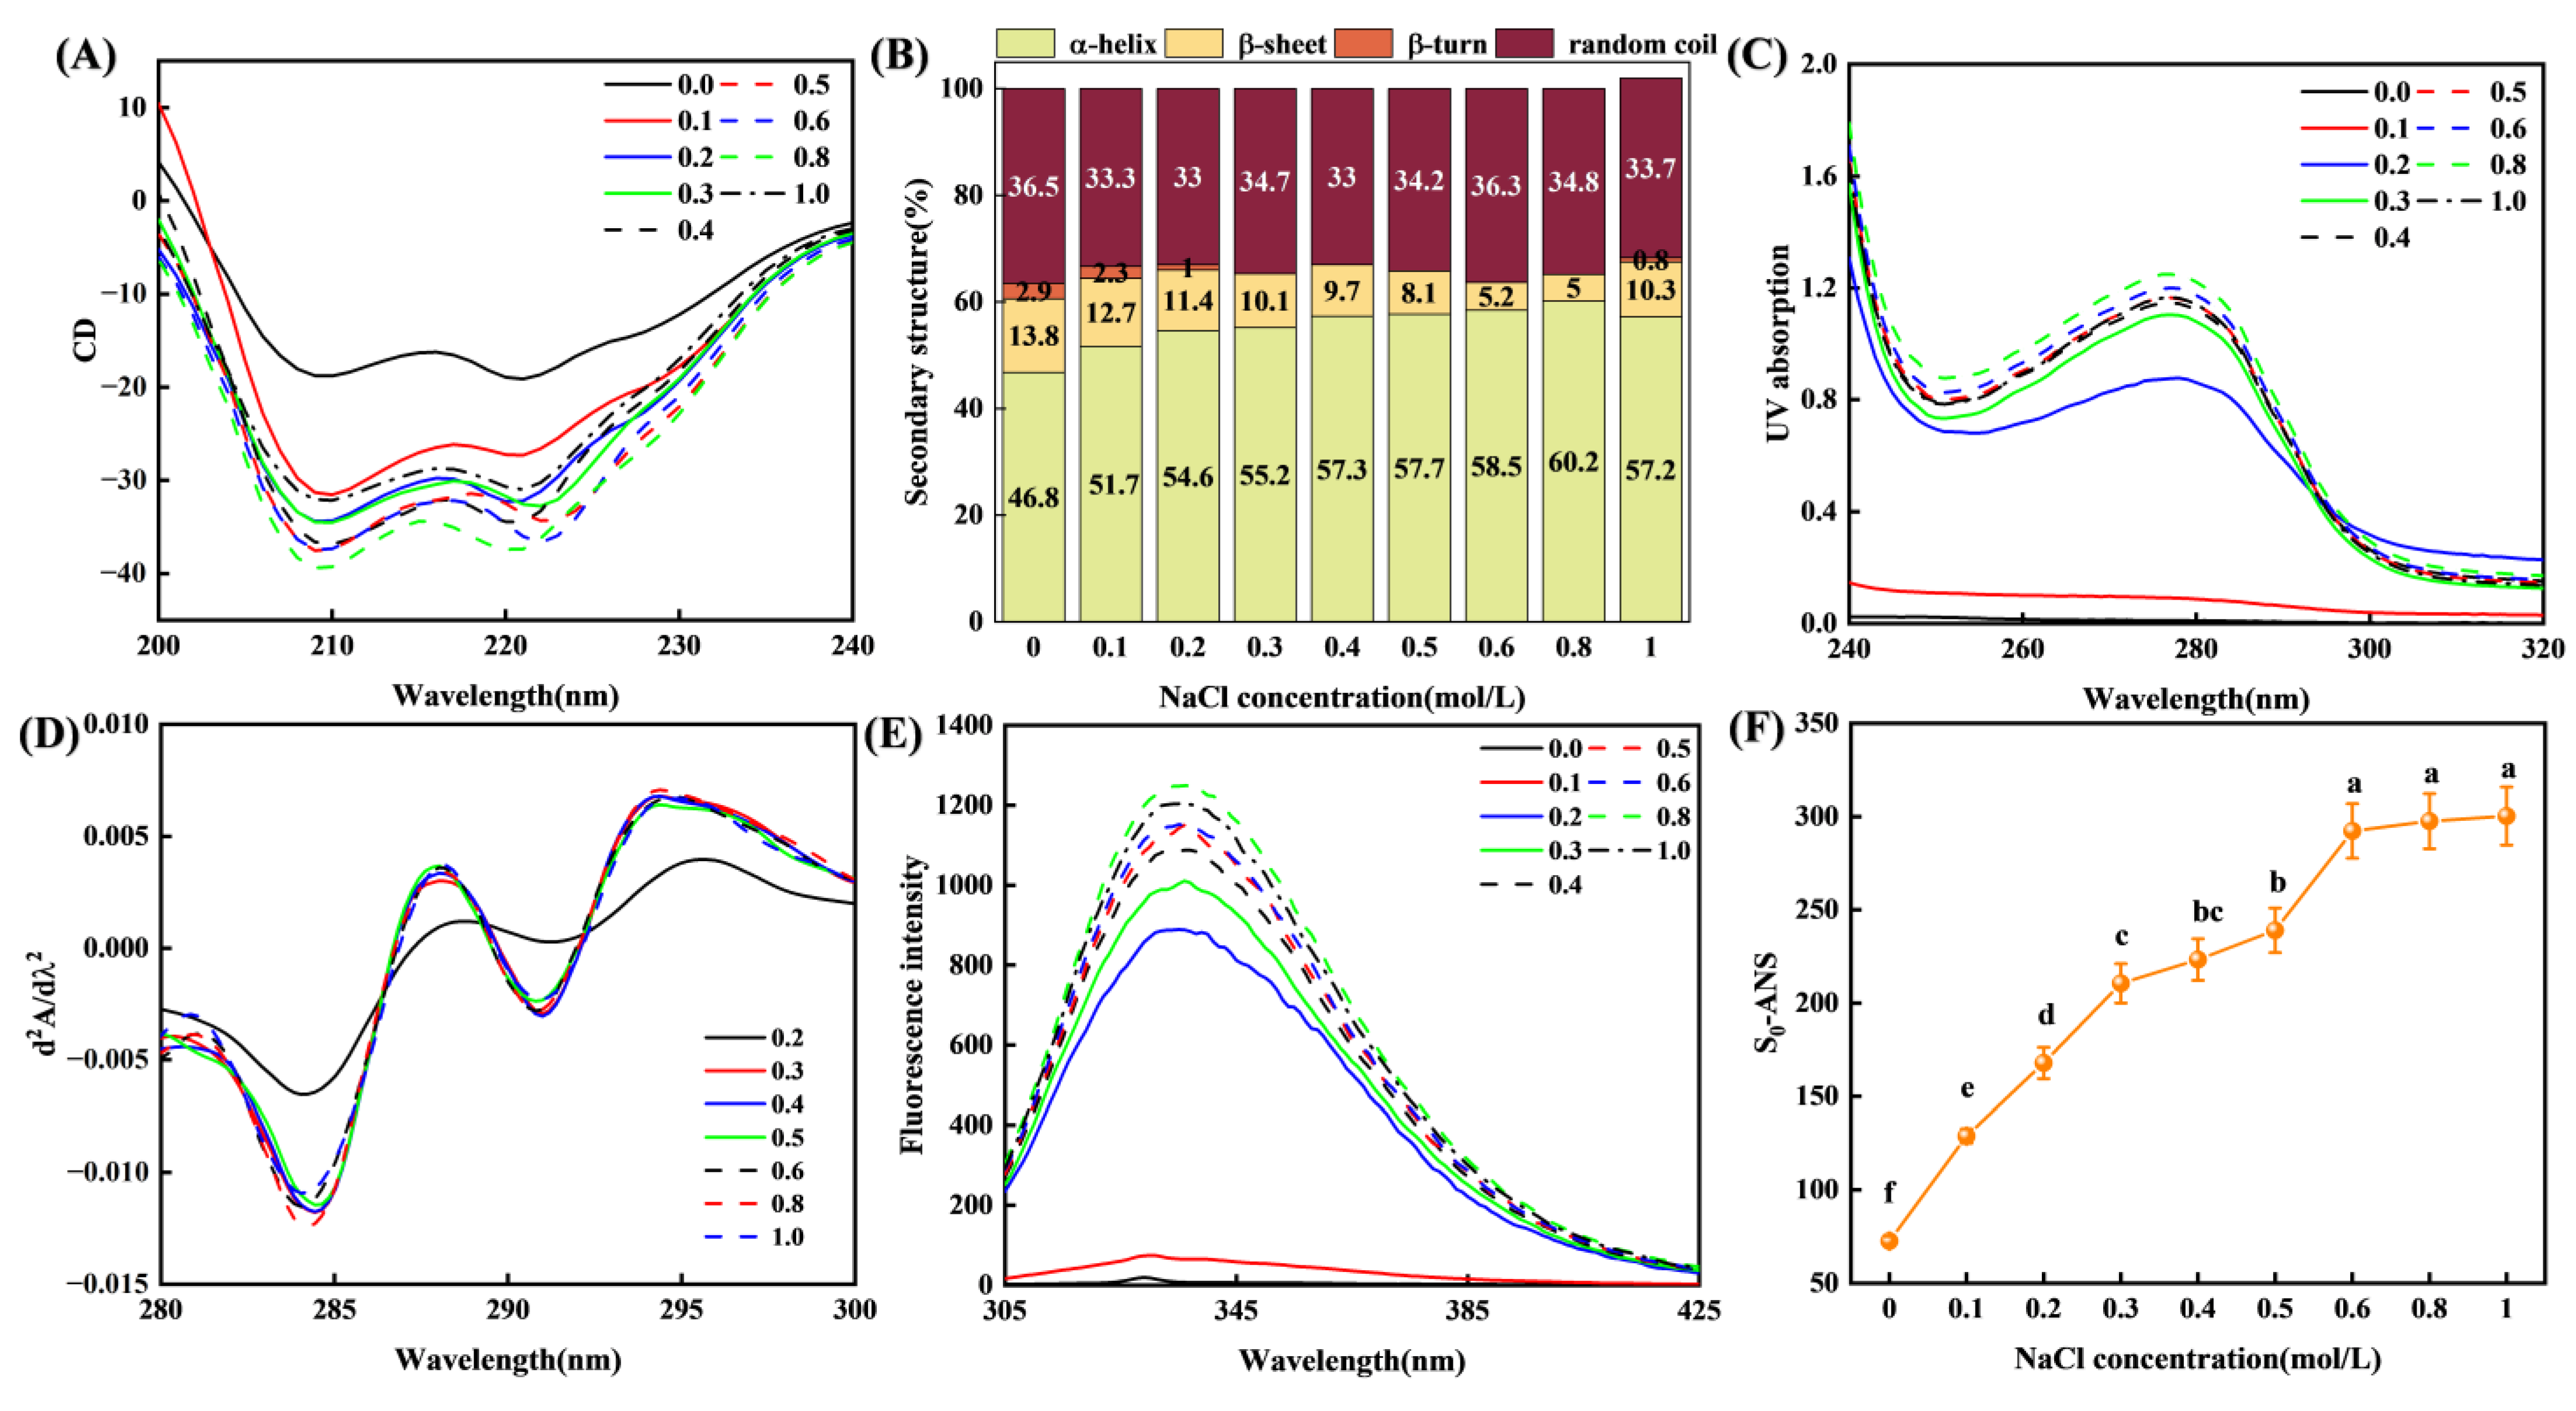
3.3.1. Secondary Structure
3.3.2. Tertiary Structure and Surface Hydrophobicity
3.4. Hydration Behavior
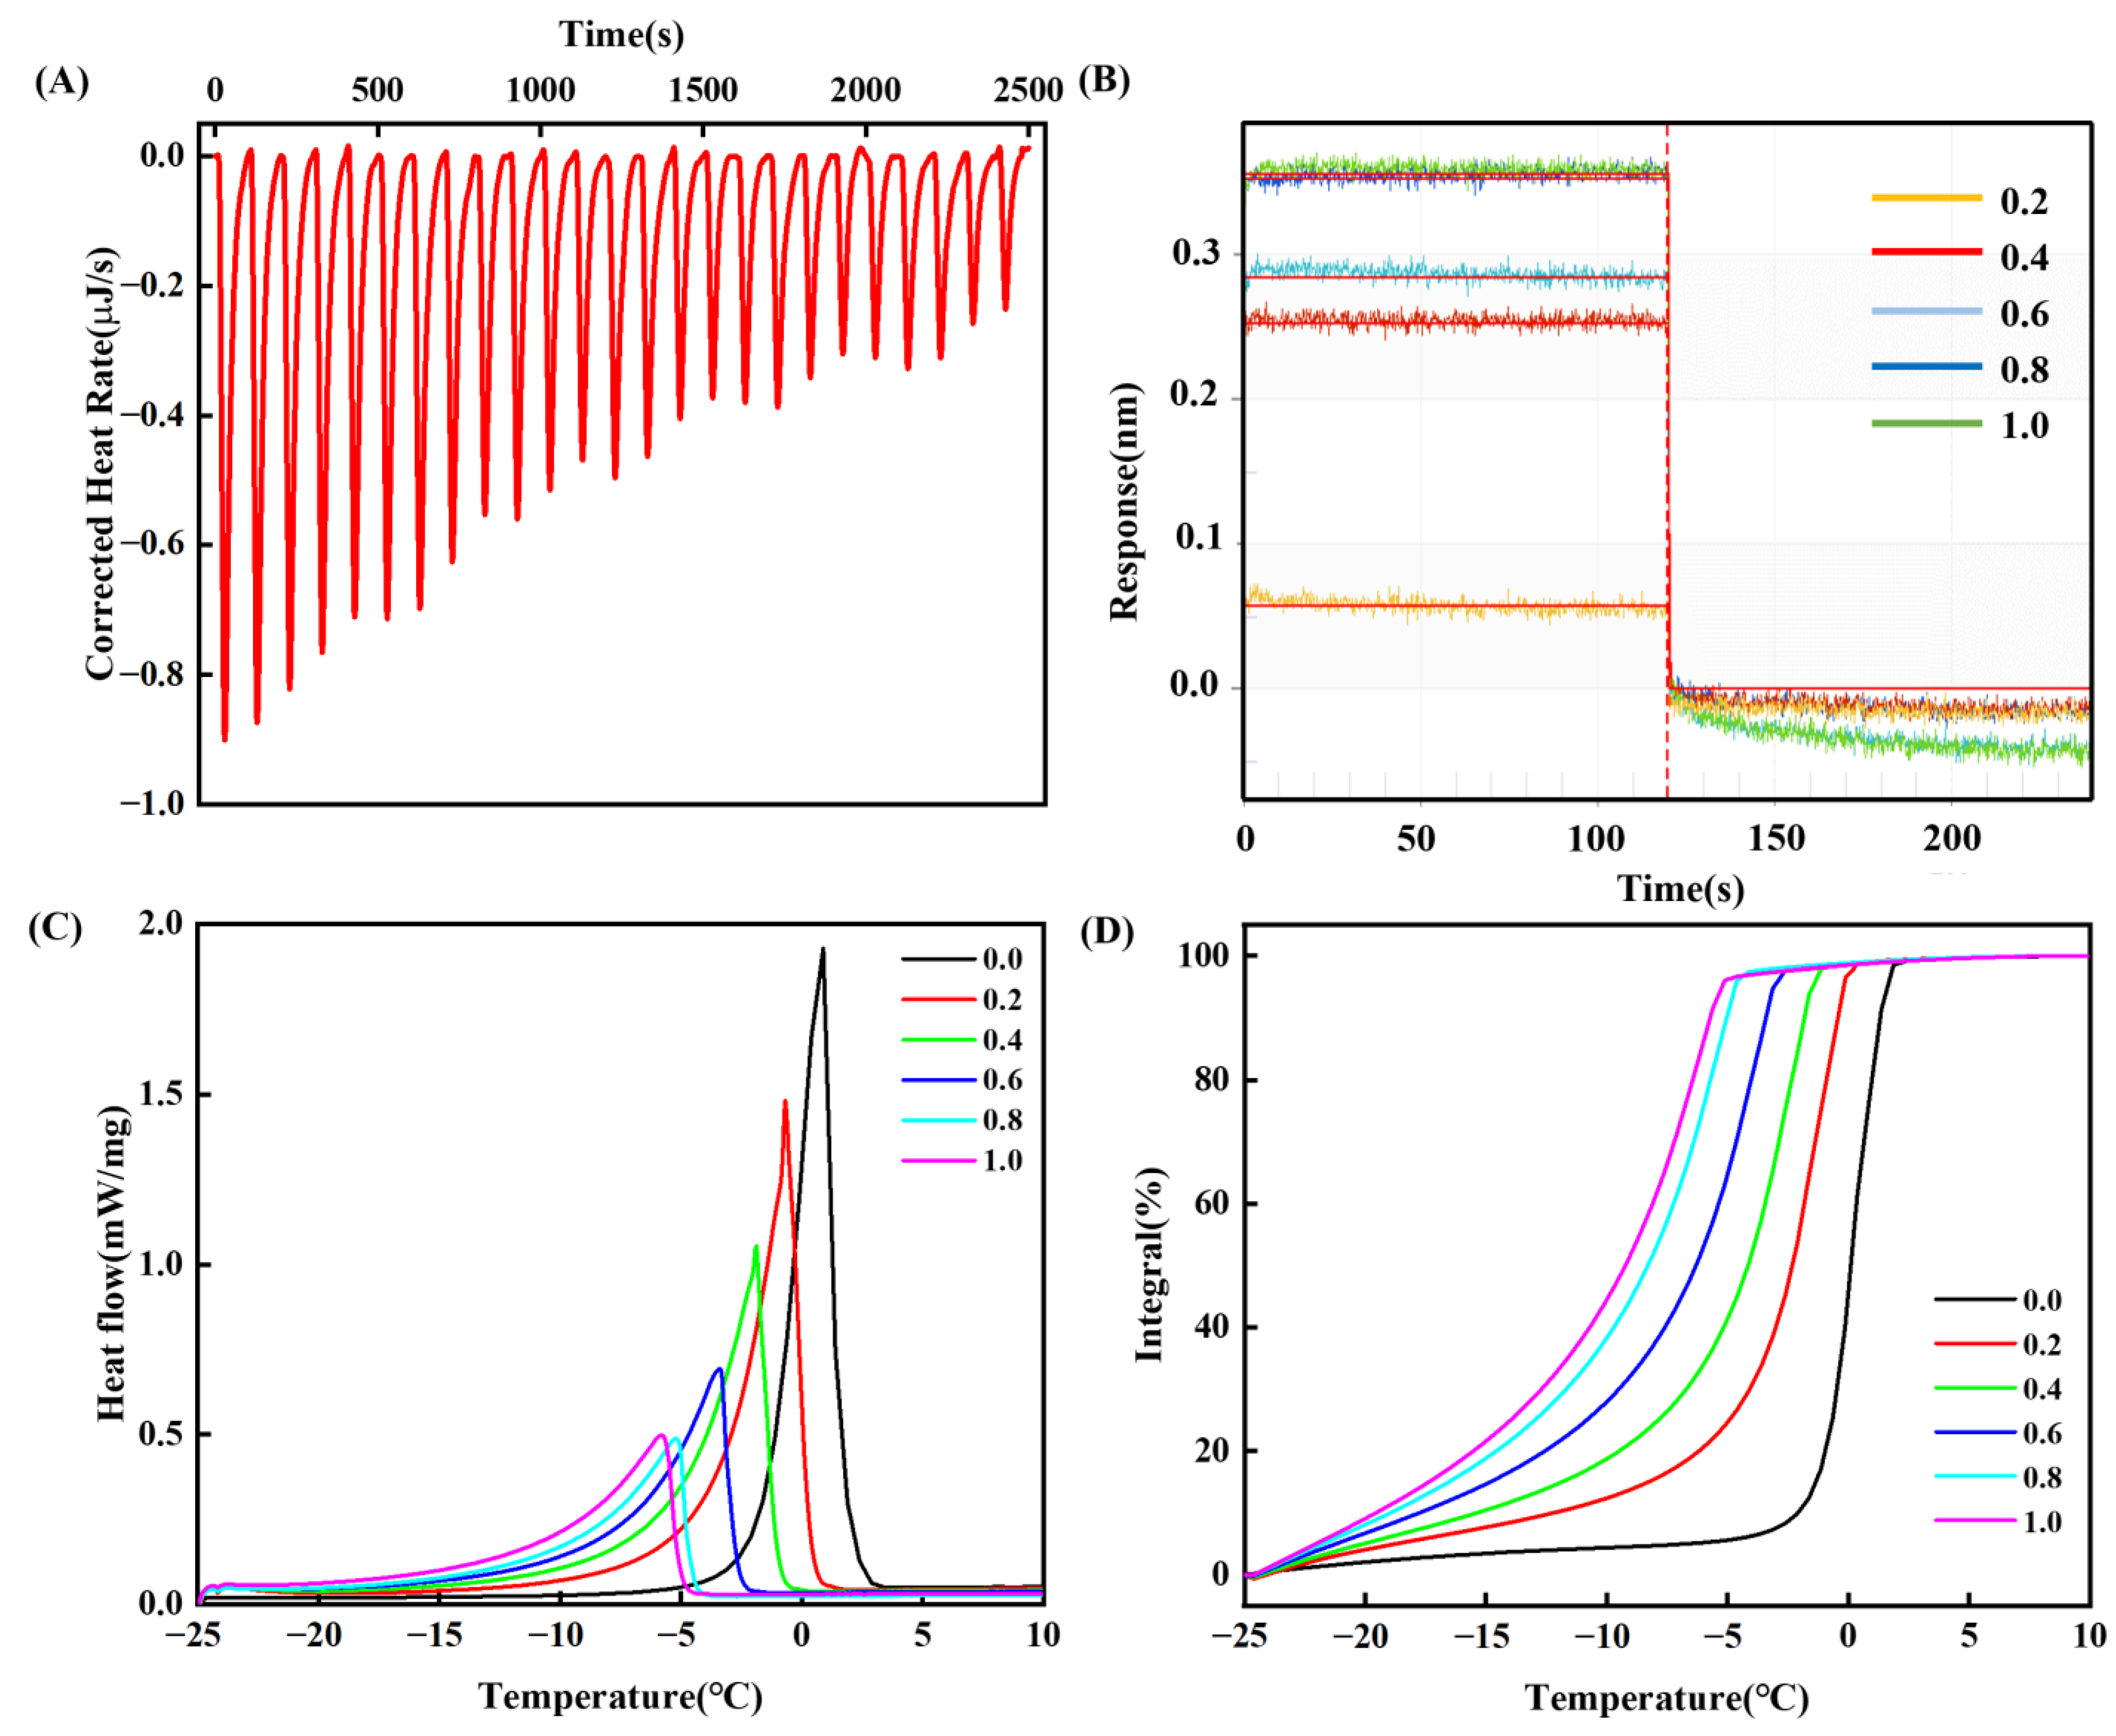
3.4.1. Isothermal Titration Calorimetry (ITC)
3.4.2. Bio-Layer Interferometry (BLI)
3.4.3. Thermal Characteristics of Melting Phase Transition
3.5. Molecular Dynamics (MD) Simulations
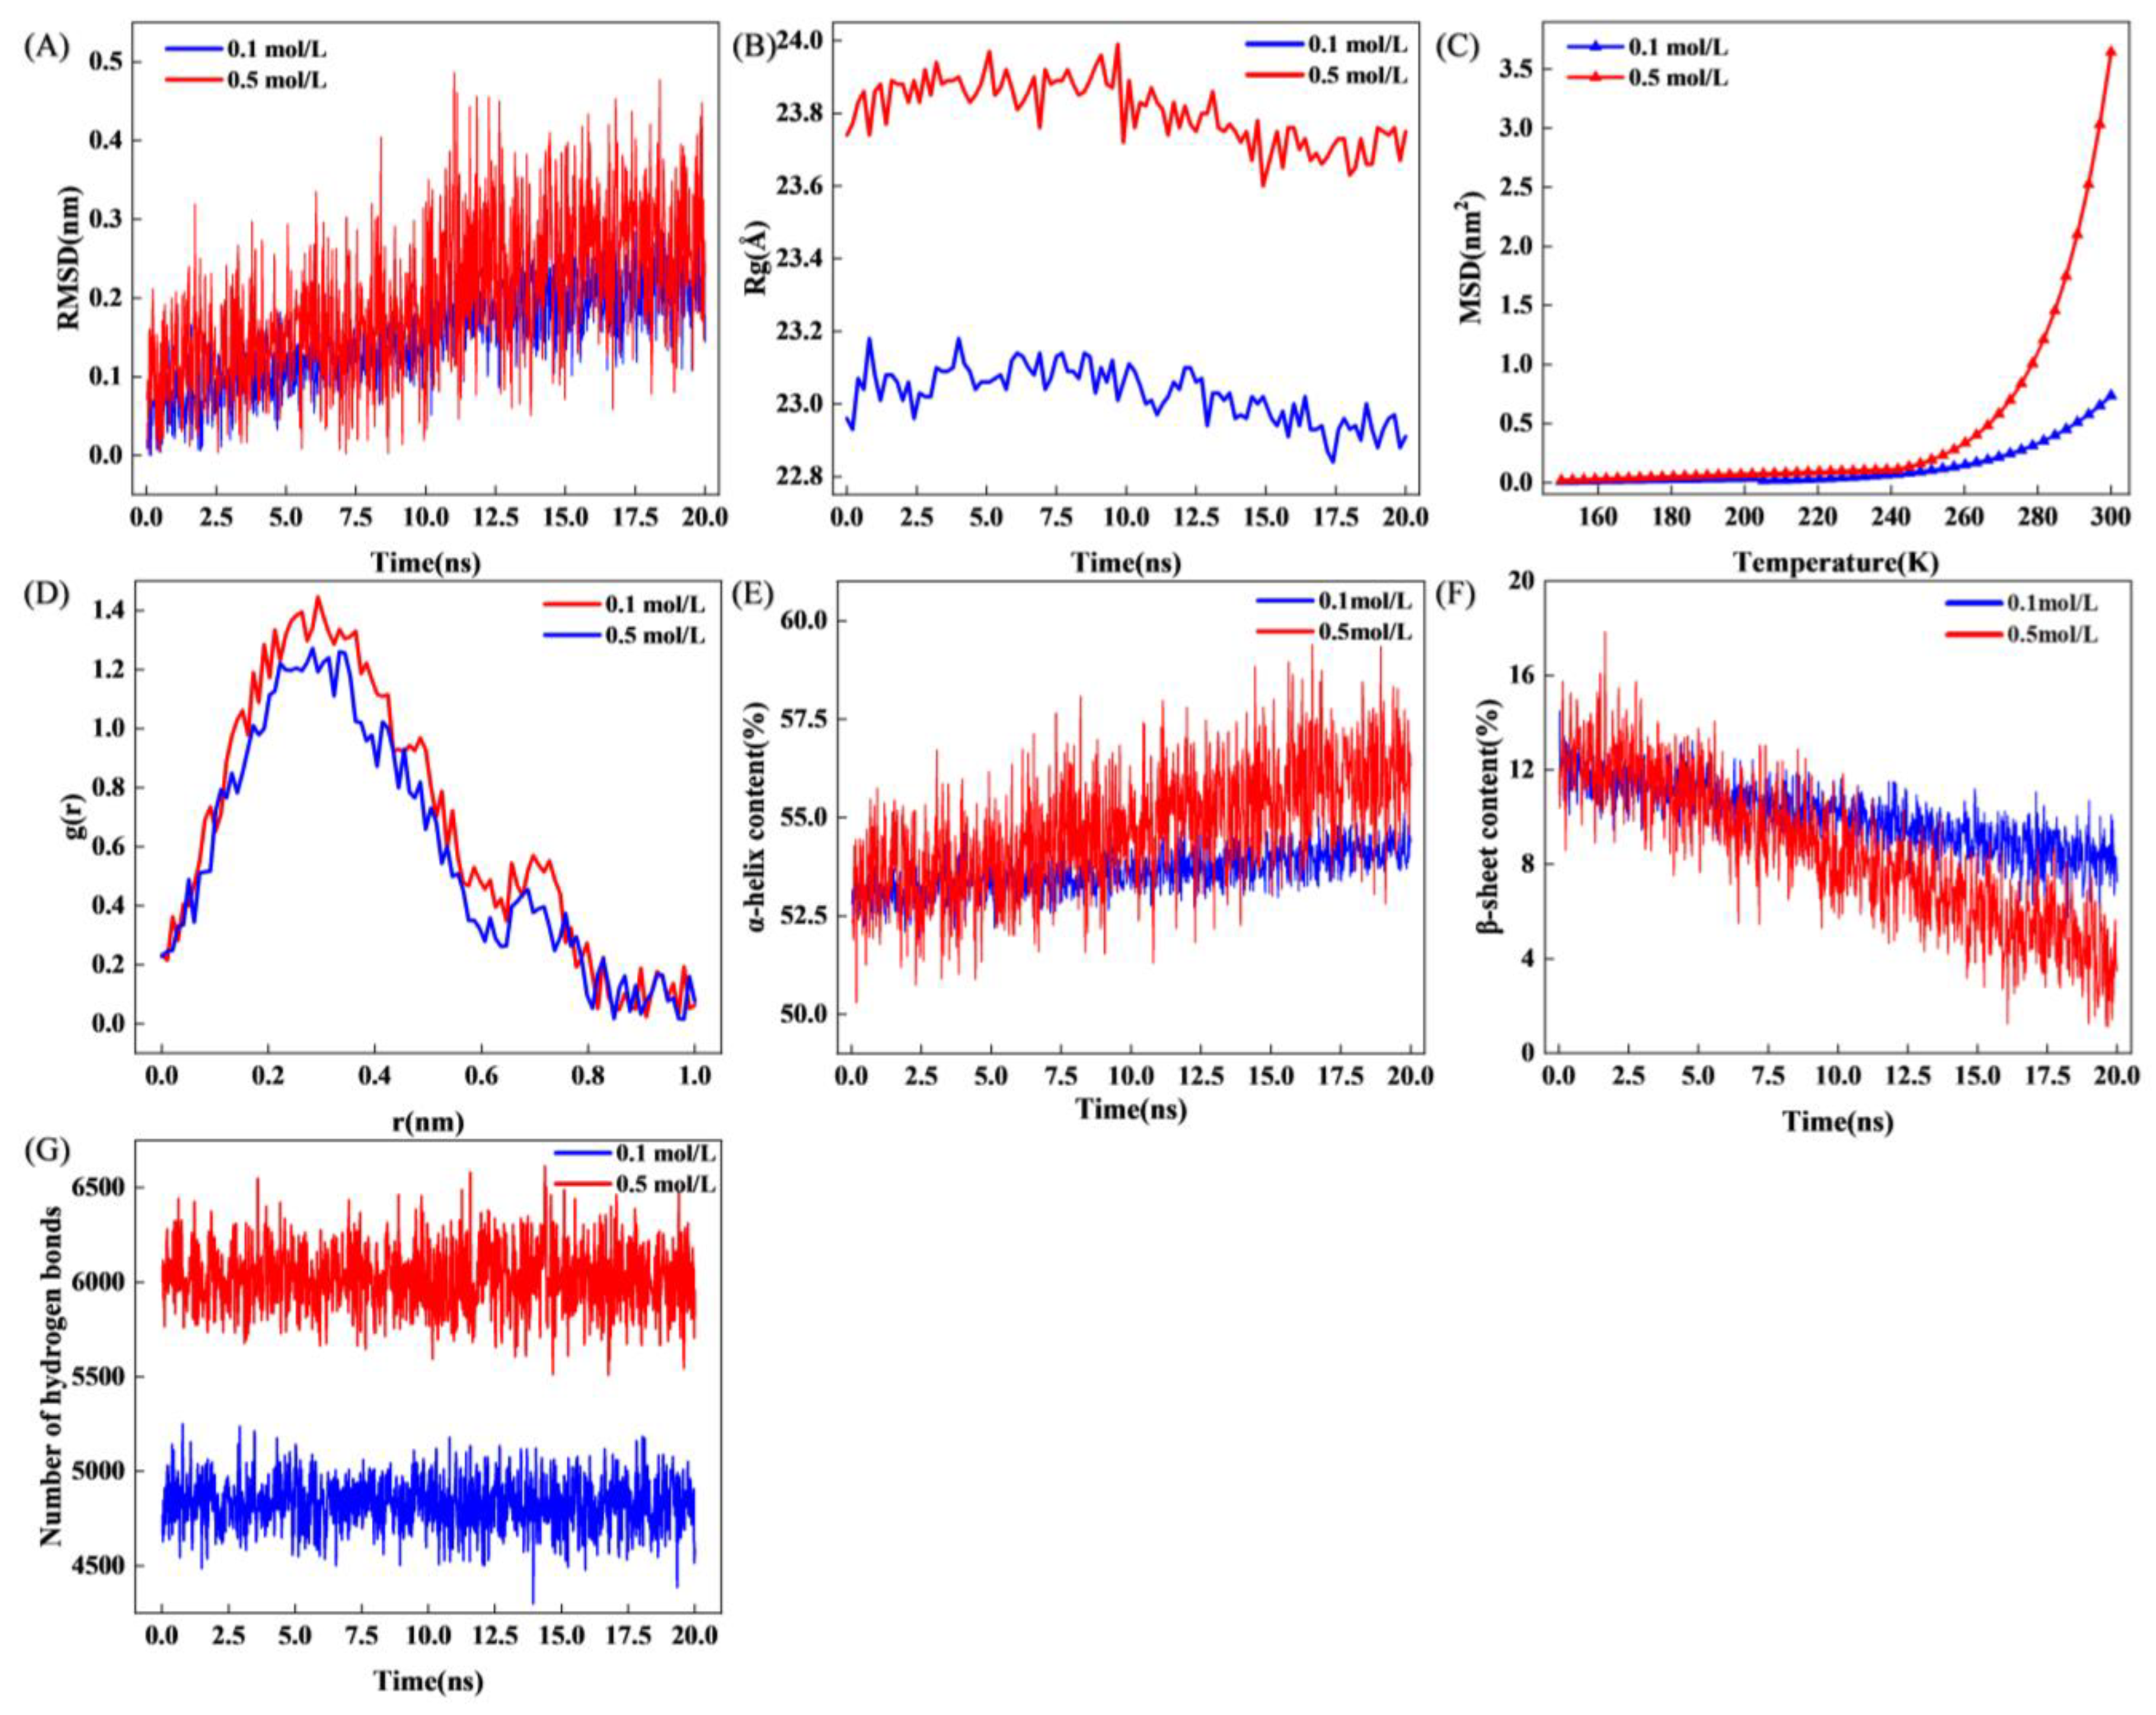
3.5.1. Root Means Square Deviation (RMSD), Radius of Gyration (Rg)
3.5.2. Mean Squared Displacement (MSD)
3.5.3. Radial Distribution Function (RDF)
3.5.4. Changes in Secondary Structure During MD
3.5.5. Number of Hydrogen Bonds
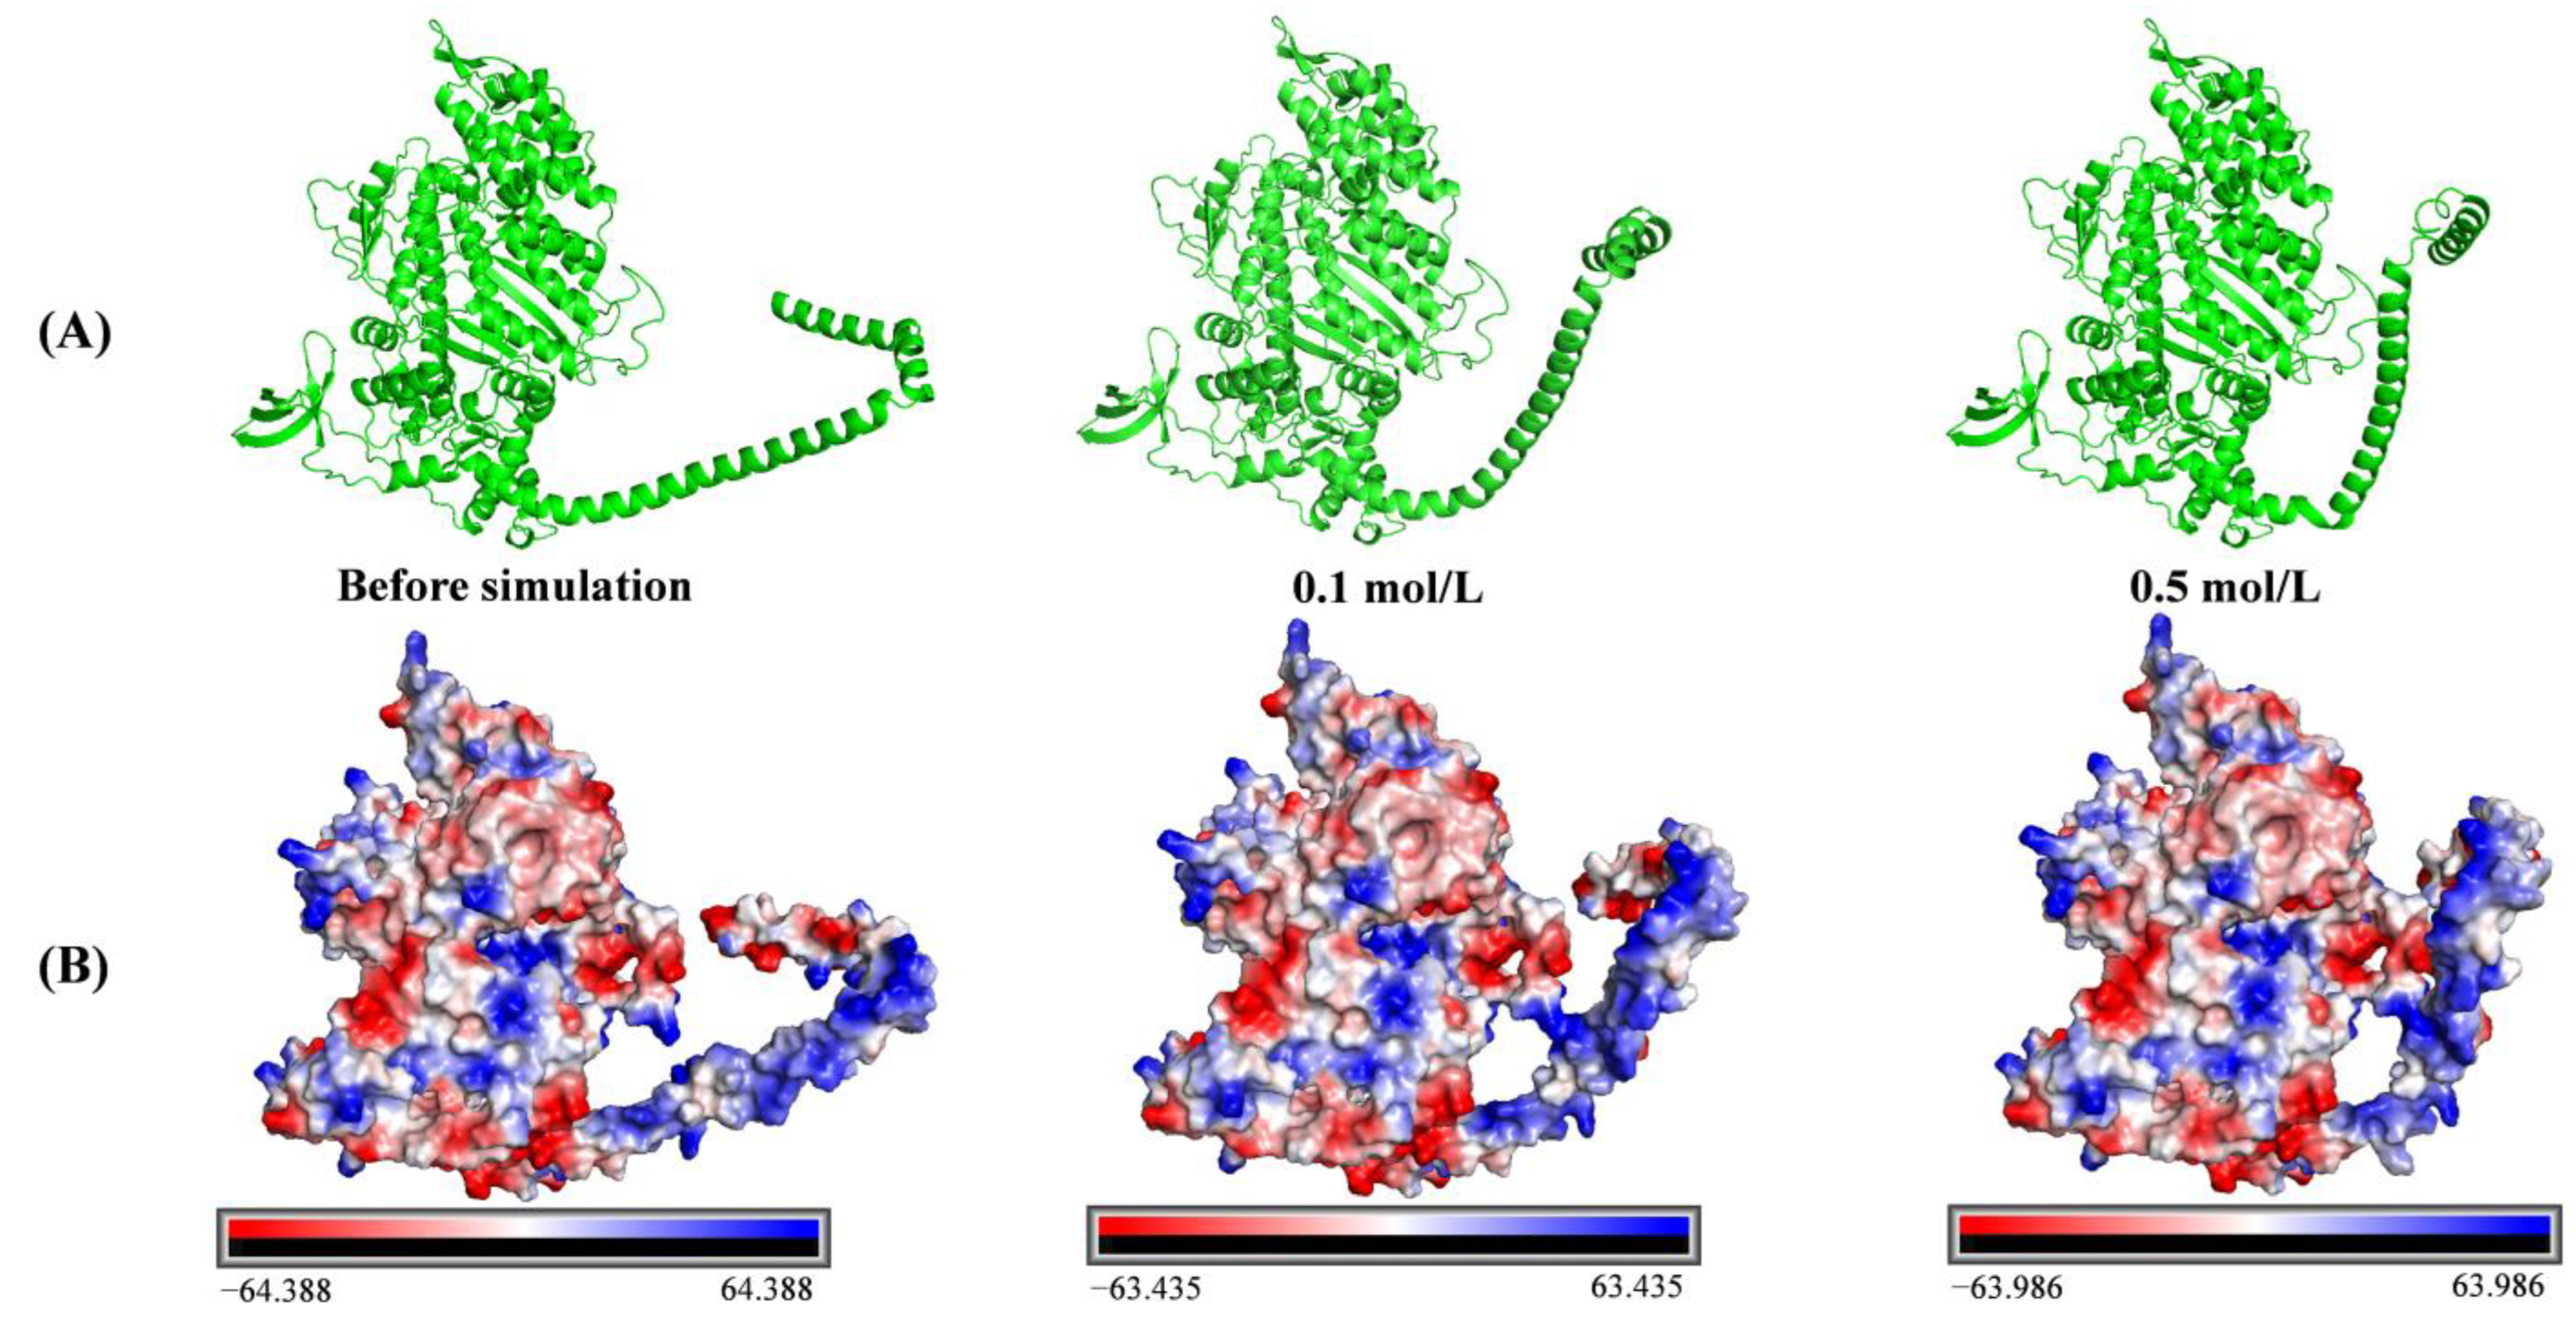
3.5.6. Conformation of Protein
4. Discussion
5. Conclusions
Author Contributions
Funding
Institutional Review Board Statement
Informed Consent Statement
Data Availability Statement
Acknowledgments
Conflicts of Interest
References
- Zhang, S.; Zhang, L.; Yin, T.; You, J.; Liu, R.; Wang, L.; Huang, Q.; Wang, W.; Ma, H. Exploring the Versatility of Carbohydrates in Surimi and Surimi Products: Novel Applications and Future Perspectives. J. Sci. Food Agric. 2024, 104, 1874–1883. [Google Scholar] [CrossRef]
- Yu, N.; Xu, Y.; Jiang, Q.; Xia, W. Molecular Forces Involved in Heat-Induced Freshwater Surimi Gel: Effects of Various Bond Disrupting Agents on the Gel Properties and Protein Conformation Changes. Food Hydrocoll. 2017, 69, 193–201. [Google Scholar] [CrossRef]
- Xiong, Z.; Wang, X.; Li, M.; Shi, T.; Jin, W.; Li, J.; Yuan, L.; Gao, R. Investigation of the Enhancement Mechanism of Ethanol Addition on the Gel Performance of Heat-Induced Surimi. J. Food Eng. 2023, 355, 111581. [Google Scholar] [CrossRef]
- Gao, X.; Li, K.; Xiong, S.; Liu, R. Changes in Transglutaminase Activity and Its Contribution to Gelation Properties of Low-Salt Myosin Under Ultrasound. Food Bioprocess Technol. 2024, 17, 2253–2264. [Google Scholar] [CrossRef]
- Hayakawa, T.; Yoshida, Y.; Yasui, M.; Ito, T.; Iwasaki, T.; Wakamatsu, J.; Hattori, A.; Nishimura, T. Heat-Induced Gelation of Myosin in a Low Ionic Strength Solution Containing L-Histidine. Meat Sci. 2012, 90, 77–80. [Google Scholar] [CrossRef] [PubMed]
- Núñez-Flores, R.; Cando, D.; Borderías, A.J.; Moreno, H.M. Importance of Salt and Temperature in Myosin Polymerization during Surimi Gelation. Food Chem. 2018, 239, 1226–1234. [Google Scholar] [CrossRef]
- Camino, J.D.; Gracia, P.; Cremades, N. The Role of Water in the Primary Nucleation of Protein Amyloid Aggregation. Biophys. Chem. 2021, 269, 106520. [Google Scholar] [CrossRef]
- Dutta, R.; Ghosh, M.; Pyne, A.; Sarkar, N. Insight into the Dynamics of Different Fluorophores in the Interior of Aerosol OT Lamellar Structures in the Presence of Sugars: From Picosecond-to-Femtosecond Study. J. Phys. Chem. B 2019, 123, 117–129. [Google Scholar] [CrossRef]
- Laage, D.; Elsaesser, T.; Hynes, J.T. Water Dynamics in the Hydration Shells of Biomolecules. Chem. Rev. 2017, 117, 10694–10725. [Google Scholar] [CrossRef]
- Huang, W.; Krishnaji, S.; Tokareva, O.R.; Kaplan, D.; Cebe, P. Influence of Water on Protein Transitions: Thermal Analysis. ACS Publ. 2014, 47, 8098–8106. [Google Scholar] [CrossRef]
- Li, X.; Zhang, N.; Jiao, X.; Zhang, W.; Yan, B.; Huang, J.; Zhao, J.; Zhang, H.; Chen, W.; Fan, D. Insight into Ionic Strength-Induced Solubilization of Myofibrillar Proteins from Silver Carp (Hypophthalmichthys molitrix): Structural Changes and 4D Label-Free Proteomics Analysis. J. Agric. Food Chem. 2023, 71, 13920–13933. [Google Scholar] [CrossRef] [PubMed]
- Chowdhury, S.; Ghosh, B.; Baskey, S.; Hossain, A.; Henaish, A.M.A.; Roy, S.; Mahali, K. Solubility and Thermodynamical Phenomenafor L-Serine and l-Isoleucine in Chloride Salts of Na+ and K+ Electrolytic Media. J. Mol. Liq. 2023, 378, 121619. [Google Scholar] [CrossRef]
- Miao, R.; Wang, L.; Mi, N.; Gao, Z.; Liu, T.; Lv, Y.; Wang, X.; Meng, X.; Yang, Y. Enhancement and Mitigation Mechanisms of Protein Fouling of Ultrafiltration Membranes under Different Ionic Strengths. Environ. Sci. Technol. 2015, 49, 6574–6580. [Google Scholar] [CrossRef] [PubMed]
- Xiong, Z.; Liu, J.; Tian, Y.; Wang, Z.; Wang, X.; Shi, T.; Jin, W.; Yuan, L.; Gao, R. Structural and Aggregation Changes of Silver Carp Myosin Induced with Alcohols: Effects of Ethanol, 1,2-Propanediol, and Glycerol. Food Chem. 2024, 452, 139542. [Google Scholar] [CrossRef] [PubMed]
- Xin, X.; Zhang, G.; Xue, H.; Qiu, W.; Hu, H.; Tu, Y.; Zhao, Y. Effects of Ethanol Treatment on the Physicochemical Properties, Microstructure and Protein Structures of Egg Yolk Gels. Food Chem. 2023, 405, 135041. [Google Scholar] [CrossRef]
- Carugo, O. Protein Hydration: Investigation of Globular Protein Crystal Structures. Int. J. Biol. Macromol. 2017, 99, 160–165. [Google Scholar] [CrossRef]
- Gao, X.; Yang, S.; You, J.; Yin, T.; Xiong, S.; Liu, R. Changes in Gelation Properties of Silver Carp Myosin Treated by Combination of High Intensity Ultrasound and NaCl. Foods 2022, 11, 3830. [Google Scholar] [CrossRef]
- Lowry, O.H.; Rosebrough, N.J.; Farr, A.L.; Randall, R.J. Protein measurement with the folin phenol reagent. J. Biol. Chem. 1951, 193, 265–275. [Google Scholar] [CrossRef]
- Qi, Y.; Xu, X.; Dong, H.; Yang, Z.; Wang, P. Insight Into the Effect of Carnosine on the Dispersibility of Myosin Under a Low-Salt Condition and Its Mechanism. Food Biophys. 2023, 18, 71–81. [Google Scholar] [CrossRef]
- Zhang, Z.; Yang, Y.; Tang, X.; Chen, Y.; You, Y. Chemical Forces and Water Holding Capacity Study of Heat-Induced Myofibrillar Protein Gel as Affected by High Pressure. Food Chem. 2015, 188, 111–118. [Google Scholar] [CrossRef]
- Liu, R.; Zhao, S.; Xiong, S.; Xie, B.; Qin, L. Role of Secondary Structures in the Gelation of Porcine Myosin at Different pH Values. Meat Sci. 2008, 80, 632–639. [Google Scholar] [CrossRef] [PubMed]
- Gao, X.; Feng, Q.; Li, K.; Xiong, S.; Liu, R. Activity Changes and Catalytic Effect of Cathepsin L on Low-Salt Myosin Under High-Intensity Ultrasound. Food Bioprocess Technol. 2024, 17, 2034–2047. [Google Scholar] [CrossRef]
- Yu, C.; Chen, L.; Ouyang, K.; Chen, H.; Xu, M.; Lin, S.; Wang, W. Effect of Partial Substitution of NaCl by KCl on Aggregation Behavior and Gel Properties of Beef Myosin. Food Chem. 2024, 458, 140178. [Google Scholar] [CrossRef] [PubMed]
- Yongsawatdigul, J.; Sinsuwan, S. Aggregation and Conformational Changes of Tilapia Actomyosin as Affected by Calcium Ion during Setting. Food Hydrocoll. 2007, 21, 359–367. [Google Scholar] [CrossRef]
- Xiong, W.; Ren, C.; Jin, W.; Tian, J.; Wang, Y.; Shah, B.R.; Li, J.; Li, B. Ovalbumin-Chitosan Complex Coacervation: Phase Behavior, Thermodynamic and Rheological Properties. Food Hydrocoll. 2016, 61, 895–902. [Google Scholar] [CrossRef]
- Zhang, Y.; Xiong, S.; Yin, T.; Liu, R.; Rahman, Z.; Tang, C.; Hong, H.; You, J. Uncovering the Freezing Energy Release of Salted Grass Carp (Ctenopharyngodon idella) Flesh: Effects of Water State and Protein Structure on the Thermal Properties. Food Chem. 2024, 460, 140349. [Google Scholar] [CrossRef]
- Lan, M.; Li, T.; Li, L.; Wang, S.; Chen, J.; Yang, T.; Li, Z.; Yang, Y.; Zhang, X.; Li, B. Ultrasonic Treatment Treated Sea Bass Myofibrillar Proteins in Low-Salt Solution: Emphasizing the Changes on Conformation Structure, Oxidation Sites, and Emulsifying Properties. Food Chem. 2024, 435, 137564. [Google Scholar] [CrossRef]
- Wang, K.; Li, Y.; Zhang, Y.; Luo, X.; Sun, J. Improving myofibrillar proteins solubility and thermostability in low-ionic strength solution: A review. Meat Sci. 2022, 189, 108822. [Google Scholar] [CrossRef] [PubMed]
- Xue, C.; Pei, Z.; Wen, P.; Chin, Y.; Hu, Y. Effects of pH and NaCl on the Spatial Structure and Conformation of Myofibrillar Proteins and the Emulsion Gel System—Insights from Computational Molecular Dynamics on Myosin of Golden Pompano. Gels 2023, 9, 270. [Google Scholar] [CrossRef]
- Wang, G.; Liu, M.; Cao, L.; Yongsawatdigul, J.; Xiong, S.; Liu, R. Effects of Different NaCl Concentrations on Self-Assembly of Silver Carp Myosin. Food Biosci. 2018, 24, 1–8. [Google Scholar] [CrossRef]
- Li, S.; Zheng, Y.; Xu, P.; Zhu, X.; Zhou, C. L-Lysine and l-Arginine Inhibit Myosin Aggregation and Interact with Acidic Amino Acid Residues of Myosin: The Role in Increasing Myosin Solubility. Food Chem. 2018, 242, 22–28. [Google Scholar] [CrossRef] [PubMed]
- Guo, X.; Peng, Z.; Zhang, Y.; Liu, B.; Cui, Y. The Solubility and Conformational Characteristics of Porcine Myosin as Affected by the Presence of L-Lysine and l-Histidine. Food Chem. 2015, 170, 212–217. [Google Scholar] [CrossRef]
- Tang, L.; Yongsawatdigul, J. Physicochemical Properties of Tilapia (Oreochromis niloticus) Actomyosin Subjected to High Intensity Ultrasound in Low NaCl Concentrations. Ultrason. Sonochem. 2020, 63, 104922. [Google Scholar] [CrossRef]
- Salgın, S.; Salgın, U.; Bahadır, S. Zeta Potentials and Isoelectric Points of Biomolecules: The Effects of Ion Types and Ionic Strengths. Int. J. Electrochem. Sci. 2012, 7, 12404–12414. [Google Scholar] [CrossRef]
- Liu, H.; Zhang, H.; Liu, Q.; Chen, Q.; Kong, B. Solubilization and Stable Disspersion of Myofibrillar Proteins in Water through the Destruction and Inhibition of the Assembly of Filaments Using High-Intensity Ltrasound. Ultrason. Sonochem. 2020, 67, 105160. [Google Scholar] [CrossRef]
- Shimada, M.; Takai, E.; Ejima, D.; Arakawa, T.; Shiraki, K. Heat-Induced Formation of Myosin Oligomer-Soluble Filament Complex in High-Salt Solution. Int. J. Biol. Macromol. 2015, 73, 17–22. [Google Scholar] [CrossRef] [PubMed]
- Epstein, H.; Miller, D.; Ortiz, I.; Berliner, G. Myosin and Paramyosin are organized about a newly identified core structure. J. Cell Biol. 1985, 100, 904–915. [Google Scholar] [CrossRef] [PubMed]
- Wu, Y.; Xiang, H.; Chen, S.; Zhao, Y.; Cai, Q.; Lin, W.; Wu, Y.; Wang, Y. Characterization of the Aggregation Behavior of Sea Bass (Lateolabrax japonicus) Myofibrillar Proteins Mediated by Different Ionic Strengths: Protein Structures, Gel Properties, and Emulsion Stabilities. LWT 2023, 189, 115483. [Google Scholar] [CrossRef]
- Dai, H.; Sun, Y.; Xia, W.; Ma, L.; Li, L.; Wang, Q.; Zhang, Y. Effect of phospholipids on the physicochemical properties of myofibrillar proteins solution mediated by NaCl concentration. LWT 2021, 141, 110895. [Google Scholar] [CrossRef]
- Xie, Y.; Chen, D.; Cao, J.; Wang, X.; Yin, X. Synergistic Effects of High-Intensity Ultrasound Combined with L-Lysine for the Treatment of Porcine Myofibrillar Protein Regarding Solubility and Flavour Adsorption Capacity. Foods 2024, 13, 629. [Google Scholar] [CrossRef]
- Xiong, Z.; Shi, T.; Zhang, W.; Kong, Y.; Yuan, L.; Gao, R. Improvement of Gel Properties of Low Salt Surimi Using Low-Dose l-Arginine Combined with Oxidized Caffeic Acid. LWT 2021, 145, 111303. [Google Scholar] [CrossRef]
- Wei, L.; Cao, L.; Xiong, S.; You, J.; Hu, Y.; Liu, R. Effects of pH on Self-Assembly of Silver Carp Myosin at Low Temperature. Food Biosci. 2019, 30, 100420. [Google Scholar] [CrossRef]
- Diao, X.; Guan, H.; Zhao, X.; Diao, X.; Kong, B. Physicochemical and structural properties of composite gels prepared with myofibrillar protein and lard diacylglycerols. Meat Sci. 2016, 121, 333–341. [Google Scholar] [CrossRef] [PubMed]
- Xia, W.; Ma, L.; Chen, X.; Li, X.; Zhang, Y. Physicochemical and structural properties of composite gels prepared with myofibrillar protein and lecithin at various ionic strengths. Food Hydrocoll. 2018, 82, 135–143. [Google Scholar] [CrossRef]
- Huang, X.; Cui, Y.; Shi, L.; Yang, S.; Qiu, X.; Hao, G.; Zhao, Y.; Liu, S.; Liu, Z.; Weng, W.; et al. Structural Properties and Emulsification of Myofibrillar Proteins from Hairtail (Trichiurus haumela) at Different Salt Ions. Int. J. Biol. Macromol. 2023, 253, 127598. [Google Scholar] [CrossRef]
- Lu, S.; Wang, H.; Kang, R.; Feng, Z.; Liu, D.; Pei, Z.; Liu, J.; Xue, C.; Shen, X.; Cao, J.; et al. Impact of pH and NaCl on the Molecular Conformation of Myosin and Myosin Microgel and Underlying Mechanism: A Comprehensive Study Using Spectroscopy and Molecular Dynamics Simulation. LWT 2023, 189, 115517. [Google Scholar] [CrossRef]
- Zhang, L.; Lin, W.; Zhang, Y.; Tang, C. New Insights into the NaCl Impact on Emulsifying Properties of Globular Proteins. Food Hydrocoll. 2022, 124, 107342. [Google Scholar] [CrossRef]
- Hu, Y.; Zhang, M.; Zhao, Y.; Gao, X.; You, J.; Yin, T.; Xiong, S.; Liu, R. Effects of Different Calcium Salts on the Physicochemical Properties of Sliver Carp Myosin. Food Biosci. 2022, 47, 101518. [Google Scholar] [CrossRef]
- Jiang, Y.; Zhu, Y.; Zheng, Y.; Liu, Z.; Zhong, Y.; Deng, Y.; Zhao, Y. Effects of Salting-in/out-Assisted Extractions on Structural, Physicochemical and Functional Properties of Tenebrio Molitor Larvae Protein Isolates. Food Chem. 2021, 338, 128158. [Google Scholar] [CrossRef]
- He, Y.; Zhou, C.; Li, C.; Zhou, G. Effect of Incubation Temperature on the Binding Capacity of Flavor Compounds to Myosin. Food Chem. 2021, 346, 128976. [Google Scholar] [CrossRef]
- Huo, C.; Liu, G.; Xu, M.; Li, X.; Zong, W.; Liu, R. Characterizing the Binding Interactions of Sodium Benzoate with Lysozyme at the Molecular Level Using Multi-Spectroscopy, ITC and Modeling Methods. Spectrochim. Acta Part A Mol. Biomol. Spectrosc. 2021, 263, 120213. [Google Scholar] [CrossRef] [PubMed]
- Wang, H.; Zhu, J.; Zhang, H.; Chen, Q.; Kong, B. Understanding interactions among aldehyde compounds and porcine myofibrillar proteins by spectroscopy and molecular dynamics simulations. J. Mol. Liq. 2022, 349, 118190. [Google Scholar] [CrossRef]
- Li, S.; Chen, C.; Ahn, D.U.; Ma, M.; Li, X.; Huang, X. Interaction Research of Resveratrol and Phosvitin Based on Fluorescence Spectroscopy and Molecular Docking Analysis. J. Food Sci. 2022, 87, 4416–4428. [Google Scholar] [CrossRef] [PubMed]
- Ioannou, F.; Archontis, G.; Leontidis, E. Specific Interactions of Sodium Salts with Alanine Dipeptide and Tetrapeptide in Water: Insights from Molecular Dynamics. J. Phys. Chem. B 2011, 115, 13389–13400. [Google Scholar] [CrossRef]
- Yang, L.; Guo, S.; Liao, C.; Hou, C.; Jiang, S.; Li, J.; Ma, X.; Shi, L.; Ye, L.; He, X. Spatial Layouts of Low-Entropy Hydration Shells Guide Protein Binding. Glob. Chall. 2023, 7, 2300022. [Google Scholar] [CrossRef]
- Pastor, A.; Singh, A.K.; Fisher, M.T.; Chaudhuri, T.K. Protein Folding on Biosensor Tips: Folding of Maltodextrin Glucosidase Monitored by Its Interactions with GroEL. FEBS J. 2016, 283, 3103–3114. [Google Scholar] [CrossRef]
- Hothar, M.; Wadsö, L. Accurate Heat Capacity Determination of Solids and Liquids Using a Heat Conduction Calorimeter. J. Therm. Anal. Calorim. 2024, 149, 2179–2188. [Google Scholar] [CrossRef]
- Piedmonte, D.M.; Summers, C.; McAuley, A.; Karamujic, L.; Ratnaswamy, G. Sorbitol Crystallization Can Lead to Protein Aggregation in Frozen Protein Formulations. Pharm. Res. 2007, 24, 136–146. [Google Scholar] [CrossRef]
- Yeritsyan, K.; Badasyan, A. Differential Scanning Calorimetry of Proteins and Zimm–Bragg Model in Water. Arch. Biochem. Biophys. 2024, 760, 110132. [Google Scholar] [CrossRef]
- Ribotta, P.D.; Le Bail, A. Effect of Additives on the Thermo-Mechanical Behaviour of Dough Systems at Sub-Freezing Temperatures. Eur. Food Res. Technol. 2007, 224, 519–524. [Google Scholar] [CrossRef]
- Barma, M.C.; Peng, Z.; Moghtaderi, B.; Doroodchi, E. Effects of Drop Size and Salt Concentration on the Freezing Temperature of Supercooled Drops of Salt Solutions. Sep. Purif. Technol. 2021, 274, 118925. [Google Scholar] [CrossRef]
- Pokorný, V.; Štejfa, V.; Havlín, J.; Růžička, K.; Fulem, M. Heat Capacities of L-Histidine, l-Phenylalanine, l-Proline, l-Tryptophan and l-Tyrosine. Molecules 2021, 26, 4298. [Google Scholar] [CrossRef] [PubMed]
- Wu, Z.; Xu, J.; Ruan, J.; Chen, J.; Li, X.; Yu, Y.; Xie, X.; Tang, J.; Zhang, D.; Li, H. Probing the Mechanism of Interaction between Capsaicin and Myofibrillar Proteins through Multispectral, Molecular Docking, and Molecular Dynamics Simulation Methods. Food Chem. X 2023, 18, 100734. [Google Scholar] [CrossRef] [PubMed]
- Tarek, M.; Tobias, D.J. The Dynamics of Protein Hydration Water: A Quantitative Comparison of Molecular Dynamics Simulations and Neutron-Scattering Experiments. Biophys. J. 2000, 79, 3244–3257. [Google Scholar] [CrossRef]
- Liu, H.; Xiang, S.; Zhu, H.; Li, L. The Structural and Dynamical Properties of the Hydration of SNase Based on a Molecular Dynamics Simulation. Molecules 2021, 26, 5403. [Google Scholar] [CrossRef]
- Tarek, M.; Tobias, D.J. Role of Protein-Water Hydrogen Bond Dynamics in the Protein Dynamical Transition. Phys. Rev. Lett. 2002, 88, 138101. [Google Scholar] [CrossRef]
- Camisasca, G.; Iorio, A.; De Marzio, M.; Gallo, P. Structure and Slow Dynamics of Protein Hydration Water. J. Mol. Liq. 2018, 268, 903–910. [Google Scholar] [CrossRef]

| Sample | K (M−1 × 10²) | ∆H (kJ·mol−1) | −T∆S (kJ·mol−1) | ∆G (kJ·mol−1) |
|---|---|---|---|---|
| Myosin | 3.87 ± 0.12 | 173.9 ± 1.8 | −181.9 ± 2.1 | −8.061 ± 0.504 |
| Ionic Strength (mol/L) | Onset Temperature To (°C) | Peak Temperature Tp (°C) | End Temperature Te (°C) | ∆H (J/g) |
|---|---|---|---|---|
| 0.0 | −7.65 ± 0.22 a | 0.77 ± 0.04 a | 3.27 ± 0.23 a | 262.97 ± 7.00 a |
| 0.2 | −14.29 ± 2.88 b | −0.70 ± 0.04 b | 1.65 ± 0.12 b | 213.67 ± 6.15 b |
| 0.4 | −18.93 ± 0.15 c | −1.94 ± 0.06 c | 0.29 ± 0.32 c | 188.50 ± 5.57 c |
| 0.6 | −18.35 ± 1.01 c | −3.20 ± 0.24 d | −1.65 ± 0.36 d | 146.47 ± 8.84 d |
| 0.8 | −19.14 ± 1.16 c | −4.96 ± 0.34 e | −4.31 ± 0.34 e | 110.85 ± 7.89 e |
| 1.0 | −21.68 ± 0.22 d | −5.93 ± 0.20 f | −5.02 ± 0.22 f | 120.23 ± 8.58 e |
Disclaimer/Publisher’s Note: The statements, opinions and data contained in all publications are solely those of the individual author(s) and contributor(s) and not of MDPI and/or the editor(s). MDPI and/or the editor(s) disclaim responsibility for any injury to people or property resulting from any ideas, methods, instructions or products referred to in the content. |
© 2025 by the authors. Licensee MDPI, Basel, Switzerland. This article is an open access article distributed under the terms and conditions of the Creative Commons Attribution (CC BY) license (https://creativecommons.org/licenses/by/4.0/).
Share and Cite
Li, K.; Khoder, R.M.; Gao, Y.; You, J.; Yin, T.; Liu, R. Preliminary Exploration on the Regulatory Mechanism of Ionic Strength on Conformation and Hydration of Silver Carp Myosin. Foods 2025, 14, 1790. https://doi.org/10.3390/foods14101790
Li K, Khoder RM, Gao Y, You J, Yin T, Liu R. Preliminary Exploration on the Regulatory Mechanism of Ionic Strength on Conformation and Hydration of Silver Carp Myosin. Foods. 2025; 14(10):1790. https://doi.org/10.3390/foods14101790
Chicago/Turabian StyleLi, Kaiqi, Ramy M. Khoder, Yanlei Gao, Juan You, Tao Yin, and Ru Liu. 2025. "Preliminary Exploration on the Regulatory Mechanism of Ionic Strength on Conformation and Hydration of Silver Carp Myosin" Foods 14, no. 10: 1790. https://doi.org/10.3390/foods14101790
APA StyleLi, K., Khoder, R. M., Gao, Y., You, J., Yin, T., & Liu, R. (2025). Preliminary Exploration on the Regulatory Mechanism of Ionic Strength on Conformation and Hydration of Silver Carp Myosin. Foods, 14(10), 1790. https://doi.org/10.3390/foods14101790