
Chemical Characterization Analysis, Antioxidants, and Anti-Diabetic Activity of Two Novel Acidic Water-Soluble Polysaccharides Isolated from Baobab Fruits

 ,
,
Abstract
1. Introduction
2. Materials and Experimental
2.1. Materials
2.2. Preparation and Physicochemical Properties of Acidic Polysaccharides
2.3. Chemical Characterizations of Acidic Polysaccharides
2.3.1. Determination of Triple Helix Structure
2.3.2. Determination of Functional Groups
2.3.3. Determination of Molecular Weight
2.3.4. Determination of Monosaccharides’ Compositions
2.3.5. Determination of Chain Confirmation
2.3.6. Determination of Surface Morphology
2.3.7. Determination of Thermal Stability
2.3.8. Confirmation of the Chemical Structure
2.4. Antioxidants Assays
2.4.1. DDPH Test
2.4.2. ABTS+ Test
2.4.3. Ferric-Reducing Antioxidant Power (FRAP) Test
2.5. In Vitro and In Vivo Anti-Diabetic Assay
2.5.1. In Vitro Anti-Diabetic Assay
2.5.2. In Vivo Assays
3. Results and Discussion
3.1. Preparation of Two Types of Baobab Fruits’ Acidic Polysaccharides and Primary Properties
3.2. Characterization Analysis Results of Acidic Polysaccharides
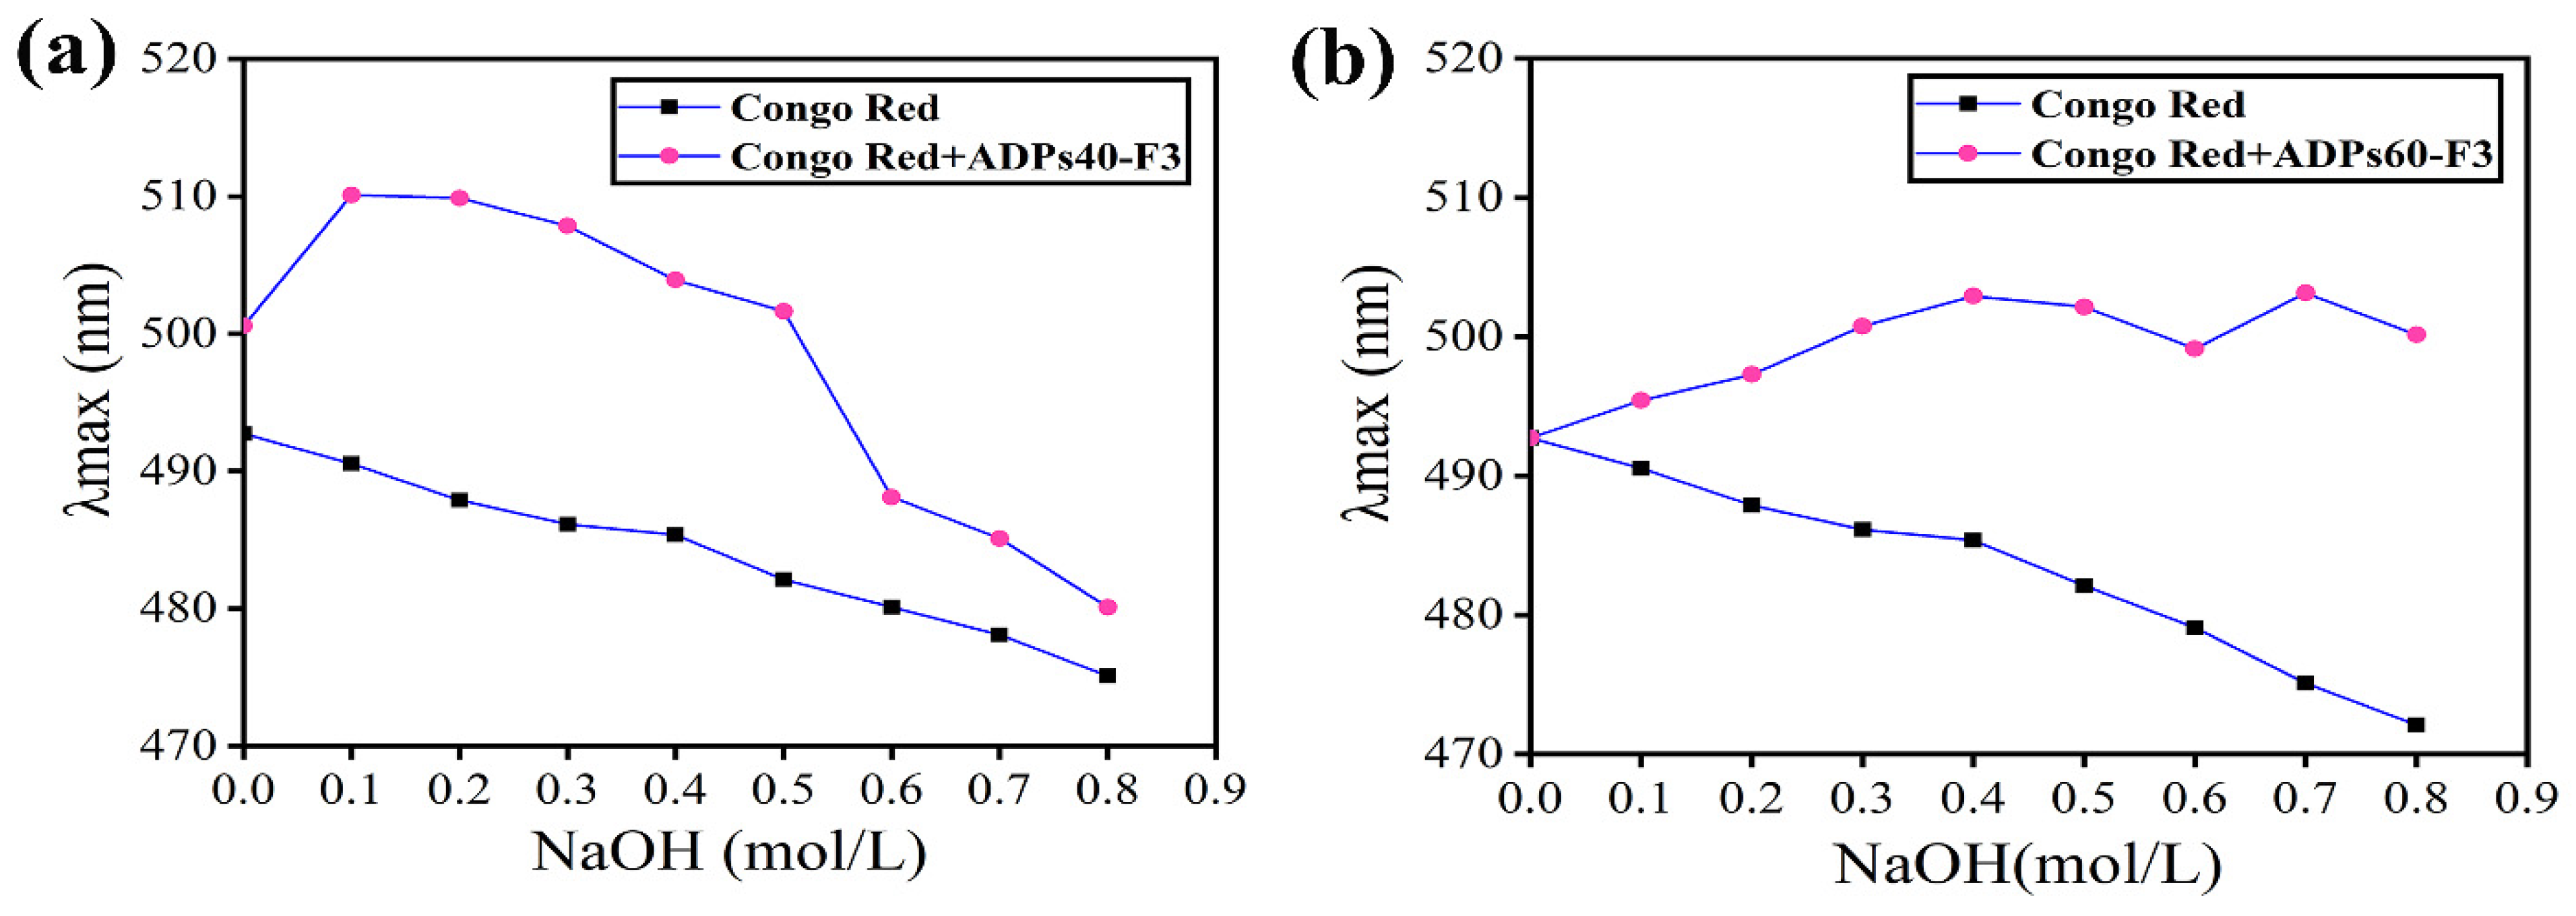
3.2.1. Triple Helix Structure
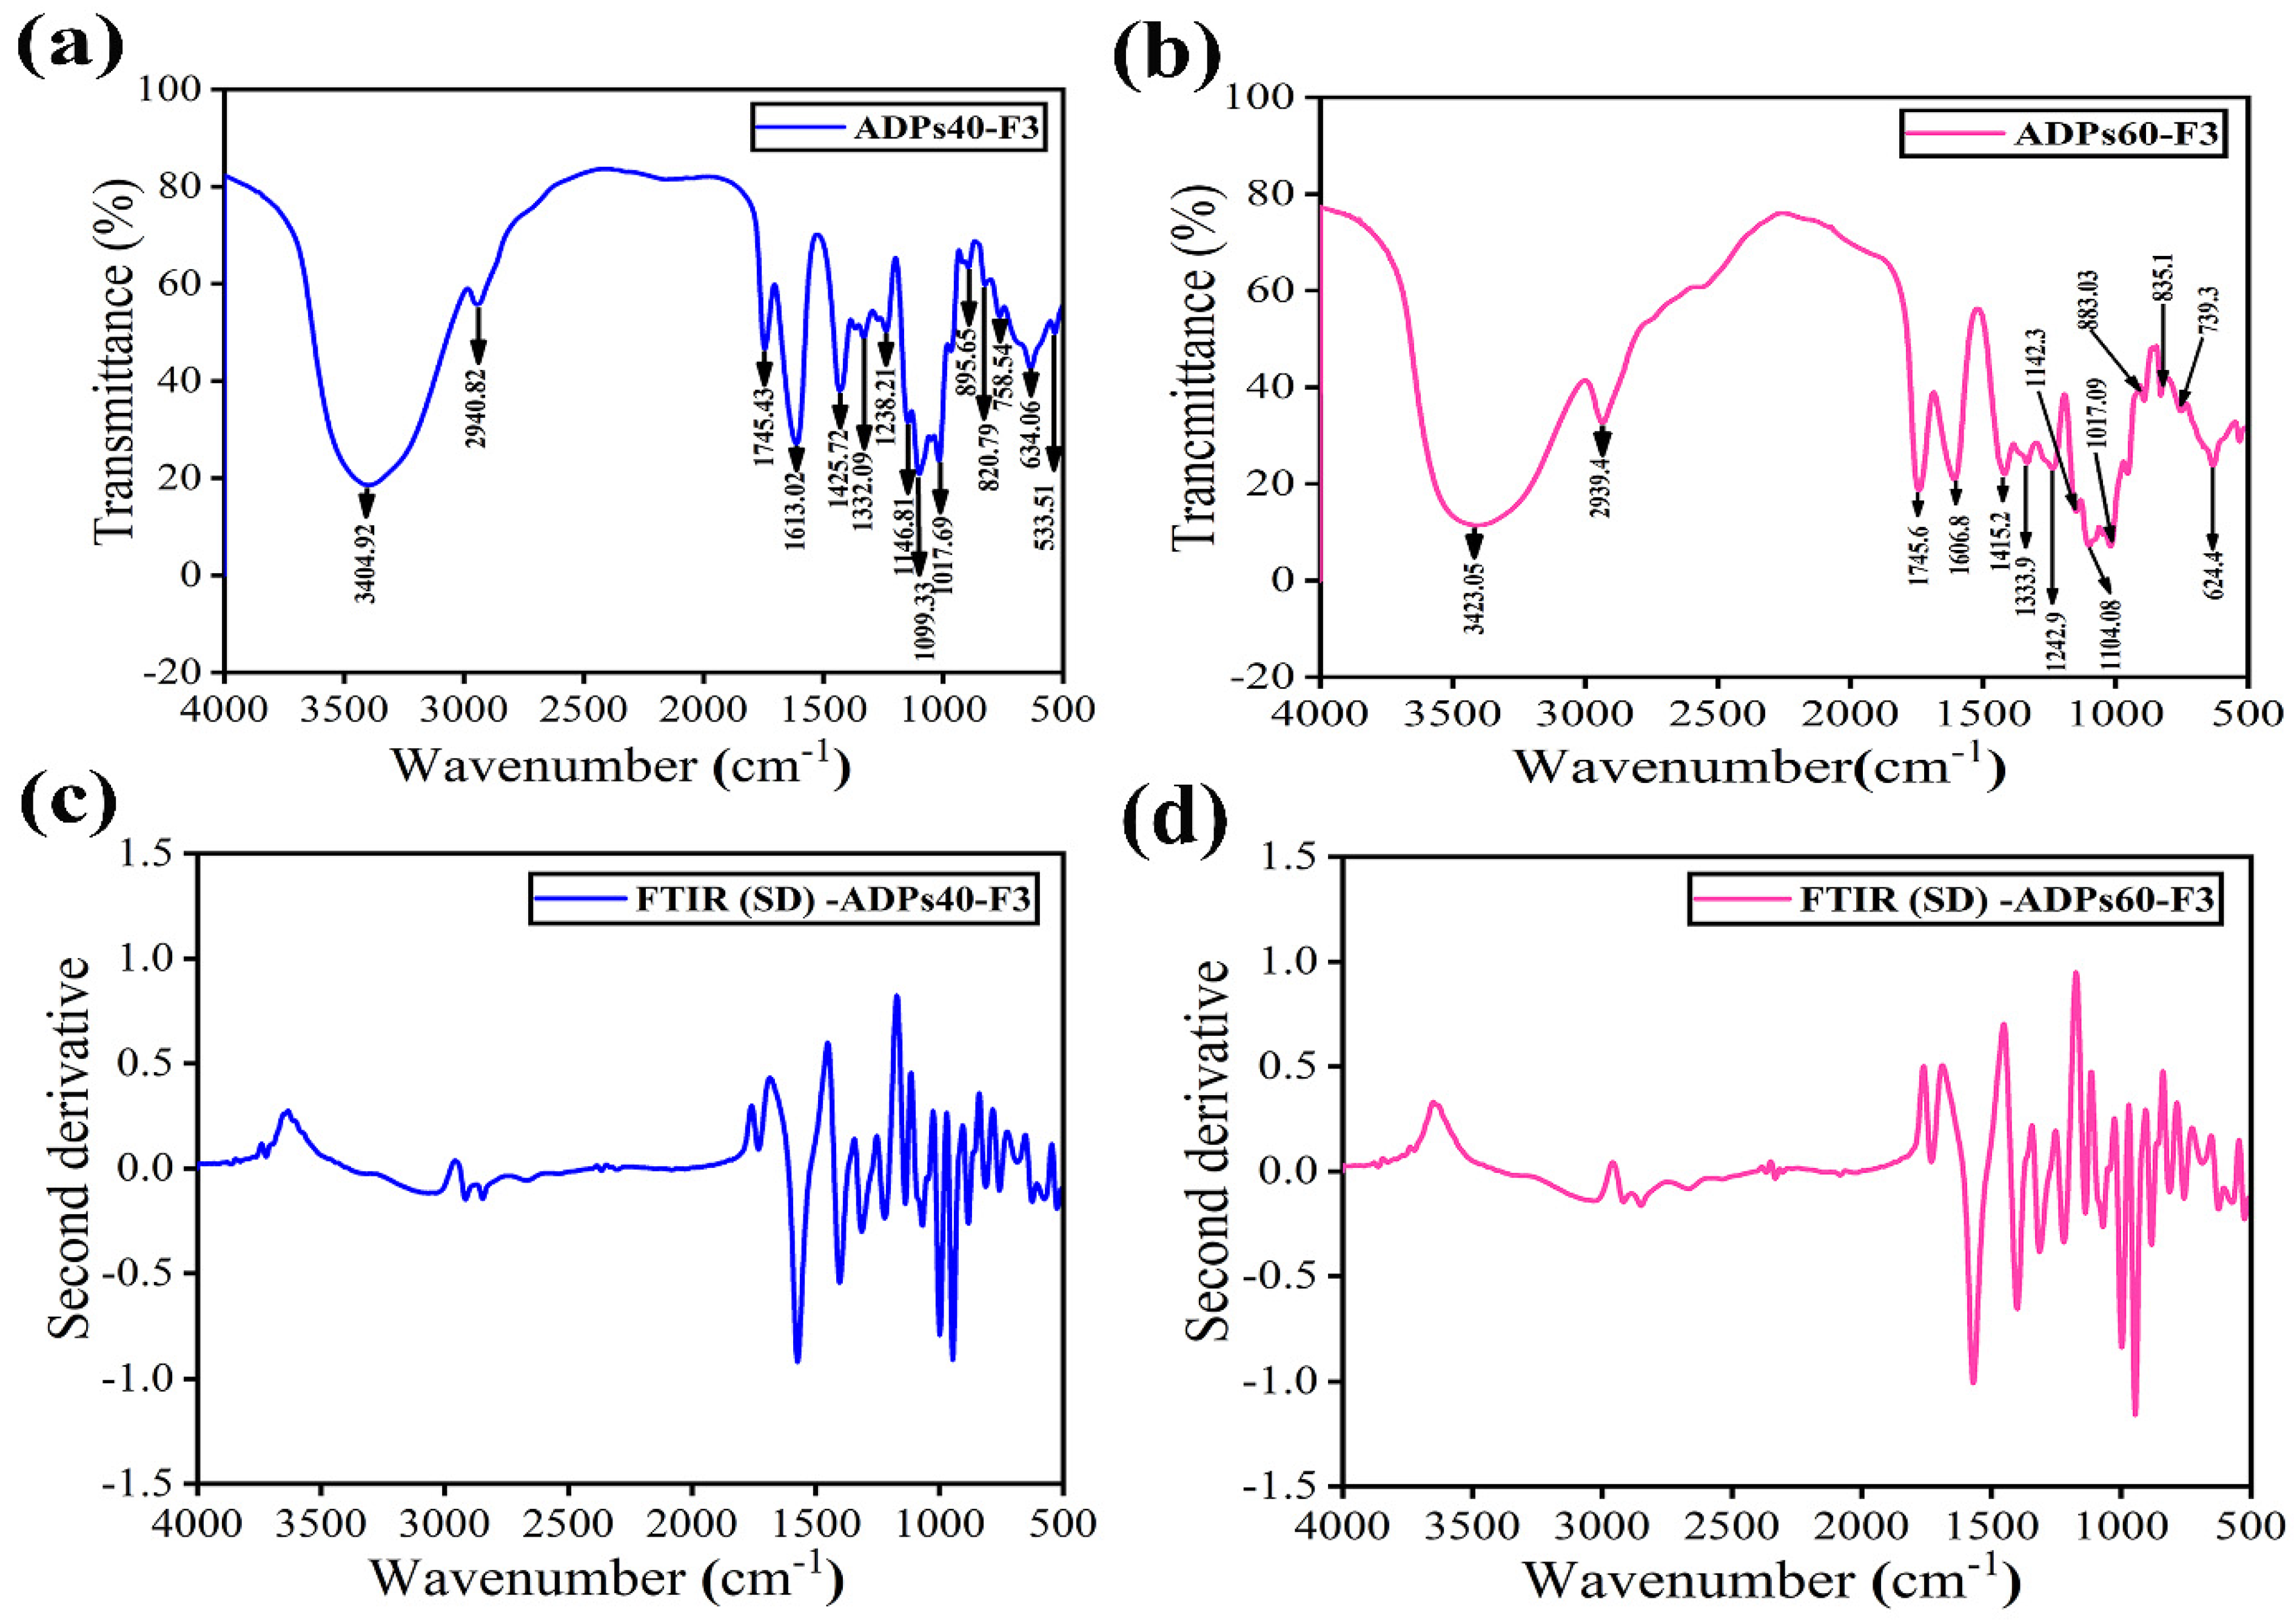
3.2.2. FTIR Analysis
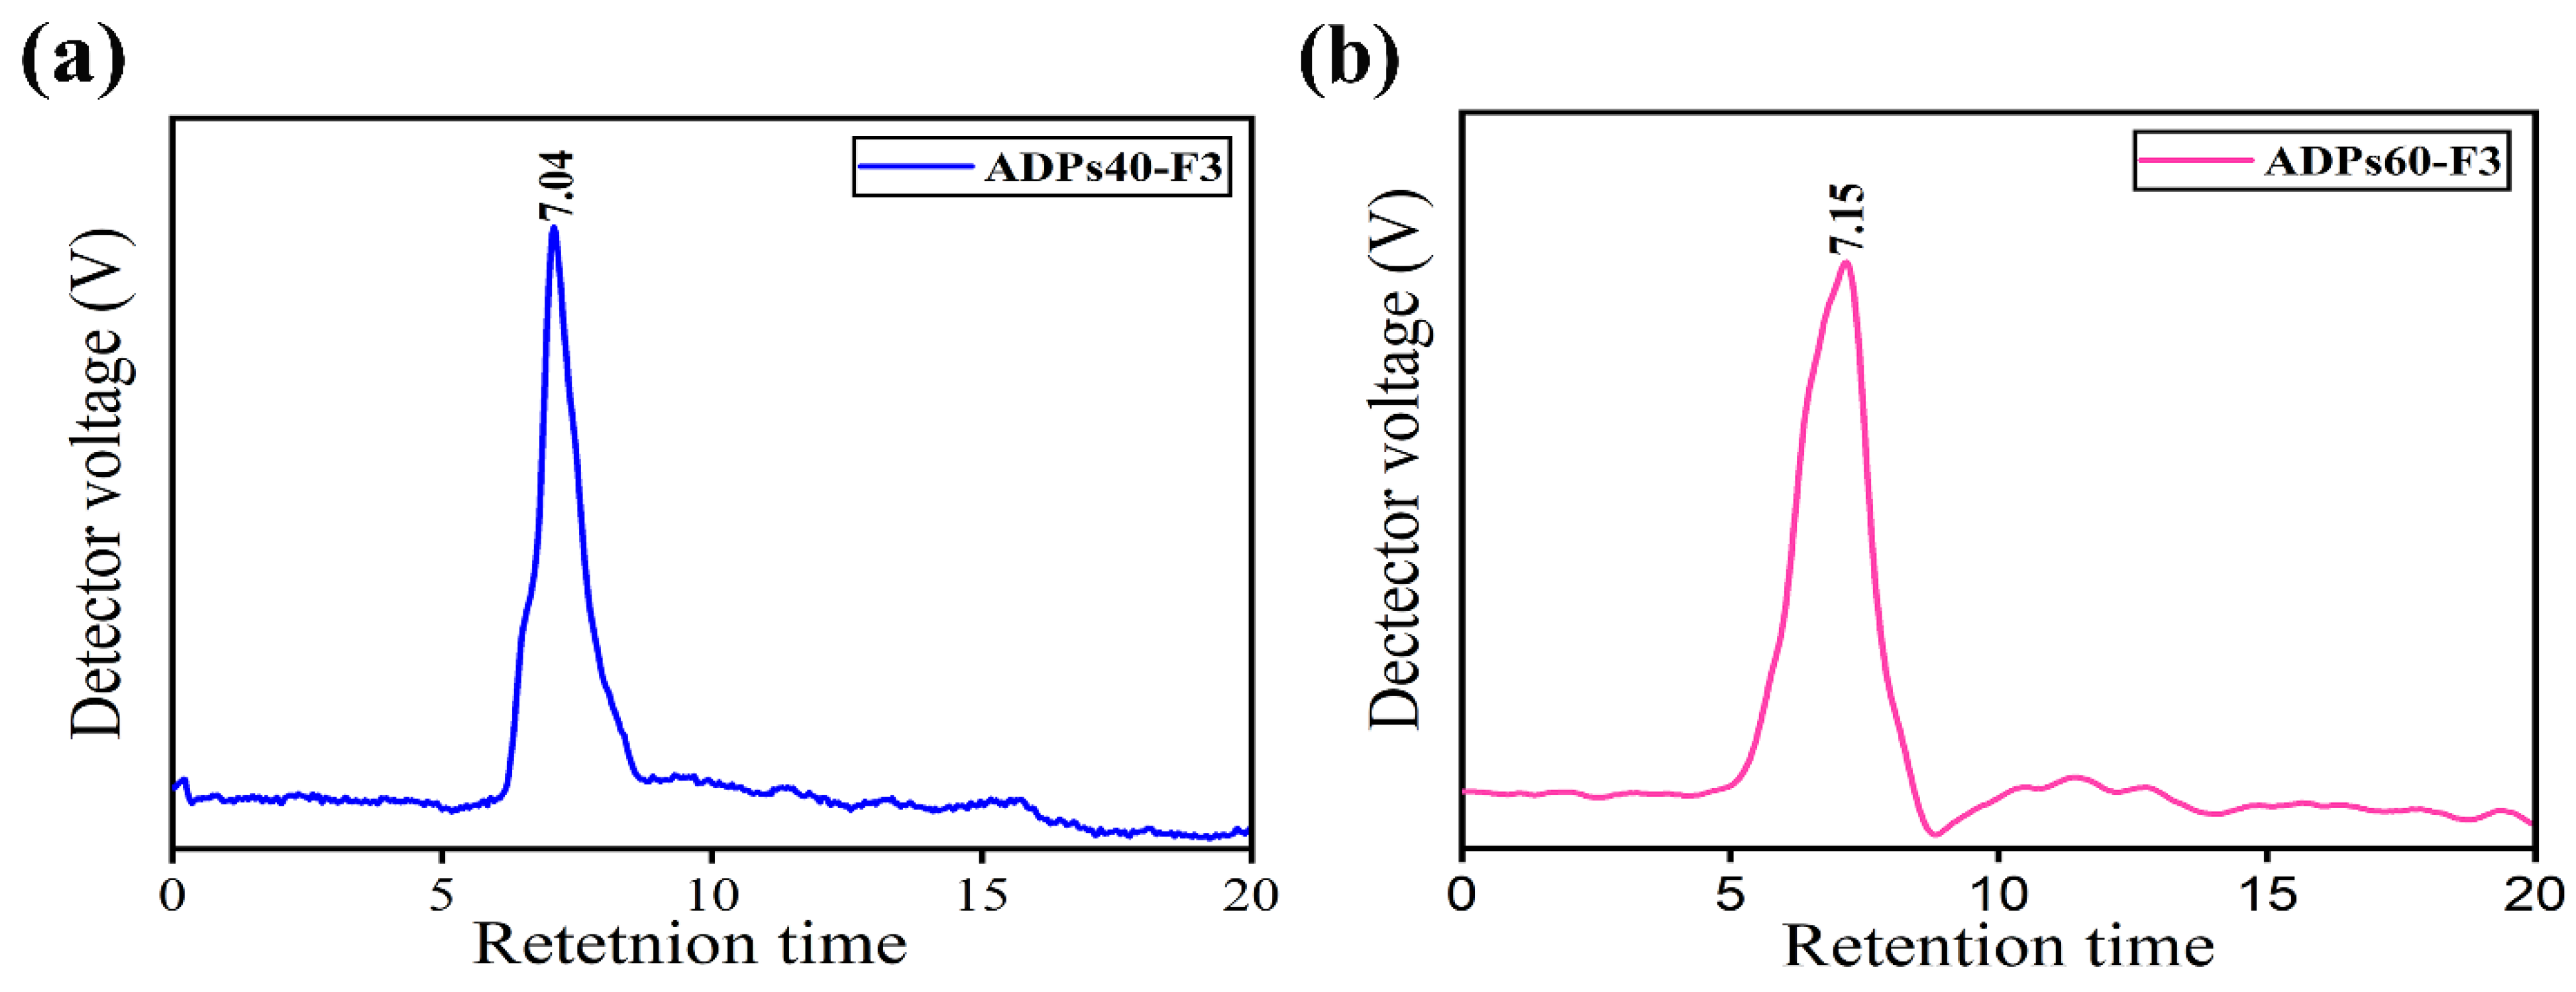
3.2.3. Molecular Weight Analysis
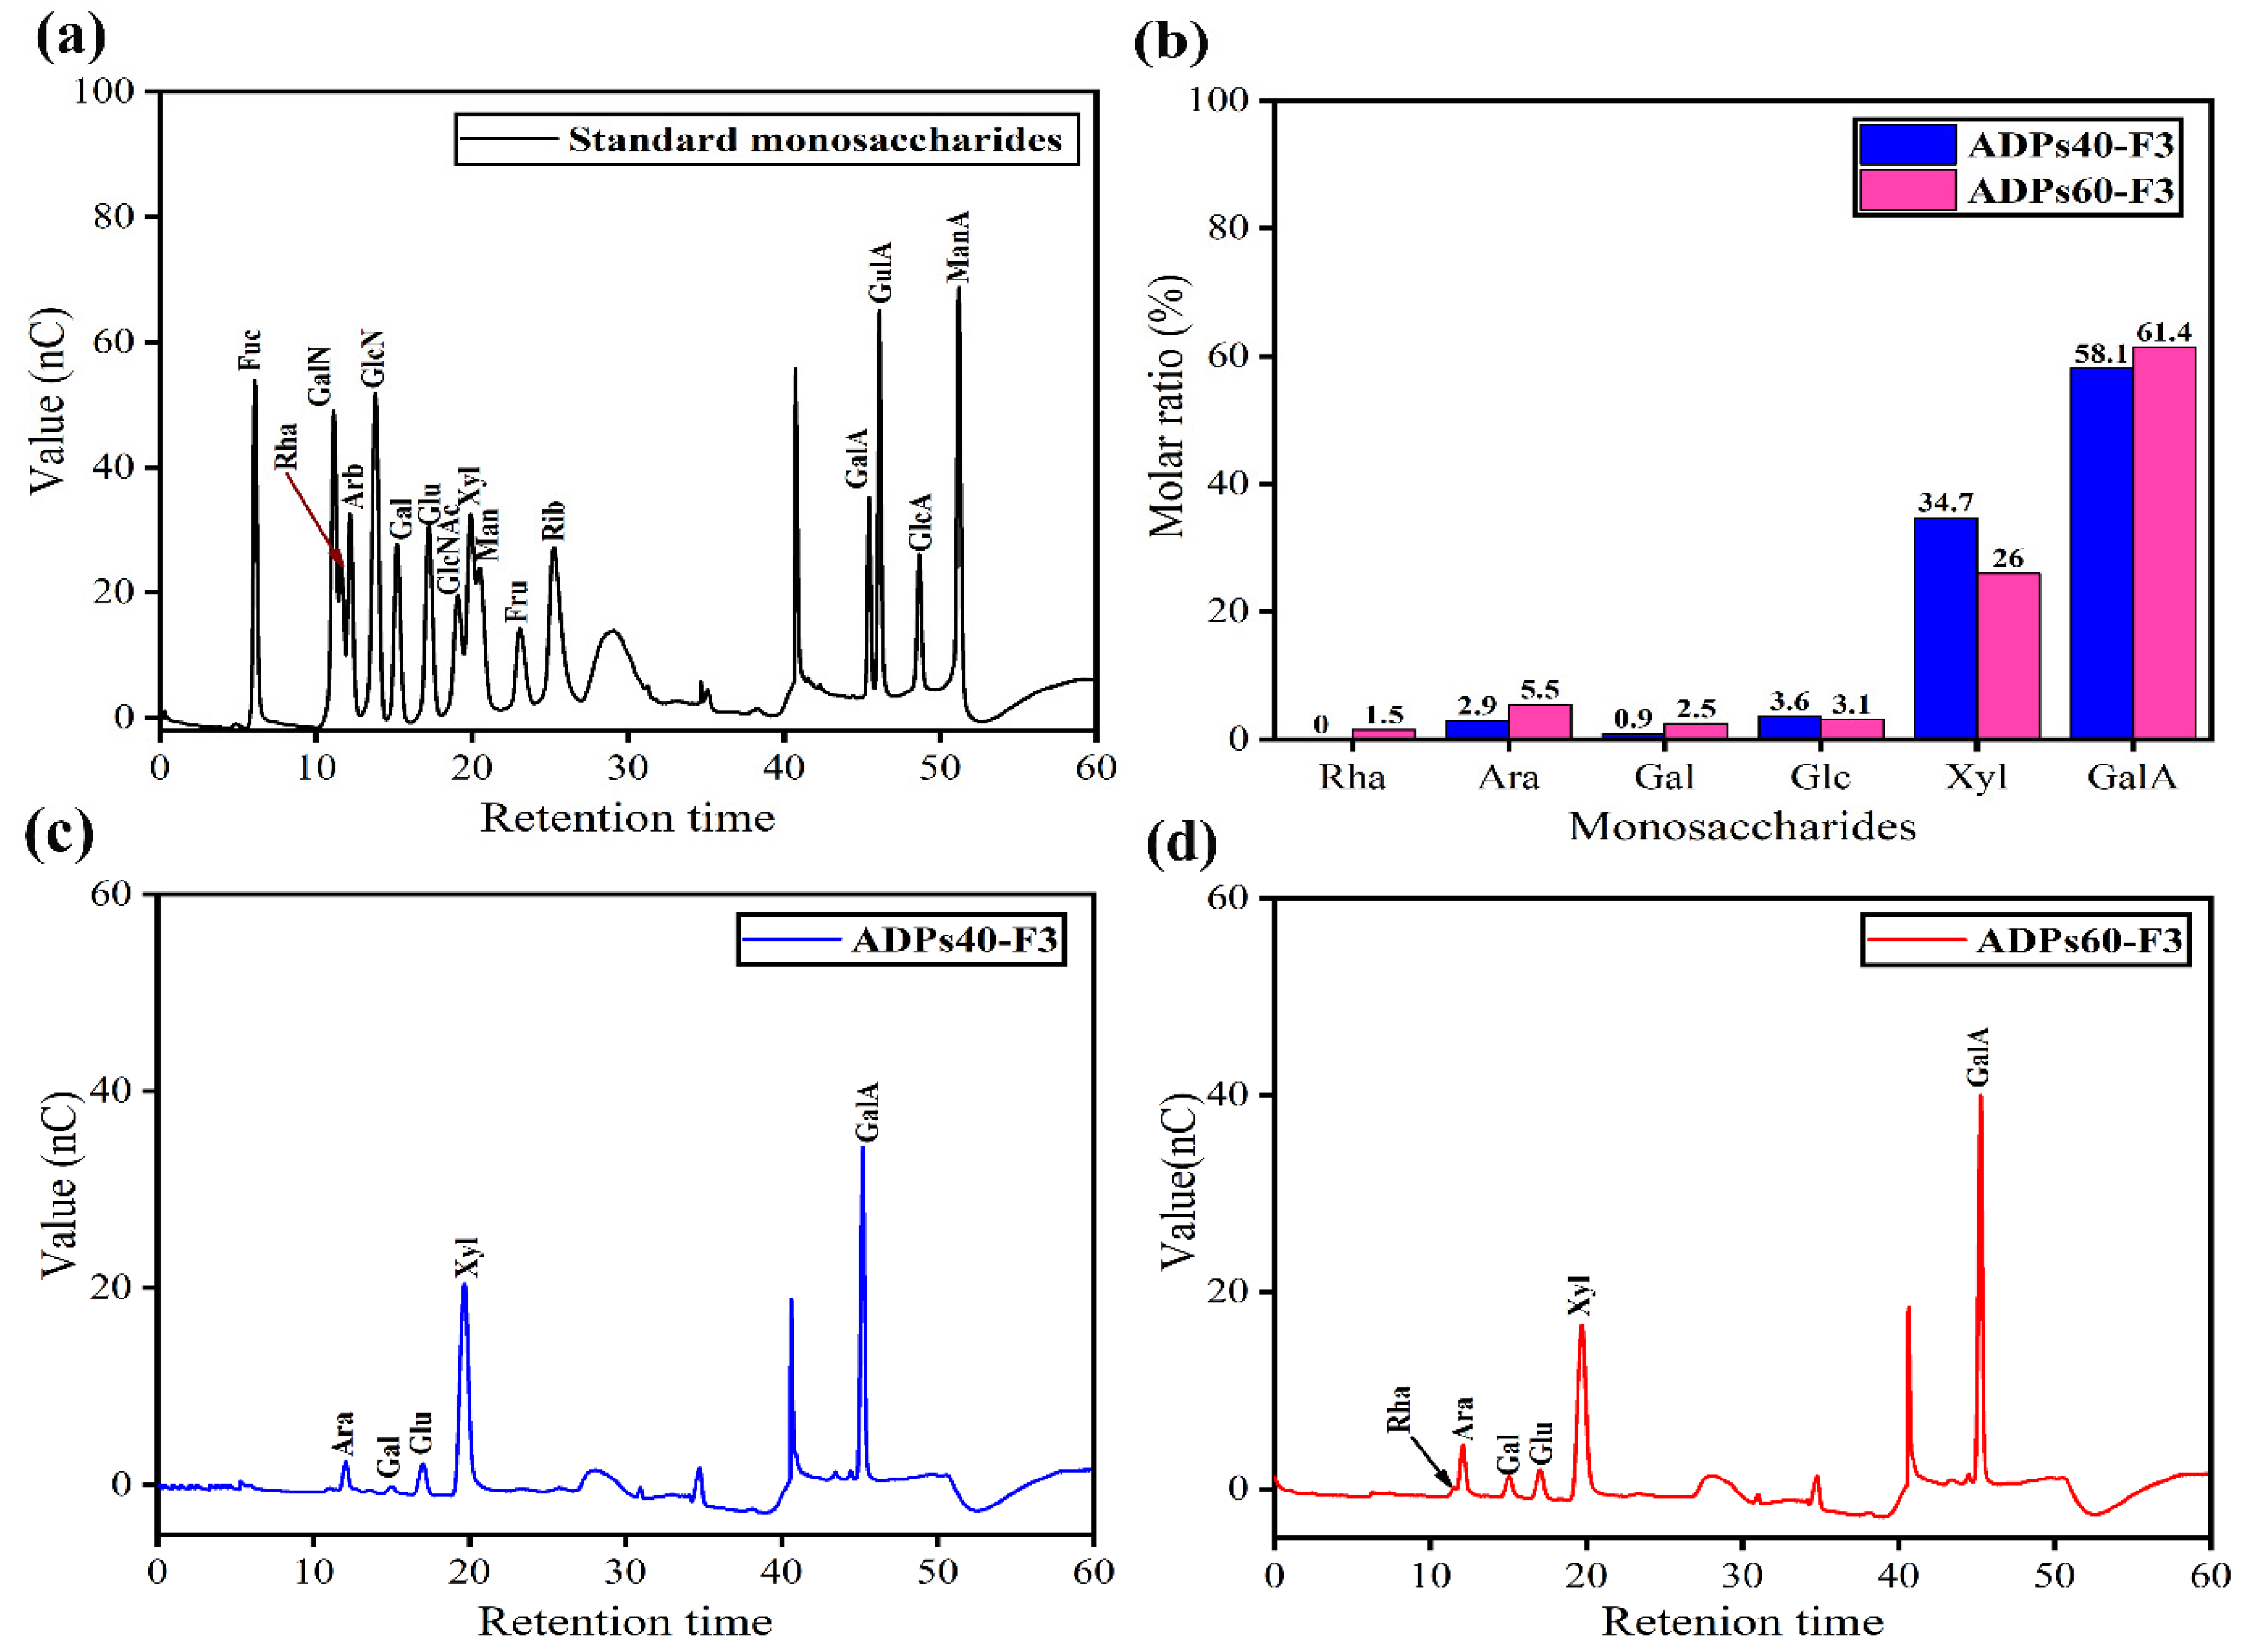
3.2.4. Monosaccharides’ Compositions Analysis
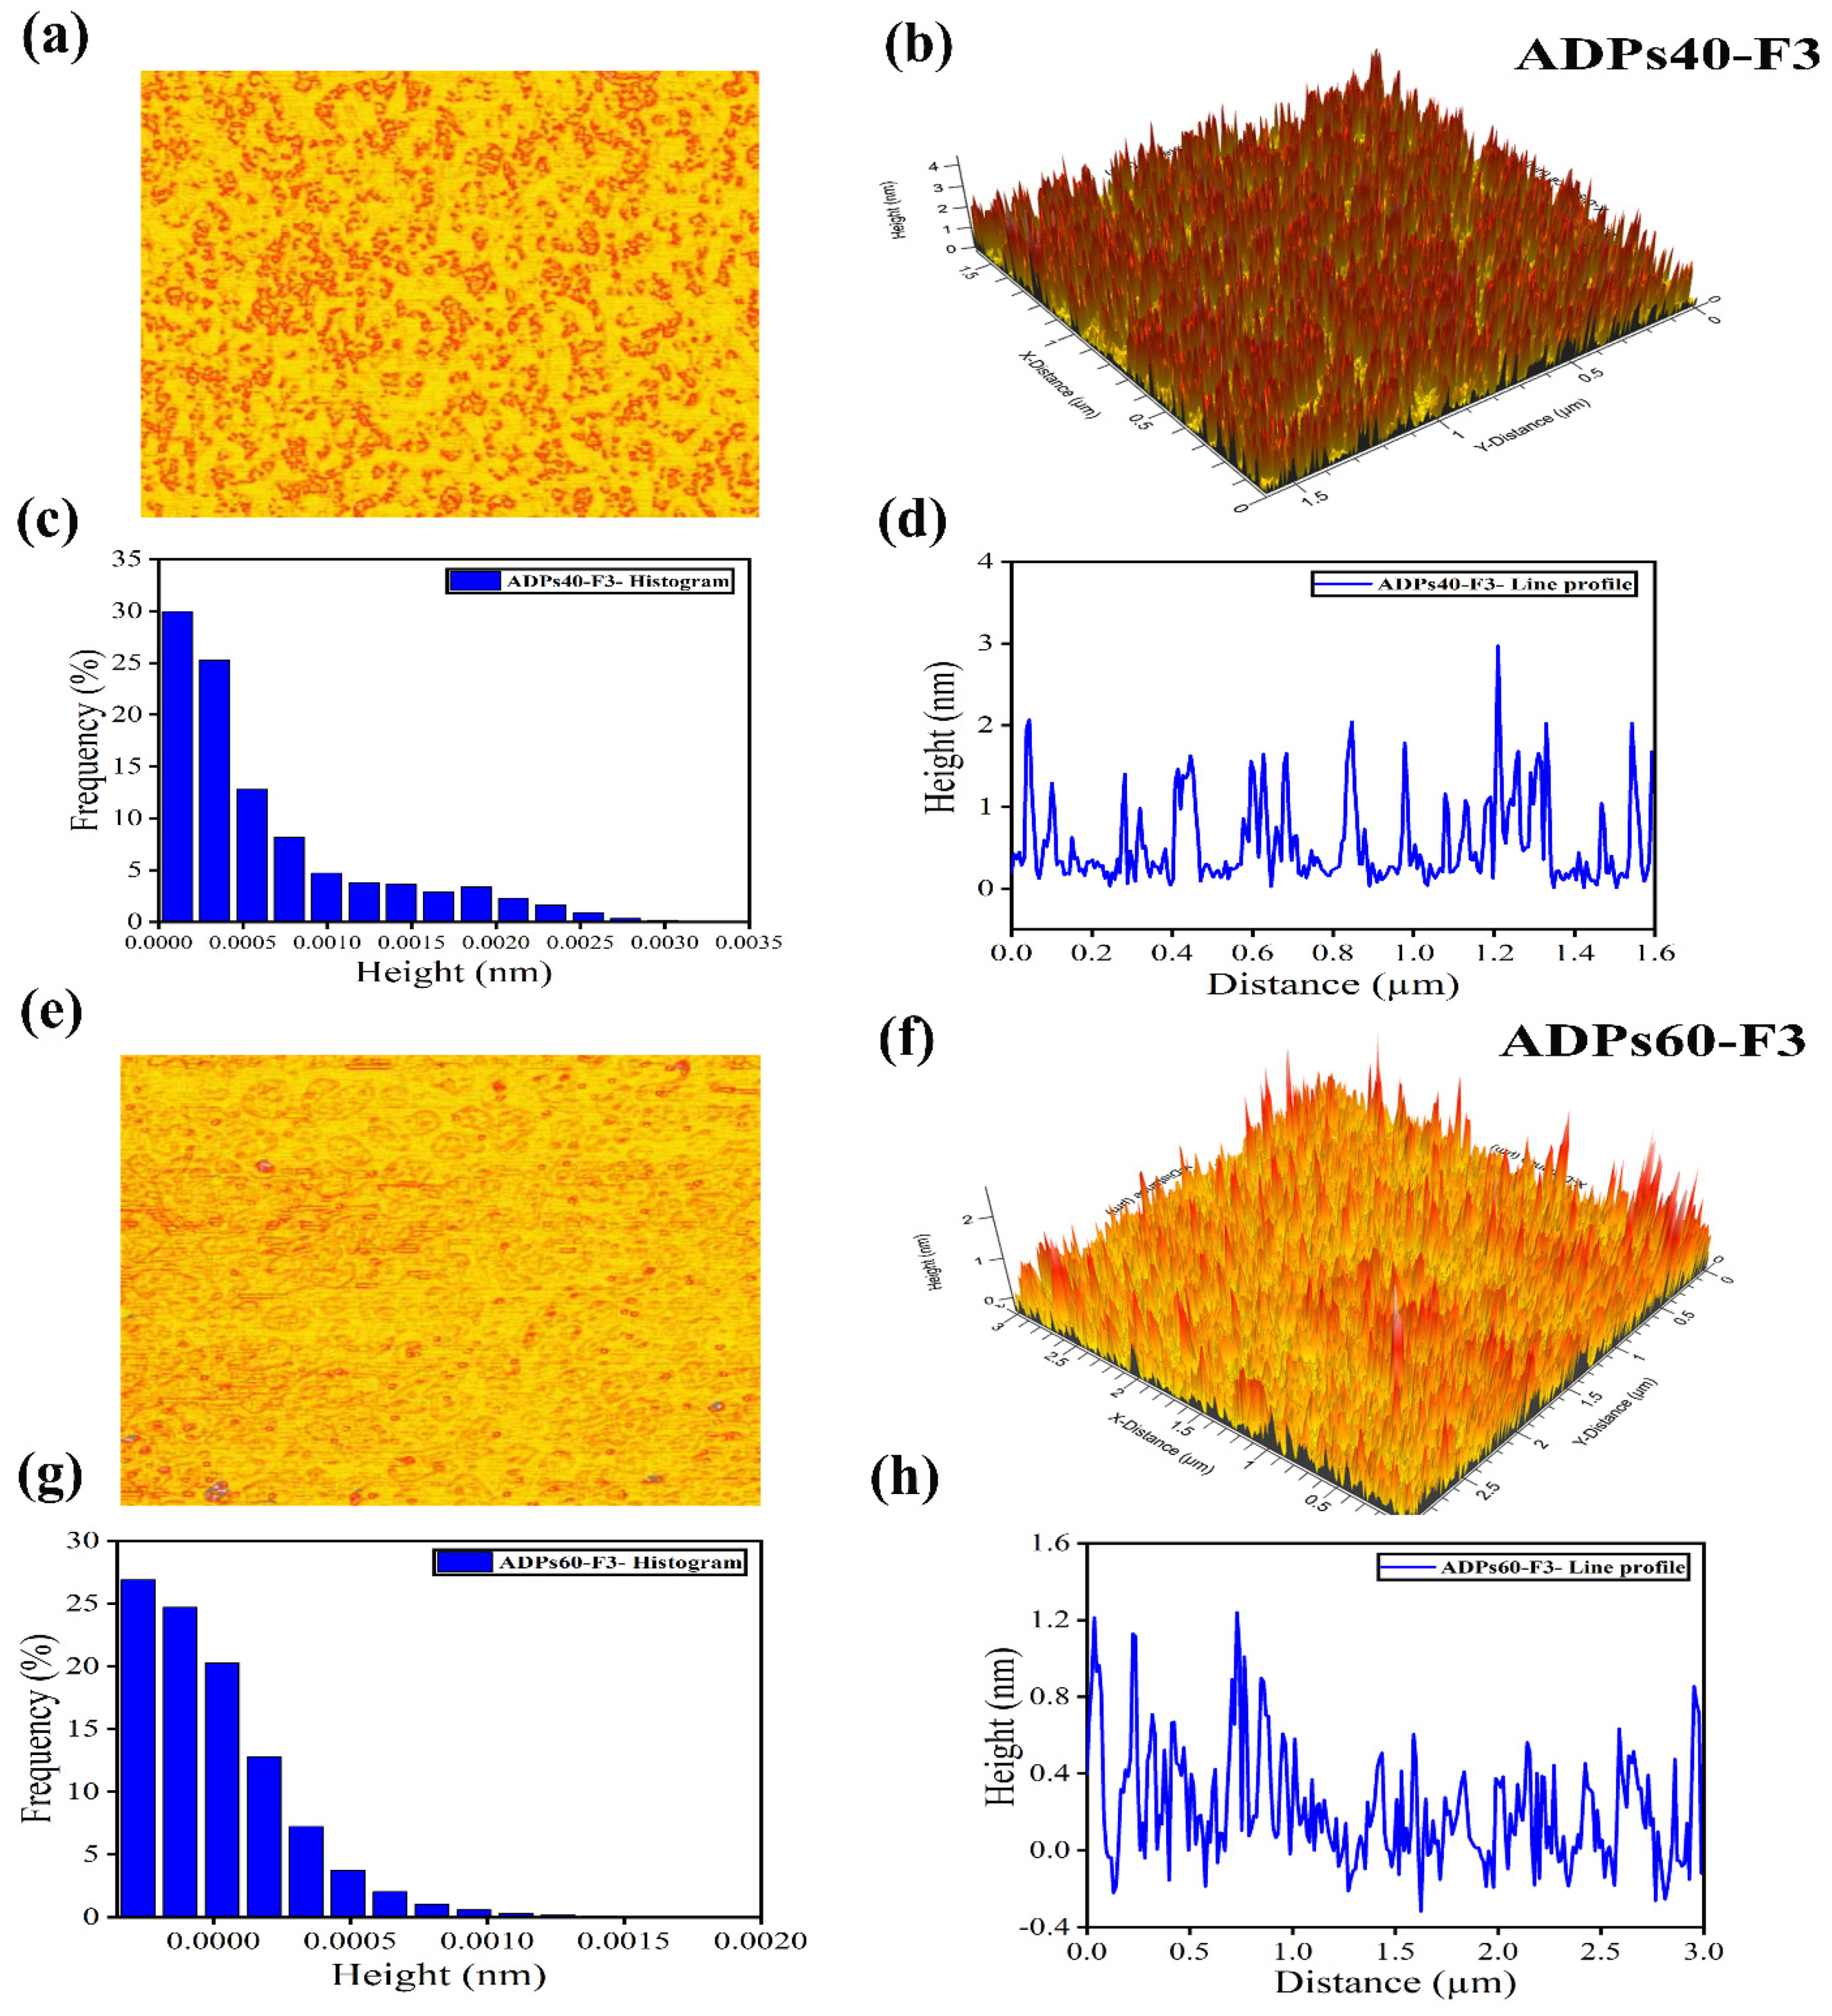
3.2.5. AFM Analysis
3.2.6. SEM Analysis
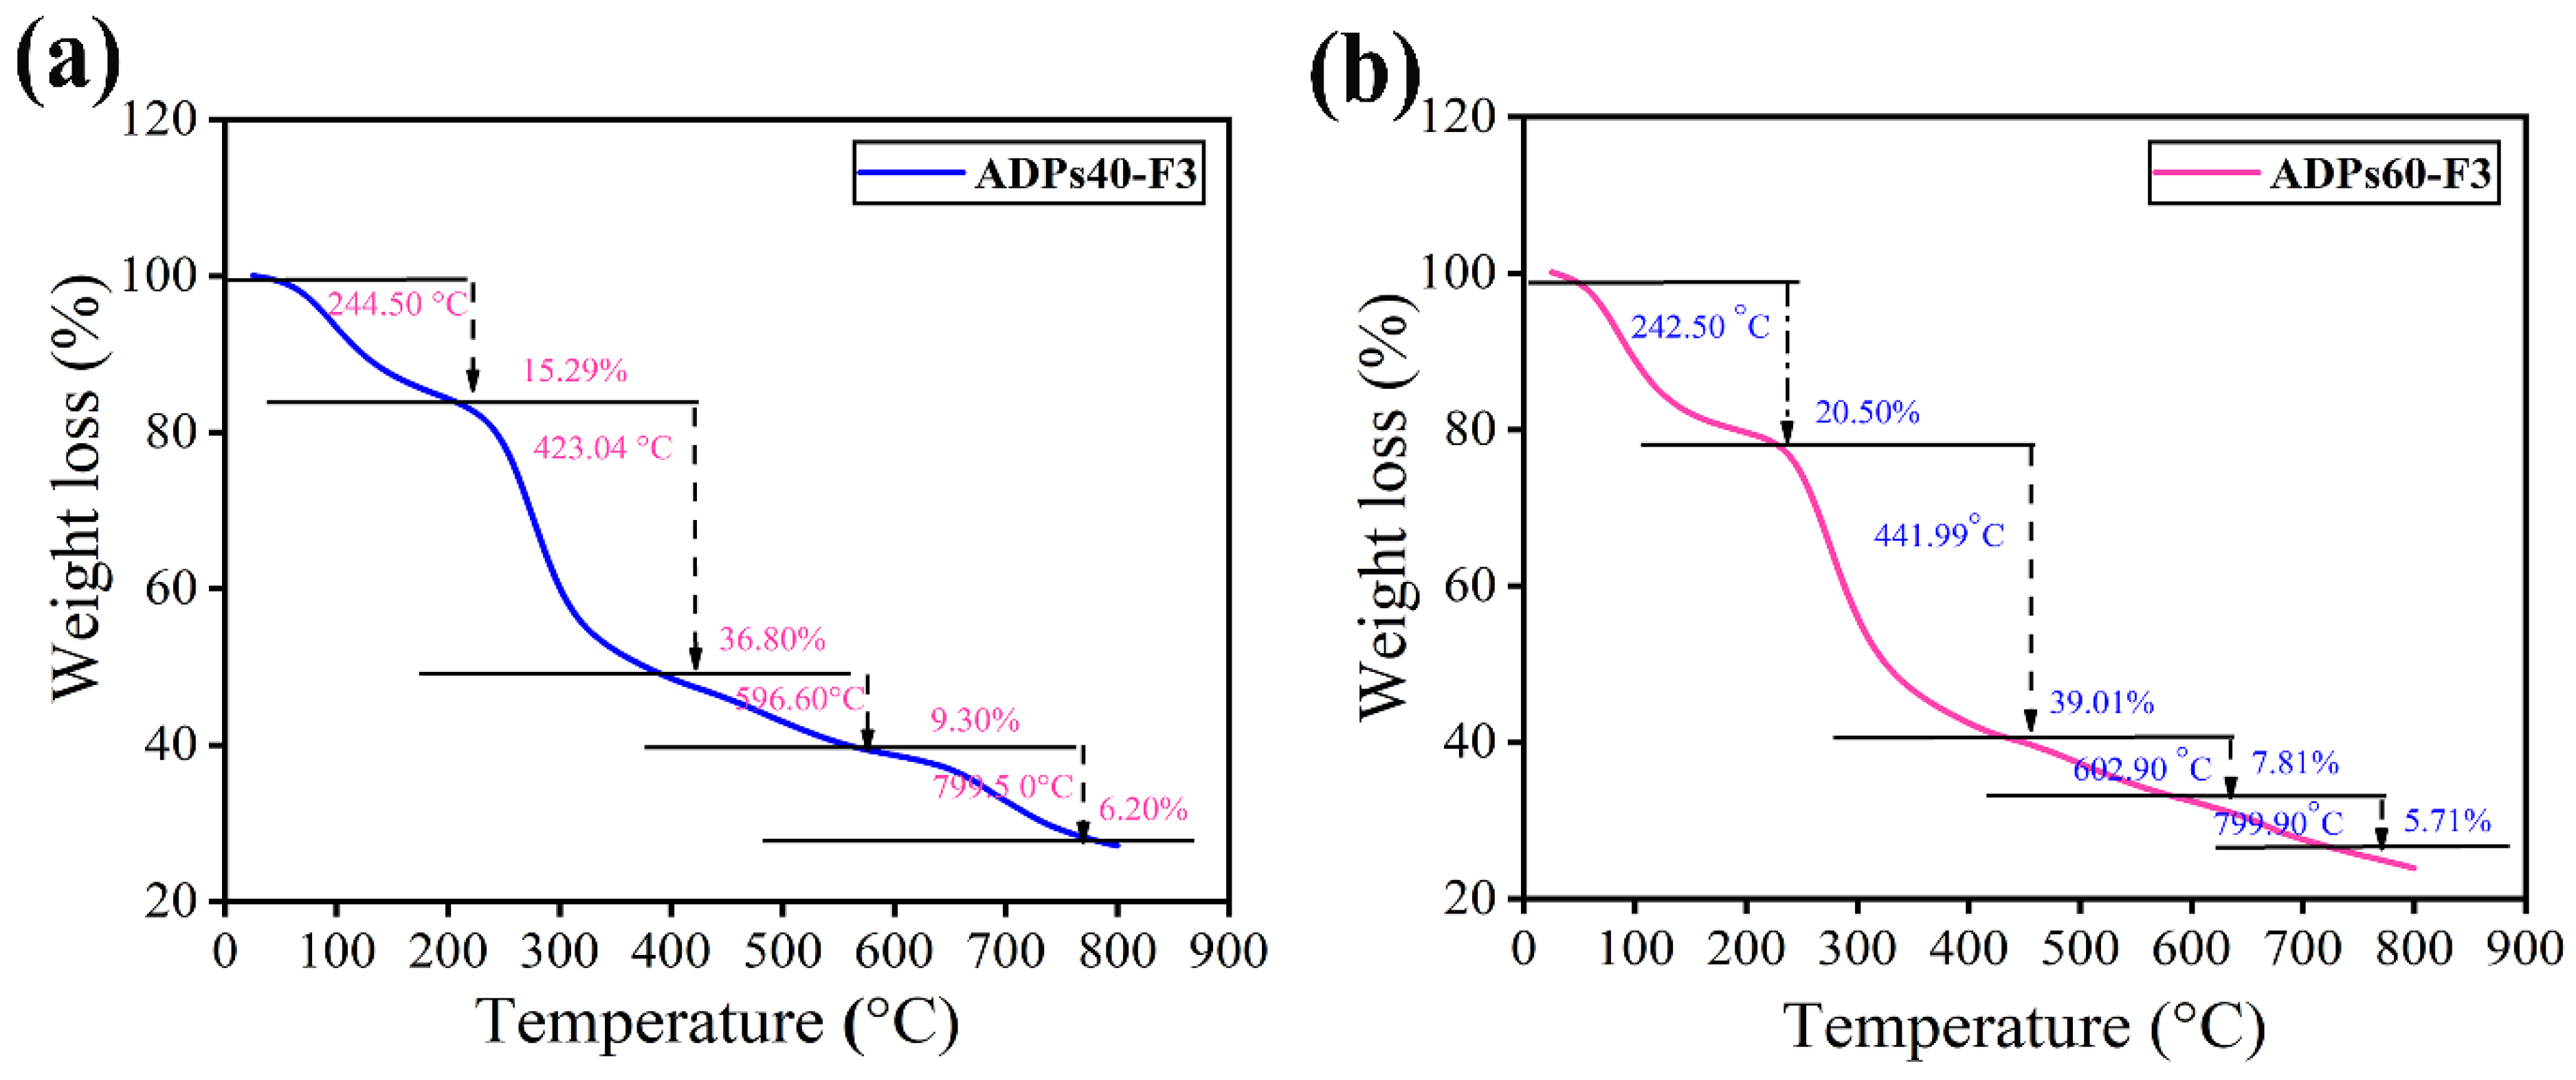
3.2.7. TGA Analysis
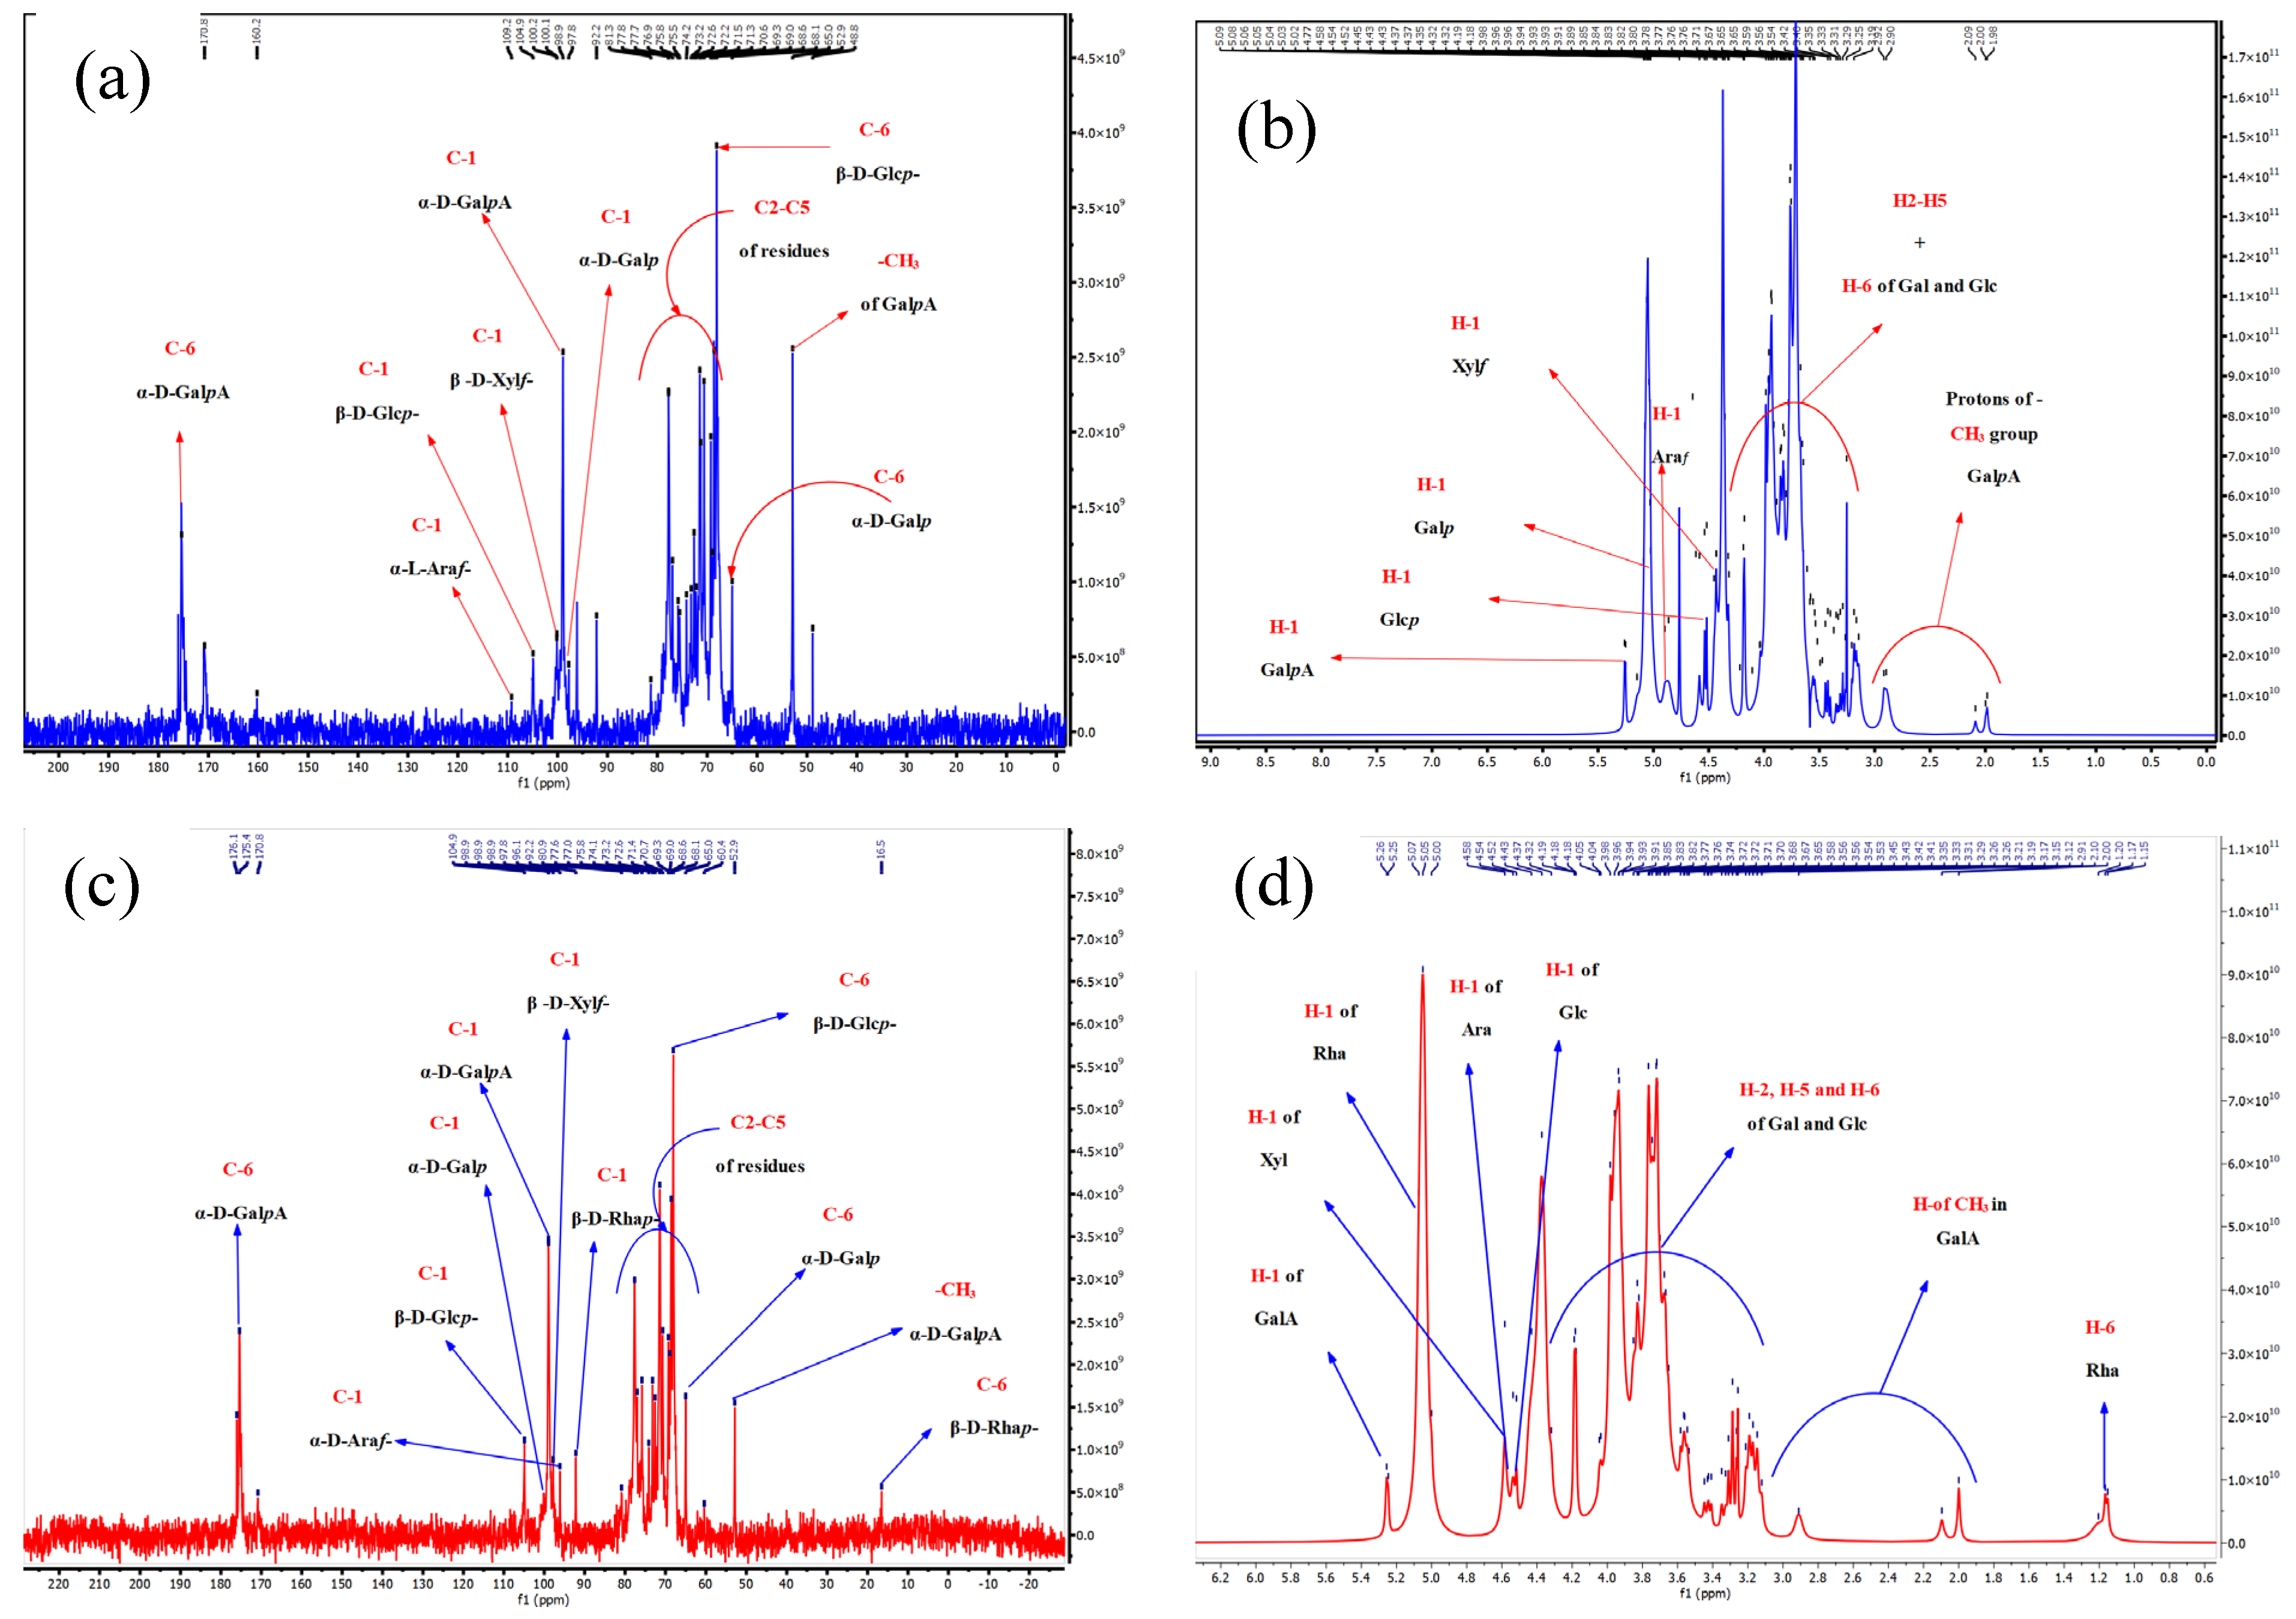
3.2.8. NMR Analysis
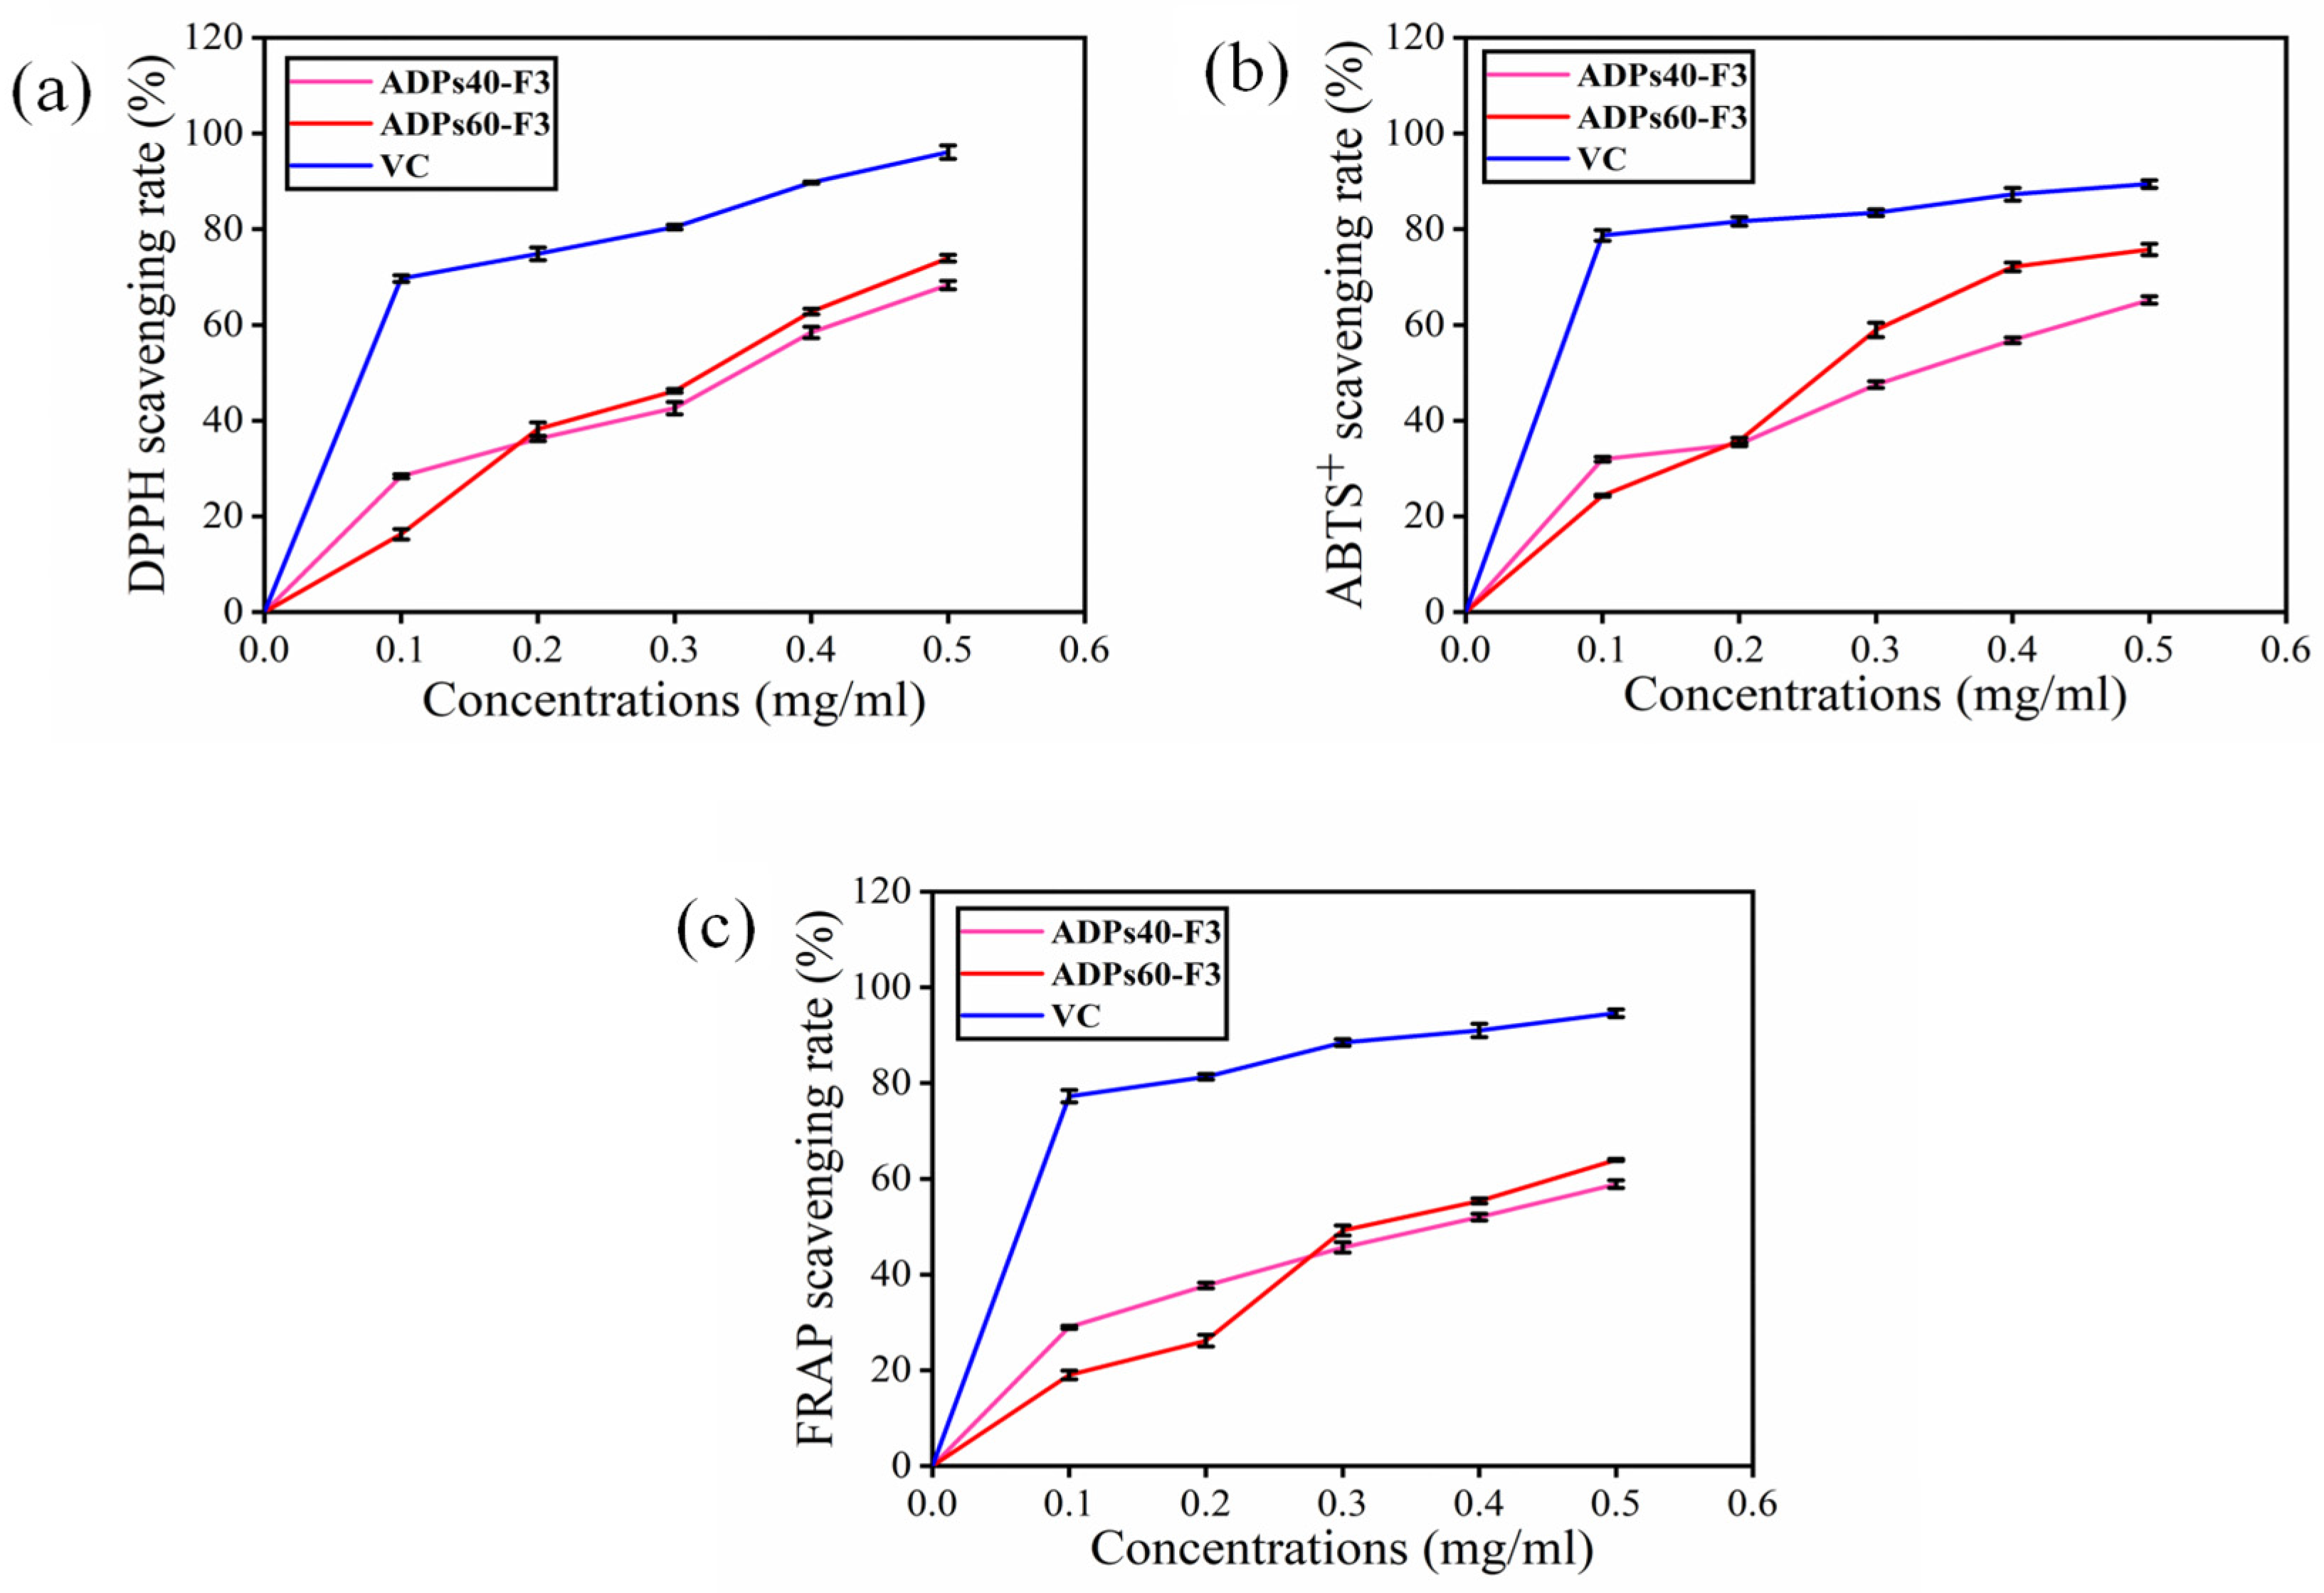
3.3. Antioxidant Analysis
3.4. Anti-Diabetic Analysis
3.4.1. α-Amylase and α-Glucosidase Inhibitory Activity Assays
3.4.2. In Vivo Analysis
4. Conclusions
Author Contributions
Funding
Institutional Review Board Statement
Informed Consent Statement
Data Availability Statement
Conflicts of Interest
References
- Abubakera, M.A.; Hamoudac, H.A.; Chena, L.; Dinga, L.; Zhua, S.Y.; Fua, L.W.; Zhanga, J. Characterization of chemical structure of water-soluble polysaccharides from Sudanese Ziziphus spina christi fruits. Eurasian Chem. Commun. 2021, 3, 200–209. [Google Scholar] [CrossRef]
- Yang, X.; Li, A.; Li, X.; Sun, L.; Guo, Y. An overview of classifications, properties of food polysaccharides and their links to applications in improving food textures. Trends Food Sci. Technol. 2020, 102, 1–15. [Google Scholar] [CrossRef]
- Seyfi, R.; Kasaai, M.R.; Chaichi, M.J. Isolation and structural characterization of a polysaccharide derived from a local gum: Zedo (Amygdalus scoparia Spach). Food Hydrocoll. 2019, 87, 915–924. [Google Scholar] [CrossRef]
- Su, L.; Feng, Y.; Wei, K.; Xu, X.; Liu, R.; Chen, G. Carbohydrate-based macromolecular biomaterials. Chem. Rev. 2021, 121, 10950–11029. [Google Scholar] [CrossRef] [PubMed]
- Wang, Z.-M.; Peng, X.; Lee, K.-L.D.; Tang, J.C.-O.; Cheung, P.C.-K.; Wu, J.-Y. Structural characterisation and immunomodulatory property of an acidic polysaccharide from mycelial culture of Cordyceps sinensis fungus Cs-HK1. Food Chem. 2011, 125, 637–643. [Google Scholar] [CrossRef]
- Chen, G.; Bu, F.; Chen, X.; Li, C.; Wang, S.; Kan, J. Ultrasonic extraction, structural characterization, physicochemical properties and antioxidant activities of polysaccharides from bamboo shoots (Chimonobambusa quadrangularis) processing by-products. Int. J. Biol. Macromol. 2018, 112, 656–666. [Google Scholar] [CrossRef] [PubMed]
- Zhang, Z.-S.; Wang, X.-M.; Han, Z.-P.; Zhao, M.-X.; Yin, L. Purification, antioxidant and moisture-preserving activities of polysaccharides from papaya. Carbohydr. Polym. 2012, 87, 2332–2337. [Google Scholar] [CrossRef]
- Wang, Y.; Liu, X.; Zhang, J.; Liu, G.; Liu, Y.; Wang, K.; Yang, M.; Cheng, H.; Zhao, Z. Structural characterization and in vitro antitumor activity of polysaccharides from Zizyphus jujuba cv. Muzao. RSC Adv. 2015, 5, 7860–7867. [Google Scholar] [CrossRef]
- Xiong, F.; Li, X.; Zheng, L.; Hu, N.; Cui, M.; Li, H. Characterization and antioxidant activities of polysaccharides from Passiflora edulis Sims peel under different degradation methods. Carbohydr. Polym. 2019, 218, 46–52. [Google Scholar] [CrossRef]
- Wang, Q.-C.; Zhao, X.; Pu, J.-H.; Luan, X.-H. Influences of acidic reaction and hydrolytic conditions on monosaccharide composition analysis of acidic, neutral and basic polysaccharides. Carbohydr. Polym. 2016, 143, 296–300. [Google Scholar] [CrossRef]
- Zhang, Y.; Zhou, T.; Wang, H.; Cui, Z.; Cheng, F.; Wang, K.-P. Structural characterization and in vitro antitumor activity of an acidic polysaccharide from Angelica sinensis (Oliv.) Diels. Carbohydr. Polym. 2016, 147, 401–408. [Google Scholar] [CrossRef]
- Jahanbin, K.; Abbasian, A.; Ahang, M. Isolation, purification and structural characterization of a new water-soluble polysaccharide from Eremurus stenophyllus (boiss. & buhse) baker roots. Carbohydr. Polym. 2017, 178, 386–393. [Google Scholar] [CrossRef]
- Braca, A.; Sinisgalli, C.; De Leo, M.; Muscatello, B.; Cioni, P.L.; Milella, L.; Ostuni, A.; Giani, S.; Sanogo, R. Phytochemical Profile, Antioxidant and Antidiabetic Activities of Adansonia digitata L. (Baobab) from Mali, as a Source of Health-Promoting Compounds. Molecules 2018, 23, 1–18. [Google Scholar] [CrossRef]
- Zhao, T.; Mao, G.; Feng, W.; Mao, R.; Gu, X.; Li, T.; Li, Q.; Bao, Y.; Yang, L.; Wu, X. Isolation, characterization and antioxidant activity of polysaccharide from Schisandra sphenanthera. Carbohydr. Polym. 2014, 105, 26–33. [Google Scholar] [CrossRef]
- Zhu, Z.-Y.; Liu, F.; Gao, H.; Sun, H.; Meng, M.; Zhang, Y.-M. Synthesis, characterization and antioxidant activity of selenium polysaccharide from Cordyceps militaris. Int. J. Biol. Macromol. 2016, 93, 1090–1099. [Google Scholar] [CrossRef]
- Yan, J.-K.; Li, L.; Wang, Z.-M.; Wu, J.-Y. Structural elucidation of an exopolysaccharide from mycelial fermentation of a Tolypocladium sp. fungus isolated from wild Cordyceps sinensis. Carbohydr. Polym. 2010, 79, 125–130. [Google Scholar] [CrossRef]
- Al-Sheraji, S.H.; Ismail, A.; Manap, M.Y.; Mustafa, S.; Yusof, R.M.; Hassan, F.A. Purification, characterization and antioxidant activity of polysaccharides extracted from the fibrous pulp of Mangifera pajang fruits. LWT 2012, 48, 291–296. [Google Scholar] [CrossRef]
- Huo, J.; Wu, J.; Zhao, M.; Sun, W.; Sun, J.; Li, H.; Huang, M. Immunomodulatory activity of a novel polysaccharide extracted from Huangshui on THP-1 cells through NO production and increased IL-6 and TNF-α expression. Food Chem. 2020, 330, 127257. [Google Scholar] [CrossRef] [PubMed]
- Liu, X.-Y.; Yu, H.-Y.; Liu, Y.-Z.; Qin, Z.; Liu, H.-M.; Ma, Y.-X.; Wang, X.-D. Isolation and structural characterization of cell wall polysaccharides from sesame kernel. LWT 2022, 163, 113574. [Google Scholar] [CrossRef]
- Ahmad, M.M. Characterization and antioxidant activities of polysaccharides extracted from flageolet bean pods waste. Curr. Res. Green Sustain. Chem. 2021, 4, 100154. [Google Scholar] [CrossRef]
- Fernandes, P.A.; Coimbra, M.A. The antioxidant activity of polysaccharides: A structure-function relationship overview. Carbohydr. Polym. 2023, 314, 120965. [Google Scholar] [CrossRef]
- de la Torre, A.A.S.B.; Henderson, T.; Nigam, P.S.; Owusu-Apenten, R.K. A universally calibrated microplate ferric reducing antioxidant power (FRAP) assay for foods and applications to Manuka honey. Food Chem. 2015, 174, 119–123. [Google Scholar] [CrossRef]
- Khadayat, K.; Marasini, B.P.; Gautam, H.; Ghaju, S.; Parajuli, N. Evaluation of the alpha-amylase inhibitory activity of Nepalese medicinal plants used in the treatment of diabetes mellitus. Clin. Phytosci. 2020, 6, 34. [Google Scholar] [CrossRef]
- Guo, X.; Kang, J.; Xu, Z.; Guo, Q.; Zhang, L.; Ning, H.; Cui, S.W. Triple-helix polysaccharides: Formation mechanisms and analytical methods. Carbohydr. Polym. 2021, 262, 117962. [Google Scholar] [CrossRef]
- Jiao, L.; Li, J.; Liu, F.; Wang, J.; Jiang, P.; Li, B.; Li, H.; Chen, C.; Wu, W. Characterisation, chain conformation and antifatigue effect of steamed ginseng polysaccharides with different molecular weight. Front. Pharmacol. 2021, 12, 712836. [Google Scholar] [CrossRef]
- Deng, Y.; Huang, L.; Zhang, C.; Xie, P.; Cheng, J.; Wang, X.; Liu, L. Novel polysaccharide from Chaenomeles speciosa seeds: Structural characterization, α-amylase and α-glucosidase inhibitory activity evaluation. Int. J. Biol. Macromol. 2020, 153, 755–766. [Google Scholar] [CrossRef]
- Yu, Y.; Cui, L.; Liu, X.; Wang, Y.; Song, C.; Pak, U.; Mayo, K.H.; Sun, L.; Zhou, Y. Determining Methyl-Esterification Patterns in Plant-Derived Homogalacturonan Pectins. Front. Nutr. 2022, 9, 925050. [Google Scholar] [CrossRef] [PubMed]
- Gieroba, B.; Kalisz, G.; Krysa, M.; Khalavka, M.; Przekora, A. Application of vibrational spectroscopic techniques in the study of the natural polysaccharides and their cross-linking process. Int. J. Mol. Sci. 2023, 24, 2630. [Google Scholar] [CrossRef] [PubMed]
- Farhadi, N. Structural elucidation of a water-soluble polysaccharide isolated from Balangu shirazi (Lallemantia royleana) seeds. Food Hydrocoll. 2017, 72, 263–270. [Google Scholar] [CrossRef]
- Liu, W.; Wang, H.; Yu, J.; Liu, Y.; Lu, W.; Chai, Y.; Liu, C.; Pan, C.; Yao, W.; Gao, X. Structure, chain conformation, and immunomodulatory activity of the polysaccharide purified from Bacillus Calmette Guerin formulation. Carbohydr. Polym. 2016, 150, 149–158. [Google Scholar] [CrossRef]
- Hong, T.; Yin, J.-Y.; Nie, S.-P.; Xie, M.-Y. Applications of infrared spectroscopy in polysaccharide structural analysis: Progress, challenge and perspective. Food Chem. X 2021, 12, 100168. [Google Scholar] [CrossRef]
- Abubaker, M.A.; Mohammed, A.A.A.; Farah, A.A.M.; Zhang, J. Phytochemical Screening by Using GC-MS and FTIR Spectrum Analysis of Fixed Oil from Sudanese Ziziphus Spina Christi Seeds. Eurasian Chem. Commun. 2021, 3, 244–256. [Google Scholar] [CrossRef]
- Yang, Y.; Yin, X.; Zhang, D.; Lu, J.; Wang, X. Isolation, structural characterization and macrophage activation activity of an acidic polysaccharide from raspberry pulp. Molecules 2022, 27, 1674. [Google Scholar] [CrossRef]
- Hu, H.-B.; Liang, H.-P.; Li, H.-M.; Yuan, R.-N.; Sun, J.; Zhang, L.-L.; Han, M.-H.; Wu, Y. Isolation, purification, characterization and antioxidant activity of polysaccharides from the stem barks of Acanthopanax leucorrhizus. Carbohydr. Polym. 2018, 196, 359–367. [Google Scholar] [CrossRef]
- Chang, X.; Chen, B.; Feng, Y. Water-soluble polysaccharides isolated from skin juice, gel juice and flower of Aloe vera Miller. J. Taiwan Inst. Chem. Eng. 2011, 42, 197–203. [Google Scholar] [CrossRef]
- Sun, H.; Lou, J.; Chen, B.; Huang, J.; Wang, Q.; Song, S.; Jia, Z.; Miao, R.; Wang, S.; Li, X.; et al. Fitoterapia Multi-level chemical characterization and anti-inflammatory activity evaluation of the polysaccharides from Prunella vulgaris. Fitoterapia 2024, 174, 105841. [Google Scholar] [CrossRef]
- Rozi, P.; Abuduwaili, A.; Mutailifu, P.; Gao, Y.; Rakhmanberdieva, R.; Aisa, H.A.; Yili, A. Sequential extraction, characterization and antioxidant activity of polysaccharides from Fritillaria pallidiflora Schrenk. Int. J. Biol. Macromol. 2019, 131, 97–106. [Google Scholar] [CrossRef] [PubMed]
- Yang, Y.; Lei, Z.; Zhao, M.; Wu, C.; Wang, L.; Xu, Y. Microwave-assisted extraction of an acidic polysaccharide from Ribes nigrum L.: Structural characteristics and biological activities. Ind. Crop. Prod. 2020, 147, 112249. [Google Scholar] [CrossRef]
- Yang, X.; Huang, M.; Qin, C.; Lv, B.; Mao, Q.; Liu, Z. Structural characterization and evaluation of the antioxidant activities of polysaccharides extracted from Qingzhuan brick tea. Int. J. Biol. Macromol. 2017, 101, 768–775. [Google Scholar] [CrossRef] [PubMed]
- Tan, M.; Zhao, Q.; Zhao, B. Physicochemical properties, structural characterization and biological activities of polysaccharides from quinoa (Chenopodium quinoa Willd.) seeds. Int. J. Biol. Macromol. 2021, 193, 1635–1644. [Google Scholar] [CrossRef] [PubMed]
- Hu, H.; Liang, H.; Wu, Y. Isolation, purification and structural characterization of polysaccharide from Acanthopanax brachypus. Carbohydr. Polym. 2015, 127, 94–100. [Google Scholar] [CrossRef] [PubMed]
- Hu, C.; Li, H.-X.; Zhang, M.-T.; Liu, L.-F. Structure characterization and anticoagulant activity of a novel polysaccharide from Leonurus artemisia (Laur.) SY Hu F. RSC Adv. 2020, 10, 2254–2266. [Google Scholar] [CrossRef] [PubMed]
- Shi, Z.-J.; Xiao, L.-P.; Deng, J.; Xu, F.; Sun, R.-C. Isolation and characterization of soluble polysaccharides of Dendrocalamus brandisii: A high-yielding bamboo species. BioResources 2011, 6, 5151–5166. [Google Scholar] [CrossRef]
- Ma, F.; Liu, H.; Xu, S.; Cheng, Y.; Fei, Q.; Chen, H. Isolation of an acidic polysaccharide from the flowers of Leucosceptrum canum Smith and its immunomodulatory activity evaluation. Int. J. Biol. Macromol. 2021, 171, 177–184. [Google Scholar] [CrossRef] [PubMed]
- Yin, J.-Y.; Chan, B.C.-L.; Yu, H.; Lau, I.Y.-K.; Han, X.-Q.; Cheng, S.-W.; Wong, C.-K.; Lau, C.B.-S.; Xie, M.-Y.; Fung, K.-P.; et al. Separation, structure characterization, conformation and immunomodulating effect of a hyperbranched heteroglycan from Radix Astragali. Carbohydr. Polym. 2012, 87, 667–675. [Google Scholar] [CrossRef] [PubMed]
- Luo, A.; Xiao, H.; Cai, X.; Fan, Y. Antioxidant activity of water-soluble polysaccharides from Brasenia schreberi. Pharmacogn. Mag. 2016, 12, 193–197. [Google Scholar] [CrossRef]
- Tundis, R.; Loizzo, M.; Menichini, F. Natural products as α-amylase and α-glucosidase inhibitors and their hypoglycaemic potential in the treatment of diabetes: An update. Mini-Rev. Med. Chem. 2010, 10, 315–331. [Google Scholar] [CrossRef]
- Wang, Y.Y.; Zhu, J.; Ma, H.; Ding, Z.C.; Li, L.; Yan, J.K. Antidiabetic activity of a polysaccharide-protein complex from asian clam (Corbicula Fluminea) in streptozotoxin-induced diabetic rats and its underlying mechanism. Food Funct. 2019, 10, 5574–5586 ISBN 0861595281966. [Google Scholar] [CrossRef]
- Chen, C.; Wang, P.-P.; Huang, Q.; You, L.-J.; Liu, R.H.; Zhao, M.-M.; Fu, X.; Luo, Z.-G. A comparison study on polysaccharides extracted from Fructus Mori using different methods: Structural characterization and glucose entrapment. Food Funct. 2019, 10, 3684–3695. [Google Scholar] [CrossRef]


| Features | ADPs40-F3 | ADPs60-F3 |
|---|---|---|
| Yield amounts (w/w,%) | 22.30 ± 0.70 | 23.50 ± 0.60 |
| Total sugar contents (w/w,%) | 82.10 ± 1.23 | 85.30 ± 1.21 |
| Uronic acid (w/w,%) | 15.00 ± 2.30 | 19.10 ± 1.60 |
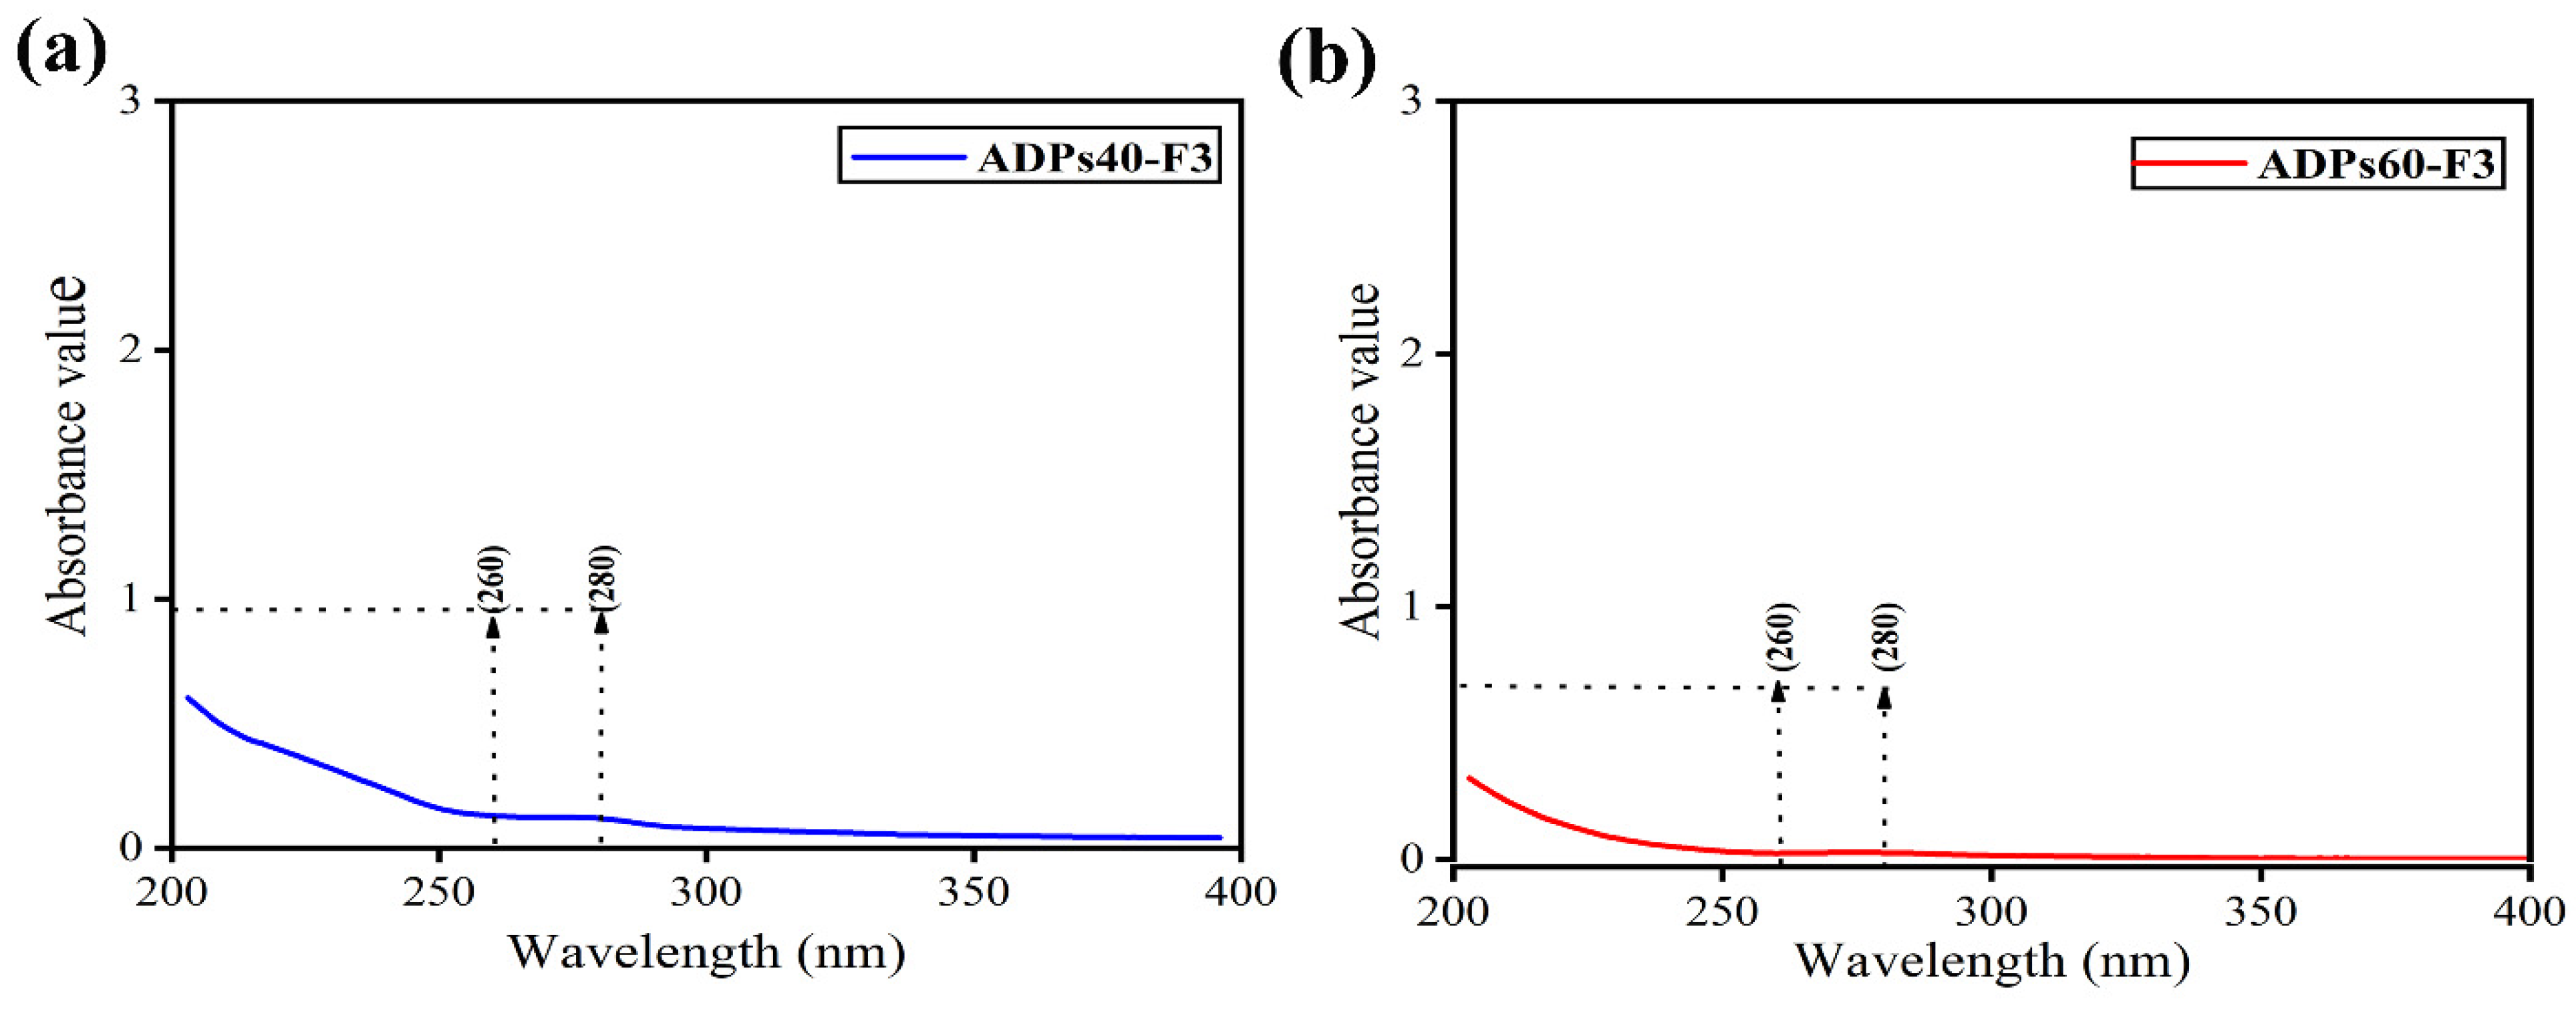
| Protein content (w/w,%) | 0.38 ± 0.10 | 0.28 ± 0.05 |
| Molecular weight (Da) | 1.66 × 10⁵ | 9.59 × 10⁴ |
| Water solubility | soluble | soluble |
| Primary Type of Vibrations | Frequency (cm−1) Primary | ||
|---|---|---|---|
| ADPs40-F3 | ADPs60-F3 | Relative Intensities | |
| v (–OH) | 3404.92 | 3423.05 | (br) |
| v (C–H) | 2940.82 | 2939.40 | (w) |
| v (COOH) | 1745.43 | 1745.60 | (s) |
| v (C–O) | 1613.02 | 1606.80 | (s) |
| v (C=O) | 1425.72 | 1415.20 | (m) |
| v (C–O) | 1332.09 | 1333.90 | (m) |
| v (C–O–C) | 1146.81 | 1242.90 | (m) |
| 1094.33 | 1142.30 | (m) | |
| 1015.25 | 1104.08 | (w) | |
| β-configuration | 895.65 | 1017.09 | (w) |
| 820.79 | 883.03 | (w) | |
| 738.54 | 835.10 | (w) | |
| α-configuration | 634.06 | 739.30 | (w) |
| 533.51 | 624.40 | (m) | |
| Sample | MW (Da) | Mn (Da) | Mw/Mn (Da) |
|---|---|---|---|
| ADPs40-F3 | 1.66 × 10⁵ | 8.96 × 10⁴ | 1.85 |
| ADPs60-F3 | 9.59 × 10⁴ | 5.63 × 10⁴ | 1.63 |
| Polysaccharides | Residues | R.T. (min) | Molar Ratio (%) |
|---|---|---|---|
| ADPs40-F3 | Arabinose | 12.00 | 2.80 |
| Galactose | 14.91 | 0.91 | |
| Glucose | 17.00 | 3.60 | |
| Xylose | 19.62 | 34.70 | |
| Galacturonic acid | 45.21 | 58.10 | |
| ADPs60-F3 | Rhamnose | 11.50 | 1.50 |
| Arabinose | 12.00 | 5.50 | |
| Galactose | 15.00 | 2.50 | |
| Glucose | 17.00 | 3.10 | |
| Xylose | 19.70 | 26.00 | |
| Galacturonic acid | 45.20 | 61.40 |
| Fractions | Temperature (°C) | Weight Loss (%) | (Ti) | (T50) |
|---|---|---|---|---|
| ADPs40-F3 | 244.50 | 15.29 | (Ti) | |
| 423.04 | 36.81 | (T50) | ||
| 596.60 | 9.30 | |||
| 799.50 | 6.20 | |||
| ADPs60-F3 | 242.50 | 20.50 | (Ti) | |
| 441.99 | 39.01 | (T50) | ||
| 602.90 | 7.81 | |||
| 799.90 | 5.71 |
| Fractions | Residues | Chemical Shifts, δC-δH ppm | |||||
|---|---|---|---|---|---|---|---|
| C1 H1 | C2 H2 | C3 H3 | C4 H4 | C5 H5 | C6 H6 | ||
| ADPs40-F3 | 4,6)-α-d-GalpA-(1→ | 98.9 4.91 | 68.1 3.67 | 68.6 3.96 | 77.7 4.43 | 70.4 5.09/5.02 | 170.7 Nd |
| 4)-β-d-Xylf-(1→ | 100.2 4.45 | 74.1 3.60 | 72.6 3.71 | 75.8 3.52 | 68.1 4.13 | Nd Nd | |
| 6)-β-d-Glcp-(1→ | 104.9 4.52 | 73.2 3.33 | 76.9 3.43 | 71.3 3.40 | 75.5 3.65 | 68.9 3.85/4.32 | |
| 5)-α-l-Araf-(1→ | 109.2 4.54 | 81.3 4.03 | 76.9 3.91 | 77.8 3.58 | 52.8 4.04 | Nd Nd | |
| 4,6)-α-d-Galp-(1→ | 97.8 5.02 | 69.2 3.85 | 71.4 3.89 | 70.6 4.18 | 68.3 4.19 | 65.0 3.91a/3.67b | |
| ADPs60-F3 | 4,6)-α-d-GalpA-(1→ | 98.9 5.26 | 68.1 3.67 | 68.6 3.96 | 77.6 4.43 | 70.7 5.07/- | 170.7 Nd |
| 4)-α-d-Xylf-(1→ | 97.9 4.58 | 71.4 3.29 | 75.8 3.91 | 70.7 3.77 | 65.0 3.41 | Nd Nd | |
| 6)-β-d-Glcp-(1→ | 104.9 4.52 | 73.2 3.33 | 77.0 3.43 | 71.4 3.41 | 75.8 3.65 | 69.0 3.85a/4.32 b | |
| 5)-α-d-Araf-(1→ | 96.1 4.54 | 80.9 4.03 | 75.8 3.91 | 77.6 3.58 | 68.6 4.04 | Nd Nd | |
| 4,6)-α-d-Galp-(1→ | 98.9 5.00 | 69.3 3.85 | 71.4 3.91 | 70.7 4.18 | 72.6 4.19 | 65.0 3.93 a/3.67 b | |
| →2)-α-d-Rhap-( | 92.1 5.07 | 77.7 3.86 | 69.3 3.68 | 72.6 3.35 | 69.0 3.93 | 16.5 1.17 | |
| Glucose Concentration (mg/dL) | |||
|---|---|---|---|
| Groups | 0 min | 60 min | 120 min |
| Control | 85.35 ± 2.31 | 83.25 ± 1.83 | 84.06 ± 2.62 |
| Model | 85.24 ± 1.64 ## | 246.36 ± 1.35 ## | 252.18 ± 3.65 ## |
| Metformin | 84.35 ± 2.51 ## | 249.18 ± 3.62 ## | 147.68 ± 2.53 ## |
| ADPs60-F3-L | 83.62 ± 4.28 ## | 261.32 ± 2.88 ##,** | 208.47 ± 1.26 ##,** |
| ADPs60-F3-M | 87.08 ± 2.39 ## | 253.71 ± 2.58 ##,** | 187.25 ± 2.38 ##,** |
| ADPs60-F3-H | 84.75 ± 4.76 ## | 243.86 ± 3.81 ##,** | 186.39 ± 4.45 ##,** |
Disclaimer/Publisher’s Note: The statements, opinions and data contained in all publications are solely those of the individual author(s) and contributor(s) and not of MDPI and/or the editor(s). MDPI and/or the editor(s) disclaim responsibility for any injury to people or property resulting from any ideas, methods, instructions or products referred to in the content. |
© 2024 by the authors. Licensee MDPI, Basel, Switzerland. This article is an open access article distributed under the terms and conditions of the Creative Commons Attribution (CC BY) license (https://creativecommons.org/licenses/by/4.0/).
Share and Cite
Song, S.; Abubaker, M.A.; Akhtar, M.; Elimam, A.M.; Zhu, X.; Zhang, J. Chemical Characterization Analysis, Antioxidants, and Anti-Diabetic Activity of Two Novel Acidic Water-Soluble Polysaccharides Isolated from Baobab Fruits. Foods 2024, 13, 912. https://doi.org/10.3390/foods13060912
Song S, Abubaker MA, Akhtar M, Elimam AM, Zhu X, Zhang J. Chemical Characterization Analysis, Antioxidants, and Anti-Diabetic Activity of Two Novel Acidic Water-Soluble Polysaccharides Isolated from Baobab Fruits. Foods. 2024; 13(6):912. https://doi.org/10.3390/foods13060912
Chicago/Turabian StyleSong, Shen, Mohamed Aamer Abubaker, Maryam Akhtar, Abdalla Musa Elimam, Xinliang Zhu, and Ji Zhang. 2024. "Chemical Characterization Analysis, Antioxidants, and Anti-Diabetic Activity of Two Novel Acidic Water-Soluble Polysaccharides Isolated from Baobab Fruits" Foods 13, no. 6: 912. https://doi.org/10.3390/foods13060912
APA StyleSong, S., Abubaker, M. A., Akhtar, M., Elimam, A. M., Zhu, X., & Zhang, J. (2024). Chemical Characterization Analysis, Antioxidants, and Anti-Diabetic Activity of Two Novel Acidic Water-Soluble Polysaccharides Isolated from Baobab Fruits. Foods, 13(6), 912. https://doi.org/10.3390/foods13060912