
Ultrasound-Assisted Enzymatic Extraction of Polysaccharides from Tricholoma matsutake: Optimization, Structural Characterization, and Inhibition of α-Synuclein Aggregation


Abstract
:1. Introduction
2. Materials and Methods
2.1. Materials and Reagents
2.2. Pretreatment
2.3. Ultrasonic-Assisted Extraction Process
2.4. Optimization of Enzyme-Assisted Extraction
2.4.1. Single-Factor Design for Compound Enzyme-Assisted Extraction of TMP
2.4.2. Design of Response Experiment for Extraction of TMP by Compound Enzyme
2.5. Optimization of Ultrasound-Assisted Enzymatic Extraction
2.5.1. Design of Single-Factor Experiment for UAE Extraction of TMP
2.5.2. Design of Response Surface Test for UAE Extraction of TMP
2.6. Hot Water Extraction of TMP
2.7. Antioxidant Activity Assay
2.7.1. Hydroxyl Radical Scavenging Capacity
2.7.2. DPPH Scavenging Capacity
2.7.3. Reducing Power Assay
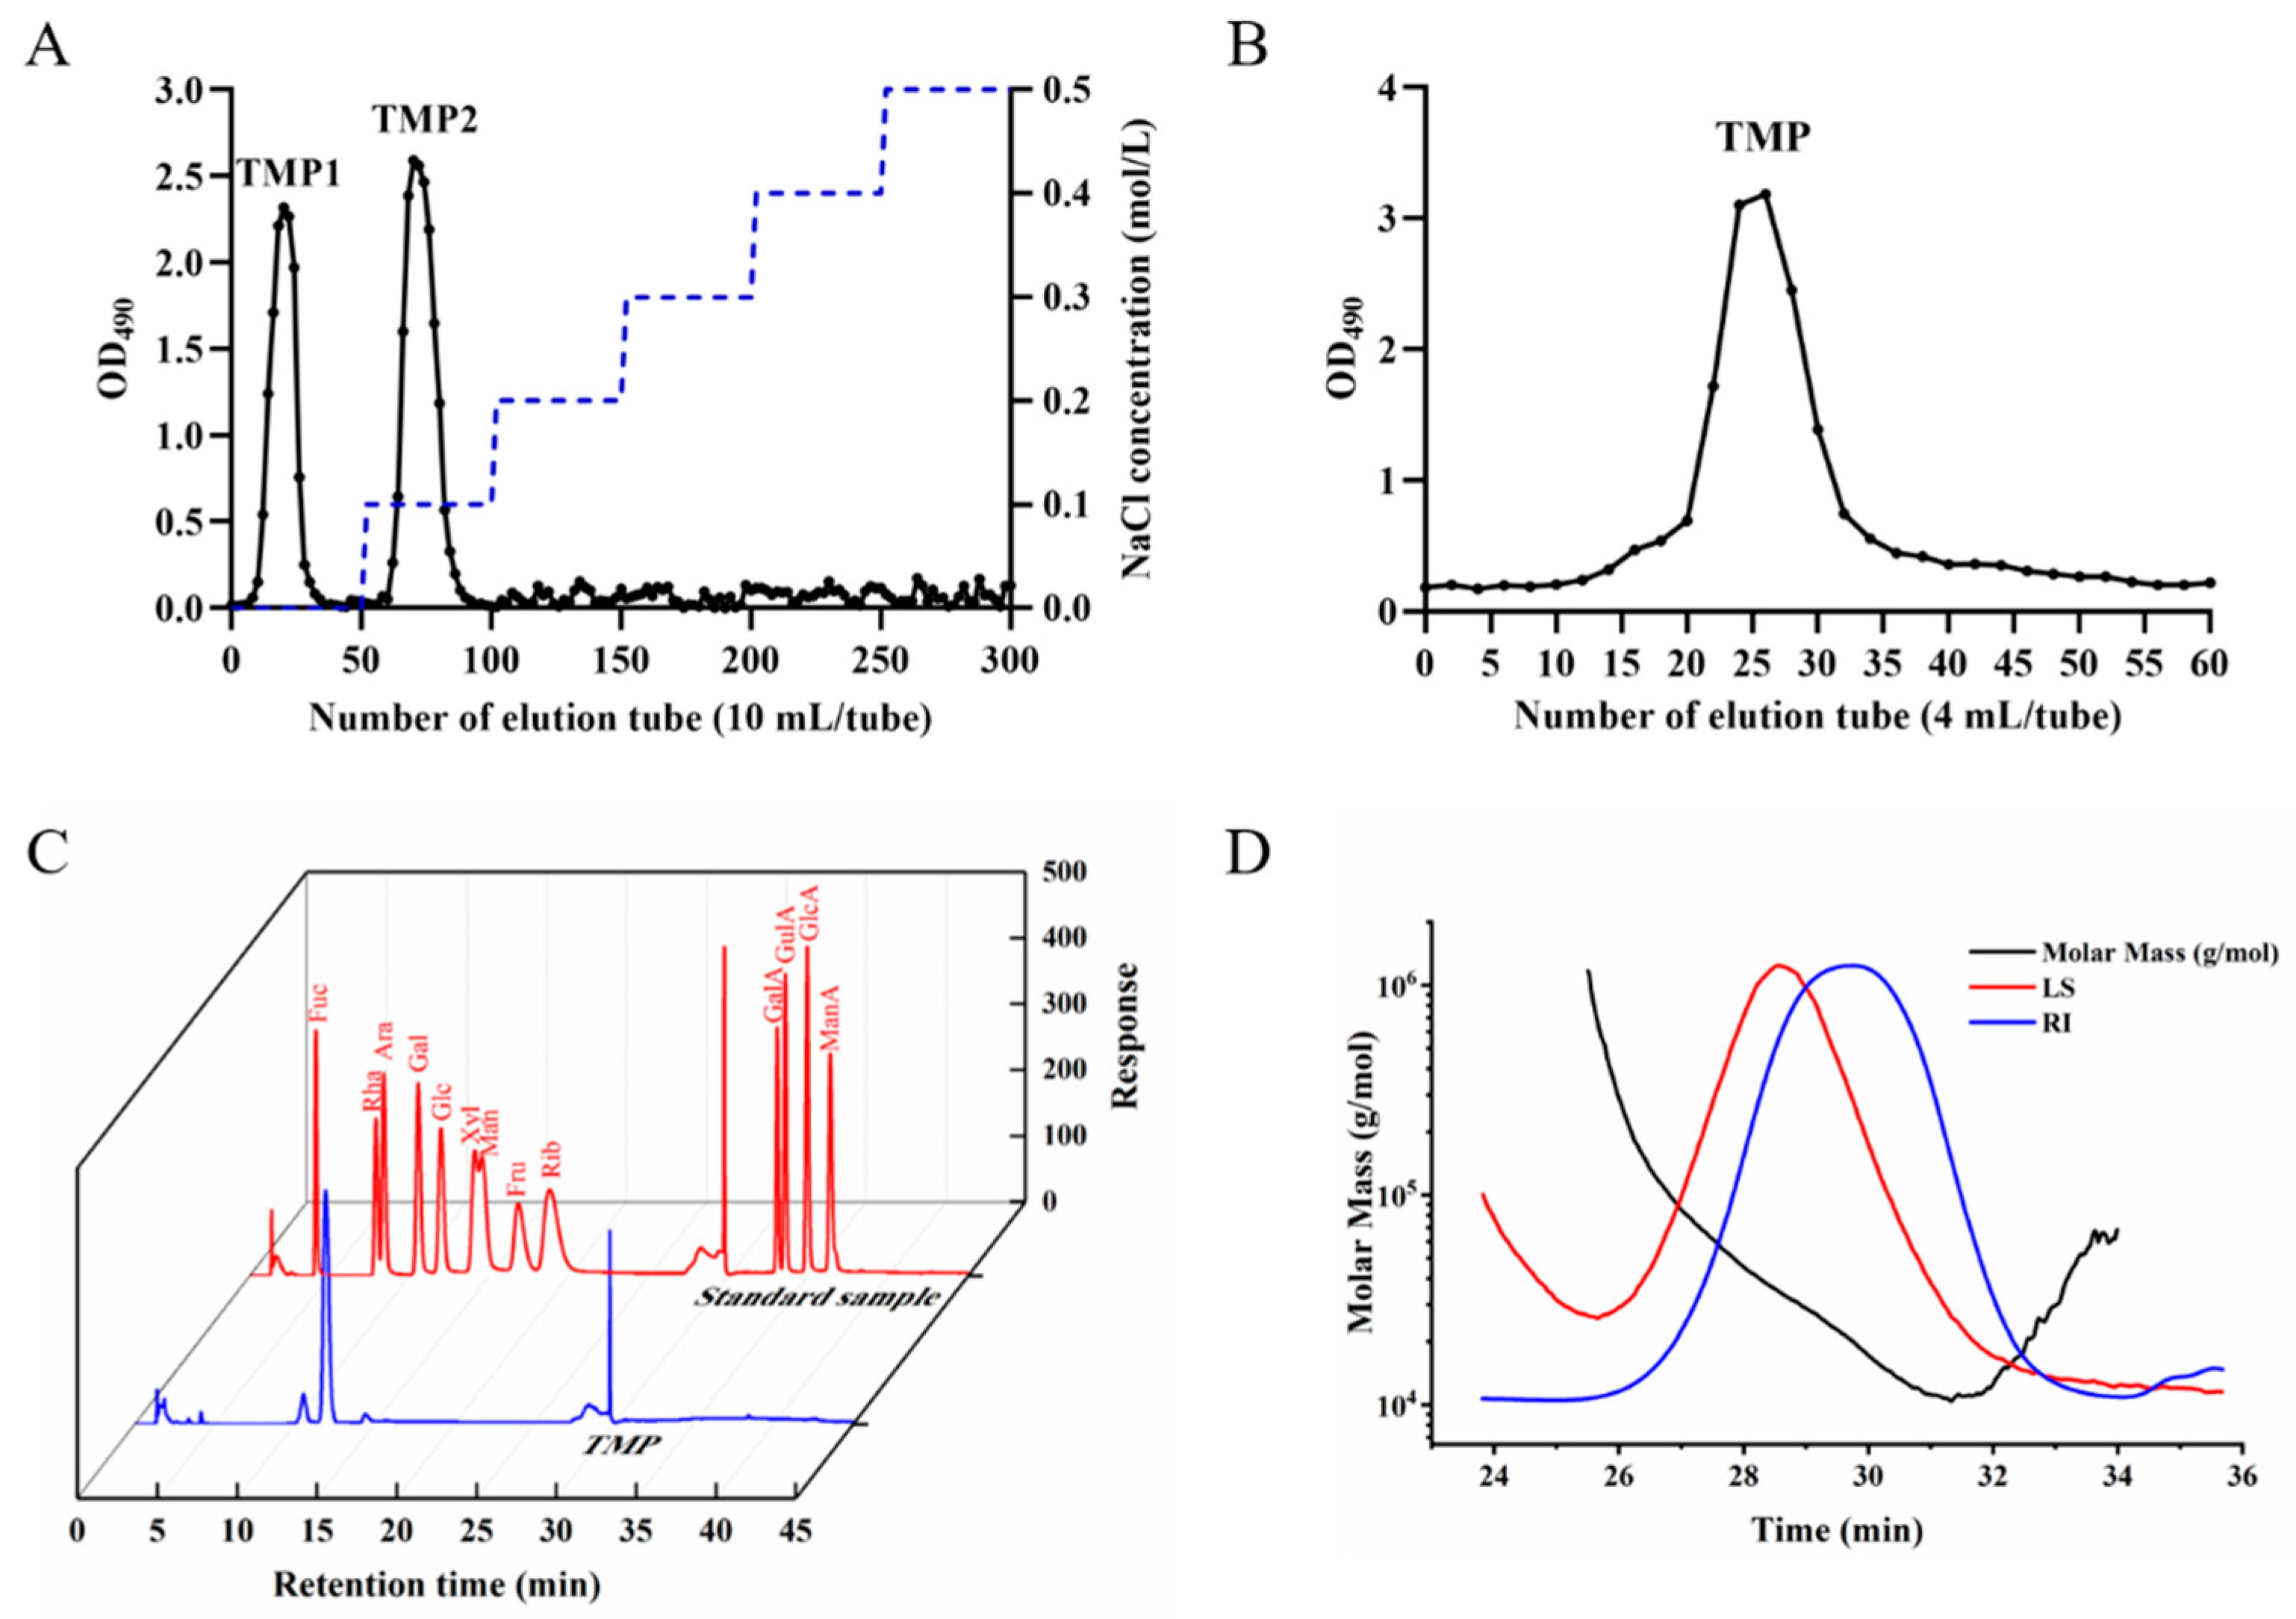
2.8. Purification of TMP
2.9. Monosaccharide Composition
2.10. Molecular Weight Distribution Analysis
2.11. UV–Vis of TMP
2.12. Fourier transform infrared spectrometer (FT–IR)
2.13. Scanning Electron Microscopy (SEM)
2.14. Caenorhabditis Elegans
2.14.1. Strains and Culture
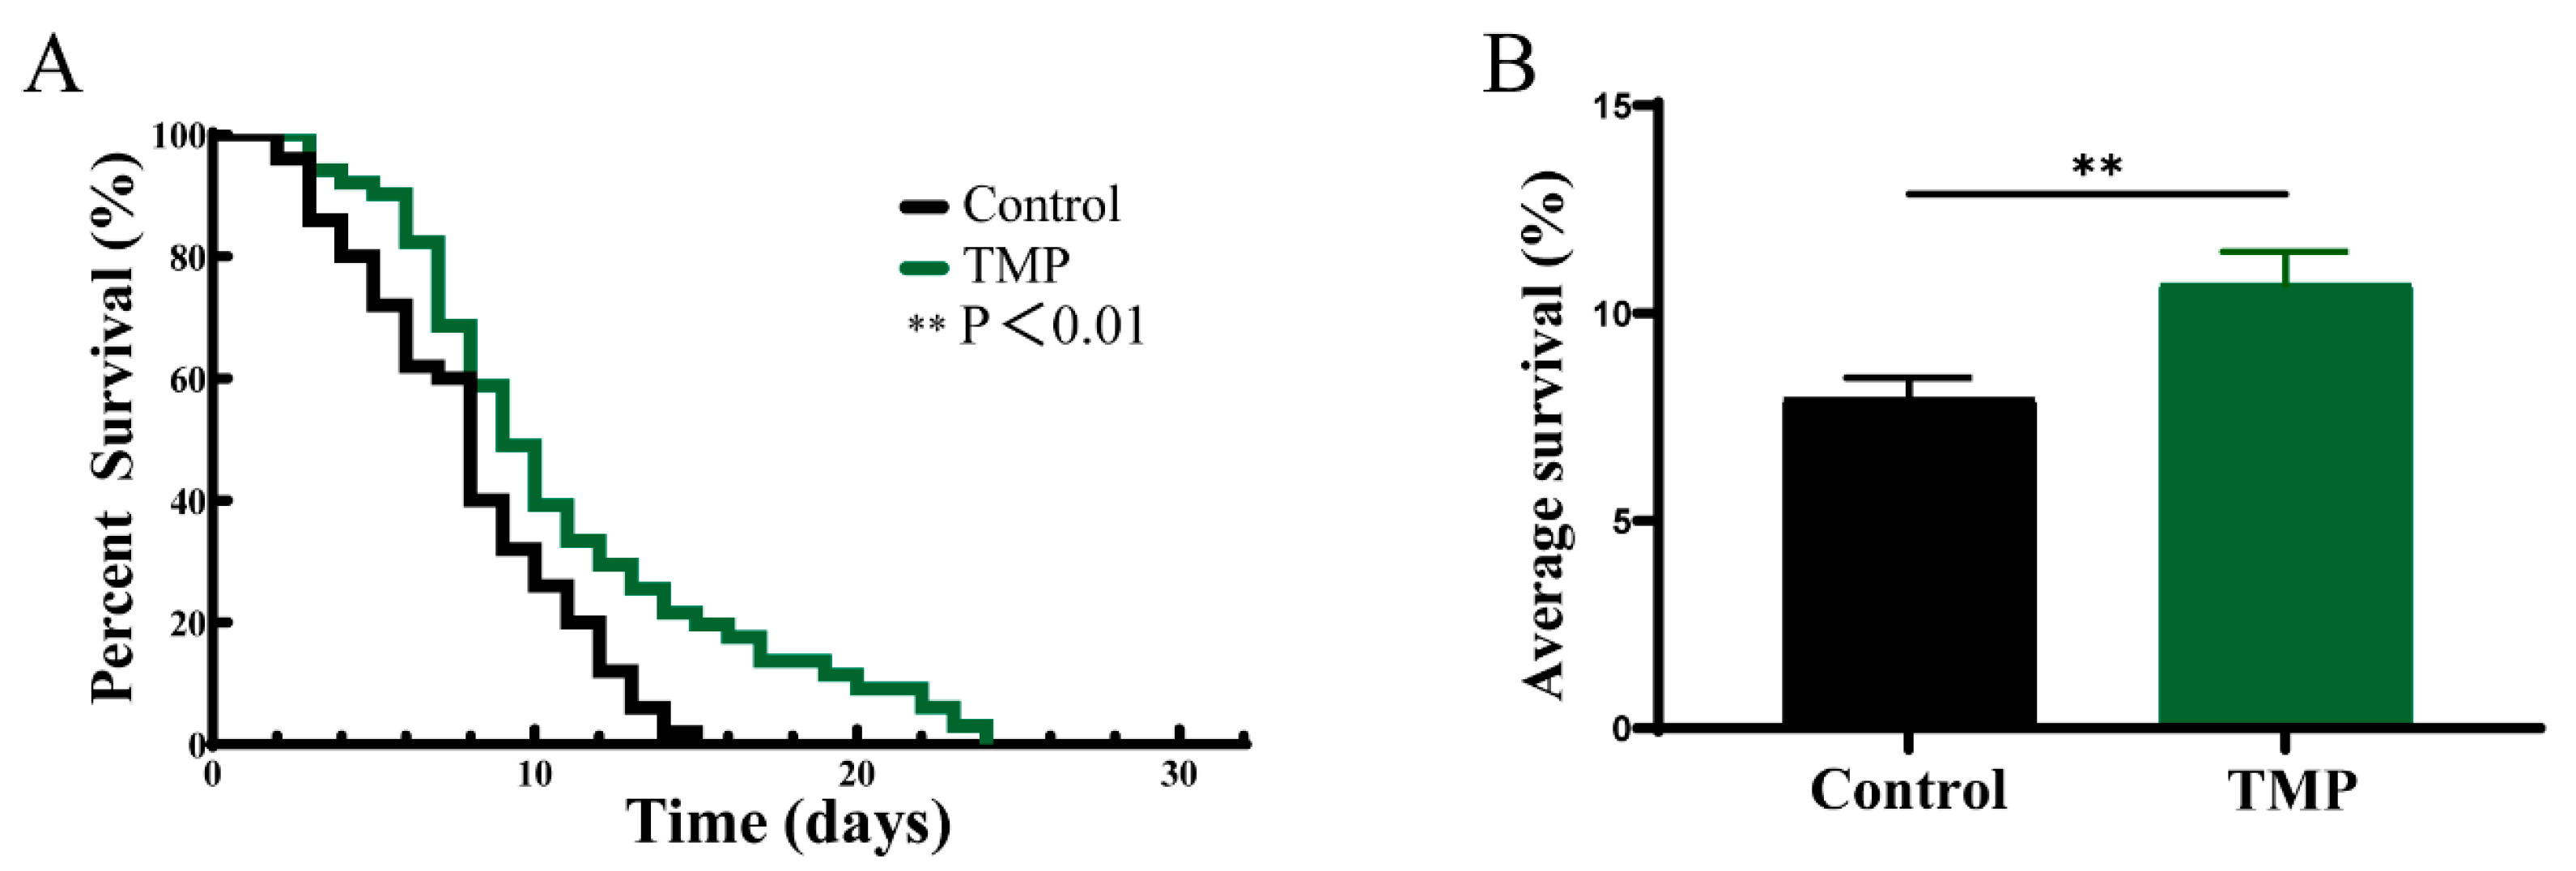
2.14.2. Lifespan Assay
2.15. Statistical Analysis
3. Results
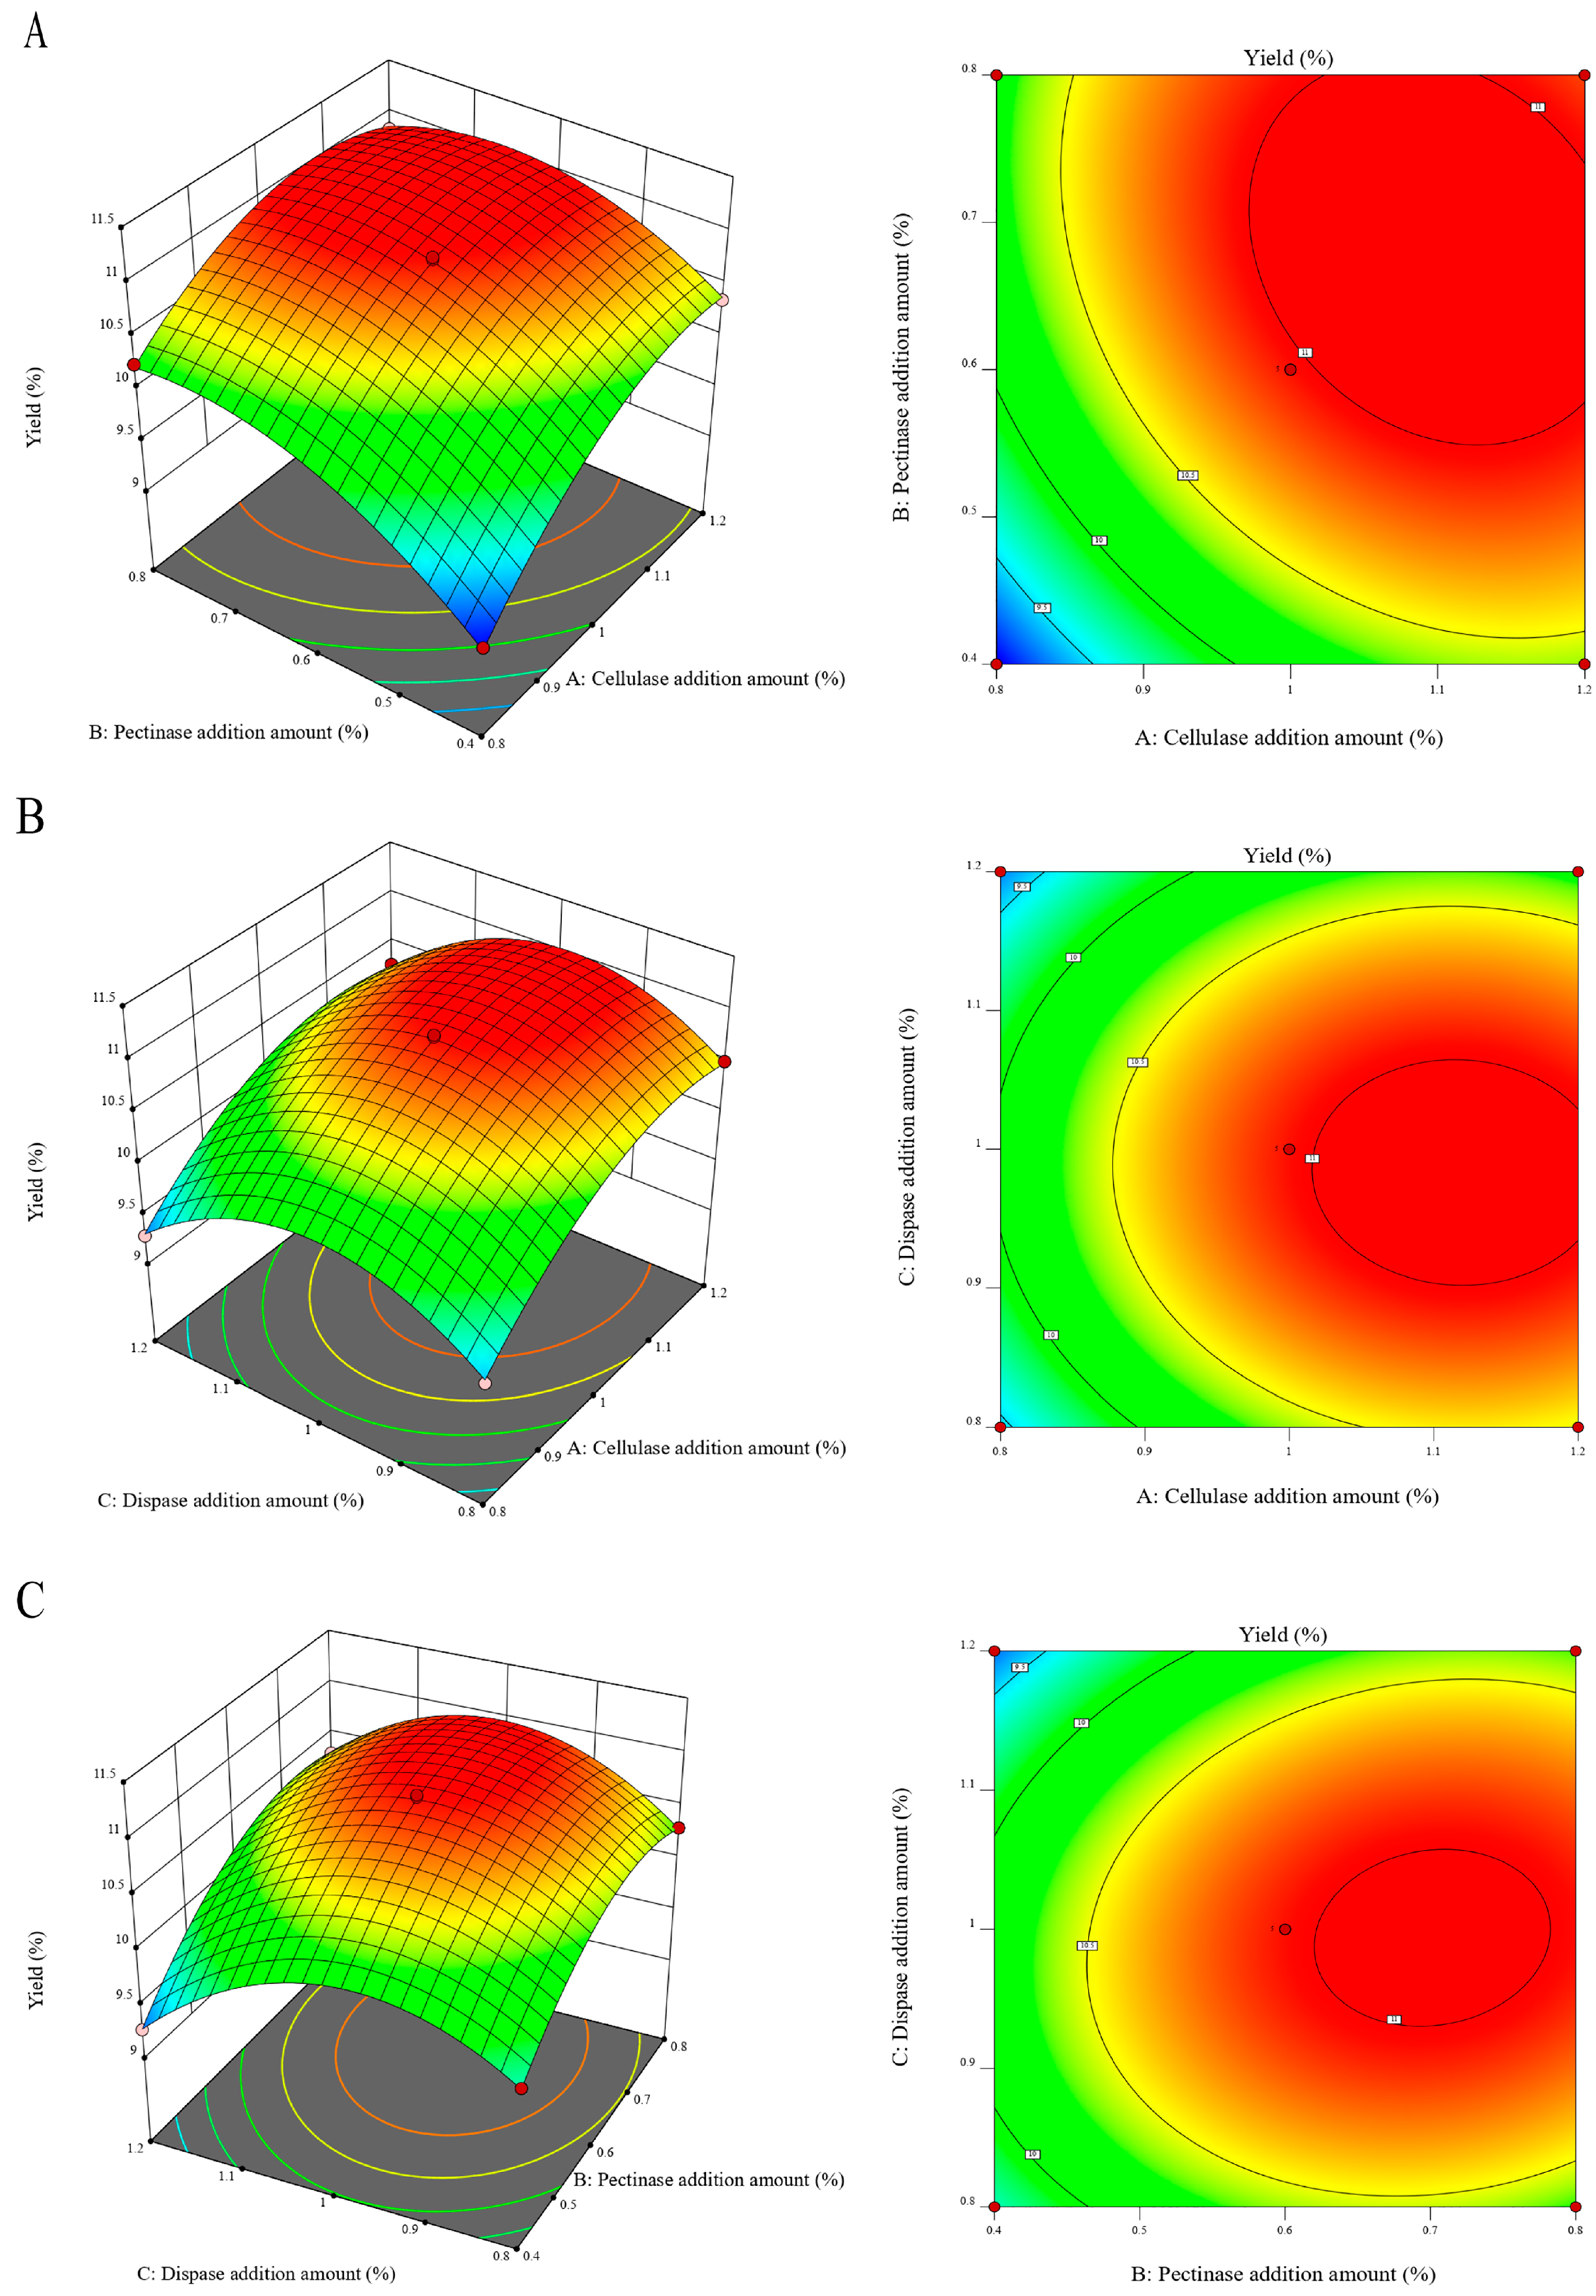
3.1. Optimization of the Optimal Complex Enzyme Addition
3.2. Optimization of Parameters for Extracting TMP Through UAE
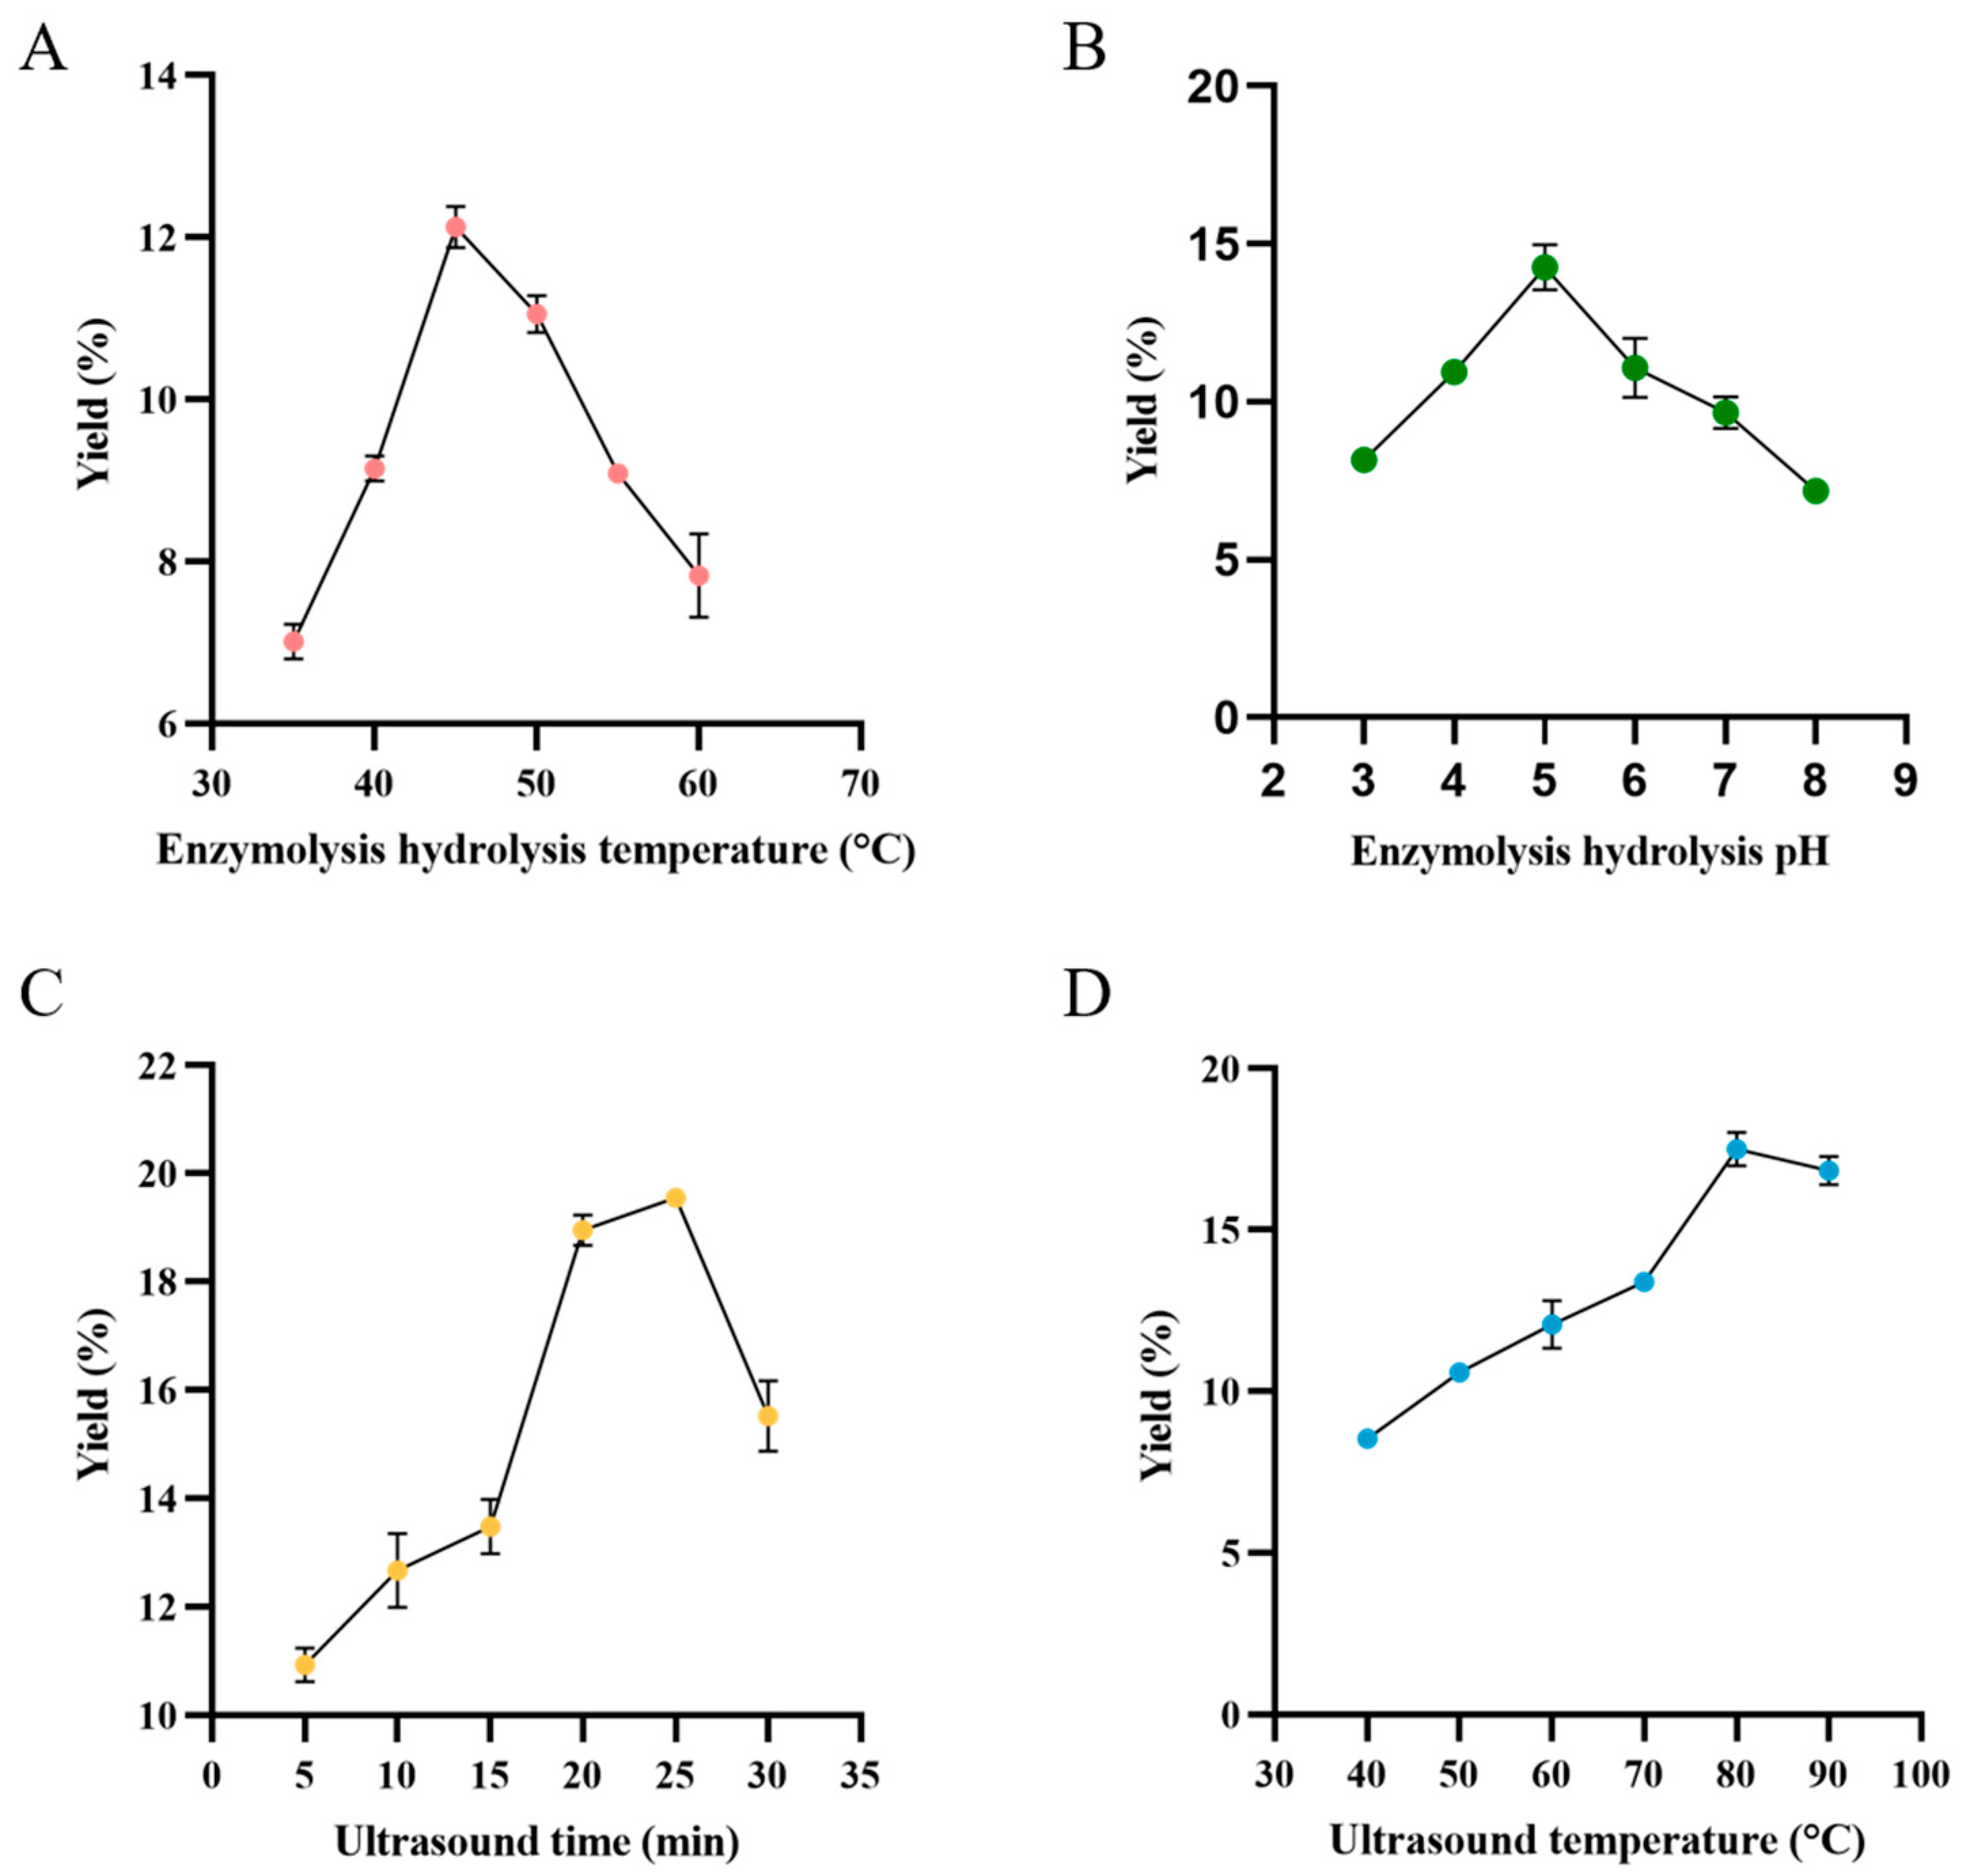
3.2.1. Effect of Enzymolysis Hydrolysis Temperature on the Yield of TMP
3.2.2. Effect of Enzymolysis Hydrolysis pH on the Yield of TMP
3.2.3. Effect of Ultrasound Time on the Yield of TMP
3.2.4. Effect of Ultrasound Temperature on the Yield of TMP
3.3. Design of Response Surface Test for Extraction of TMP by Ultrasonic Complex Enzyme Method
3.4. Analysis of Response Surfaces
3.5. Effects of Different Extraction Methods on TMP
3.5.1. Extraction Efficiency
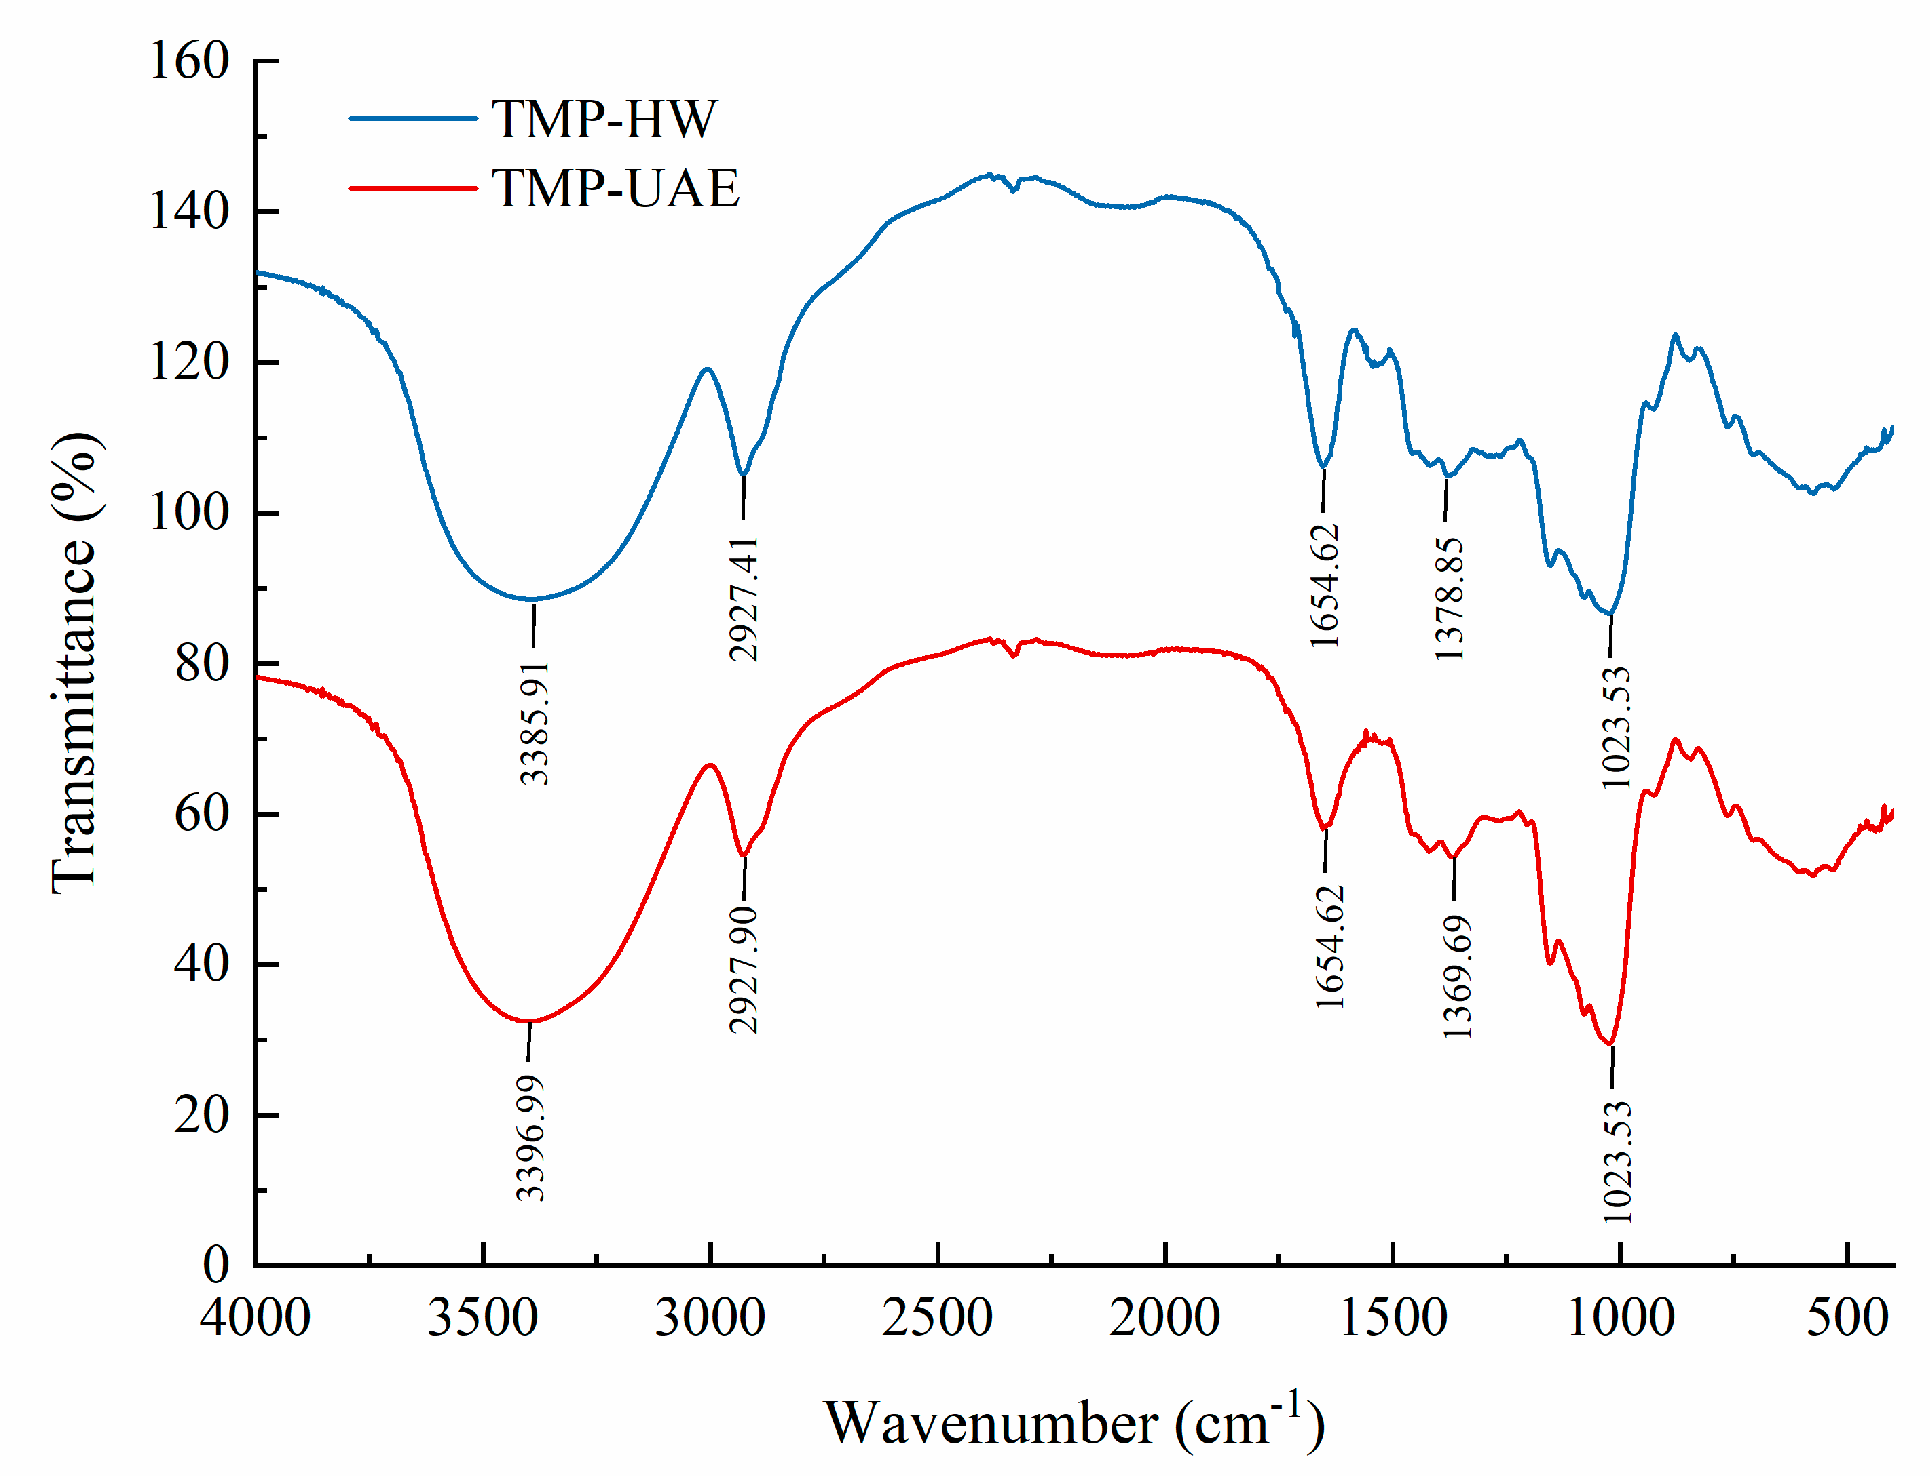
3.5.2. IR Analysis
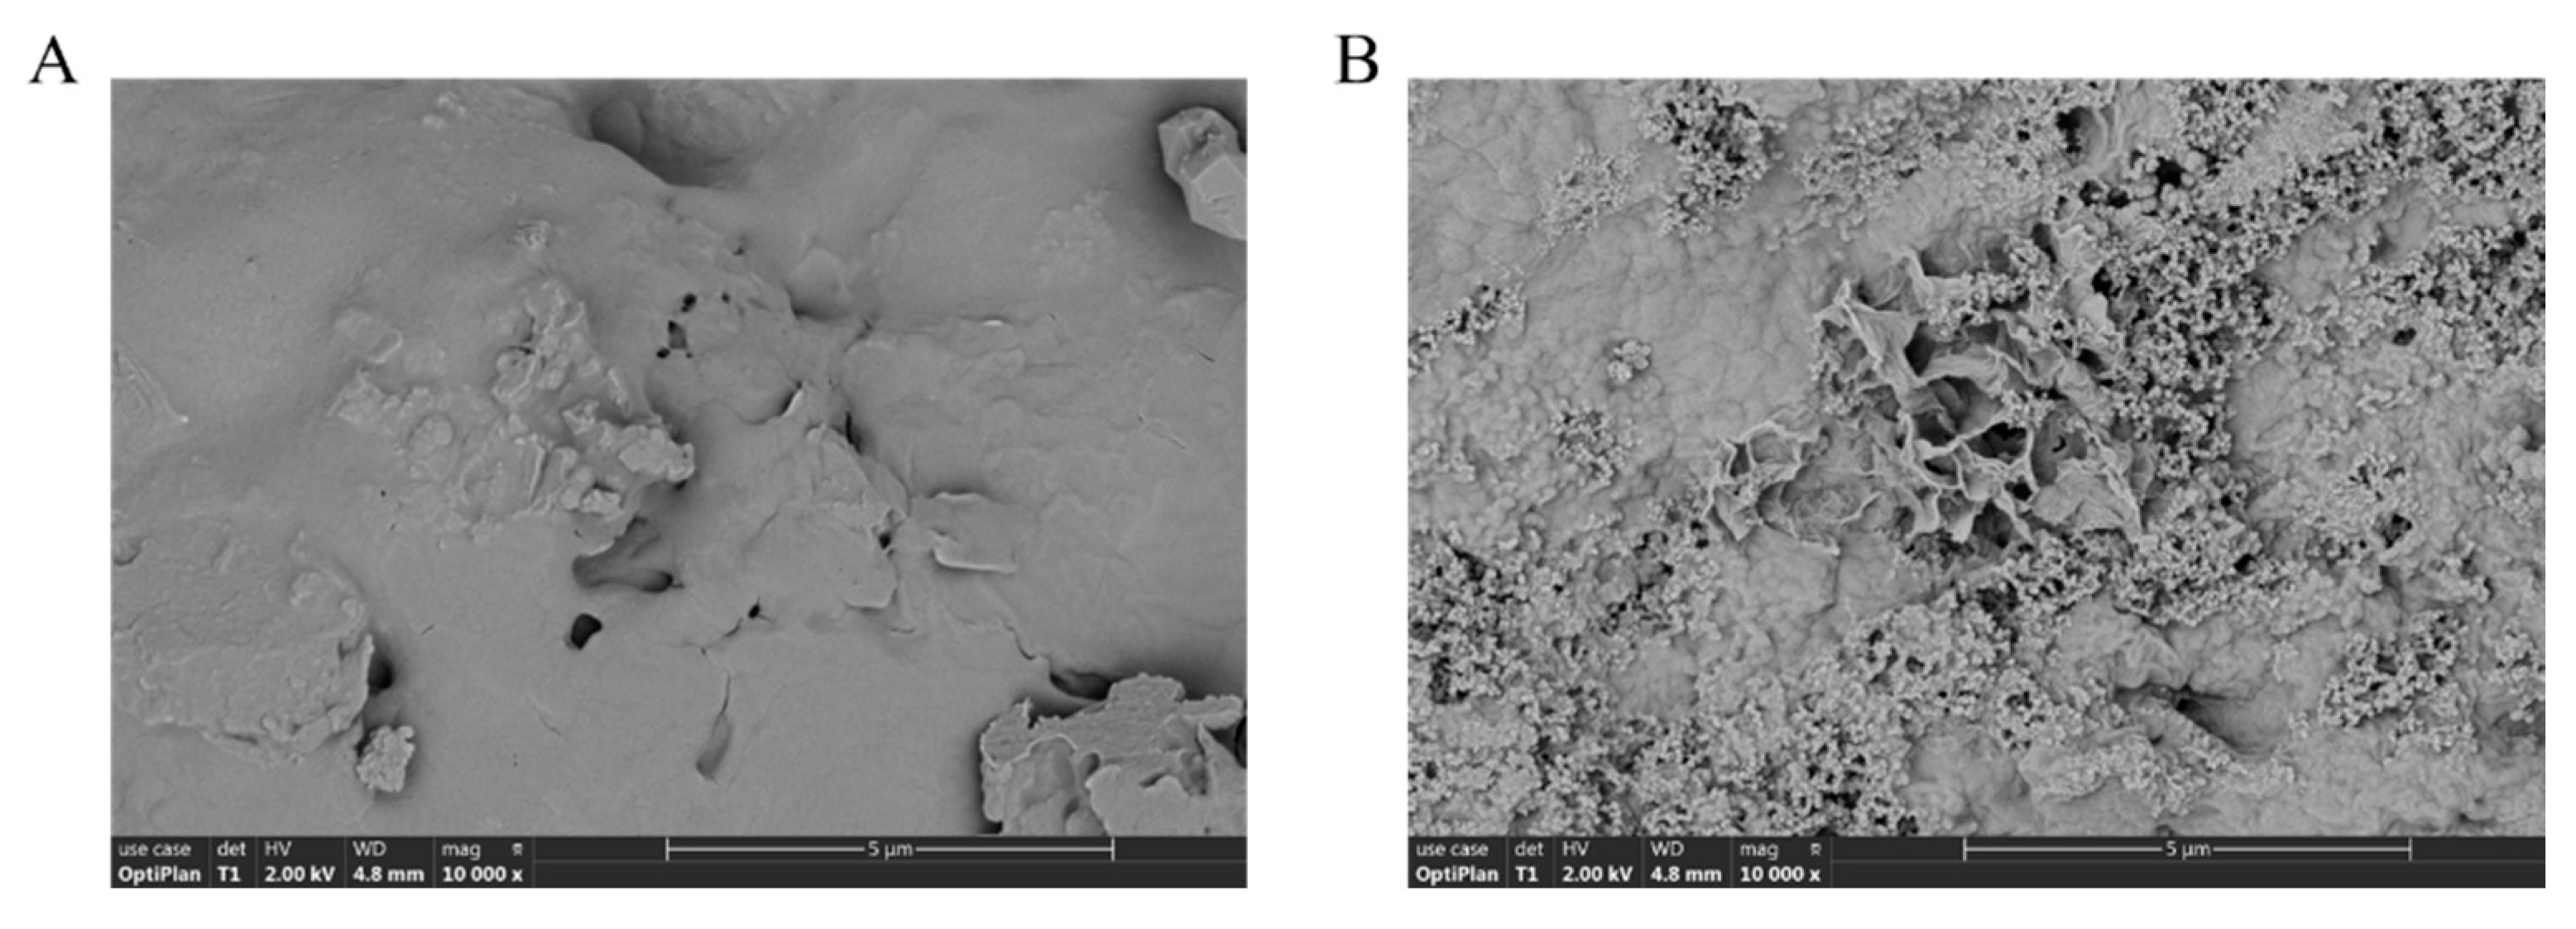
3.5.3. SEM Analyses
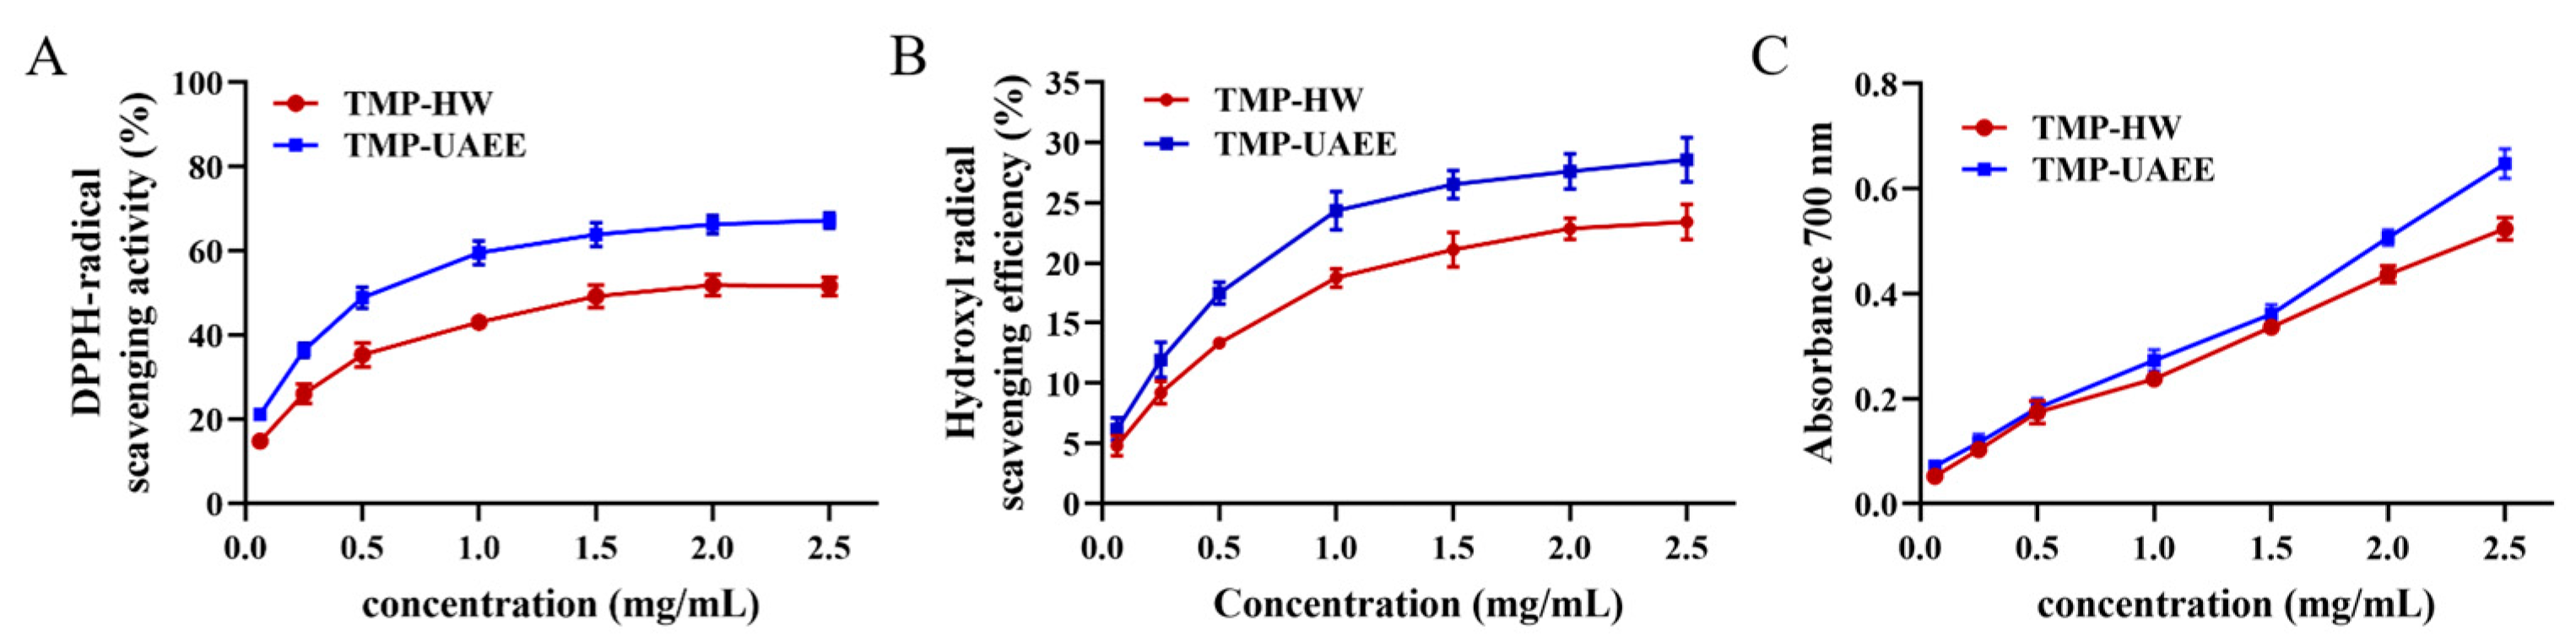
3.6. Antioxidant Activity of TMP
3.7. Structural Characterization of TMP
3.7.1. Monosaccharide Composition and Molecular Weight Analysis
3.7.2. Ultraviolet-Visible Light Analysis and Morphological Structure Observation of TMP
3.7.3. FT–IR Analysis
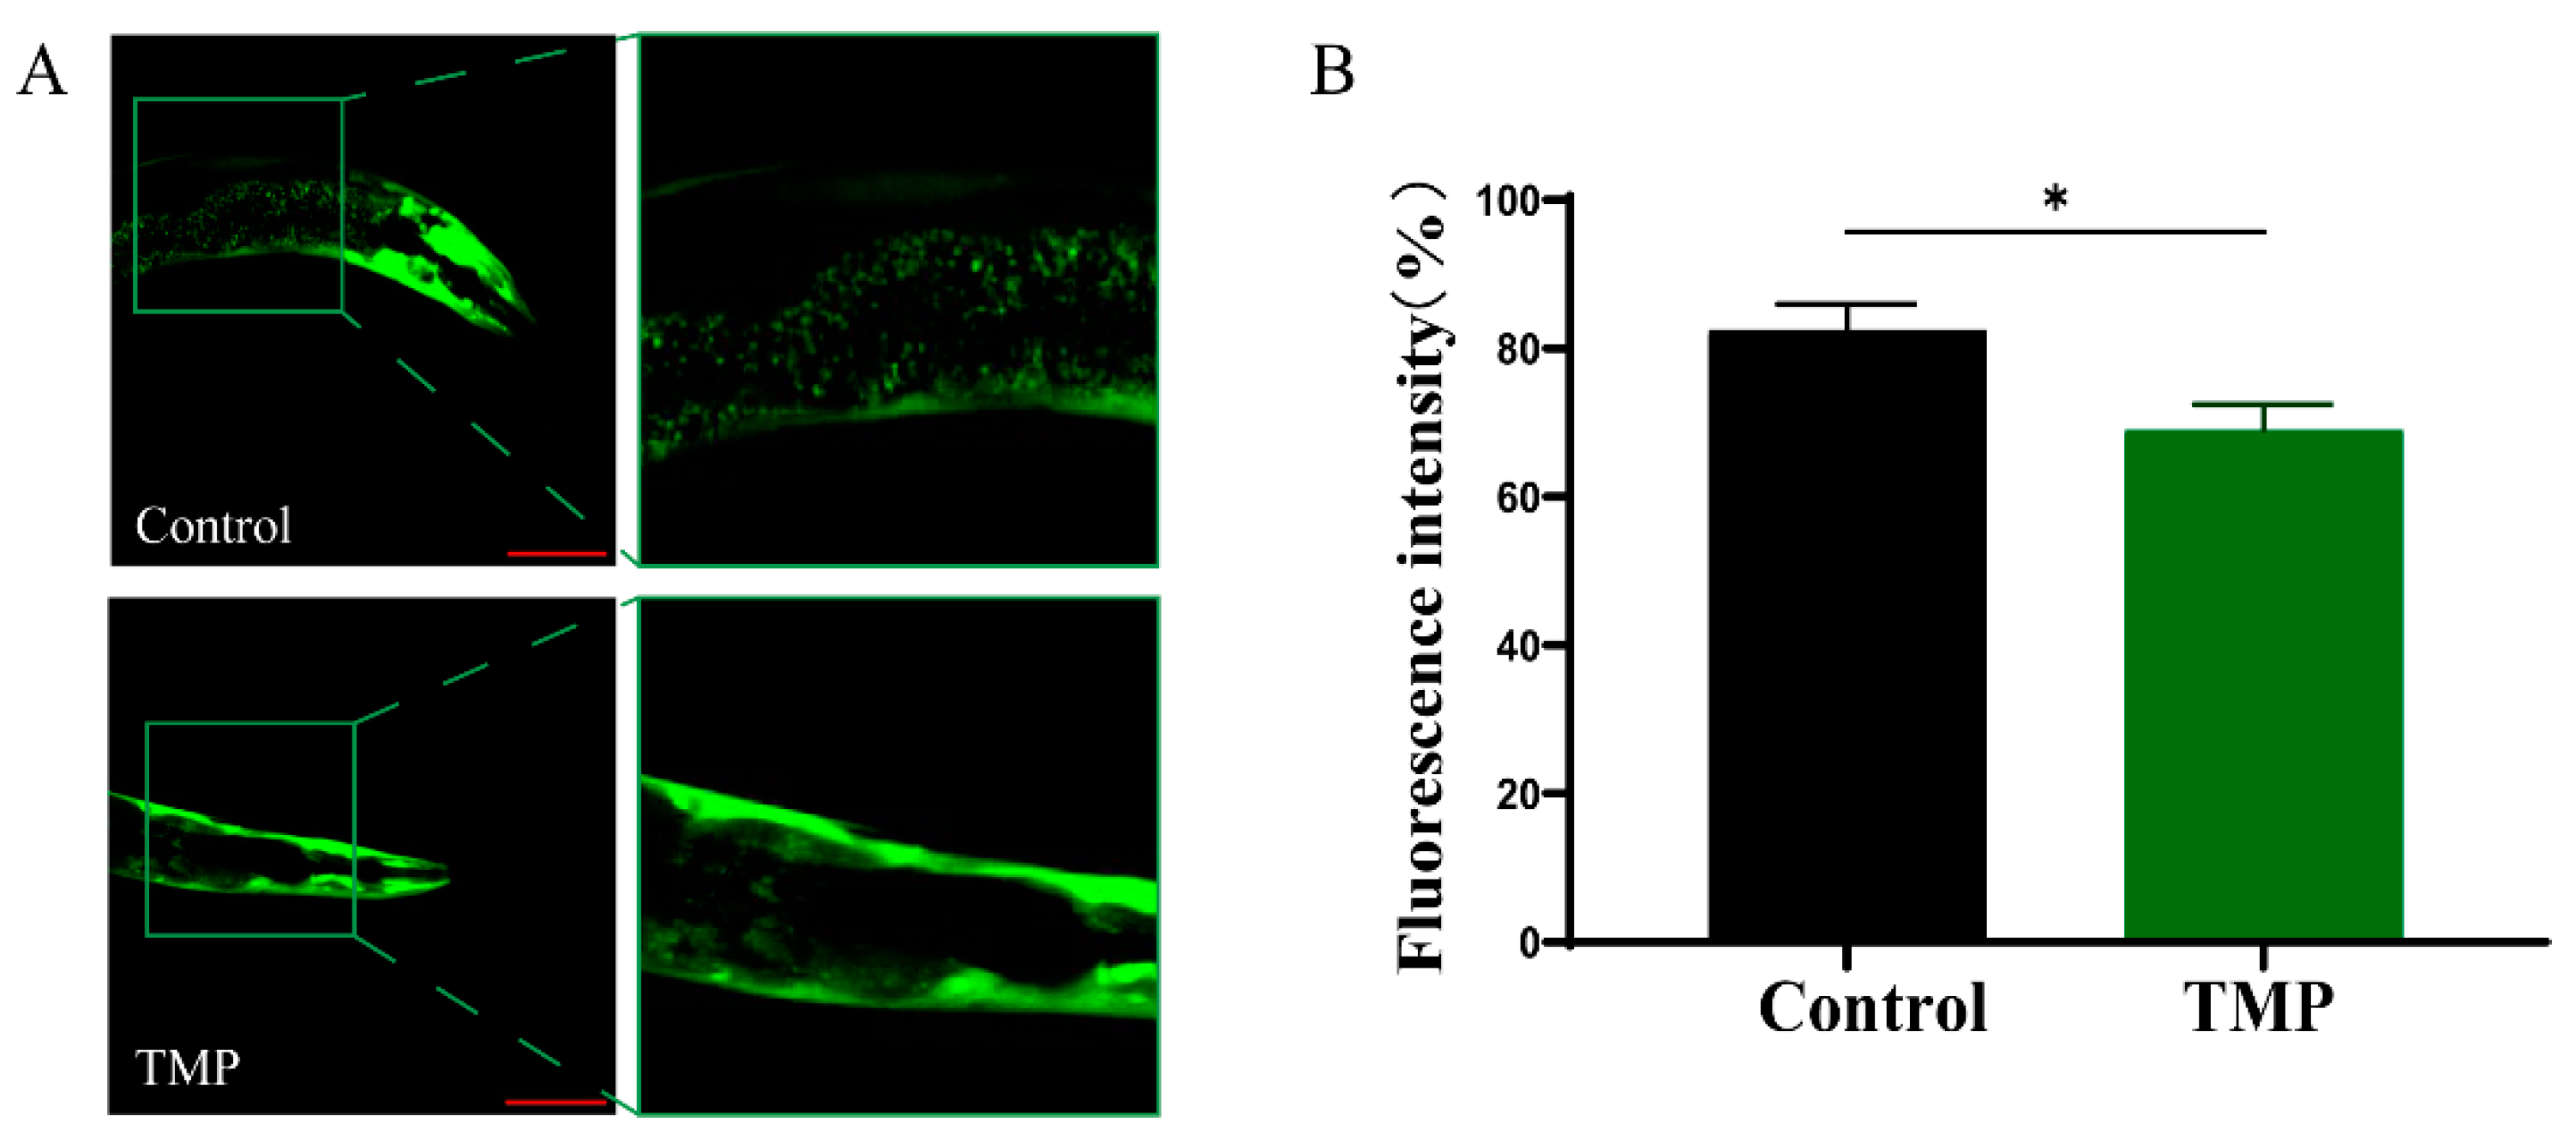
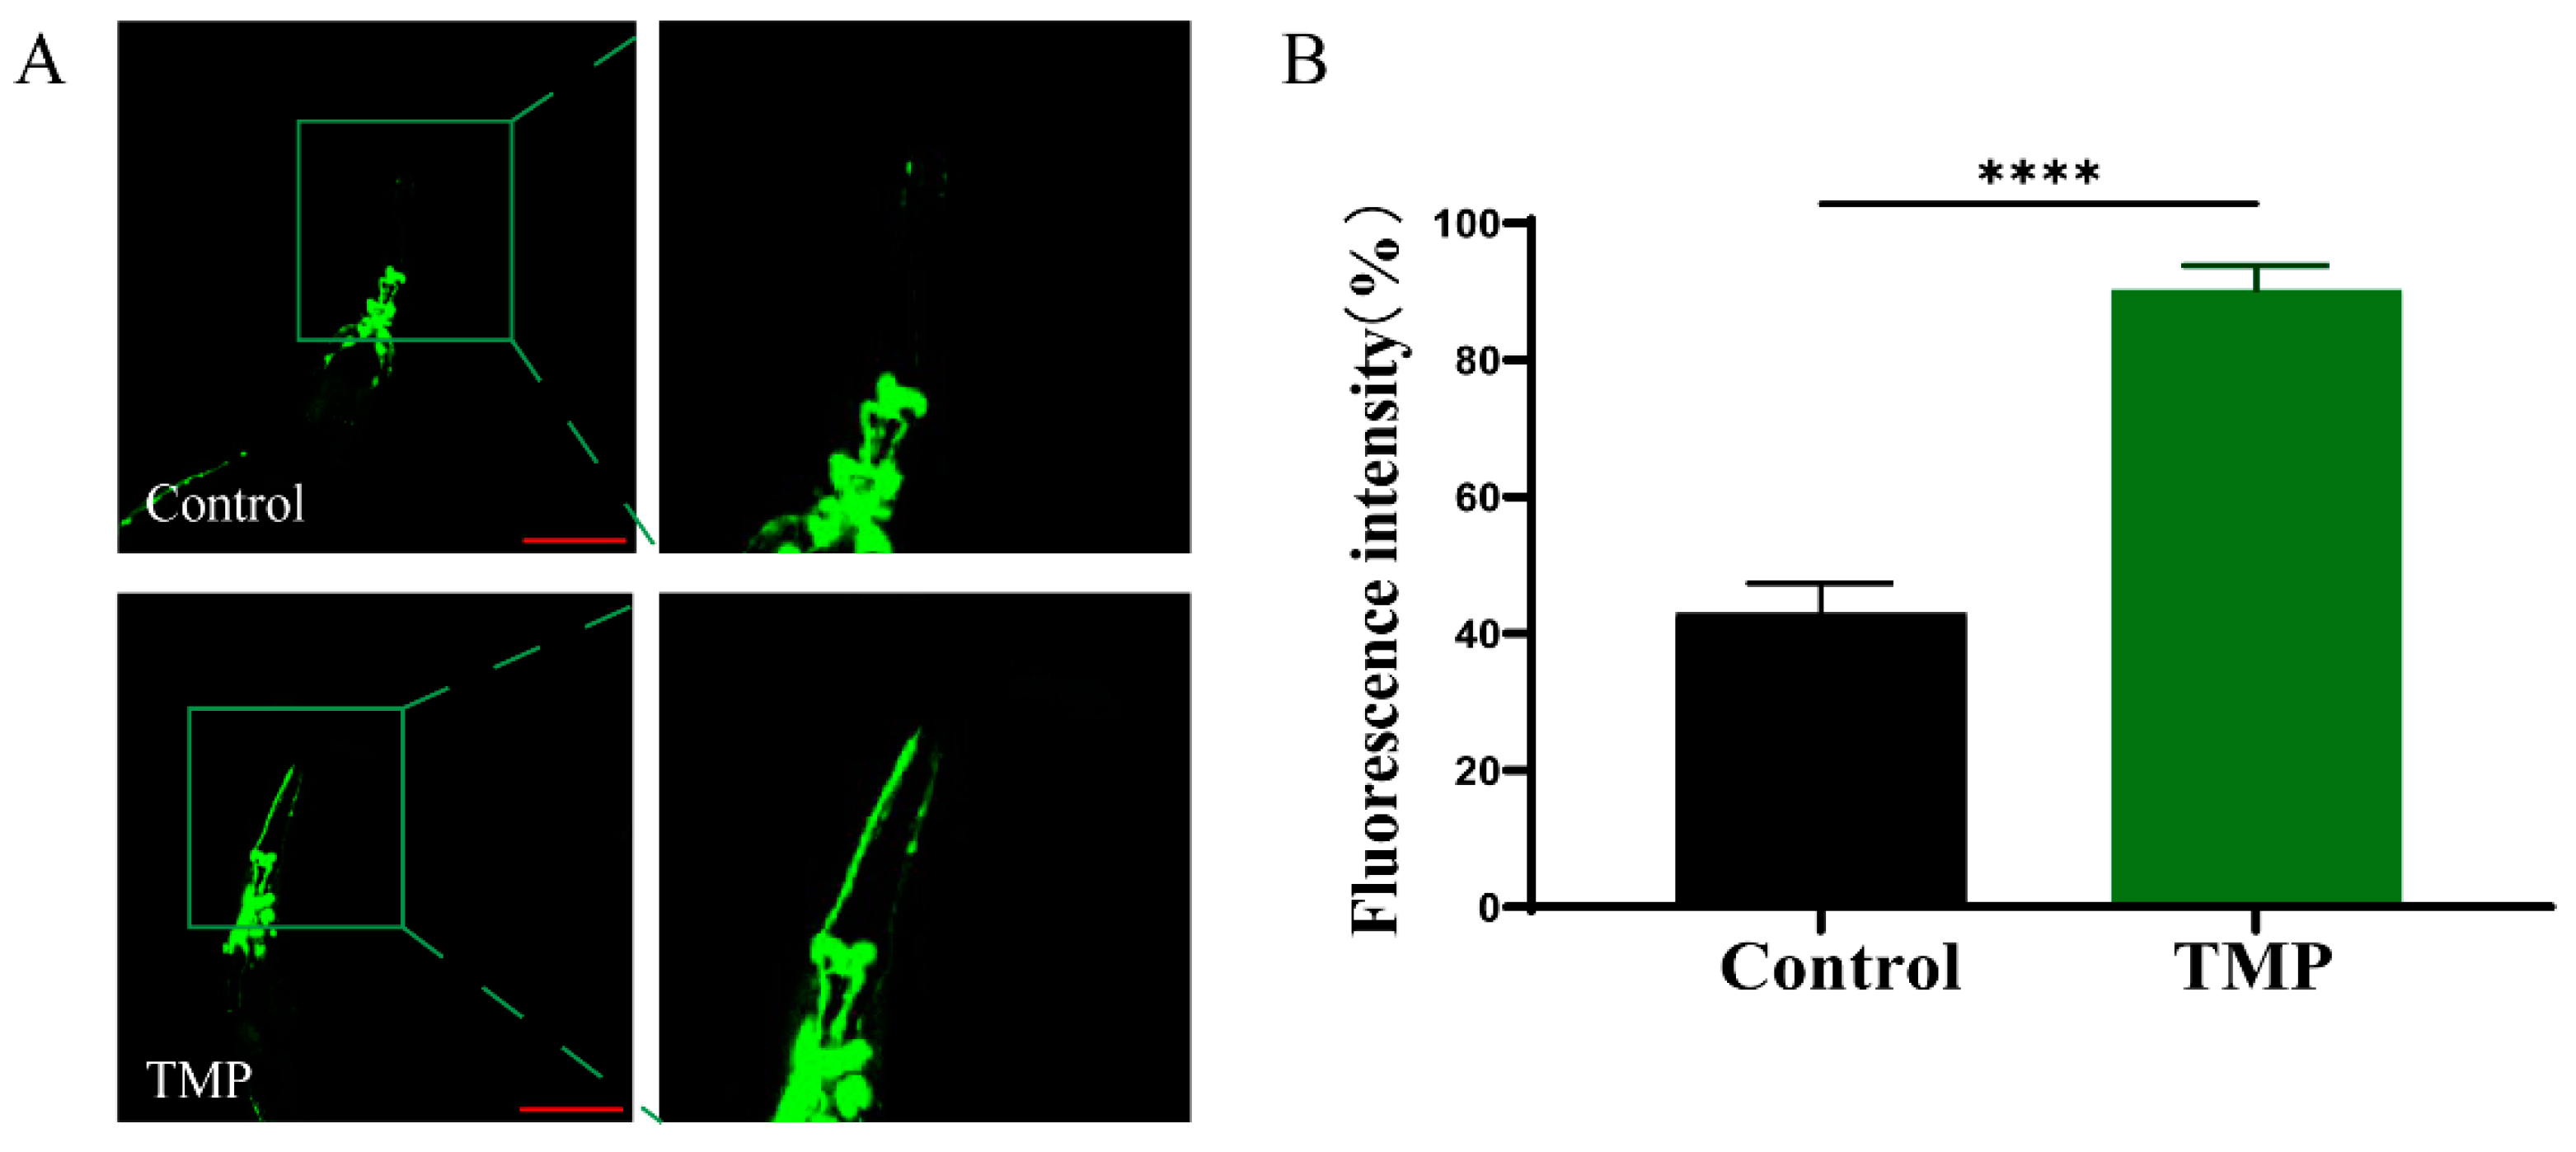
3.8. The Protective Effect of TMP Against C. elegans in Parkinson’s Disease
4. Conclusions
Supplementary Materials
Author Contributions
Funding
Institutional Review Board Statement
Informed Consent Statement
Data Availability Statement
Conflicts of Interest
References
- You, L.J.; Gao, Q.; Feng, M.Y.; Yang, B.; Ren, J.Y.; Gu, L.J.; Cui, C.; Zhao, M.M. Structural characterisation of polysaccharides from and their antioxidant and antitumour activities. Food Chem. 2013, 138, 2242–2249. [Google Scholar] [CrossRef]
- Chen, Y.; Du, X.J.; Zhang, Y.; Liu, X.H.; Wang, X.D. Ultrasound extraction optimization, structural features, and antioxidant activity of polysaccharides from Tricholoma matsutake. J. Zhejiang Univ. Sci. B 2017, 18, 674–684. [Google Scholar] [CrossRef] [PubMed]
- Yang, H.R.; Chen, L.H.; Zeng, Y.J. Structure, Antioxidant Activity and In Vitro Hypoglycemic Activity of a Polysaccharide Purified from Tricholoma matsutake. Foods 2021, 10, 2184. [Google Scholar] [CrossRef] [PubMed]
- Hou, Y.; Ding, X.; Hou, W.; Song, B.; Yan, X. Structure elucidation and antitumor activity of a new polysaccharide from Maerkang Tricholoma matsutake. Int. J. Biol. Sci. 2017, 13, 935–948. [Google Scholar] [CrossRef]
- Byeon, S.E.; Lee, J.; Lee, E.; Lee, S.Y.; Hong, E.K.; Kim, Y.E.; Cho, J.Y. Functional activation of macrophages, monocytes and splenic lymphocytes by polysaccharide fraction from Tricholoma matsutake. Arch. Pharm. Res. 2009, 32, 1565–1572. [Google Scholar] [CrossRef]
- Zhou, Y.F.; El-Seedi, H.R.; Xu, B.J. Insights into health promoting effects and myochemical profiles of pine mushroom. Crit. Rev. Food Sci. 2023, 63, 5698–5723. [Google Scholar] [CrossRef] [PubMed]
- Leong, Y.K.; Yang, F.C.; Chang, J.S. Extraction of polysaccharides from edible mushrooms: Emerging technologies and recent advances. Carbohydr. Polym. 2021, 251, 117006. [Google Scholar] [CrossRef] [PubMed]
- Hromádková, Z.; Ebringerová, A.; Valachovic, P. Comparison of classical and ultrasound-assisted extraction of polysaccharides from Salvia officinalis L. Ultrason. Sonochem. 1999, 5, 163–168. [Google Scholar] [CrossRef]
- Hromádková, Z.; Ebringerová, A.; Valachovic, P. Ultrasound-assisted extraction of water-soluble polysaccharides from the roots of valerian (Valeriana officinalis L.). Ultrason. Sonochem. 2002, 9, 37–44. [Google Scholar] [CrossRef]
- Li, X.; Zhu, J.; Wang, T.; Sun, J.; Guo, T.; Zhang, L.; Yu, G.; Xia, X. Antidiabetic activity of Armillaria mellea polysaccharides: Joint ultrasonic and enzyme assisted extraction. Ultrason. Sonochem. 2023, 95, 106370. [Google Scholar] [CrossRef] [PubMed]
- Shi, L. Bioactivities, isolation and purification methods of polysaccharides from natural products: A review. Int. J. Biol. Macromol. 2016, 92, 37–48. [Google Scholar] [CrossRef] [PubMed]
- Lin, B.B.; Wang, S.S.; Zhou, A.Q.; Hu, Q.R.; Huang, G.L. Ultrasound-assisted enzyme extraction and properties of Shatian pomelo peel polysaccharide. Ultrason. Sonochem. 2023, 98, 106507. [Google Scholar] [CrossRef]
- Mapholi, Z.; Goosen, N.J. Optimization of fucoidan recovery by ultrasound-assisted enzymatic extraction from South African kelp, Ecklonia maxima. Ultrason. Sonochem. 2023, 101, 106710. [Google Scholar] [CrossRef] [PubMed]
- Gan, Q.X.; Peng, M.Y.; Wei, H.B.; Chen, L.L.; Chen, X.Y.; Li, Z.H.; An, G.Q.; Ma, Y.T. Gastrodia elata polysaccharide alleviates Parkinson’s disease via inhibiting apoptotic and inflammatory signaling pathways and modulating the gut microbiota. Food Funct. 2024, 15, 2920–2938. [Google Scholar] [CrossRef] [PubMed]
- Tan, Y.; Yin, L.; Sun, Z.; Shao, S.; Chen, W.; Man, X.; Du, Y.; Chen, Y. Astragalus polysaccharide exerts anti-Parkinson via activating the PI3K/AKT/mTOR pathway to increase cellular autophagy level in vitro. Int. J. Biol. Macromol. 2020, 153, 349–356. [Google Scholar] [CrossRef] [PubMed]
- Jha, A.K.; Sit, N. Extraction of bioactive compounds from plant materials using combination of various novel methods: A review. Trends Food Sci. Technol. 2022, 119, 579–591. [Google Scholar] [CrossRef]
- DuBois, M.; Gilles, K.A.; Hamilton, J.K.; Rebers, P.A.; Smith, F. Colorimetric Method for Determination of Sugars and Related Substances. Anal. Chem. 1956, 28, 350–356. [Google Scholar] [CrossRef]
- Song, Z.; Xiong, X.; Huang, G. Ultrasound-assisted extraction and characteristics of maize polysaccharides from different sites. Ultrason. Sonochem. 2023, 95, 106416. [Google Scholar] [CrossRef]
- Yin, D.; Sun, X.; Li, N.; Guo, Y.; Tian, Y.; Wang, L. Structural properties and antioxidant activity of polysaccharides extracted from Laminaria japonica using various methods. Process Biochem. 2021, 111, 201–209. [Google Scholar] [CrossRef]
- Tan, J.; Liu, T.; Yao, Y.; Wu, N.; Du, H.; Xu, M.; Liao, M.; Zhao, Y.; Tu, Y. Changes in physicochemical and antioxidant properties of egg white during the Maillard reaction induced by alkali. LWT 2021, 143, 111151. [Google Scholar] [CrossRef]
- Tian, S.; Peng, Z.; Zhang, J.; Yan, D.; Liang, J.; Zhao, G.; Zhong, P.; Li, H.; Yang, D.; Zhao, Z. Structural analysis and biological activity of cell wall polysaccharides and enzyme-extracted polysaccharides from pomelo (Citrus maxima (Burm.) Merr.). Int. J. Biol. Macromol. 2024, 279, 135249. [Google Scholar] [CrossRef] [PubMed]
- Vrijsen, S.; Besora-Casals, L.; van Veen, S.; Zielich, J.; Van den Haute, C.; Hamouda, N.N.; Fischer, C.; Ghesquiere, B.; Tournev, I.; Agostinis, P.; et al. ATP13A2-mediated endo-lysosomal polyamine export counters mitochondrial oxidative stress. Proc. Natl. Acad. Sci. USA 2020, 117, 31198–31207. [Google Scholar] [CrossRef] [PubMed]
- Chen, X.; Wei, Z.; Zhu, L.; Yuan, X.; Wei, D.; Peng, W.; Wu, C. Efficient Approach for the Extraction and Identification of Red Pigment from Zanthoxylum bungeanum Maxim and Its Antioxidant Activity. Molecules 2018, 23, 1109. [Google Scholar] [CrossRef]
- Tijskens, L.M.; Greiner, R.; Biekman, E.S.; Konietzny, U. Modeling the effect of temperature and pH on activity of enzymes: The case of phytases. Biotechnol. Bioeng. 2001, 72, 323–330. [Google Scholar] [CrossRef]
- Villay, A.; Lakkis de Filippis, F.; Picton, L.; Le Cerf, D.; Vial, C.; Michaud, P. Comparison of polysaccharide degradations by dynamic high-pressure hom ogenization. Food Hydrocoll. 2012, 27, 278–286. [Google Scholar] [CrossRef]
- Zhao, S.; Kwok, K.C.; Liang, H. Investigation on ultrasound assisted extraction of saikosaponins from Radix Bupleuri. Sep. Purif. Technol. 2007, 55, 307–312. [Google Scholar] [CrossRef] [PubMed]
- Guo, X.; Zou, X.; Sun, M. Optimization of extraction process by response surface methodology and preliminary characterization of polysaccharides from Phellinus igniarius. Carbohydr. Polym. 2010, 80, 344–349. [Google Scholar] [CrossRef]
- Minjares-Fuentes, R.; Femenia, A.; Garau, M.C.; Candelas-Cadillo, M.G.; Simal, S.; Rossello, C. Ultrasound-assisted extraction of hemicelluloses from grape pomace using response surface methodology. Carbohydr. Polym. 2016, 138, 180–191. [Google Scholar] [CrossRef] [PubMed]
- Meng, Q.; Chen, Z.; Chen, F.; Zhang, Z.; Gao, W. Optimization of ultrasonic-assisted extraction of polysaccharides from Hemerocallis citrina and the antioxidant activity study. J. Food Sci. 2021, 86, 3082–3096. [Google Scholar] [CrossRef]
- Younes, I.; Ghorbel-Bellaaj, O.; Nasri, R.; Chaabouni, M.; Rinaudo, M.; Nasri, M. Chitin and chitosan preparation from shrimp shells using optimized enzymatic deproteinization. Process Biochem. 2012, 47, 2032–2039. [Google Scholar] [CrossRef]
- Guo, H.; Zhao, Y.; Chang, J.-S.; Lee, D.-J. Enzymes and enzymatic mechanisms in enzymatic degradation of lignocell ulosic biomass: A mini-review. Bioresour. Technol. 2022, 367, 128252. [Google Scholar] [CrossRef]
- Li, R.; Zhao, Y.; Zhang, T.; Ju, Z.; Ji, X.; Cui, Y.; Wang, L.; Xiao, H. Pd nanoparticles stabilized by bitter gourd polysaccharide with peroxidase properties for H2O2 detection. Int. J. Biol. Macromol. 2023, 233, 123513. [Google Scholar] [CrossRef]
- Pan, L.; Wang, L.; Zhang, F.; Zhang, Y.; Zheng, B. Structural characterization and bifidogenic activity of polysaccharide from Dictyophora indusiata. Food Biosci. 2023, 51, 102297. [Google Scholar] [CrossRef]
- Hu, X.; Xu, F.; Li, J.; Li, J.; Mo, C.; Zhao, M.; Wang, L. Ultrasonic-assisted extraction of polysaccharides from coix seeds: Optimization, purification, and in vitro digestibility. Food Chem. 2022, 374, 131636. [Google Scholar] [CrossRef] [PubMed]
- Ji, L.; Jie, Z.; Ying, X.; Yue, Q.; Zhou, Y.; Sun, L. Structural characterization of alkali-soluble polysaccharides from Panax ginseng C. A. Meyer. R. Soc. Open Sci. 2018, 5, 171644. [Google Scholar] [CrossRef]
- Li, Y.; He, Y.; Zhang, H.; Ma, X. Effects of ultrasonic-enzymatic-assisted ethanol precipitation method on the physicochemical characteristics, antioxidant and hypoglycemic activities of Tremella fuciformis polysaccharides. Ultrason. Sonochem. 2023, 101, 106682. [Google Scholar] [CrossRef]
- Broxterman, S.E.; Schols, H.A. Interactions between pectin and cellulose in primary plant cell walls. Carbohydr. Polym. 2018, 192, 263–272. [Google Scholar] [CrossRef] [PubMed]
- Munteanu, I.G.; Apetrei, C. Analytical Methods Used in Determining Antioxidant Activity: A Review. Int. J. Mol. Sci. 2021, 22, 3380. [Google Scholar] [CrossRef] [PubMed]
- Raza, A.; Li, F.; Xu, X.; Tang, J. Optimization of ultrasonic-assisted extraction of antioxidant polysaccharides from the stem of Trapa quadrispinosa using response surface methodology. Int. J. Biol. Macromol. 2017, 94 Pt A, 335–344. [Google Scholar] [CrossRef]
- Zeng, G.; Shi, M.; Dai, M.; Zhou, Q.; Luo, H.; Lin, L.; Zang, K.; Meng, Z.; Pan, X. Hydroxyl radicals in natural waters: Light/dark mechanisms, changes and scavenging effects. Sci. Total Environ. 2023, 868, 161533. [Google Scholar] [CrossRef] [PubMed]
- Zaric, B.L.; Macvanin, M.T.; Isenovic, E.R. Free radicals: Relationship to Human Diseases and Potential Therapeutic applications. Int. J. Biochem. Cell Biol. 2023, 154, 106346. [Google Scholar] [CrossRef]
- Chen, N.; Hu, M.; Jiang, T.; Xiao, P.; Duan, J.-a. Insights into the molecular mechanisms, structure-activity relationships and application prospects of polysaccharides by regulating Nrf2-mediated antioxidant response. Carbohydr. Polym. 2024, 333, 122003. [Google Scholar] [CrossRef] [PubMed]
- Wang, J.; Hu, S.; Nie, S.; Yu, Q.; Xie, M. Reviews on Mechanisms of In Vitro Antioxidant Activity of Polysaccharides. Oxidative Med. Cell. Longev. 2016, 2016, 5692852. [Google Scholar] [CrossRef] [PubMed]
- Chen, X.; Fang, D.; Zhao, R.; Gao, J.; Kimatu, B.M.; Hu, Q.; Chen, G.; Zhao, L. Effects of ultrasound-assisted extraction on antioxidant activity and bidirectional immunomodulatory activity of Flammulina velutipes polysaccharide. Int. J. Biol. Macromol. 2019, 140, 505–514. [Google Scholar] [CrossRef]
- Lurette, O.; Martín-Jiménez, R.; Khan, M.; Sheta, R.; Jean, S.; Schofield, M.; Teixeira, M.; Rodriguez-Aller, R.; Perron, I.; Oueslati, A.; et al. Aggregation of alpha-synuclein disrupts mitochondrial metabolism and i nduce mitophagy via cardiolipin externalization. Cell Death Dis. 2023, 14, 729. [Google Scholar] [CrossRef]
- Wang, W.; Li, J.; Lu, F.; Liu, F. Ultrasound-Assisted Multi-Enzyme Extraction for Highly Efficient Extraction of Polysaccharides from Ulva lactuca. Foods 2024, 13, 891. [Google Scholar] [CrossRef]
- Wang, S.Y.; Li, M.M.; Wang, L.; Pan, J.; Sun, Y.; Wu, J.T.; Naseem, A.; Jiang, Y.K.; Kuang, H.X.; Yang, B.Y.; et al. Schisandra chinensis (Turcz.) Baill neutral polysaccharides alleviate Parkinson’s disease via effectively activating MCL-1 expression regulation of autophagy signaling. Int. J. Biol. Macromol. 2024, 279 Pt 1, 134952. [Google Scholar] [CrossRef] [PubMed]
- Ma, L.; Zhao, Y.; Chen, Y.; Cheng, B.; Peng, A.; Huang, K. Caenorhabditis elegans as a model system for target identification and drug screening against neurodegenerative diseases. Eur. J. Pharmacol. 2018, 819, 169–180. [Google Scholar] [CrossRef]
- Sanguanphun, T.; Promtang, S.; Sornkaew, N.; Niamnont, N.; Sobhon, P.; Meemon, K. Anti-Parkinson Effects of Holothuria leucospilota-Derived Palmitic Acid in Caenorhabditis elegans Model of Parkinson’s Disease. Mar. Drugs 2023, 21, 141. [Google Scholar] [CrossRef]
- Bonam, S.R.; Muller, S. Parkinson’s disease is an autoimmune disease: A reappraisal. Autoimmun. Rev. 2020, 19, 102684. [Google Scholar] [CrossRef]
- Kuwahara, T.; Koyama, A.; Gengyo-Ando, K.; Masuda, M.; Kowa, H.; Tsunoda, M.; Mitani, S.; Iwatsubo, T. Familial Parkinson mutant alpha-synuclein causes dopamine neuron dysfunction in transgenic Caenorhabditis elegans. J. Biol. Chem. 2006, 281, 334–340. [Google Scholar] [CrossRef] [PubMed]


| Run | Ultrasound Time (Min) | Ultrasound Temperature (°C) | Enzymatic pH (%) | Yield (%) |
|---|---|---|---|---|
| 1 | 25 | 80 | 5 | 19.5222 |
| 2 | 25 | 70 | 4 | 12.3672 |
| 3 | 30 | 90 | 5 | 13.7723 |
| 4 | 25 | 80 | 5 | 19.5244 |
| 5 | 20 | 70 | 5 | 13.0967 |
| 6 | 30 | 70 | 5 | 11.3994 |
| 7 | 30 | 80 | 4 | 12.4545 |
| 8 | 25 | 70 | 6 | 9.82527 |
| 9 | 30 | 80 | 6 | 10.1235 |
| 10 | 25 | 80 | 5 | 19.7762 |
| 11 | 25 | 90 | 4 | 13.9369 |
| 12 | 25 | 80 | 5 | 19.7066 |
| 13 | 25 | 80 | 5 | 19.2754 |
| 14 | 25 | 90 | 6 | 14.4867 |
| 15 | 20 | 80 | 6 | 13.5575 |
| 16 | 20 | 80 | 4 | 14.1764 |
| 17 | 20 | 90 | 5 | 17.1004 |
| Source | Sum of Squares | df | Mean Square | F-Value | p-Value | |
|---|---|---|---|---|---|---|
| Model | 7.24 | 9 | 0.8044 | 315.88 | <0.0001 | significant |
| A-Ultrasound time | 12.96 | 1 | 12.96 | 334.26 | <0.0001 | |
| B-Ultrasound temperature | 19.87 | 1 | 19.87 | 512.57 | <0.0001 | |
| C-enzymatic hydrolysis pH | 3.05 | 1 | 3.05 | 78.76 | <0.0001 | |
| AB | 0.6650 | 1 | 0.6650 | 17.15 | 0.0043 | |
| AC | 0.7329 | 1 | 0.7329 | 18.91 | 0.0034 | |
| BC | 2.39 | 1 | 2.39 | 61.65 | 0.0001 | |
| A2 | 35.35 | 1 | 35.35 | 911.86 | <0.0001 | |
| B2 | 33.52 | 1 | 33.52 | 864.62 | <0.0001 | |
| C2 | 70.28 | 1 | 70.28 | 1813.08 | <0.0001 | |
| Residual | 0.2713 | 7 | 0.0388 | |||
| Lack of Fit | 0.1195 | 3 | 0.0398 | 1.05 | 0.4627 | not significant |
| Pure Error | 0.1519 | 4 | 0.0380 | |||
| Cor Total | 194.74 | 16 |
| Source | Source | ||
|---|---|---|---|
| Std. Dev. | 0.1969 | R2 | 0.9986 |
| Mean | 114.95 | Adjusted R2 | 0.9968 |
| C.V. % | 11.32 | Predicted R2 | 0.9890 |
| Adeq Precision | 665.3862 |
| Ultrasound Time (Min) | Ultrasound Temperature (°C) | Enzymatic Hydrolysis pH | Yield (%) | |
|---|---|---|---|---|
| Predicted value | 23.455 | 84.475 | 5.012 | 19.872 |
| Actual value | 24.0 | 85.0 | 5.0 | 19.74 ± 0.51 p > 0.05 |
| Yield (%) | Sugar Content (%) | Protein Content (%) | |
|---|---|---|---|
| TMP-HW | 4.63 | 37.39 | 9.17 |
| TMP-UAE | 19.74 | 65.02 | 9.79 |
| Group | Mean Survival Day ± SEM | Percent Increase |
|---|---|---|
 Control Control | 7.940 ± 0.50 | |
 TMP TMP | 10.70 ± 0.77 | 34.76% |
Disclaimer/Publisher’s Note: The statements, opinions and data contained in all publications are solely those of the individual author(s) and contributor(s) and not of MDPI and/or the editor(s). MDPI and/or the editor(s) disclaim responsibility for any injury to people or property resulting from any ideas, methods, instructions or products referred to in the content. |
© 2024 by the authors. Licensee MDPI, Basel, Switzerland. This article is an open access article distributed under the terms and conditions of the Creative Commons Attribution (CC BY) license (https://creativecommons.org/licenses/by/4.0/).
Share and Cite
Gao, W.; Wang, Y.; Lu, F.; Liu, F. Ultrasound-Assisted Enzymatic Extraction of Polysaccharides from Tricholoma matsutake: Optimization, Structural Characterization, and Inhibition of α-Synuclein Aggregation. Foods 2024, 13, 4150. https://doi.org/10.3390/foods13244150
Gao W, Wang Y, Lu F, Liu F. Ultrasound-Assisted Enzymatic Extraction of Polysaccharides from Tricholoma matsutake: Optimization, Structural Characterization, and Inhibition of α-Synuclein Aggregation. Foods. 2024; 13(24):4150. https://doi.org/10.3390/foods13244150
Chicago/Turabian StyleGao, Wen, Yang Wang, Fuping Lu, and Fufeng Liu. 2024. "Ultrasound-Assisted Enzymatic Extraction of Polysaccharides from Tricholoma matsutake: Optimization, Structural Characterization, and Inhibition of α-Synuclein Aggregation" Foods 13, no. 24: 4150. https://doi.org/10.3390/foods13244150
APA StyleGao, W., Wang, Y., Lu, F., & Liu, F. (2024). Ultrasound-Assisted Enzymatic Extraction of Polysaccharides from Tricholoma matsutake: Optimization, Structural Characterization, and Inhibition of α-Synuclein Aggregation. Foods, 13(24), 4150. https://doi.org/10.3390/foods13244150