Spectral Fingerprinting of Tencha Processing: Optimising the Detection of Total Free Amino Acid Content in Processing Lines by Hyperspectral Analysis
Abstract
1. Introduction
2. Materials and Methods
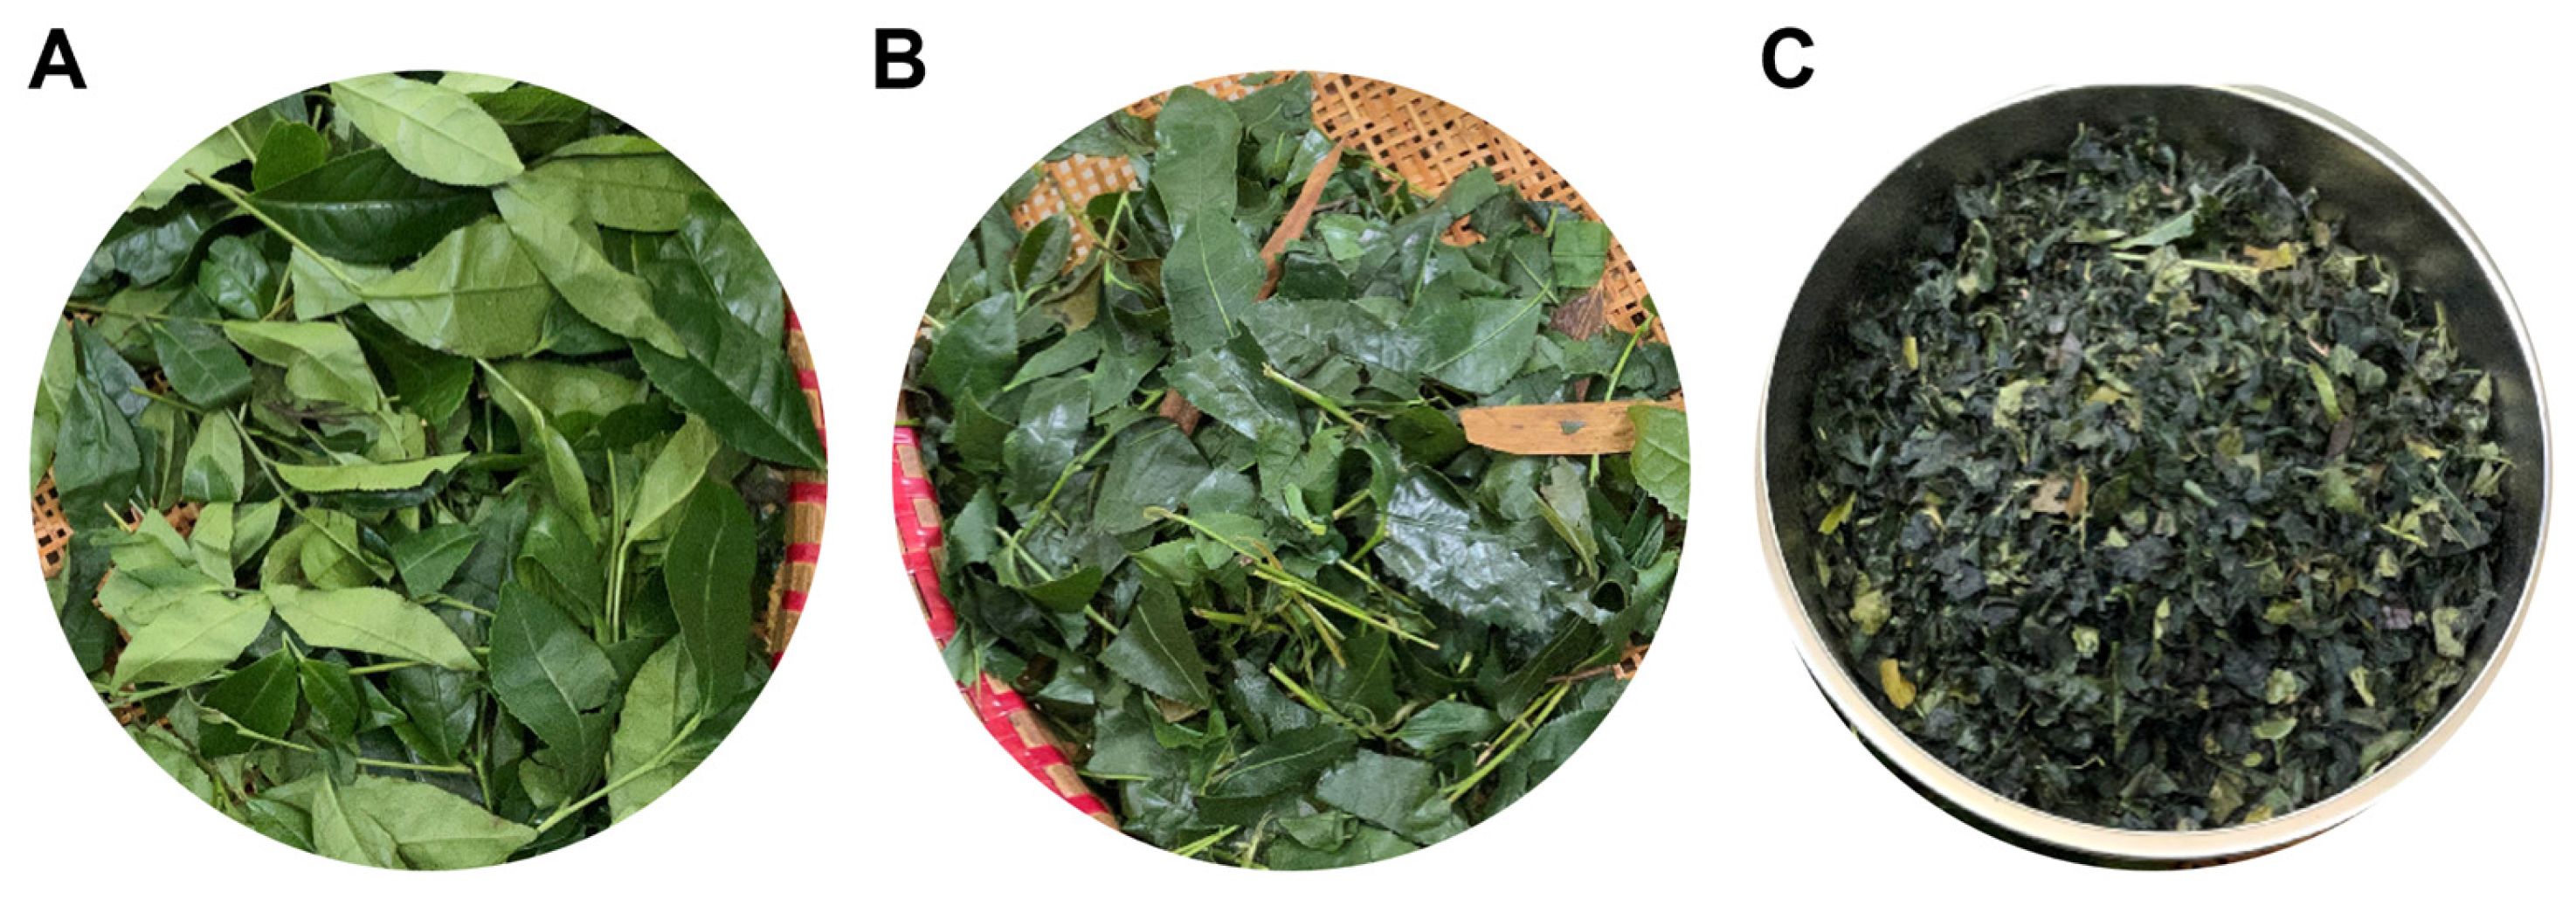
2.1. Tea Sample Collection
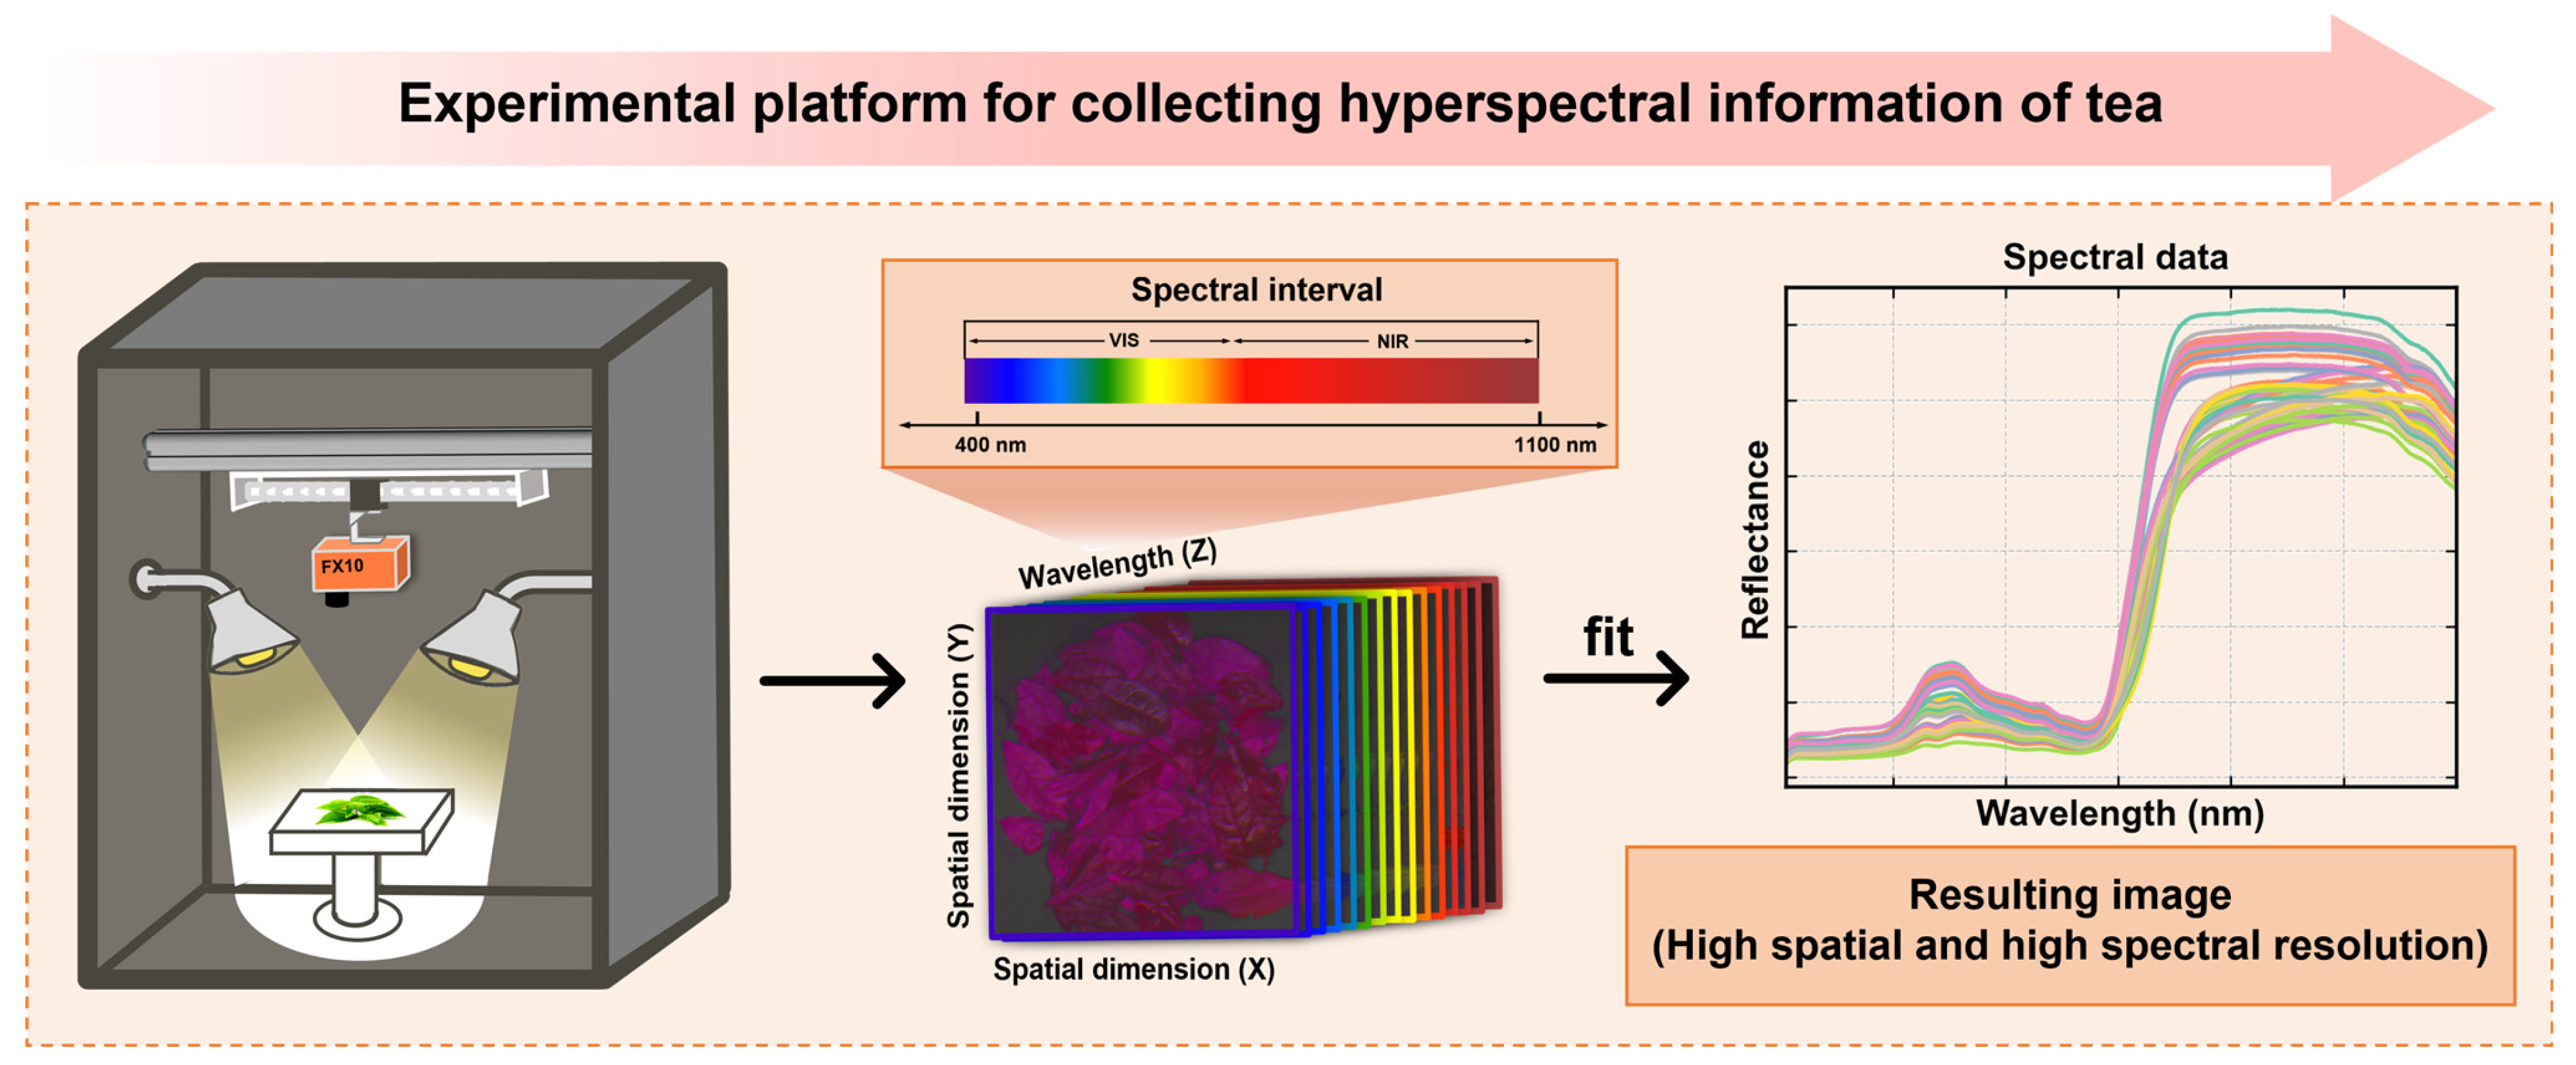
2.2. Spectral Collection
2.3. Chemical Analysis
2.4. Spectral Information Extraction
2.4.1. Average Reflectance Spectrum Extraction and Pre-Processing
2.4.2. Selection of Characteristic Wavelengths
2.5. Building Calibration Models
2.5.1. Modelling Data Segmentation
2.5.2. Selection of Modelling Methods
2.5.3. Evaluation INDICATORS for Modelling
3. Results and Discussion
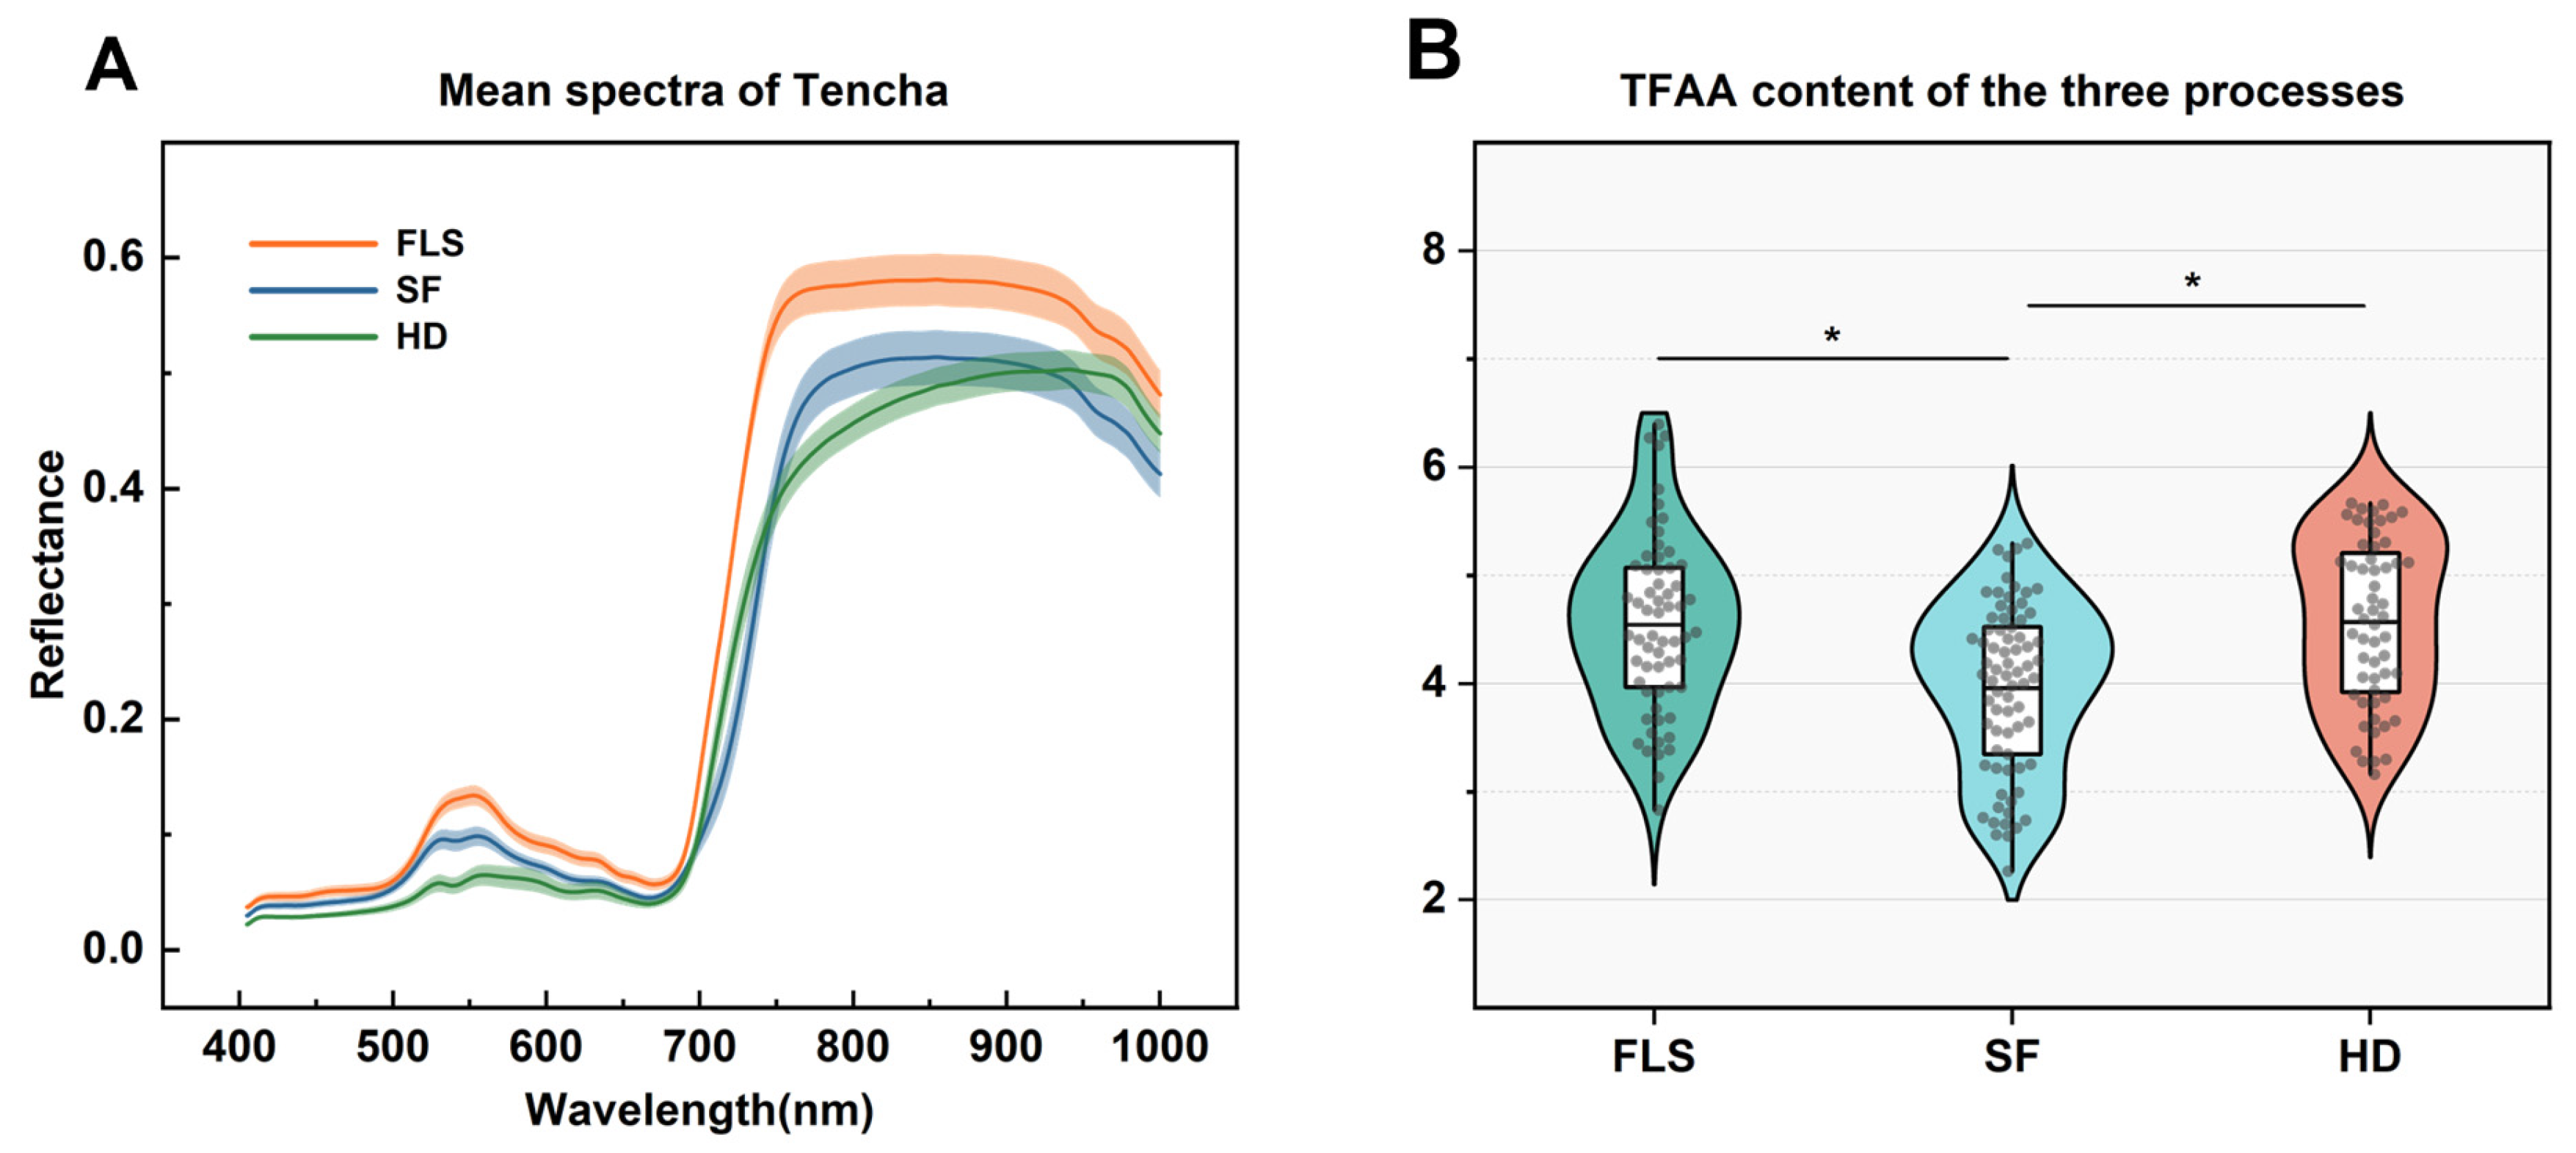
3.1. Spectral Characterization and Analysis of TFAA Content
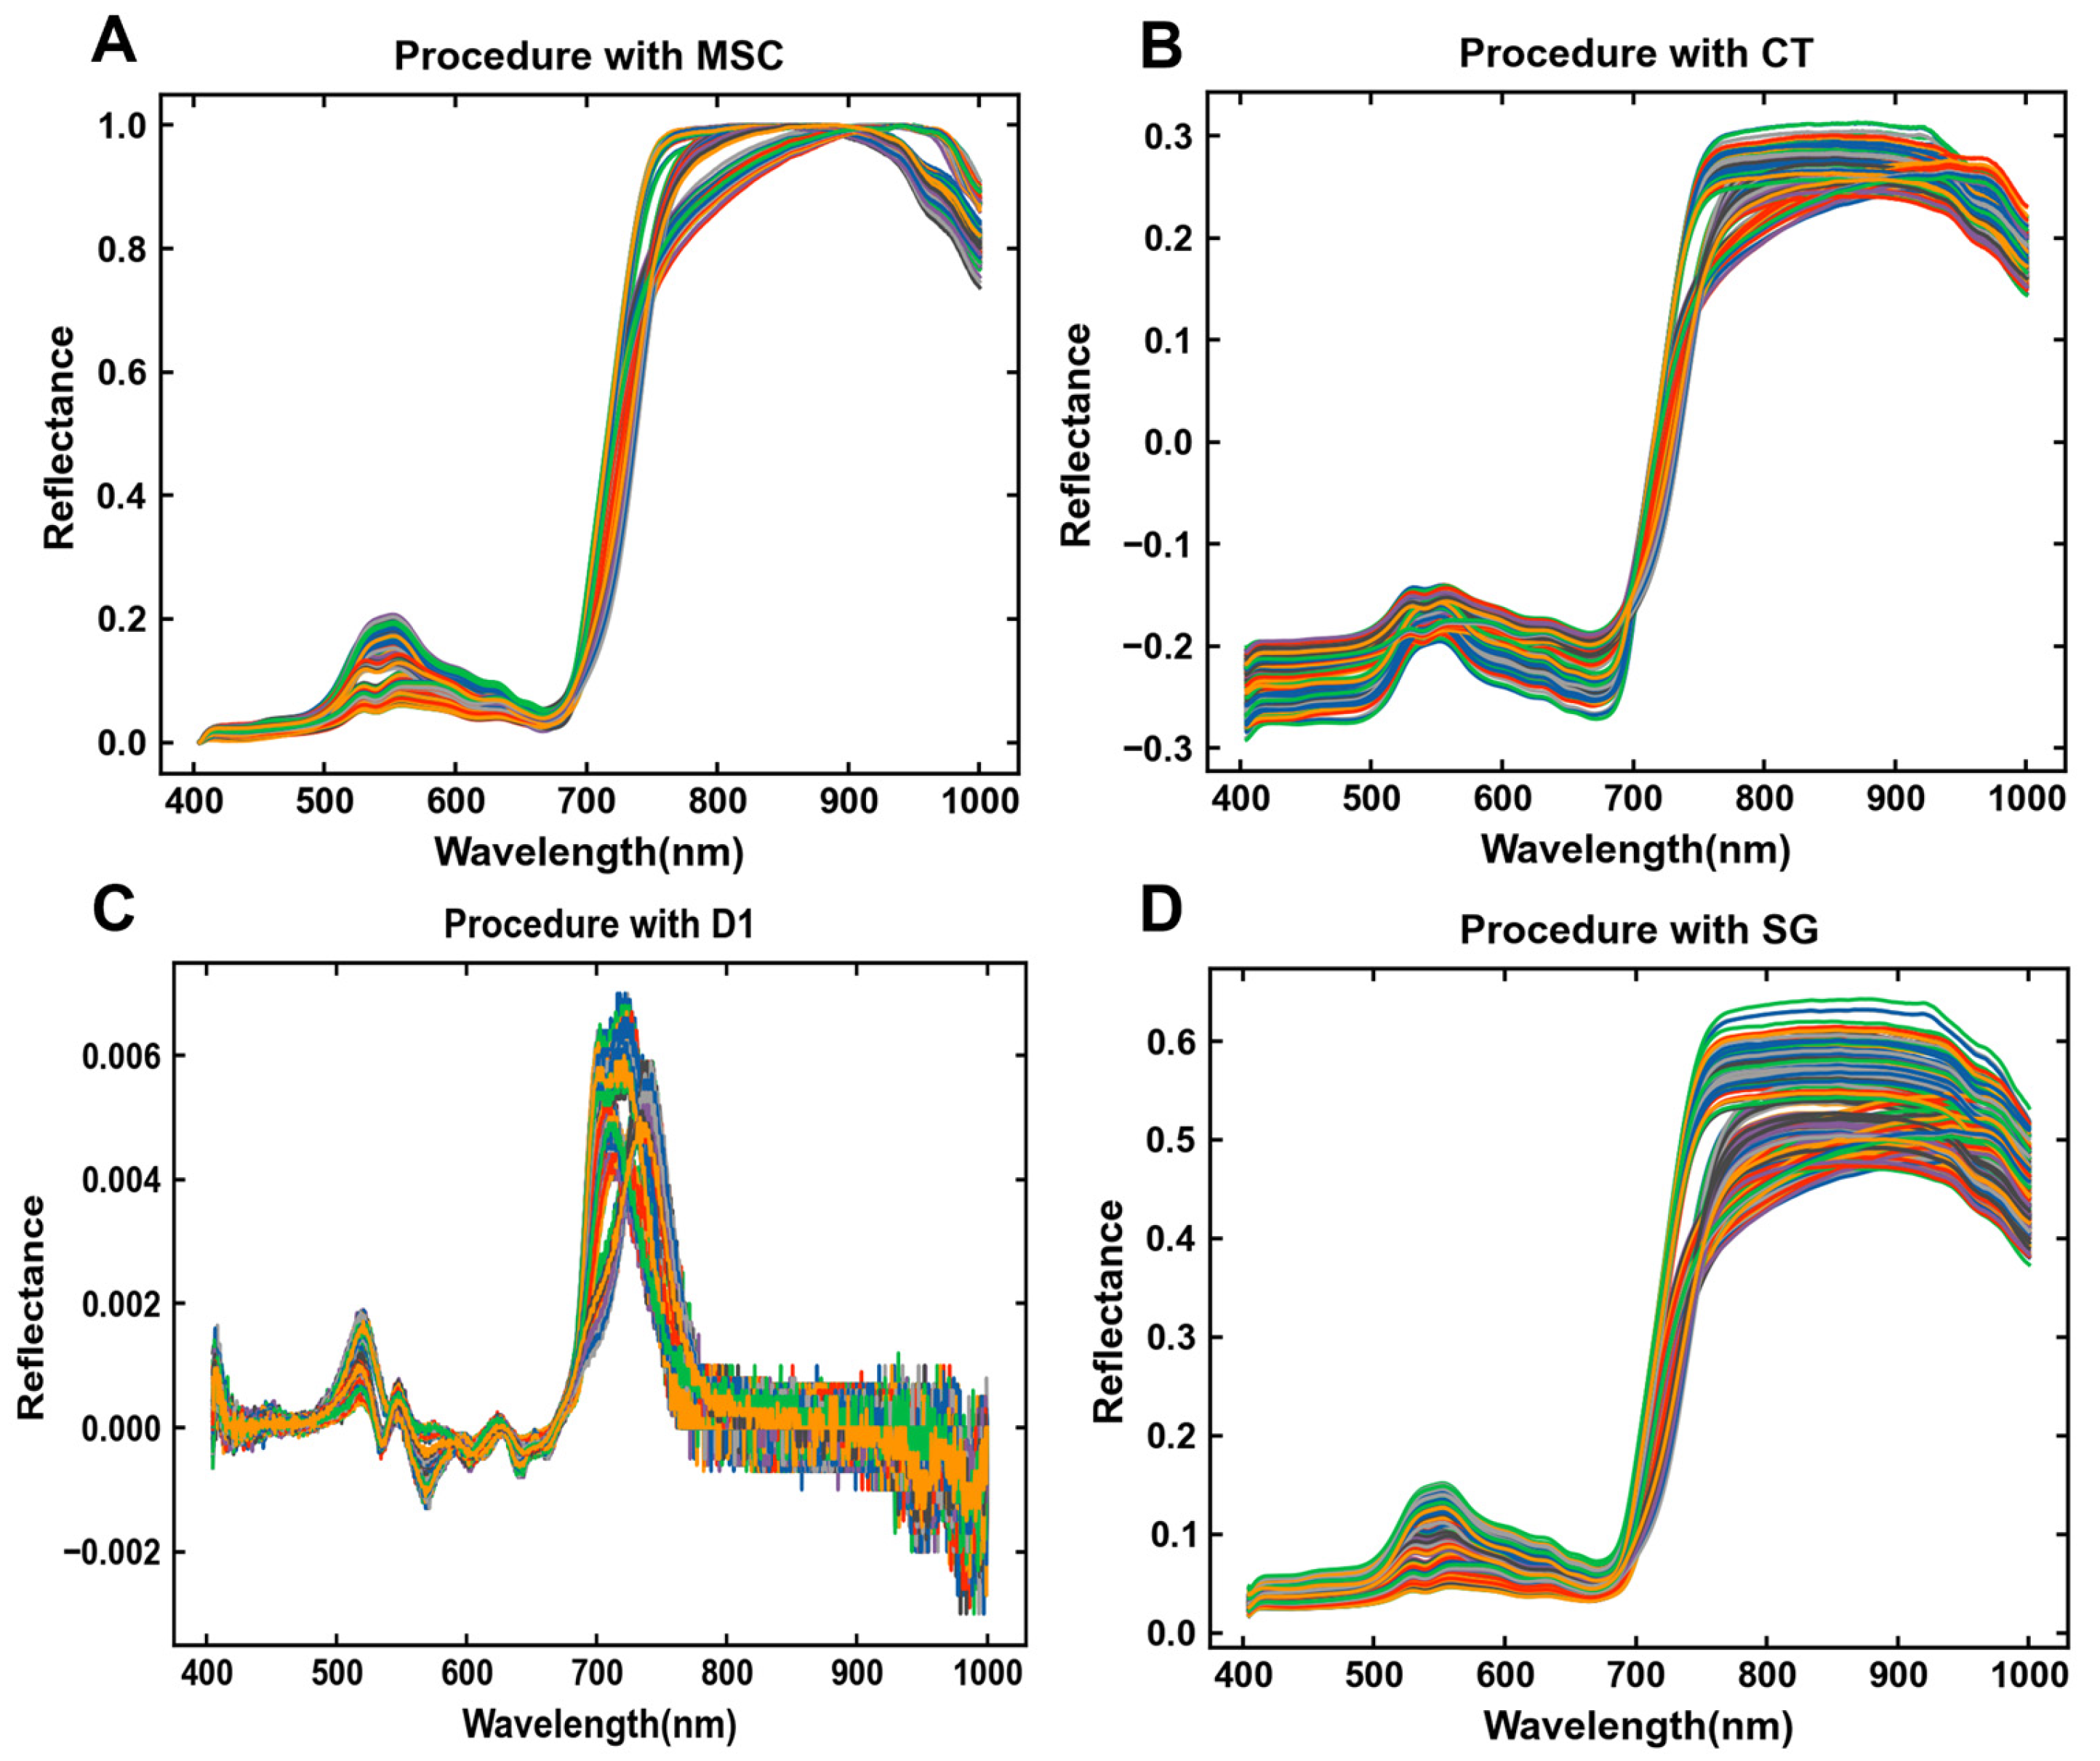
3.2. Spectral Pretreating of Collected Samples
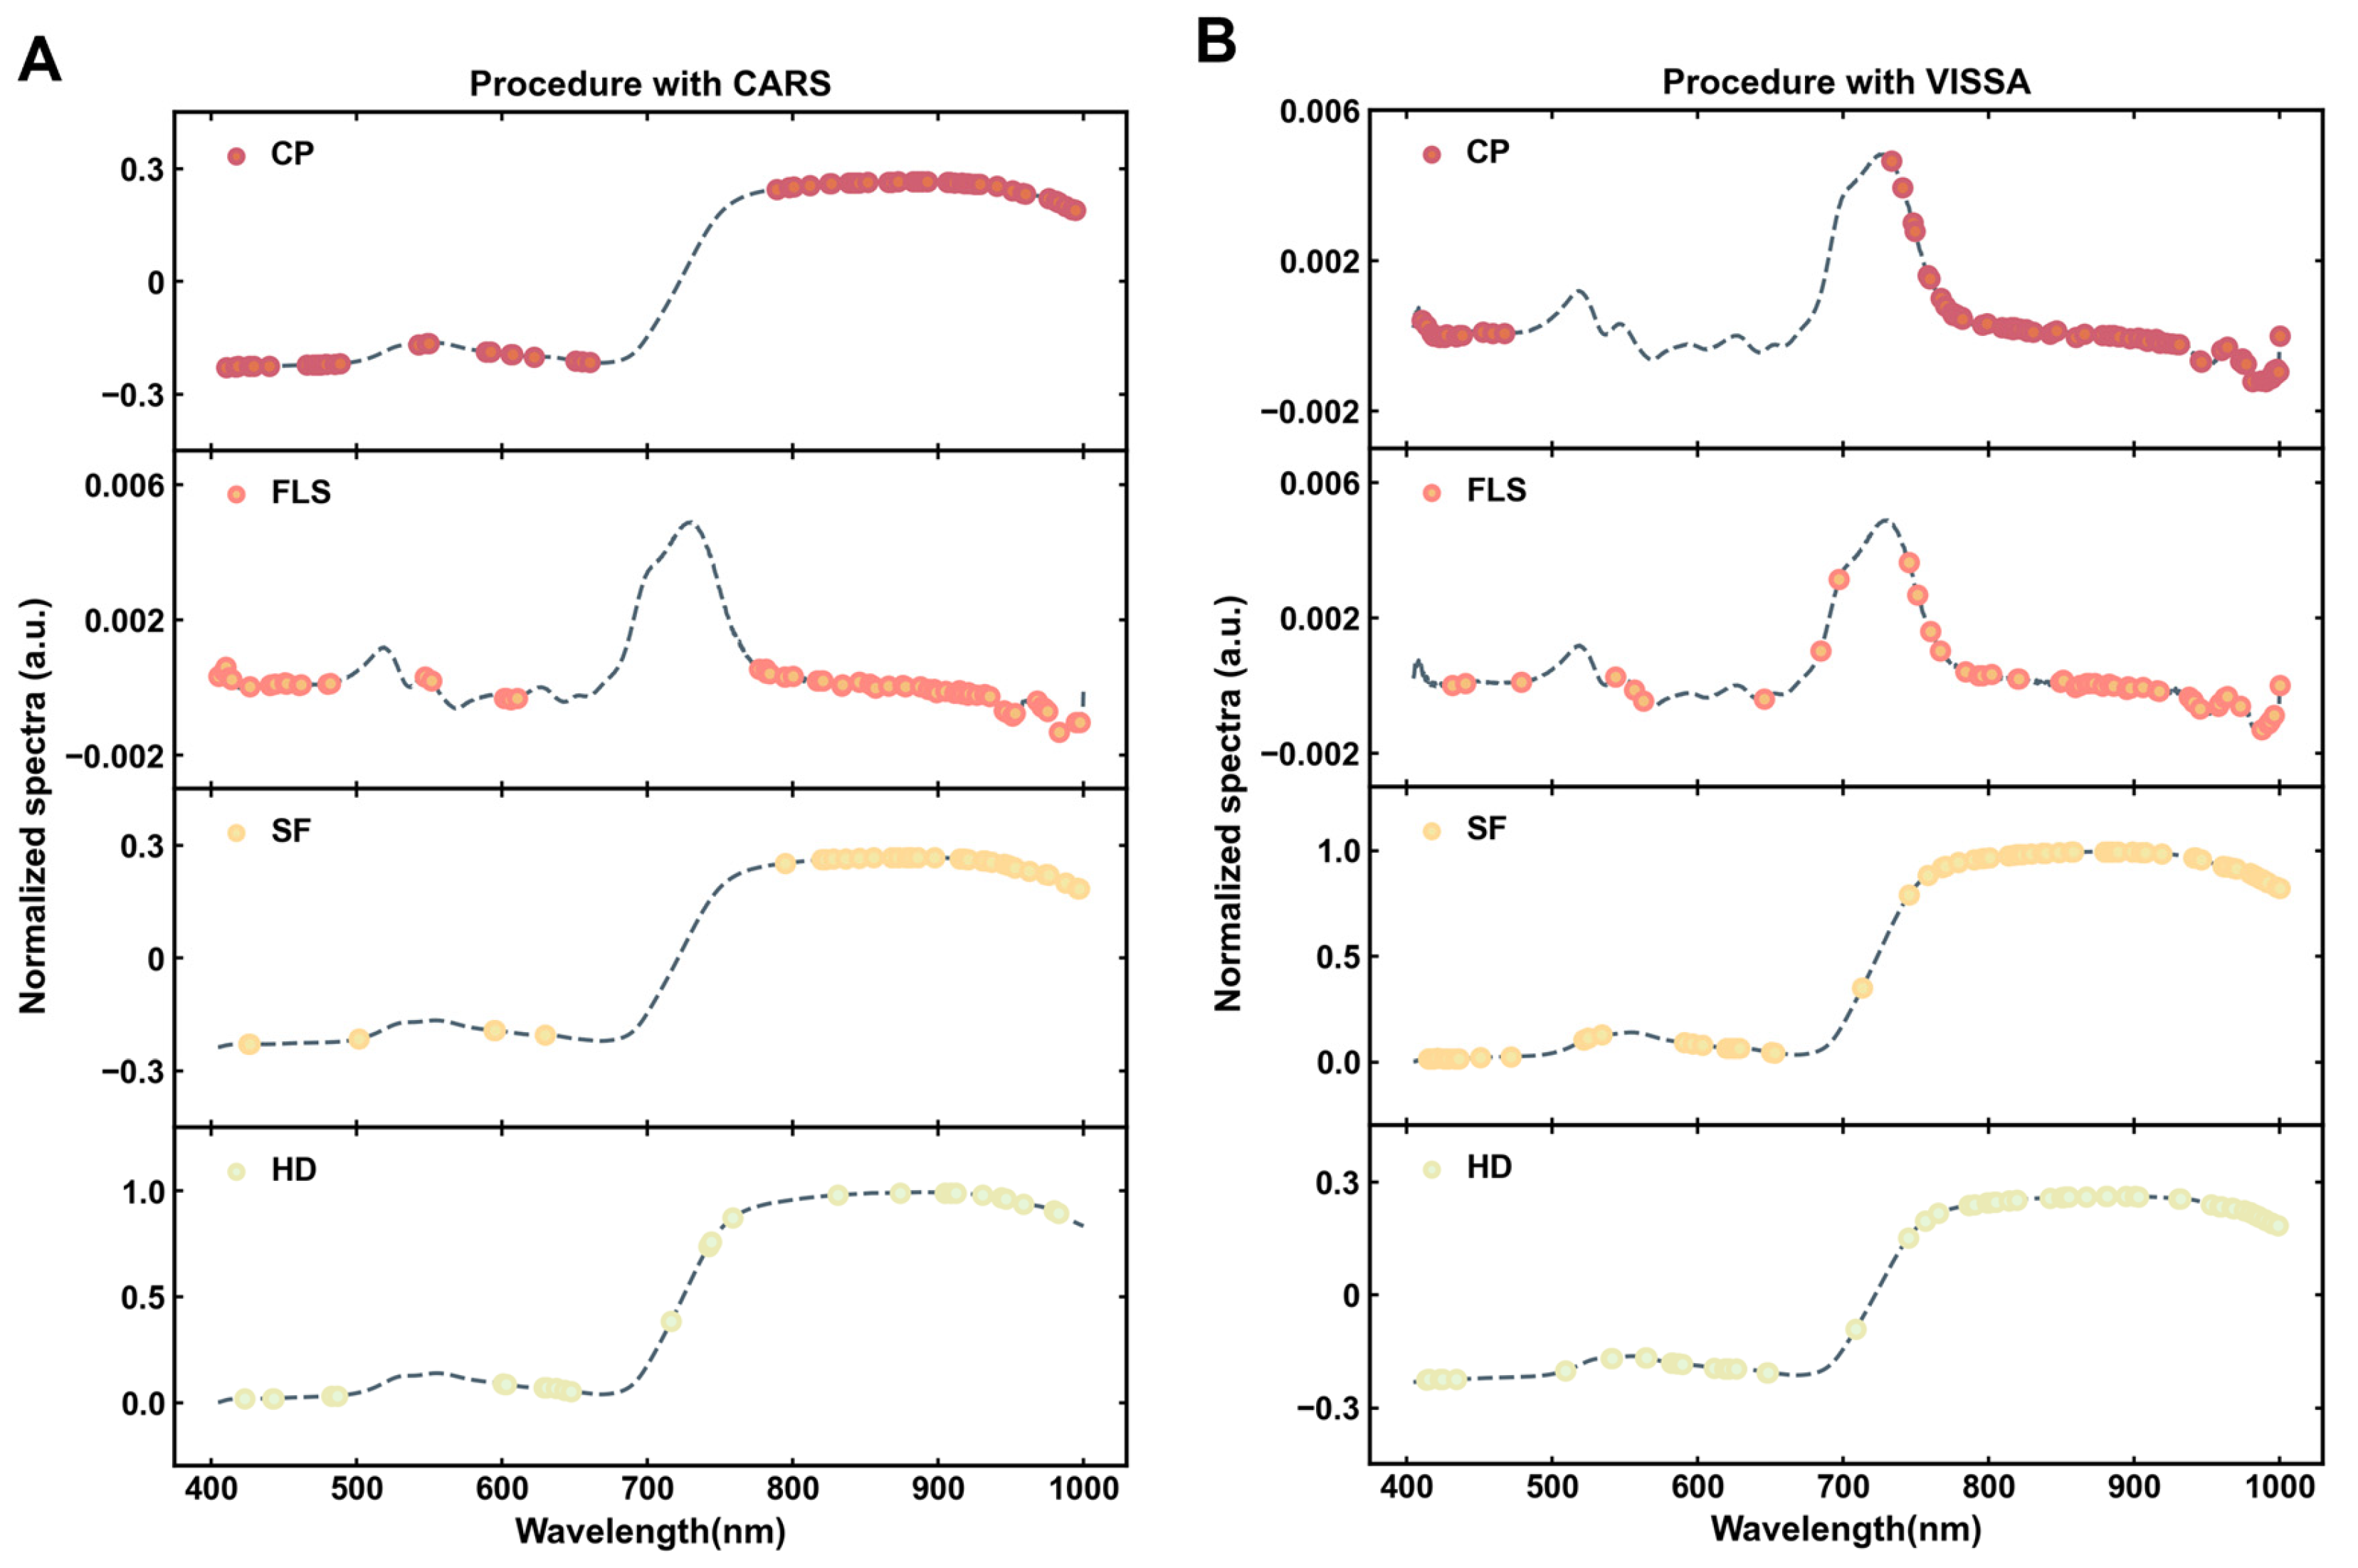
3.3. Selection of Characteristic Bands
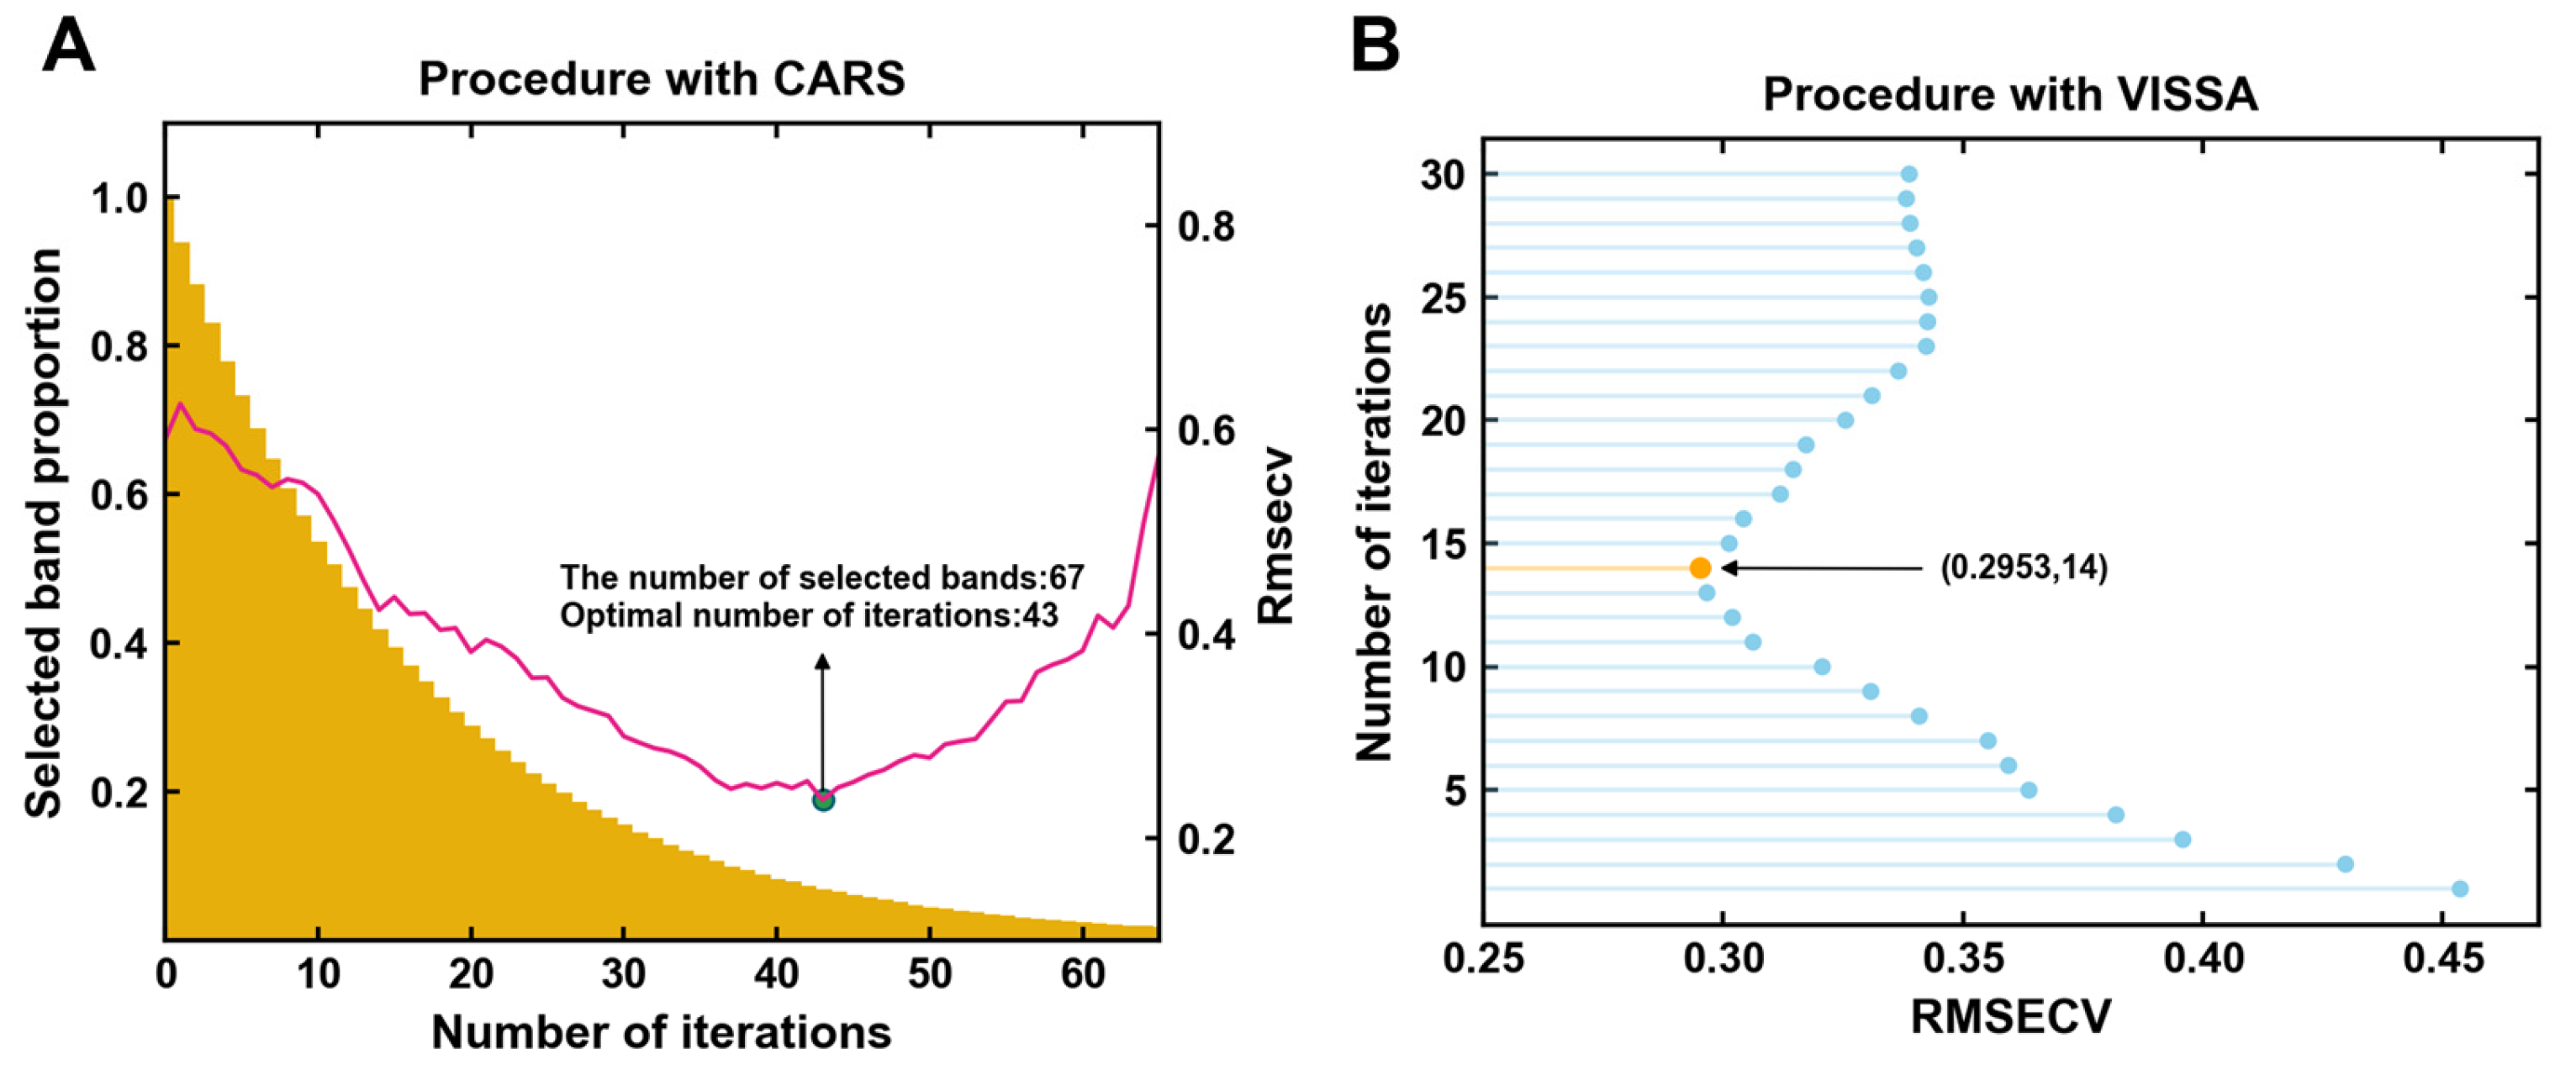
3.3.1. Characteristic Band Selection by CARS
3.3.2. Characteristic Band Selection by VISSA
3.4. Results of Regression Model Corresponding to Different Characteristic Selection Methods
3.5. Graphical Visualization of Model Results
4. Conclusions
Author Contributions
Funding
Data Availability Statement
Conflicts of Interest
References
- Li, M.-Y.; Liu, H.-Y.; Wu, D.-T.; Kenaan, A.; Geng, F.; Li, H.-B.; Gunaratne, A.; Li, H.; Gan, R.-Y. L-Theanine: A Unique Functional Amino Acid in Tea (Camellia sinensis L.) With Multiple Health Benefits and Food Applications. Front. Nutr. 2022, 9, 853846. [Google Scholar] [CrossRef] [PubMed]
- Cheng, Y.; Sun, J.; Zhao, H.; Guo, H.; Li, J. Functional Mechanism on Stem Cells by Tea (Camellia sinensis) Bioactive Compounds. Food Sci. Hum. Wellness 2022, 11, 579–586. [Google Scholar] [CrossRef]
- Ku, K.M.; Choi, J.N.; Kim, J.; Kim, J.K.; Yoo, L.G.; Lee, S.J.; Hong, Y.-S.; Lee, C.H. Metabolomics Analysis Reveals the Compositional Differences of Shade Grown Tea (Camellia sinensis L.). J. Agric. Food Chem. 2010, 58, 418–426. [Google Scholar] [CrossRef]
- Kika, J.; Jakubczyk, K.; Ligenza, A.; Maciejewska-Markiewicz, D.; Szymczykowska, K.; Janda-Milczarek, K. Matcha Green Tea: Chemical Composition, Phenolic Acids, Caffeine and Fatty Acid Profile. Foods 2024, 13, 1167. [Google Scholar] [CrossRef] [PubMed]
- Luo, Y.; Zhang, Y.; Qu, F.; Qian, W.; Wang, P.; Zhang, X.; Zhang, X.; Hu, J. Variations of Main Quality Components of Matcha from Different Regions in the Chinese Market. Front. Nutr. 2023, 10, 1153983. [Google Scholar] [CrossRef]
- Luo, Y.; Zhang, Y.; Qu, F.; Wang, P.; Gao, J.; Zhang, X.; Hu, J. Characterization of the Key Aroma Compounds of Shandong Matcha Using HS-SPME-GC/MS and SAFE-GC/MS. Foods 2022, 11, 2964. [Google Scholar] [CrossRef]
- Li, C.; Guo, H.; Zong, B.; He, P.; Fan, F.; Gong, S. Rapid and Non-Destructive Discrimination of Special-Grade Flat Green Tea Using Near-Infrared Spectroscopy. Spectrochim. Acta A. Mol. Biomol. Spectrosc. 2019, 206, 254–262. [Google Scholar] [CrossRef] [PubMed]
- Jia, W.; Liang, G.; Jiang, Z.; Wang, J. Advances in Electronic Nose Development for Application to Agricultural Products. Food Anal. Methods 2019, 12, 2226–2240. [Google Scholar] [CrossRef]
- Horie, H.; Mukai, T.; Kohata, K. Simultaneous Determination of Qualitatively Important Components in Green Tea Infusions Using Capillary Electrophoresis. J. Chromatogr. A 1997, 758, 332–335. [Google Scholar] [CrossRef]
- Kotani, A.; Takahashi, K.; Hakamata, H.; Kojima, S.; Kusu, F. Attomole Catechins Determination by Capillary Liquid Chromatography with Electrochemical Detection. Anal. Sci. 2007, 23, 157–163. [Google Scholar] [CrossRef] [PubMed][Green Version]
- Alseekh, S.; Aharoni, A.; Brotman, Y.; Contrepois, K.; D’Auria, J.; Ewald, J.; Ewald, J.C.; Fraser, P.D.; Giavalisco, P.; Hall, R.D.; et al. Mass Spectrometry-Based Metabolomics: A Guide for Annotation, Quantification and Best Reporting Practices. Nat. Methods 2021, 18, 747–756. [Google Scholar] [CrossRef]
- Wolfender, J.-L.; Nuzillard, J.-M.; Van Der Hooft, J.J.J.; Renault, J.-H.; Bertrand, S. Accelerating Metabolite Identification in Natural Product Research: Toward an Ideal Combination of Liquid Chromatography–High-Resolution Tandem Mass Spectrometry and NMR Profiling, in Silico Databases, and Chemometrics. Anal. Chem. 2019, 91, 704–742. [Google Scholar] [CrossRef] [PubMed]
- Chlingaryan, A.; Sukkarieh, S.; Whelan, B. Machine Learning Approaches for Crop Yield Prediction and Nitrogen Status Estimation in Precision Agriculture: A Review. Comput. Electron. Agric. 2018, 151, 61–69. [Google Scholar] [CrossRef]
- Tang, T.; Luo, Q.; Yang, L.; Gao, C.; Ling, C.; Wu, W. Research Review on Quality Detection of Fresh Tea Leaves Based on Spectral Technology. Foods 2024, 13, 25. [Google Scholar] [CrossRef]
- Luo, X.; Sun, C.; He, Y.; Zhu, F.; Li, X. Cross-Cultivar Prediction of Quality Indicators of Tea Based on VIS-NIR Hyperspectral Imaging. Ind. Crops Prod. 2023, 202, 117009. [Google Scholar] [CrossRef]
- Xiong, C.; Liu, C.; Pan, W.; Ma, F.; Xiong, C.; Qi, L.; Chen, F.; Lu, X.; Yang, J.; Zheng, L. Non-Destructive Determination of Total Polyphenols Content and Classification of Storage Periods of Iron Buddha Tea Using Multispectral Imaging System. Food Chem. 2015, 176, 130–136. [Google Scholar] [CrossRef]
- Firmani, P.; De Luca, S.; Bucci, R.; Marini, F.; Biancolillo, A. Near Infrared (NIR) Spectroscopy-Based Classification for the Authentication of Darjeeling Black Tea. Food Control 2019, 100, 292–299. [Google Scholar] [CrossRef]
- Ren, G.; Wang, Y.; Ning, J.; Zhang, Z. Highly Identification of Keemun Black Tea Rank Based on Cognitive Spectroscopy: Near Infrared Spectroscopy Combined with Feature Variable Selection. Spectrochim. Acta A. Mol. Biomol. Spectrosc. 2020, 230, 118079. [Google Scholar] [CrossRef] [PubMed]
- Huang, Y.; Dong, W.; Sanaeifar, A.; Wang, X.; Luo, W.; Zhan, B.; Liu, X.; Li, R.; Zhang, H.; Li, X. Development of Simple Identification Models for Four Main Catechins and Caffeine in Fresh Green Tea Leaf Based on Visible and Near-Infrared Spectroscopy. Comput. Electron. Agric. 2020, 173, 105388. [Google Scholar] [CrossRef]
- Wang, J.; Zareef, M.; He, P.; Sun, H.; Chen, Q.; Li, H.; Ouyang, Q.; Guo, Z.; Zhang, Z.; Xu, D. Evaluation of Matcha Tea Quality Index Using Portable NIR Spectroscopy Coupled with Chemometric Algorithms. J. Sci. Food Agric. 2019, 99, 5019–5027. [Google Scholar] [CrossRef]
- Guo, Z.; Barimah, A.O.; Shujat, A.; Zhang, Z.; Ouyang, Q.; Shi, J.; El-Seedi, H.R.; Zou, X.; Chen, Q. Simultaneous Quantification of Active Constituents and Antioxidant Capability of Green Tea Using NIR Spectroscopy Coupled with Swarm Intelligence Algorithm. LWT 2020, 129, 109510. [Google Scholar] [CrossRef]
- Zhao, F.; Wu, W.; Wang, C.; Wang, X.; Liu, H.; Qian, J.; Cai, C.; Xie, Y.; Lin, Y. Dynamic Change of Oligopeptides and Free Amino Acids Composition in Five Types of Tea with Different Fermentation Degree Processed from the Same Batch of Fresh Tea (Camelilia sinensis L.) Leaves. Food Chem. 2023, 404, 134608. [Google Scholar] [CrossRef] [PubMed]
- Lisha, R.a.N.; Baogui, L.I.U.; Chongjun, C.; Qian, T.; Zhang, Z.; Mingzhi, Z.H.U.; Donghe, F.U.; Kunbo, W. Isolation and Identification of “Golden Flower” Fungus and Determination of Its Effects on Chemical the Composition of Fu Tea. J. Radiat. Res. Radiat. Process. 2023, 39, 92–99. [Google Scholar] [CrossRef]
- Li, H.; Liang, Y.; Xu, Q.; Cao, D. Key Wavelengths Screening Using Competitive Adaptive Reweighted Sampling Method for Multivariate Calibration. Anal. Chim. Acta 2009, 648, 77–84. [Google Scholar] [CrossRef] [PubMed]
- Li, Y.; Yang, X. Quantitative Analysis of near Infrared Spectroscopic Data Based on Dual-Band Transformation and Competitive Adaptive Reweighted Sampling. Spectrochim. Acta A. Mol. Biomol. Spectrosc. 2023, 285, 121924. [Google Scholar] [CrossRef]
- Mahanty, B. Alternate Deflation and Inflation of Search Space in Reweighted Sampling: An Effective Variable Selection Approach for PLS Model. Chemom. Intell. Lab. Syst. 2018, 174, 45–55. [Google Scholar] [CrossRef]
- Deng, B.; Yun, Y.; Liang, Y.; Yi, L. A Novel Variable Selection Approach That Iteratively Optimizes Variable Space Using Weighted Binary Matrix Sampling. Analyst 2014, 139, 4836–4845. [Google Scholar] [CrossRef] [PubMed]
- Galvão, R.K.H.; Araujo, M.C.U.; José, G.E.; Pontes, M.J.C.; Silva, E.C.; Saldanha, T.C.B. A Method for Calibration and Validation Subset Partitioning. Talanta 2005, 67, 736–740. [Google Scholar] [CrossRef] [PubMed]
- Chen, W.-R.; Yun, Y.-H.; Wen, M.; Lu, H.-M.; Zhang, Z.-M.; Liang, Y.-Z. Representative Subset Selection and Outlier Detection via Isolation Forest. Anal. Methods 2016, 8, 7225–7231. [Google Scholar] [CrossRef]
- Mahesh, S.; Jayas, D.S.; Paliwal, J.; White, N.D.G. Comparison of Partial Least Squares Regression (PLSR) and Principal Components Regression (PCR) Methods for Protein and Hardness Predictions Using the Near-Infrared (NIR) Hyperspectral Images of Bulk Samples of Canadian Wheat. Food Bioprocess Technol. 2015, 8, 31–40. [Google Scholar] [CrossRef]
- Cheng, J.-H.; Sun, D.-W. Partial Least Squares Regression (PLSR) Applied to NIR and HSI Spectral Data Modeling to Predict Chemical Properties of Fish Muscle. Food Eng. Rev. 2017, 9, 36–49. [Google Scholar] [CrossRef]
- Meacham-Hensold, K.; Montes, C.M.; Wu, J.; Guan, K.; Fu, P.; Ainsworth, E.A.; Pederson, T.; Moore, C.E.; Brown, K.L.; Raines, C.; et al. High-Throughput Field Phenotyping Using Hyperspectral Reflectance and Partial Least Squares Regression (PLSR) Reveals Genetic Modifications to Photosynthetic Capacity. Remote Sens. Environ. 2019, 231, 111176. [Google Scholar] [CrossRef]
- Lumumba, V.; Sang, D.; Mpaine, M.; Makena, N.; Musyimi, D. Kavita Comparative Analysis of Cross-Validation Techniques: LOOCV, K-Folds Cross-Validation, and Repeated K-Folds Cross-Validation in Machine Learning Models. Am. J. Theor. Appl. Stat. 2024, 13, 127–137. [Google Scholar] [CrossRef]
- Ye, Y.-F.; Shao, Y.-H.; Deng, N.-Y.; Li, C.-N.; Hua, X.-Y. Robust Lp-Norm Least Squares Support Vector Regression with Feature Selection. Appl. Math. Comput. 2017, 305, 32–52. [Google Scholar] [CrossRef]
- Li, Y.; Shao, X.; Cai, W. A Consensus Least Squares Support Vector Regression (LS-SVR) for Analysis of near-Infrared Spectra of Plant Samples. Talanta 2007, 72, 217–222. [Google Scholar] [CrossRef]
- Ali, Y.A.; Awwad, E.M.; Al-Razgan, M.; Maarouf, A. Hyperparameter Search for Machine Learning Algorithms for Optimizing the Computational Complexity. Processes 2023, 11, 349. [Google Scholar] [CrossRef]
- Açikkar, M. Fast Grid Search: A Grid Search-Inspired Algorithm for Optimizing Hyperparameters of Support Vector Regression. Turk. J. Electr. Eng. Comput. Sci. 2024, 3, 68–79. [Google Scholar] [CrossRef]
- Wang, Q.; Zhang, H.; Li, F.; Gu, C.; Qiao, Y.; Huang, S. Assessment of Calibration Methods for Nitrogen Estimation in Wet and Dry Soil Samples with Different Wavelength Ranges Using Near-Infrared Spectroscopy. Comput. Electron. Agric. 2021, 186, 106181. [Google Scholar] [CrossRef]
- Hu, Y.; Sun, J.; Zhan, C.; Huang, P.; Kang, Z. Identification and Quantification of Adulterated Tieguanyin Based on the Fluorescence Hyperspectral Image Technique. J. Food Compos. Anal. 2023, 120, 105343. [Google Scholar] [CrossRef]
- Hu, Y.; Huang, P.; Wang, Y.; Sun, J.; Wu, Y.; Kang, Z. Determination of Tibetan Tea Quality by Hyperspectral Imaging Technology and Multivariate Analysis. J. Food Compos. Anal. 2023, 117, 105136. [Google Scholar] [CrossRef]
- Liu, Z.; Xie, H.; Chen, L.; Huang, J. An Improved Weighted Partial Least Squares Method Coupled with Near Infrared Spectroscopy for Rapid Determination of Multiple Components and Anti-Oxidant Activity of Pu-Erh Tea. Molecules 2018, 23, 1058. [Google Scholar] [CrossRef]
- Liu, L.; Zareef, M.; Wang, Z.; Li, H.; Chen, Q.; Ouyang, Q. Monitoring Chlorophyll Changes during Tencha Processing Using Portable Near-Infrared Spectroscopy. Food Chem. 2023, 412, 135505. [Google Scholar] [CrossRef] [PubMed]
- Mehmood, T.; Liland, K.H.; Snipen, L.; Sæbø, S. A Review of Variable Selection Methods in Partial Least Squares Regression. Chemom. Intell. Lab. Syst. 2012, 118, 62–69. [Google Scholar] [CrossRef]


| Prediction Model | Pretreatment | Calibration Set | Prediction Set | RPD | ||
|---|---|---|---|---|---|---|
| RMSEC | RMSEP | |||||
| CP | MSC | 0.7403 | 0.5453 | 0.7572 | 0.6903 | 2.0297 |
| CT | 0.8515 | 0.4376 | 0.8078 | 0.5042 | 2.2813 | |
| D1 | 0.9691 | 0.1880 | 0.7843 | 0.6506 | 2.1534 | |
| SG | 0.9188 | 0.3048 | 0.7634 | 0.6815 | 2.0558 | |
| FLS | MSC | 0.8899 | 0.3549 | 0.7603 | 0.6859 | 2.0428 |
| CT | 0.7453 | 0.5401 | 0.7779 | 0.6602 | 2.1221 | |
| D1 | 0.9739 | 0.1834 | 0.7923 | 0.5242 | 2.1942 | |
| SG | 0.8488 | 0.4160 | 0.7463 | 0.7056 | 1.9855 | |
| ST | MSC | 0.9007 | 0.3372 | 0.7315 | 0.7260 | 1.9299 |
| CT | 0.8816 | 0.3907 | 0.7821 | 0.5369 | 2.1423 | |
| D1 | 0.9262 | 0.2907 | 0.7498 | 0.7006 | 1.9999 | |
| SG | 0.8878 | 0.3804 | 0.6982 | 0.6319 | 1.8204 | |
| HD | MSC | 0.8687 | 0.4114 | 0.7674 | 0.5547 | 2.0738 |
| CT | 0.9007 | 0.3372 | 0.7315 | 0.7260 | 1.9299 | |
| D1 | 0.9067 | 0.3268 | 0.7133 | 0.7501 | 1.8678 | |
| SG | 0.9083 | 0.3239 | 0.7462 | 0.7057 | 1.9855 | |
| Prediction Model | Pretreatment | Calibration Set | Prediction Set | RPD | ||
|---|---|---|---|---|---|---|
| RMSEC | RMSEP | |||||
| CP | MSC | 0.8042 | 0.4735 | 0.7700 | 0.6719 | 2.0853 |
| CT | 0.8444 | 0.4409 | 0.7786 | 0.5631 | 2.1252 | |
| D1 | 0.8559 | 0.4244 | 0.7882 | 0.5507 | 2.1733 | |
| SG | 0.9576 | 0.1901 | 0.7036 | 0.4530 | 1.8368 | |
| FLS | MSC | 0.8947 | 0.3626 | 0.7187 | 0.6347 | 1.8856 |
| CT | 0.8367 | 0.4588 | 0.7240 | 0.6043 | 1.9036 | |
| D1 | 0.9419 | 0.2692 | 0.7685 | 0.5757 | 2.0785 | |
| SG | 0.8142 | 0.4894 | 0.6899 | 0.6405 | 1.7958 | |
| ST | MSC | 0.9759 | 0.1312 | 0.7258 | 0.5309 | 1.9097 |
| CT | 0.7880 | 0.4927 | 0.7008 | 0.7663 | 1.8282 | |
| D1 | 0.9067 | 0.3268 | 0.7133 | 0.7501 | 1.8678 | |
| SG | 0.9027 | 0.3337 | 0.6721 | 0.8022 | 1.7465 | |
| HD | MSC | 0.8878 | 0.3804 | 0.6982 | 0.6319 | 1.8204 |
| CT | 0.8367 | 0.4588 | 0.7240 | 0.6043 | 1.9036 | |
| D1 | 0.8809 | 0.3691 | 0.7164 | 0.7461 | 1.8778 | |
| SG | 0.7038 | 0.5824 | 0.7116 | 0.7523 | 1.8623 | |
| Models | The Type of Process | Calibration Set | Prediction Set | RPD | ||
|---|---|---|---|---|---|---|
| RMSEC | RMSEP | |||||
| PLS | CP | 0.9885 | 0.0956 | 0.9566 | 0.1749 | 4.8021 |
| FLS | 0.9849 | 0.1179 | 0.9278 | 0.1875 | 3.7236 | |
| SF | 0.9898 | 0.1334 | 0.8837 | 0.4986 | 2.9326 | |
| HD | 0.9792 | 0.1386 | 0.8982 | 0.2228 | 3.1344 | |
| LSSVM | CP | 0.9855 | 0.1112 | 0.8571 | 0.3145 | 2.6456 |
| FLS | 0.9581 | 0.1871 | 0.8512 | 0.3373 | 2.5926 | |
| SF | 0.9699 | 0.1584 | 0.8343 | 0.3559 | 2.4571 | |
| HD | 0.9831 | 0.1248 | 0.8124 | 0.3037 | 2.3046 | |
| Models | The Type of Process | Calibration Set | Prediction Set | RPD | ||
|---|---|---|---|---|---|---|
| RMSEC | RMSEP | |||||
| PLS | CP | 0.9343 | 0.2355 | 0.8302 | 0.5772 | 2.4273 |
| FLS | 0.9264 | 0.2480 | 0.8257 | 0.3651 | 2.3953 | |
| SF | 0.9829 | 0.1195 | 0.8112 | 0.3801 | 2.3012 | |
| HD | 0.9706 | 0.1566 | 0.7874 | 0.4032 | 2.1690 | |
| LSSVM | CP | 0.9856 | 0.1150 | 0.9304 | 0.1841 | 3.7924 |
| FLS | 0.9797 | 0.1316 | 0.8873 | 0.2793 | 2.9793 | |
| SF | 0.9675 | 0.1667 | 0.8412 | 0.3316 | 2.5096 | |
| HD | 0.9873 | 0.1042 | 0.8366 | 0.3364 | 2.4739 | |
Disclaimer/Publisher’s Note: The statements, opinions and data contained in all publications are solely those of the individual author(s) and contributor(s) and not of MDPI and/or the editor(s). MDPI and/or the editor(s) disclaim responsibility for any injury to people or property resulting from any ideas, methods, instructions or products referred to in the content. |
© 2024 by the authors. Licensee MDPI, Basel, Switzerland. This article is an open access article distributed under the terms and conditions of the Creative Commons Attribution (CC BY) license (https://creativecommons.org/licenses/by/4.0/).
Share and Cite
He, Q.; Guo, Y.; Li, X.; He, Y.; Lin, Z.; Zeng, H. Spectral Fingerprinting of Tencha Processing: Optimising the Detection of Total Free Amino Acid Content in Processing Lines by Hyperspectral Analysis. Foods 2024, 13, 3862. https://doi.org/10.3390/foods13233862
He Q, Guo Y, Li X, He Y, Lin Z, Zeng H. Spectral Fingerprinting of Tencha Processing: Optimising the Detection of Total Free Amino Acid Content in Processing Lines by Hyperspectral Analysis. Foods. 2024; 13(23):3862. https://doi.org/10.3390/foods13233862
Chicago/Turabian StyleHe, Qinghai, Yihang Guo, Xiaoli Li, Yong He, Zhi Lin, and Hui Zeng. 2024. "Spectral Fingerprinting of Tencha Processing: Optimising the Detection of Total Free Amino Acid Content in Processing Lines by Hyperspectral Analysis" Foods 13, no. 23: 3862. https://doi.org/10.3390/foods13233862
APA StyleHe, Q., Guo, Y., Li, X., He, Y., Lin, Z., & Zeng, H. (2024). Spectral Fingerprinting of Tencha Processing: Optimising the Detection of Total Free Amino Acid Content in Processing Lines by Hyperspectral Analysis. Foods, 13(23), 3862. https://doi.org/10.3390/foods13233862


