Article

Mathematical Modeling of Goat Meat Drying Kinetics with Thermal Oscillations

by
Valeria Carrillo Luis
1,
Diego Beristain Rios
1,
Omar Augusto Hernández-Flores
1,
Carolina Romero-Salazar
1 and
Sadoth Sandoval-Torres
2,*
1
Facultad de Sistemas Biológicos e Innovación Tecnológica, Universidad Autónoma Benito Juárez de Oaxaca, Av. Universidad s/n, Col. Cinco Señores, Oaxaca de Juárez 68120, Oaxaca, Mexico
2
Instituto Politécnico Nacional, CIIDIR-Unidad Oaxaca, Hornos No. 1003, Col. Noche Buena, Santa Cruz Xoxocotlán 71230, Oaxaca, Mexico
*
Author to whom correspondence should be addressed.
Foods 2024, 13(23), 3836; https://doi.org/10.3390/foods13233836
Submission received: 17 October 2024 / Revised: 16 November 2024 / Accepted: 19 November 2024 / Published: 28 November 2024

Abstract

:
Goat meat has a high nutritional value, since it contains up to 29% protein, as well as iron, potassium and vitamin B12. To prolong the shelf life of this food, a drying process can be applied; however, there is scarce information on the kinetics and drying parameters for this food material. The objective of this work was to characterize the thermal drying process of goat meat, through the mathematical modeling of convective drying kinetics, and its validation with experimental data obtained in a drying tunnel. The experiments were carried out with samples of loin (Longissumus dorsi) of Boer goat meat from the Mixteca region of Oaxaca (Mexico). Meat samples were subjected to air convection drying at 40, 50, 60 and 70 °C (with temperature oscillation), with air velocities of 1 and 2 m/s. Drying kinetics, air and meat temperature profiles, relative humidity and air flow velocity were recorded. Four models were analyzed: two-term, Midilli’s model, Wang and Singh’s model and a heuristic model with temperature dependence. The proposed mathematical models represented drying kinetics with an accurate fitting of experimental data, with standard errors (RMSE) in the range of 0.004–0.029. The estimated diffusion coefficients are consistent with the transport properties in biomaterials. The heuristic model was based on the solution of the effective diffusion equation considering the linearization of the temperature-dependent diffusion coefficient, showing a standard error in the range of 0.007–0.028, satisfactorily representing the temperature oscillations that allows a moisture diffusion reorganization, mainly when drastic temperature changes occur.

1. Introduction

The characterization and modelling of the convective drying of goat meat is important for the system design, quality improvement and optimization of drying processes [1]; nevertheless, there is scarce published work on this topic. Hot-air drying is a widely used drying technique for biological materials; however, in food drying, it is desirable that the process is promoted at low product temperatures in order to obtain better quality products [2,3,4]. According to Mediani et al., the consumption of dried meat is attractive for its nutritional value and quality [5]. The authors analyzed different types of dried meat and drying techniques, such as vacuum drying, ultrasound-assisted vacuum drying and freeze-drying. They also present an extensive description and comparison of physicochemical, microbiological and biochemical characteristics. Álvarez et al. mention that there is currently a wide variety of dried meat obtained from poultry, beef, pork, camel, sheep and goat [2]. Meat drying is often combined with other techniques such as smoking or fermentation, the use of brine, herbs, spices or vinegar, and depending on the culture and geographical region, the final product is known by different names such as Pastirma, Charki, Jerky, Cecina, Kilishi, Biltong, Carne-do-sol or Kaddid. However, because the nutrients in meat are sensitive to heat, a proper drying process is required to achieve a balance between drying temperature and quality. Therefore, to control and optimize the drying process, it is important to analyze the drying kinetics. In the work of Ahmat et al., the drying of meat of Goudali Zebu (4–5-year-old) was studied [6]. The round part of the hindquarters of the animal, without post-mortem treatment, was used. The authors applied three drying temperatures (10, 50, 60 °C)with three air flow rates (1, 2 and 3 m/s) and observed that temperature has a great impact on drying kinetics. They concluded that the Drying Characteristic Curve method and the Midilli’s model were the best to predict the drying curves. Morales-Cruz et al. conducted a study on the solar drying of goat meat. In the dryer, the air temperature was recorded, observing a variation from 35 to 51 °C [7]. Samples with a thickness between 3 and 5 mm were dehydrated. The results showed that the drying rate was not constant because the solar dehydrator is highly dependent on ambient conditions. To produce “Kaddid”, beef samples were subjected to an osmotic dehydration process prior to hot-air convection drying [8]. Kaddid is a product produced by a traditional process, where beef or lamb meat is cut into long pieces and salted in brine or dry salted. Meat fillets were obtained, with an approximate size of 5 cm × 2 cm × 0.5 cm, three temperatures were applied, 30, 40 and 50 °C and two air velocities (1.5 and 2.5 m/s). The authors found that pre-treatment at higher brine concentration slows down the drying kinetics. The drying rate was affected by brine concentration, air temperature and, to a lesser extent, by air velocity. Aykın-Dinçer et al. applied a vacuum drying process on beef slices [9]. The authors highlight that meat facilitates the growth of microorganisms due to its moisture content and water activity, hence the importance of removing moisture content to sufficiently low levels. Fat and visible connective tissue were removed, and the meat was cut into slices of 100 × 40 × 2 mm, parallel to the direction of the fiber. The slices were dried at 60, 70 and 80 °C to reach a final moisture content of 5%. The authors found that the hot-air-dried beef samples were significantly darker than the vacuum-dried ones. The study demonstrated that a dehydrated beef snack can be produced by applying vacuum drying in a temperature range of 60–80 °C. Mewa et al. studied the effect of drying air temperature and sample thickness on microbial quality and stability in beef [10]. Excess fat was removed to avoid rancidity during drying. The meat was cut in the direction of its fibers into thin strips of 100 mm length, 30 mm width and thicknesses of 2.5, 5.0, 7.5 and 10 mm. Four air temperatures were applied: 30, 40, 50 and 60 °C and airflow generated by a fan which was set at a constant voltage of 24 V. The experimental results showed that the drying temperature increased the value of the hue/H* colour parameter and decreased the value of the parameter L*, which may be associated with changes in the protein structure of the meat. The highest rehydration rate was observed in samples dried at 60 °C. The firmness of the meat showed non-monotonic behavior with respect to the drying temperature, with the meat with the lowest thickness being the one that showed the greatest softness. Kamiloğlu et al. conducted a comparative study between convection and microwave drying techniques for beef [11]. The meat samples were prepared in dimensions of 5 × 5 × 0.5 cm. For convective drying, three air temperatures (60, 70 and 80 °C) were applied; for microwave drying, three different powers (487, 686 and 889 W) were applied. Analyzing the drying kinetics, it was found that the drying time with microwaves was shorter. The effective diffusion coefficients and the activation energy were calculated for each kinetic. In the case of microwave drying, the effective diffusion coefficient was two orders of magnitude higher than that obtained for convective drying. Drãghici studied the effect of salting and acidification on the moisture content of dehydrated goat meat in a thermobalance at T = 103 °C [12]. The author used samples of 3 mm, which were mixed with distilled water (control sample), with brine and with lactic acid. The author evaluated different mathematical models for drying and found that the ‘Wang and Singh’ model best described the exponential variation in the moisture rate for all samples. Álvarez et al. studied the effect of beef sample geometry on drying dynamics [13]. They correlated moisture content, water activity, amount and type of moisture (bound, trapped and free) in different sections of the meat. The authors compared seven thin-layer models and used an exponential decay model with a constant phase. They determined the Midilli’s model was the most appropriate model to describe the drying during the ripening process. By lowering the moisture content, a reduction in microbial growth is accomplished. The reduced surface moisture plays a crucial role in preventing not only the growth of surviving bacteria but also the growth of any bacteria that may contaminate the surface of the product. The decrease in water activity inhibits the growth of contaminating microorganisms [14]. When controlling and optimizing a drying process, it is important to understand the drying kinetics, which describe the drying rate at specific conditions. According to Álvarez et al., a particular area of research in this field is mathematical modelling. Fitting a mathematical model capable of reproducing the drying kinetics is a powerful tool to understand and predict how drying conditions can impact moisture loss [2]. On the one hand, an air flow of 1 m/s would be a condition in which external resistances would be observed, so it is likely that the period of constant drying rate would be observed; on the other hand, an airflow of 2 m/s (or beyond) is typically used for meat drying, and in this case, internal resistances will be present. The four temperature levels were selected from the literature review, as they are temperatures that would prevent protein degradation [14].
In the present work, for the first time, the drying kinetics of Boer goat meat are presented. The drying parameters applying thermal oscillations were recorded. Four temperatures 40, 50, 60 and 70 °C and two air velocities 1 and 2 m/s were applied. The aim of the oscillations was to avoid excessive hardening of the meat. The aims of this study are as follows: (i) Obtaining hot-air-drying kinetics over a range of feasible conditions for goat meat, (ii) Measuring the temperature evolution of samples with air temperature oscillation, (iii) Identifying the magnitude of the drying rate and (iv) Implementing and solving the mathematical thin-layer models and a heuristic model for predicting the drying curves of goat meat.

2. Materials and Methods

2.1. Meat Samples and Preparation

Meat was obtained from the loin of a 3-year-old Boer goat (Longissumus dorsi) from the municipality of Coixtlahuaca in the Mixteca region (Oaxaca, México). The loin was frozen to facilitate slicing. Slices of meat were obtained, and the direction of cutting was parallel to the direction of the fibers. The slices were placed in plastic vacuum bags and stored in a freezer at a temperature of −17 °C. The thickness of the slices was 3–5 mm, while the length and width were 12 cm long and 4 cm, respectively.

2.2. Drying

A cross-flow tunnel-type tray dryer (The Instituto Politécnico Nacional, Mexico City, Mexico) with patent number 304,462 was used. The dryer allowed temperature control by means of the myRIO-1900 card (National Instruments, Austin, TX, USA). Four central drying temperatures Tc = 40, 50, 60, 70 °C and two air flow rates v = 1 m/s and v = 2 m/s were applied. Temperature oscillations were applied to allow the conditioning and reorganization of moisture diffusion. Before drying, the samples were placed in a refrigerator at a temperature of −4 °C. The meat samples were removed from their bags to be individually weighed and then placed on plastic nets in different trays. Three samples were placed on the first tray and four samples on the second tray. An Extech AN340 Anemometer (Nashua, NH, USA) was used to record the air velocity. Relative humidity measurement and TAir temperature were recorded by a Vaisala HM70 (Helsinki, Finland) portable humidity and temperature meter. The surface and interior temperature of the meat samples were recorded using a Vaisala Veriteq 1700 data logger (Helsinki, Finland). Figure 1 shows the meat cuts and the drying tunnel.

2.3. Drying Kinetics

The moisture content M on a dry basis was obtained with the following expression:
M t = m m t m s = m t m s m s ,
where m is the total mass (wet matter), mm is the moisture mass and ms is the dry mass. The oven method (OAOC standard) was used to determine the initial moisture content. A Denver TP-214 analytical balance (accuracy 0.001 g) was used. The drying rate was calculated using regularized numerical differentiation [15].

2.4. Diffusion Coefficient

Usually, the diffusion coefficient is determined by a linear fit of the experimental MR moisture rate [16]; the slope of the fit line is related to the effective diffusion coefficient through Equation (2):
ln MR = ln 8 π 2 D π L 2 t ,
which is obtained by linearizing the first term of the general solution of the diffusion equation for an infinite plate of thickness L. The effective diffusion coefficient was estimated using the M1 (two-term) model; assuming the ratio of the fitting parameters satisfies the condition k1/k2a0/a1 = 1/9, it is found that k1 = D(π/L)2. In the case of the temperature-dependent model, the effective diffusion coefficient was determined directly from the fitting parameters.

2.5. Activation Energy

The effective diffusion coefficient can be expressed as an Arrhenius-type equation [11,16,17] in which the exponential decay is affected by the activation energy EA:
D θ = D A exp E A k B θ
where θ is the temperature in Kelvin, kB is the Boltzmann constant, DA is the effective diffusion for θθA = EA/kB. Note that θ = TS + 273 here TS is the temperature of the sample in degree Celsius. The activation energy and DA were obtained by linearizing Equation (4):
ln D θ D 0 = ln D A D 0 E A k B θ
For convenience, D0 is a constant of the same order of magnitude as the diffusion. The slope and the ordinate to the origin of the best fit line determine the values of EA and DA. For the case of the temperature-dependent model, the above parameters were obtained directly from the fitting process.

2.6. Mathematical Models

The mathematical models studied in this work are described in Table 1. The first three (M1, M2, M3) models are derived from approximations of the diffusion equation, Newton’s cooling law and polynomial regression, respectively. From the solution of the diffusion equation in the case of an infinite sample of thickness L [18], the model Heuristic + R1 (M4) is proposed, while the model Heuristic + R1 + θ (M5) is an extension of model M4 incorporating a temperature dependence. The models M1–M4 are isothermal approximations, thus a model that includes the effect of temperature is desirable. Juma Haydary and Noori, introduce a model sensitive to changes in the drying variables, i.e., to air temperature, air velocity, relative humidity and sample thickness, showing a good agreement with their experimental measurements of hot-air convective drying [19]. Their semi-empirical approach consists of modifying the solution of Newton’s cooling equation by incorporating dependent functions of the drying variables in the exponential decay. They assume that the sample is in thermal equilibrium with the air. Model M5 incorporates the average sample temperature TS, meaning that temperature controls the effective diffusion of moisture.
For comparison with experimental data, the reduced moisture content [29] is defined by Equation (5):
MR = M t M f M 0 M f
where M(t) is the moisture content at time t, M0 and Mf are the initial and final moisture content, respectively. For long periods of drying, the moisture Mf becomes the equilibrium moisture content Me. The fitting parameters of the models were found using the regression technique for non-linear models [30,31] using the Curve Fitting Toolbox in MATLAB.
In this paper, we introduce a heuristic model. A temperature-dependent moisture ratio MR was proposed. This model is based on the solution of the one-dimensional diffusion equation for infinite plate of thickness L and is described by Equation (6):
MR = 8 π 2 exp R 3 f θ t + 1 9 exp 9 R 3 f θ t + R 2 R 1 t
where R2 = 0.1226, R1, R3 and f(θ) are defined by Equations (15), (19) and (20).

3. Results and Discussion

3.1. Convective Drying Kinetics Experiments

3.1.1. Experiments at v = 1 m/s Airflow

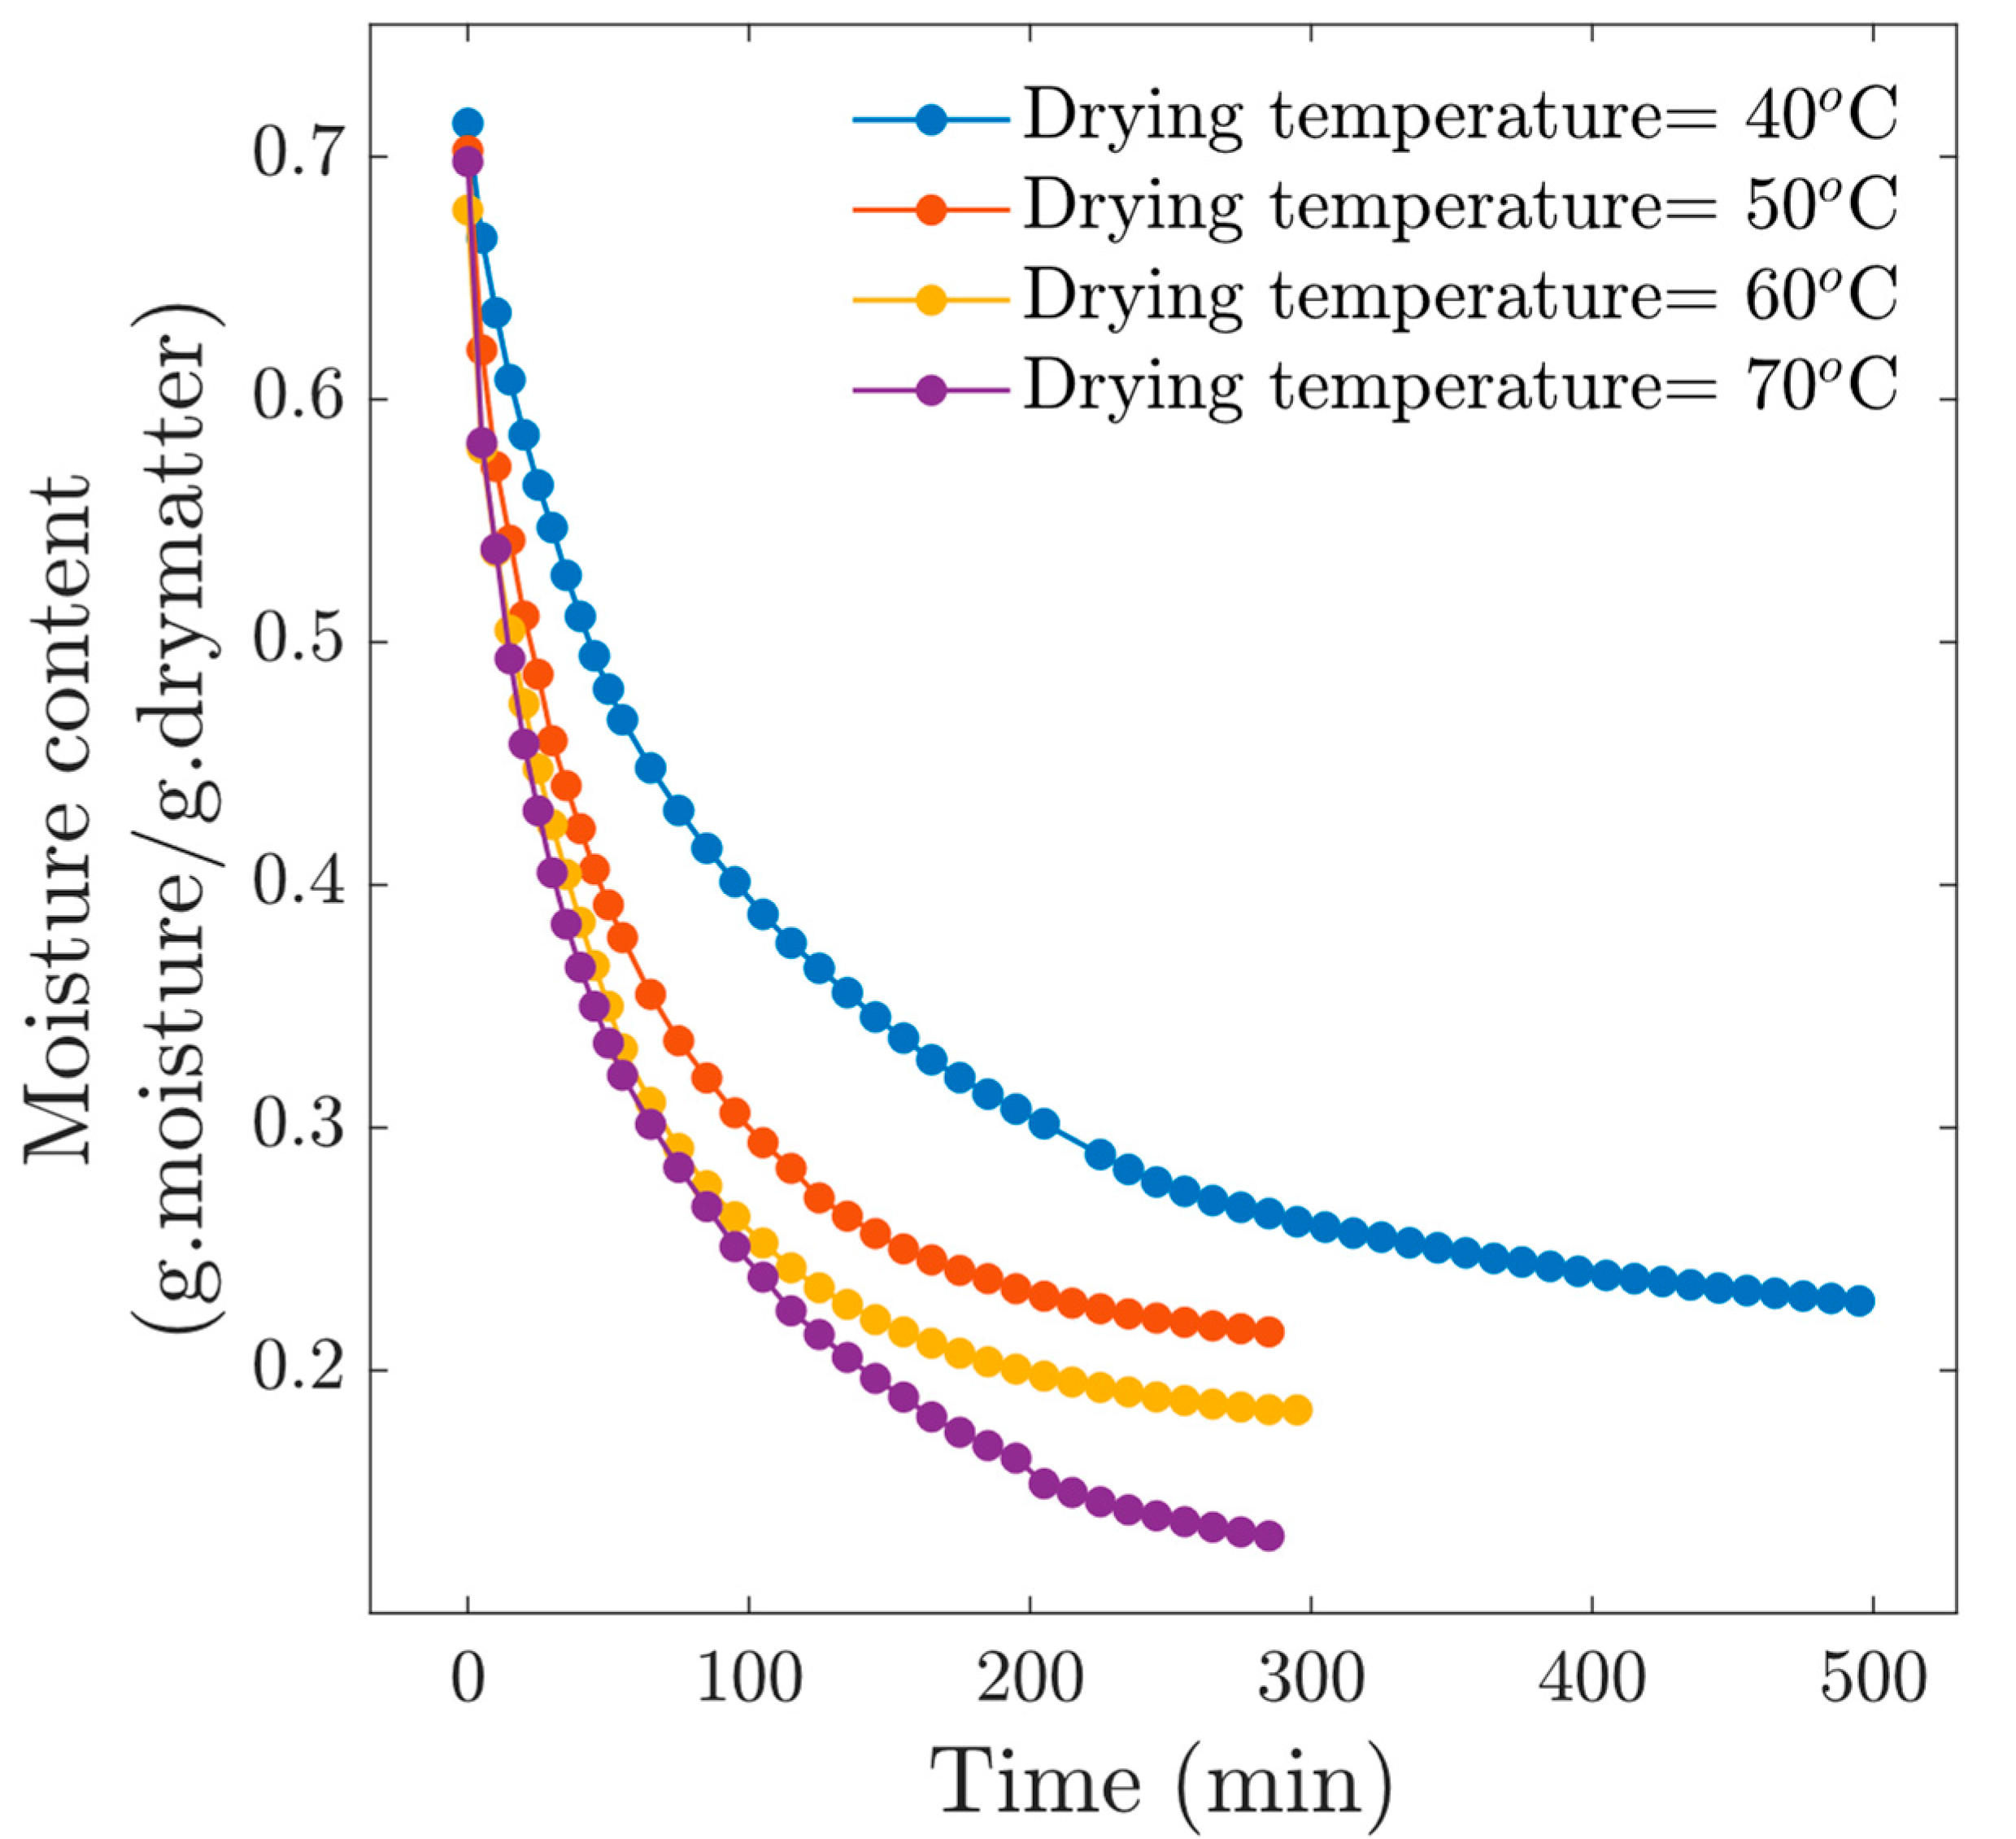
Figure 2 shows the drying kinetics at four drying temperatures, observing a standard behavior in this kind of process, i.e., the higher the temperature, the shorter the drying time. Likewise, the effect on the final moisture content is significant. At the drying time t = 285 min, we observed that the moisture content for the experiment at Tc = 40 °C was M = 0.2646, M = 0.2158 at Tc = 50 °C, M = 0.1838 at Tc = 60 °C and M = 0.1318 at Tc = 70 °C. Differences in final moisture content have implications for food preservation. About the drying condition Tc = 40 °C, the drying time was excessively long, which exposed the material to deterioration, mainly in terms of hardening and decoloration. Moreover, drying at Tc = 40 °C reached an equilibrium moisture content above 0.2 (d.b), which is very high for this type of product. From these results, we can observe that drying at 40 °C is not recommended.
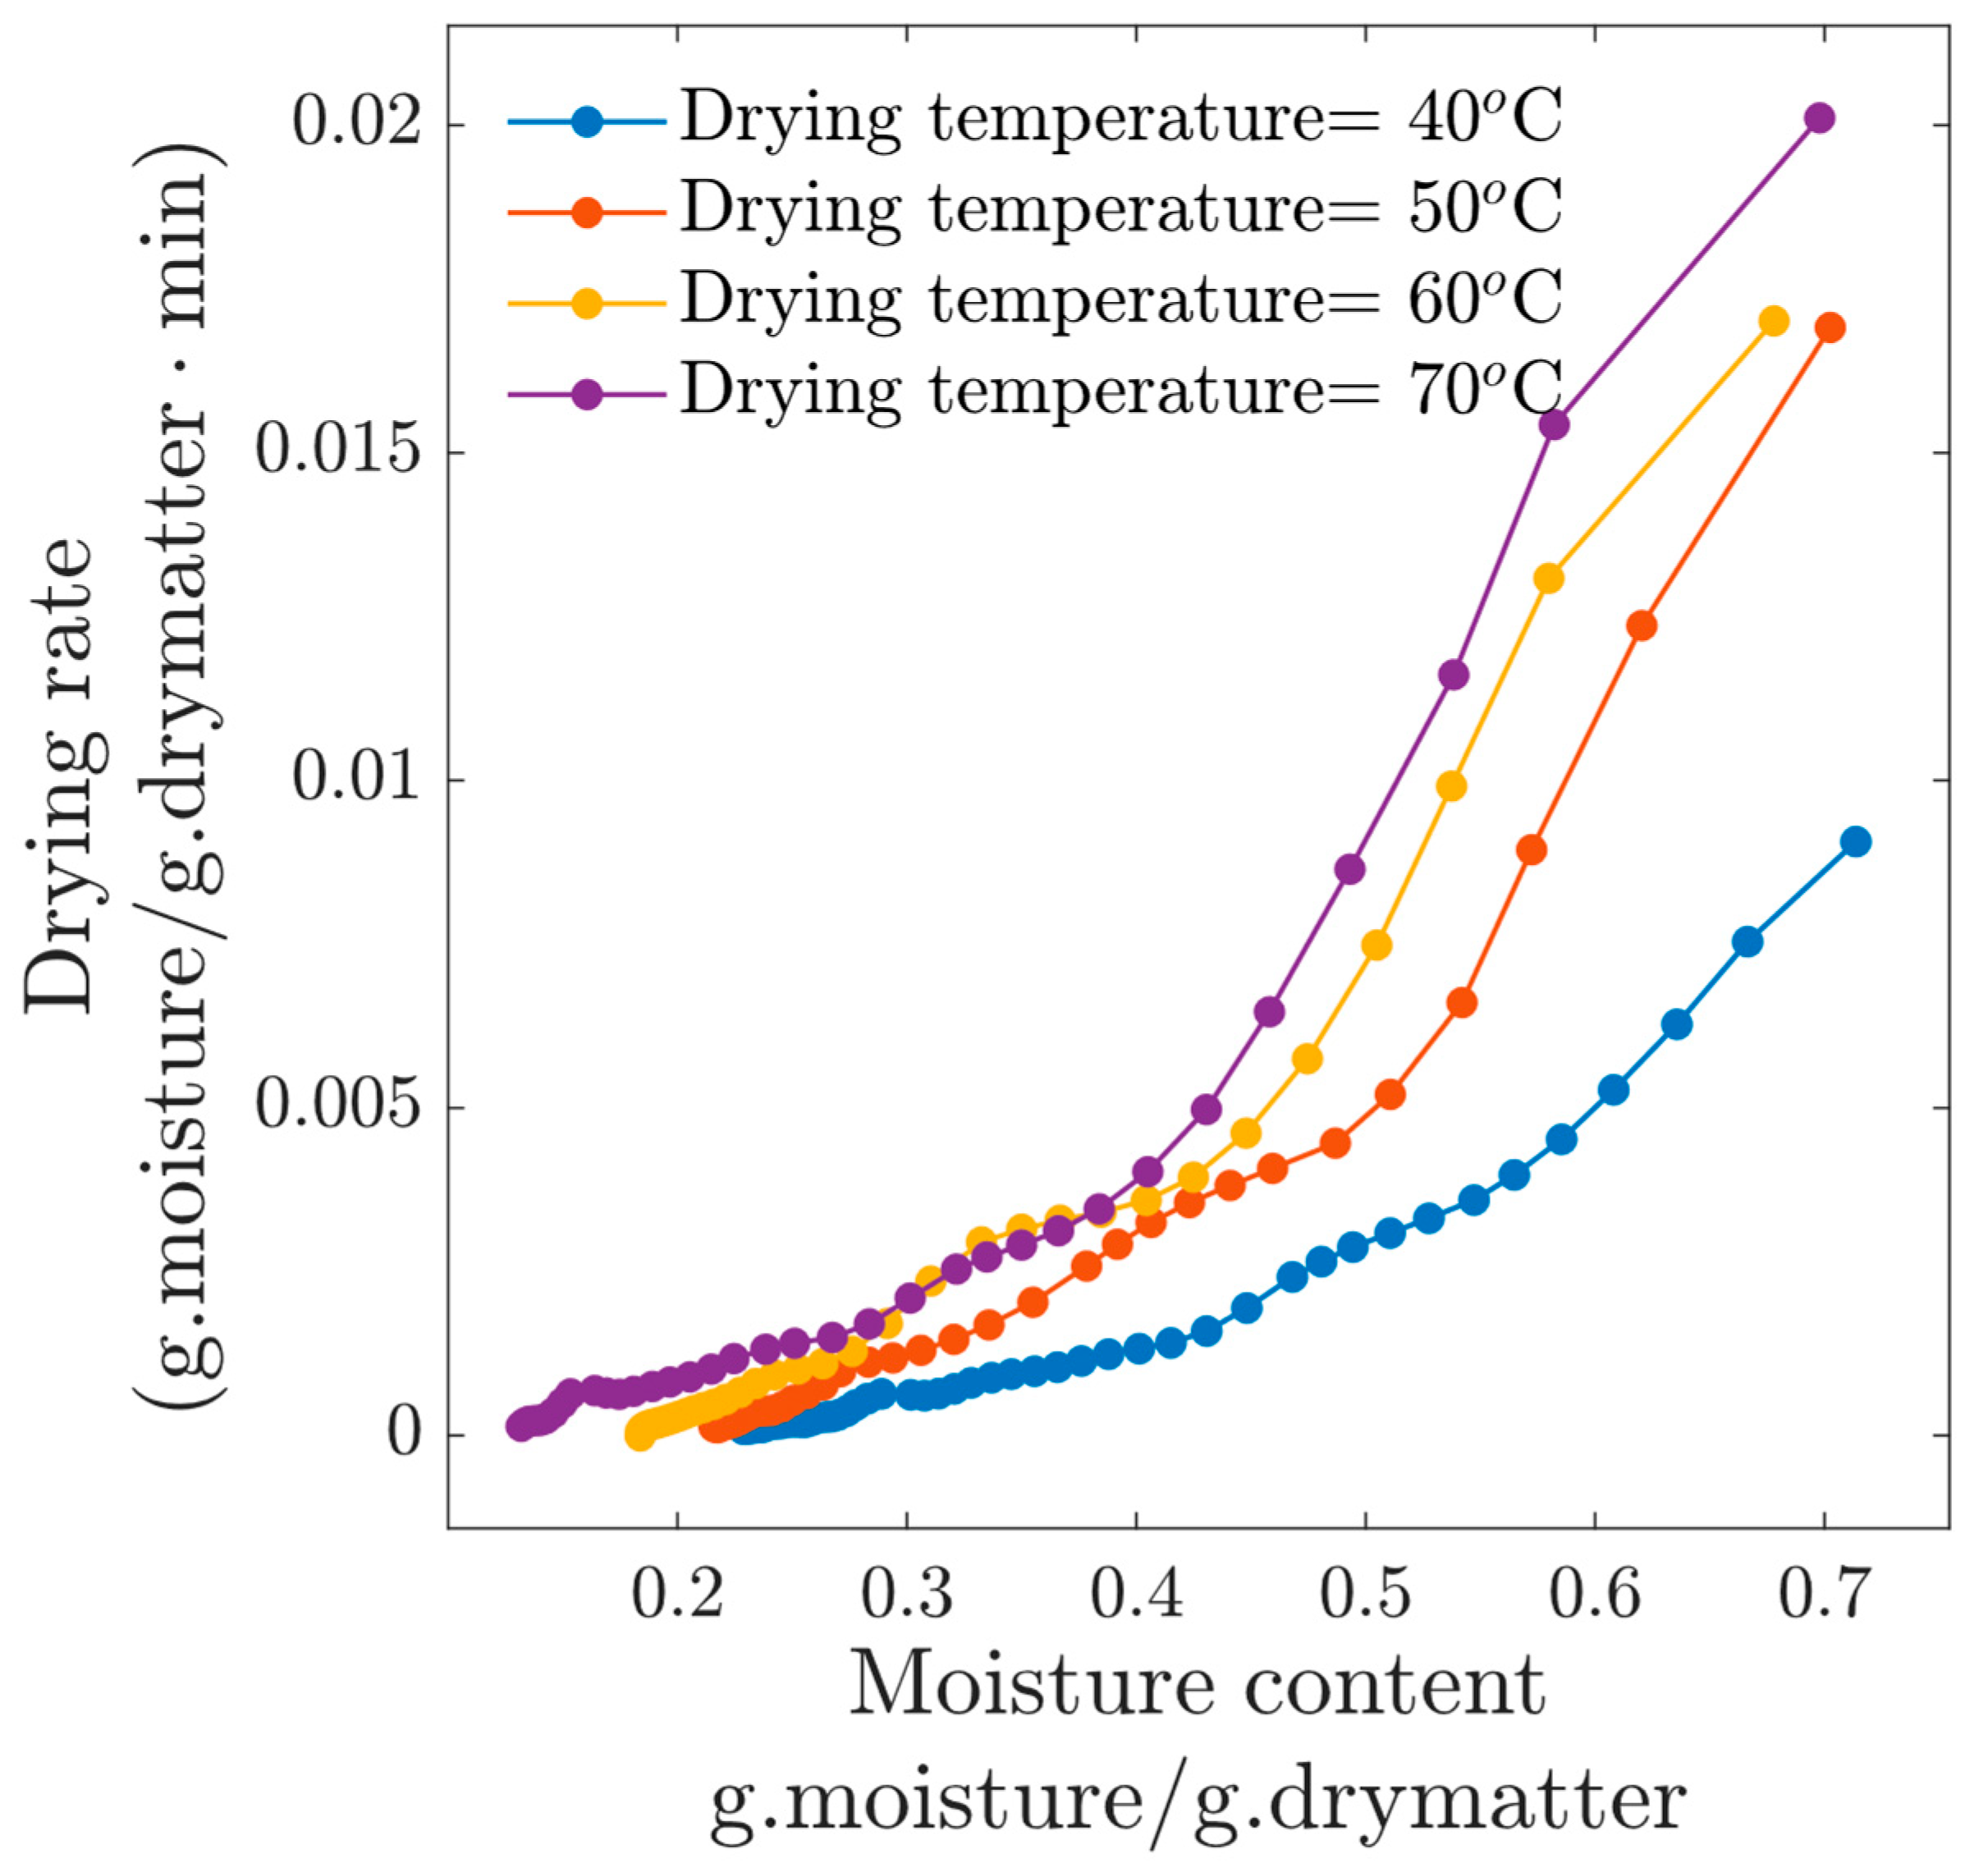
The drying rate is related to the evaporation intensity at the surface of the product; therefore, in Figure 3, this information is presented for the four drying temperatures. The higher the drying temperature, the faster the drying rate, with a linear decay with respect to the moisture content. At the beginning of the experiments, the drying rate for the condition Tc = 70 °C was close to 0.015 (d.b), which is approximately twice the initial drying rate for experiment at Tc = 40 °C. Contrary to what some authors claim, the constant drying rate phase was not observed in our experiments at 1 m/s. In the work of Dinçer et al. (2020) [9], the authors mention that the drying of beef slices was largely controlled by the water inside the beef slices, and then drying occurs primarily during the falling rate and consequently is controlled by the internal diffusion phenomenon. This argument can be applied to our results, since according to Figure 3, the process was always in the falling drying rate period.
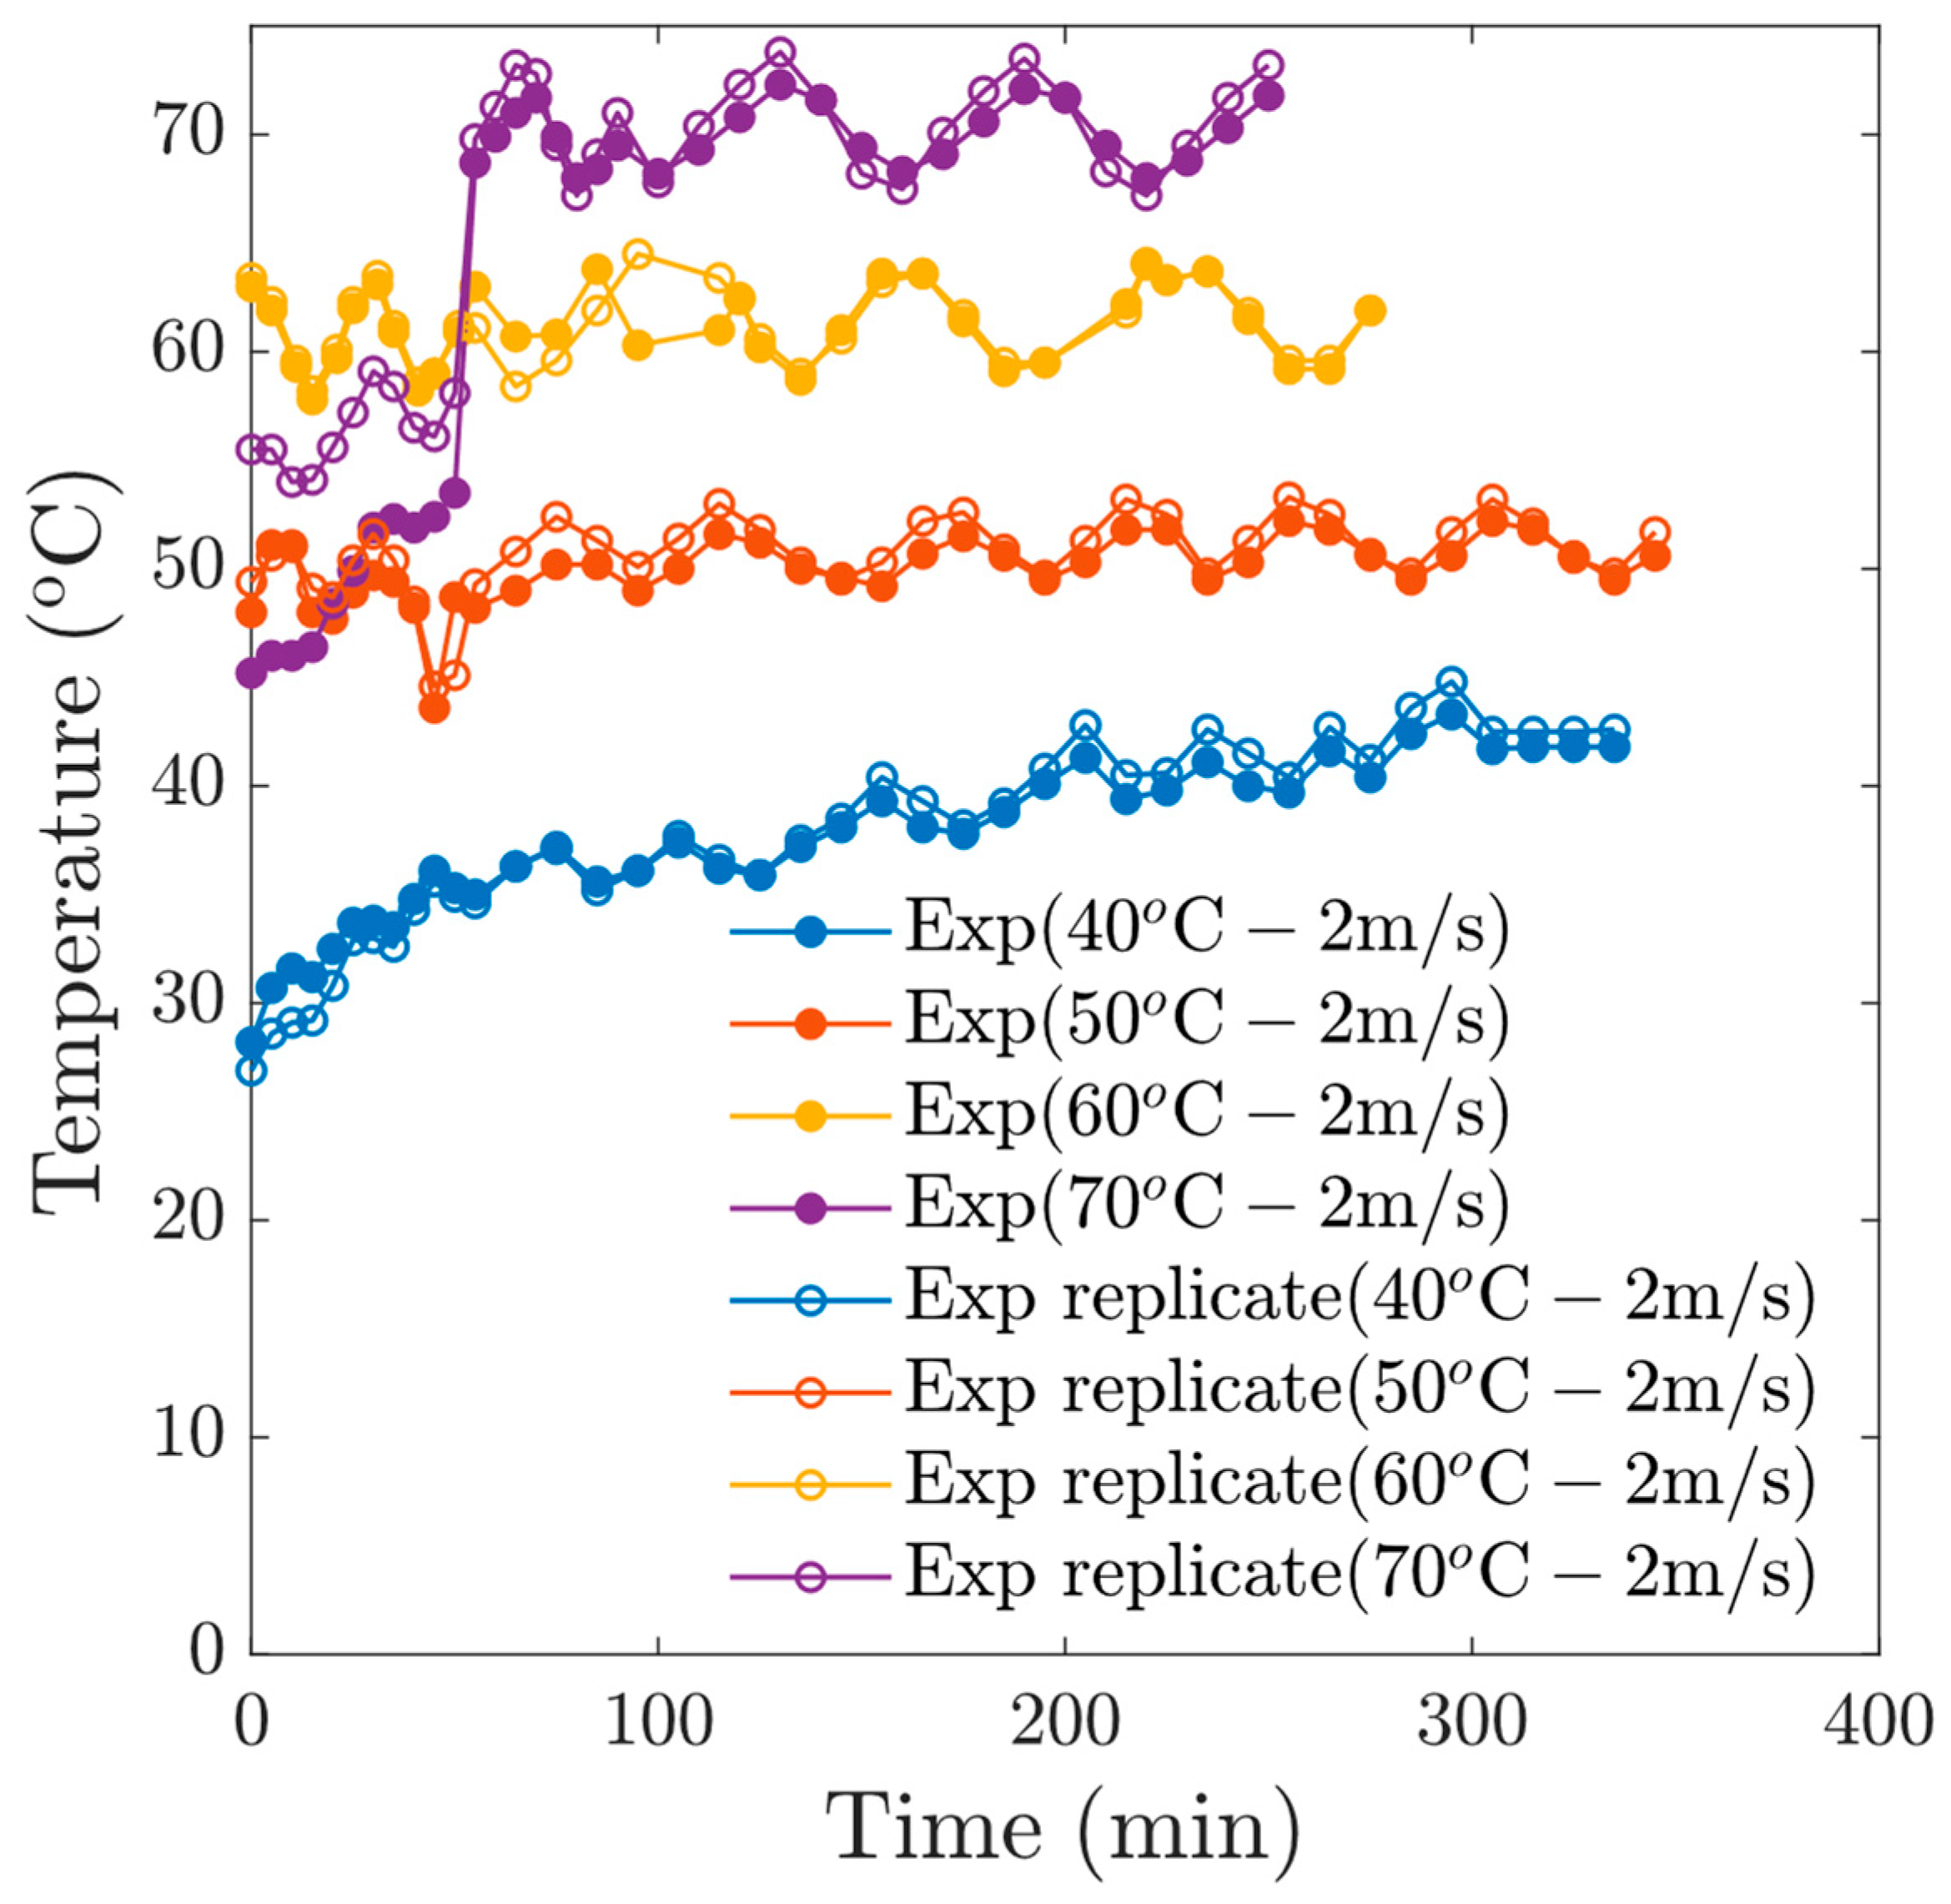
In our experiments, thermal oscillations were applied, which allows a re-homogenization of the moisture at the surface of the samples. These heating patterns provide a relaxation of the tissue, which allows a better diffusion of moisture. Figure 4 shows the temperature profiles of the samples, which respond to the oscillatory pattern of the drying temperature.

3.1.2. Experiments at v = 2 m/s Airflow

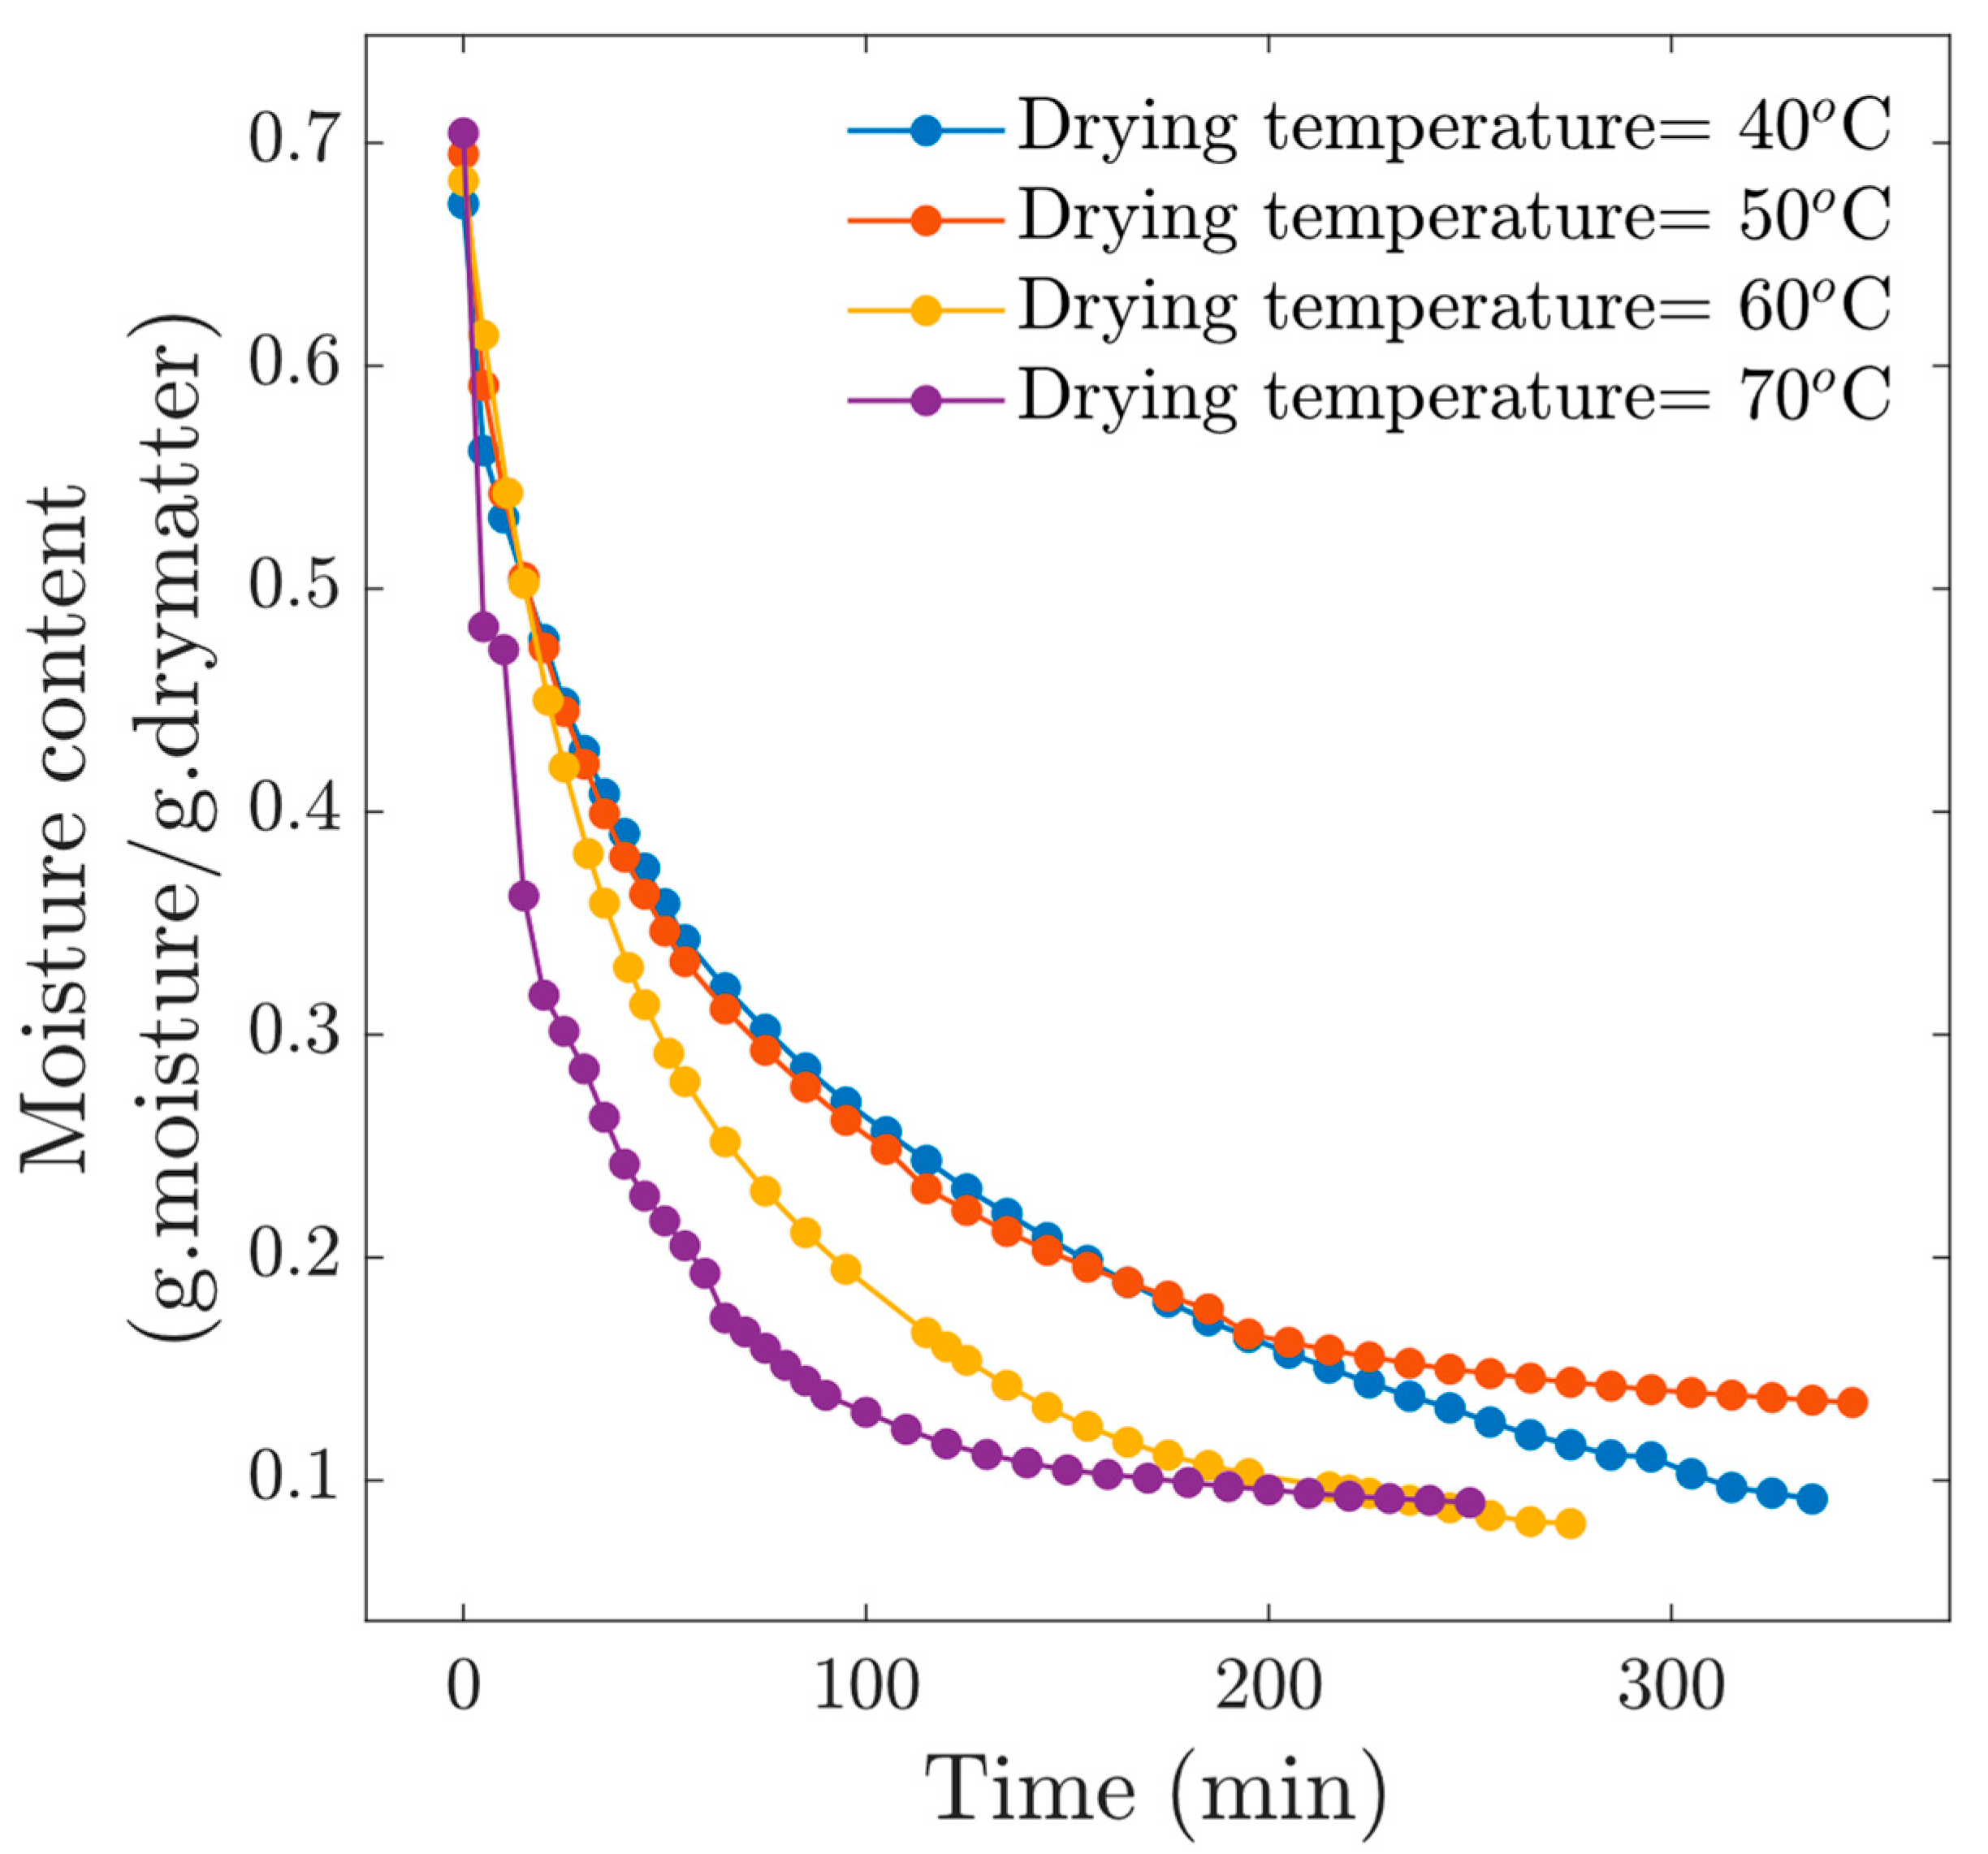
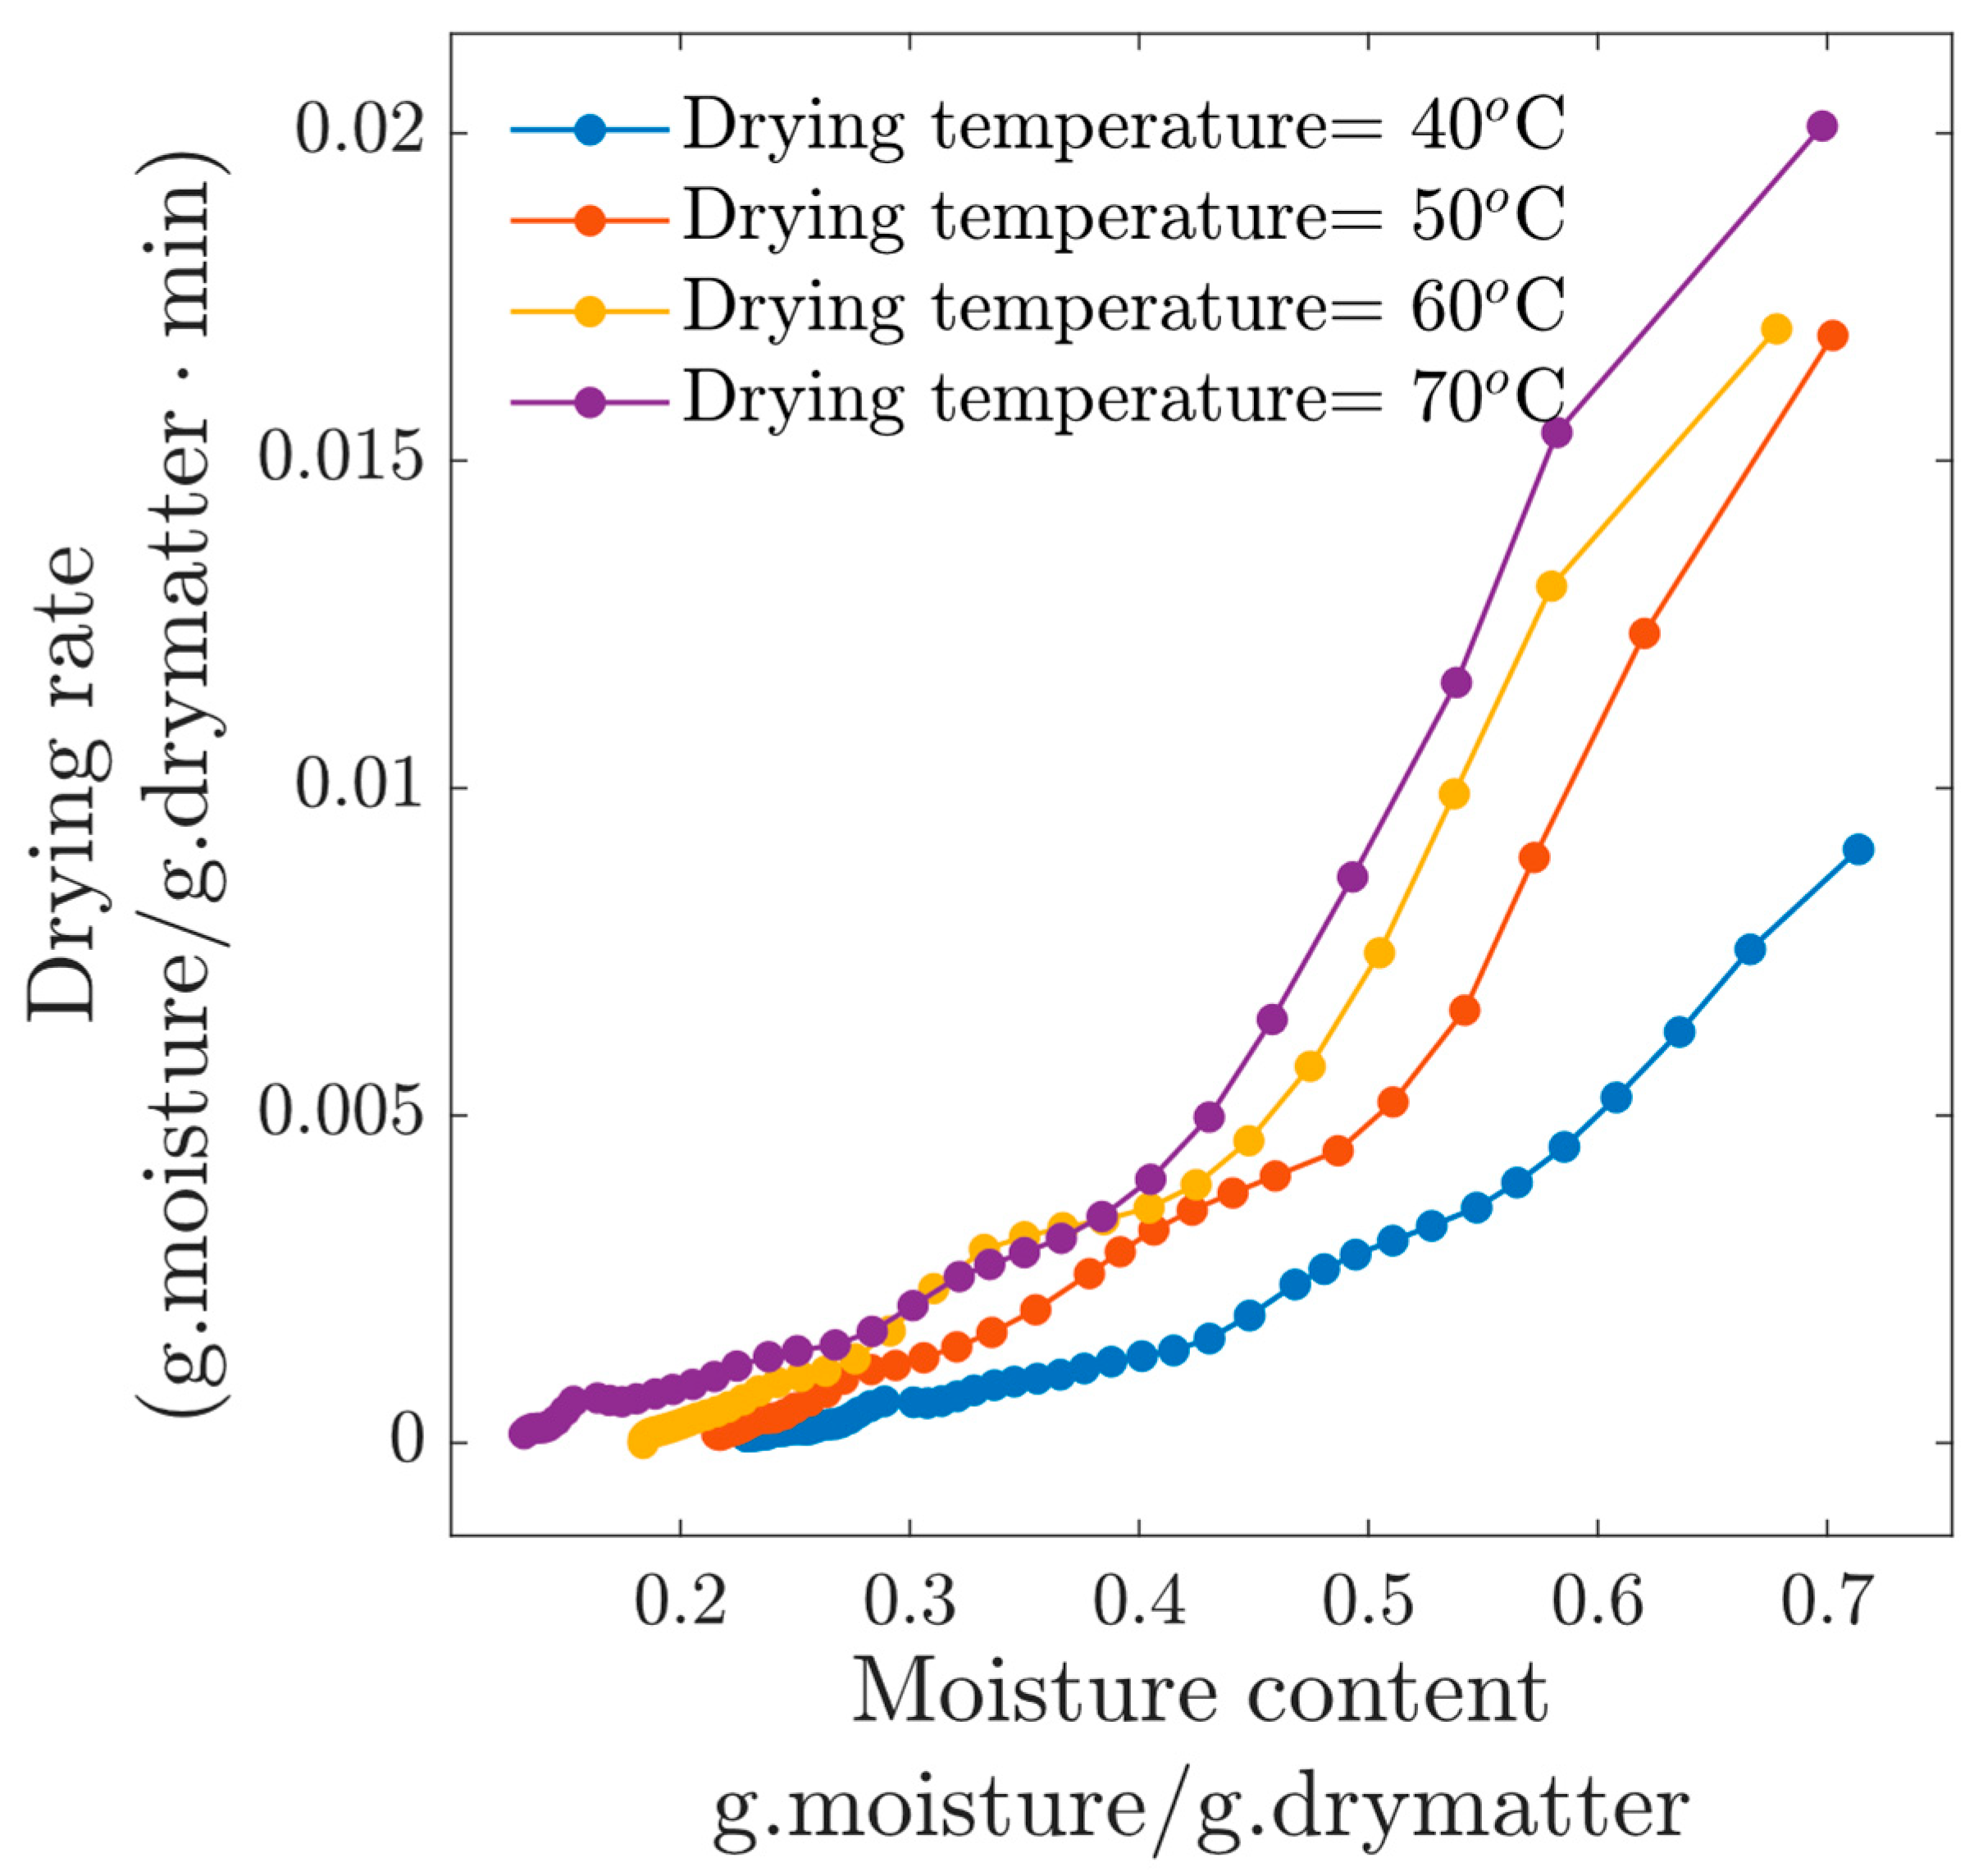
Figure 5, Figure 6 and Figure 7 show the drying kinetics, the drying rate curves and the evolution of the temperature of the samples for the experiments at v = 2 m/s. The increase in the air flow speed influenced the drying kinetics, contrary to the drying of beef, where the drying rate was little affected by air velocity [8]. Nevertheless, goat meat and beef have very different biochemical properties. For these drying conditions, the drying kinetics reached a final moisture content below 0.2 (d.b). For experiments at Tc = 60 °C and Tc = 70 °C, the final moisture content was approximately 0.1 (d.b), which is much lower than that obtained for experiments at a v = 1 m/s. The temperatures of the samples are presented in Figure 6. The effect of the oscillation of the air temperature in the tunnel was important. A relaxation effect on the tissues improved the moisture diffusion in the samples. A significant effect of temperature was observed during the first 200 min. In the final phase of drying, an intersection of the curves was observed, which could be attributed to the effect of shrinkage, which modifies the moisture diffusion process. The shrinkage of meat is evident in this type of process, mainly when more severe drying conditions are applied, i.e., when the convection of the drying air increases. From this information, we can suggest that the temperature level should consider the shrinkage rate, and a subsequent analysis of the rheology of the material.
A theoretical drying rate curve for a porous product with high moisture content would show a short period of conditioning and an increasing drying rate, a period of constant drying rate and a period of decreasing drying rate. In our case, it is important to note that the drying process under our conditions exclusively reveals the falling drying rate. According to [2,6], internal resistance to mass transfer appears to predominate over external resistance to mass transfer when larger air-drying speeds are employed (beyond 2 m/s approximately). This would explain the absence of the constant drying rate period in Figure 6.

3.2. Implementation of Mathematical Models

Three mathematical drying models were implemented (Table 2). The reduced moisture content at t = 0 was MR = 1, while as M(t) approaches Mf the reduced moisture approaches zero. Model M1 represents models based on the diffusion equation, while model M2 represents a model derived from Newton’s cooling law, both from the framework of the thin-layer drying approach. The model M3 is a classical polynomial model, and linear regression was used to find its coefficients. Non-linear regression is an iterative procedure and therefore requires an initial estimation of the parameters. For the models M1 and M2, the asymptotic limit MMf (MR → 0) was applied. For model M1, the parameters b ≈ 0.5, k2tf−1, k1 ≈ 1.1k2 were calculated. With model M2, we obtained b ≈ MR(tf)tf −1, ktfn, n ≈ 1.
An important assumption for the thin-layer drying approach is that the initial local moisture content (or local concentration or scalar mass field) is uniformly distributed in the samples, i.e., the local moisture M(x,t=0) = constant [13]. However, in this type of heterogeneous multiphase materials, the reduction of dimensionality implies the impossibility of an approximation based on the spatial homogenization process, and with it, the dismissal of the homogeneity hypothesis.
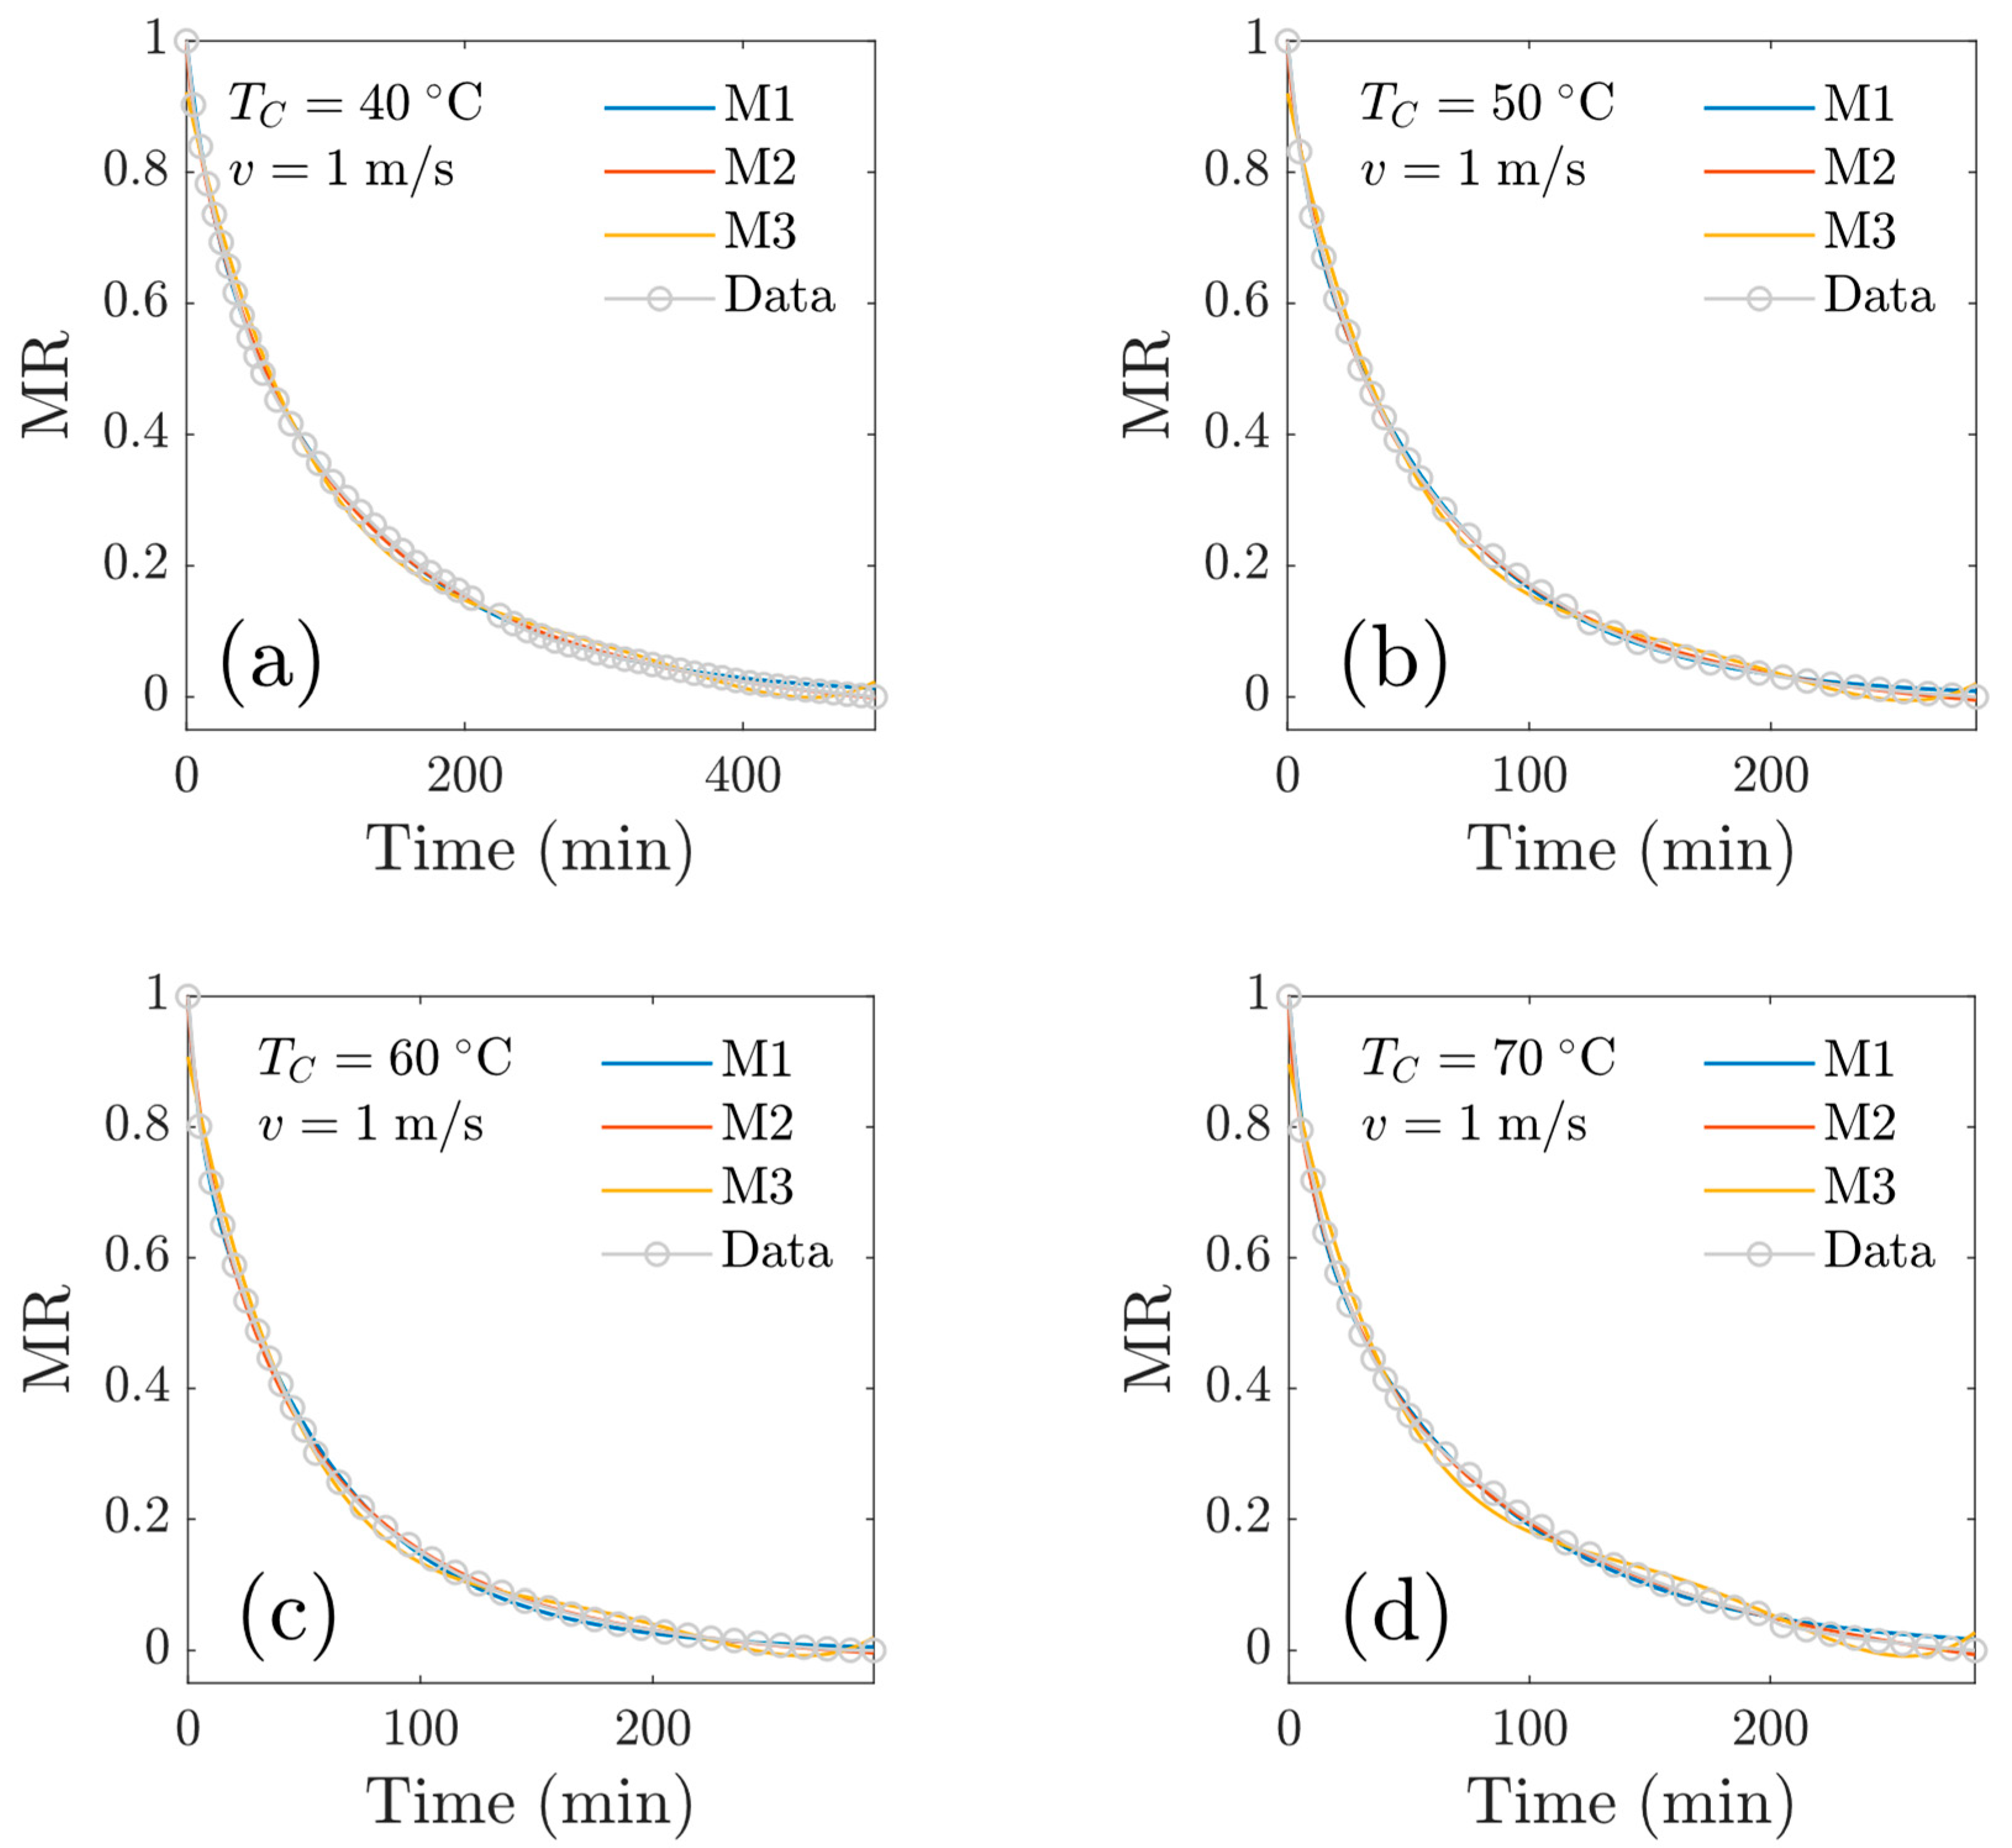
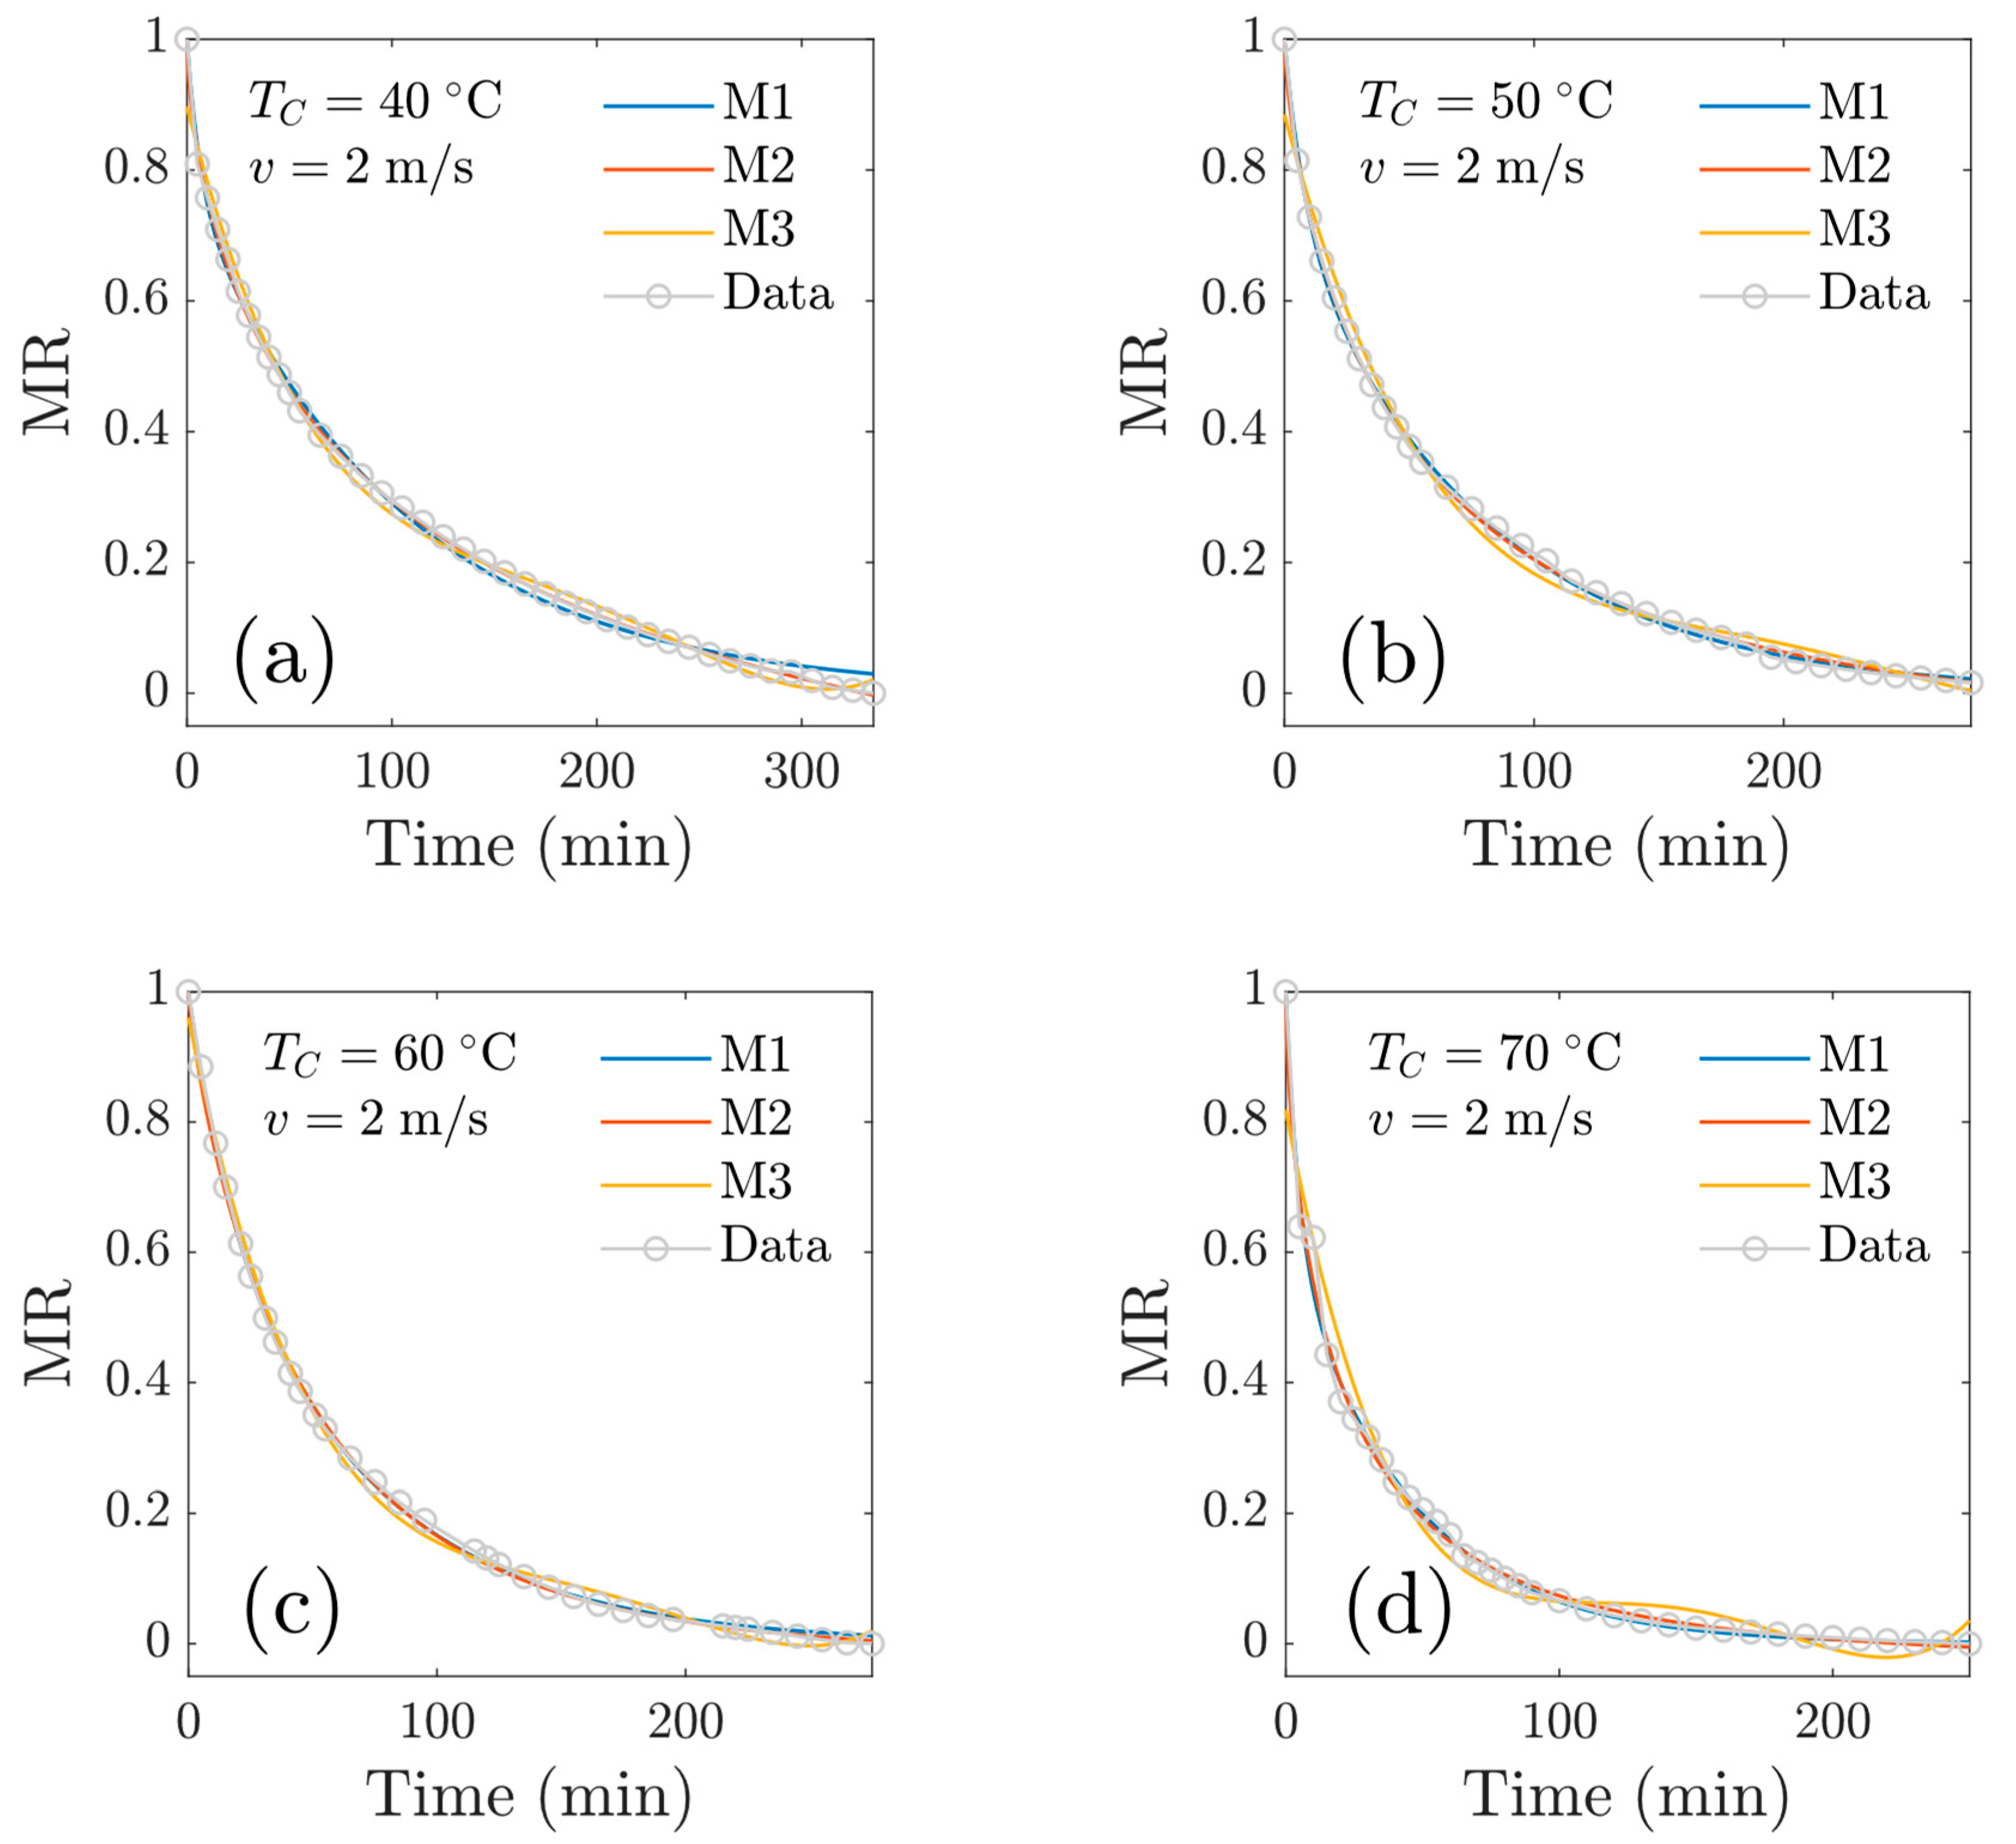
Figure 8 shows the modeled drying kinetics for experiments at v = 1 m/s. In general, a good fit was observed (to the essence of the statistical goodness-of-fit criteria). For the model M3, a polynomial of degree four was used. Models M1 and M2 describe the experimental data satisfactorily; furthermore, model M2 was better in terms of the goodness-of-fit criteria. Figure 9 shows the numerical results for experiments at v = 2 m/s, and again, model M2 was superior to model M1 in terms of goodness-of-fit criteria. The Midilli’s model (M2) showed good fitting of the experimental data, even in the presence of variations in temperature, findings that are consistent with the work of Ahmat et al., 2015 [6], who mention that the characteristic curve model and the Midili model were the best predictors of drying kinetics for beef samples. The M1 (two-term) model tends to the (physically correct) asymptotic limit MR = 0 as time elapses. In the work of Drãghici (2021) [12], the author found the ‘Wang and Singh’ model best described the exponential variations in the moisture rate for drying goat meat; nevertheless, drying was conducted in a thermobalance at 103 °C (more drastic drying condition).

3.3. Effective Diffusion Coefficients from the Analytical Solution

The analytical solution of the diffusion equation for an infinite plate of thickness L is equivalent to the model M1, considering the first two terms of the analytical solution, in addition to the fact that k1/k2a0/a1 = 1/9 y b = 1 − 8/π2 ≈ 0.19. This allows us to find the diffusion coefficient as D = k 1 L / π 2 . Table 3 summarises our results for the ratio k1/k2 and for the effective diffusion coefficients.
The activation energy EA is the minimum energy to remove water from biological material and its value is independent of temperature. According to our data and using Equation (3), we obtained EA ≈ 4–10 kJ/mol and DA ≈ 35 × 10−8 m2 s−1.

3.4. Heuristic Diffusion Model

This model considers temperature oscillations, and the diffusion coefficient depends on temperature. First, the solution of the one-dimensional diffusion equation for an infinite plate of thickness L is restructured and then the following conjecture is established: the MR obtained from the solution of the diffusion equation for the infinite plate maintains its functional form even when the diffusion varies with temperature.

3.4.1. Isothermal Model of MR

The effective diffusion coefficient D was considered. The moisture content is described by the scalar mass field MF(x,t), where the spatial average is defined by mm(t) = 〈MF(x,t)〉. The 1D transient diffusion equation is as follows:
M F t = D 2 M F x 2 ,
where initial and boundary conditions are MF(x,0) = MF0 (uniformly distributed) and M(0,t) = MF(L,t) = 0. Note that mm(0) = 〈MF0〉. The Equation (7) can be written as
M F t = D 2 M F x 2 ,
where
M F = M F M F 0 M f M 0 1 M f M 0 .
Here, Mf and M0 are arbitrary constants chosen for convenience from the final moisture content and initial moisture content. The initial and boundary conditions are MF′(x,0) = 1 and MF′(0,t) = MF′(L,t) = 0. The analytical solution of Equation (8) is given by Equation (10) [18],
M F x , t = 4 π n = 0 1 2 n + 1 sin 2 n + 1 π x L exp D 2 n + 1 2 π 2 t L 2 .
The spatial average is
M F = M F M F 0 M f M 0 1 M f M 0 = m m t m m 0 M f M 0 1 M f M 0 = M M 0 M f M 0 1 M f M 0 = M M f M 0 M f = MR ,
where M is the dry basis moisture content, md the dry mass and Mi and Mf the initial and final dry basis moisture content, respectively. The spatial average of Equation (10) can be expressed as follows:
MR = 8 π 2 n = 0 1 2 n + 1 2 exp a n t ,
with an = D(2n + 1)2 π2 L−2. The decay time of each exponential term is τn = 1⁄an; according to typical data of drying kinetics, diffusion has values around 10−11–10−7 m2 t−1 and L = 10−3 m, therefore, in the most precarious situation of diffusion, the first four decay times take the values τ0 = 166 min, τ1 = 18 min, τ2 = 6 min and τ3 = 3 min. MR is exact in three significant figures with the first five terms, while it is exact in one significant figure with the first two terms, then Equation (12) is written as follows
MR = 8 π 2 exp a 0 t + 1 9 exp a 1 t + R t
where R accumulates all the terms for n > 1. The term R can be written as
R t = n = 2 1 2 n + 1 2 exp a n t n = 2 1 2 n + 1 2 e a n τ 1 + a n τ t a n e a n τ
Here, a Taylor series expansion was performed for the exponential. By defining
R 2 = n = 2 e a n τ 1 + a n τ 2 n + 1 2     and     R 1 = n = 2 a n e a n τ 2 n + 1 2 = D π 2 L 2 n = 2 e a n τ ,
we have R(t) ≈ R2R1t, then the equation for the moisture content is
MR 8 π 2 exp a 0 t + 1 9 exp 9 a 0 t + R 2 R 1 t
This equation gives a guideline to approximately find the diffusion coefficient. We propose to use the decay time τ = a2 and n = 2. By nonlinear regression, we found a0 and R1 that were compared with theoretical results to determine the diffusion coefficient. The condition M(0) = M0 makes R2 = R(0) = π2⁄8 − 10/9 ≈ 0.1226. In fact, Equation (16) is an extended case of the model proposed by Midilli et al. [24]. We highlight that the coefficients of our proposal have physical meaning.

3.4.2. Temperature-Dependent Heuristic Model

To build a temperature-dependent moisture ratio model, we assume an effective diffusion coefficient that linearly depends on temperature. By developing the Taylor series expansion of Equation (3) we have
D t D A exp θ A θ 0 1 + θ A θ 0 2 θ θ 0
where q is the sample temperature in Kelvin. This assumption was based on the experimental results of effective diffusion published by Sahin et al., where authors founded a quasilinear behavior of effective diffusion in the temperature range 40–60 °C [16]. We substitute in the Equation (16) and, after some mathematical arrangements, we obtain a new model that explicitly depends on temperature:
MR 8 π 2 exp R 3 f θ t + 1 9 exp 9 R 3 f θ t + R 2 R 1 t
where
R 3 = π 2 L 2 D A exp θ A θ 0
and
f θ = 1 + θ A θ 0 θ θ 0 1 .
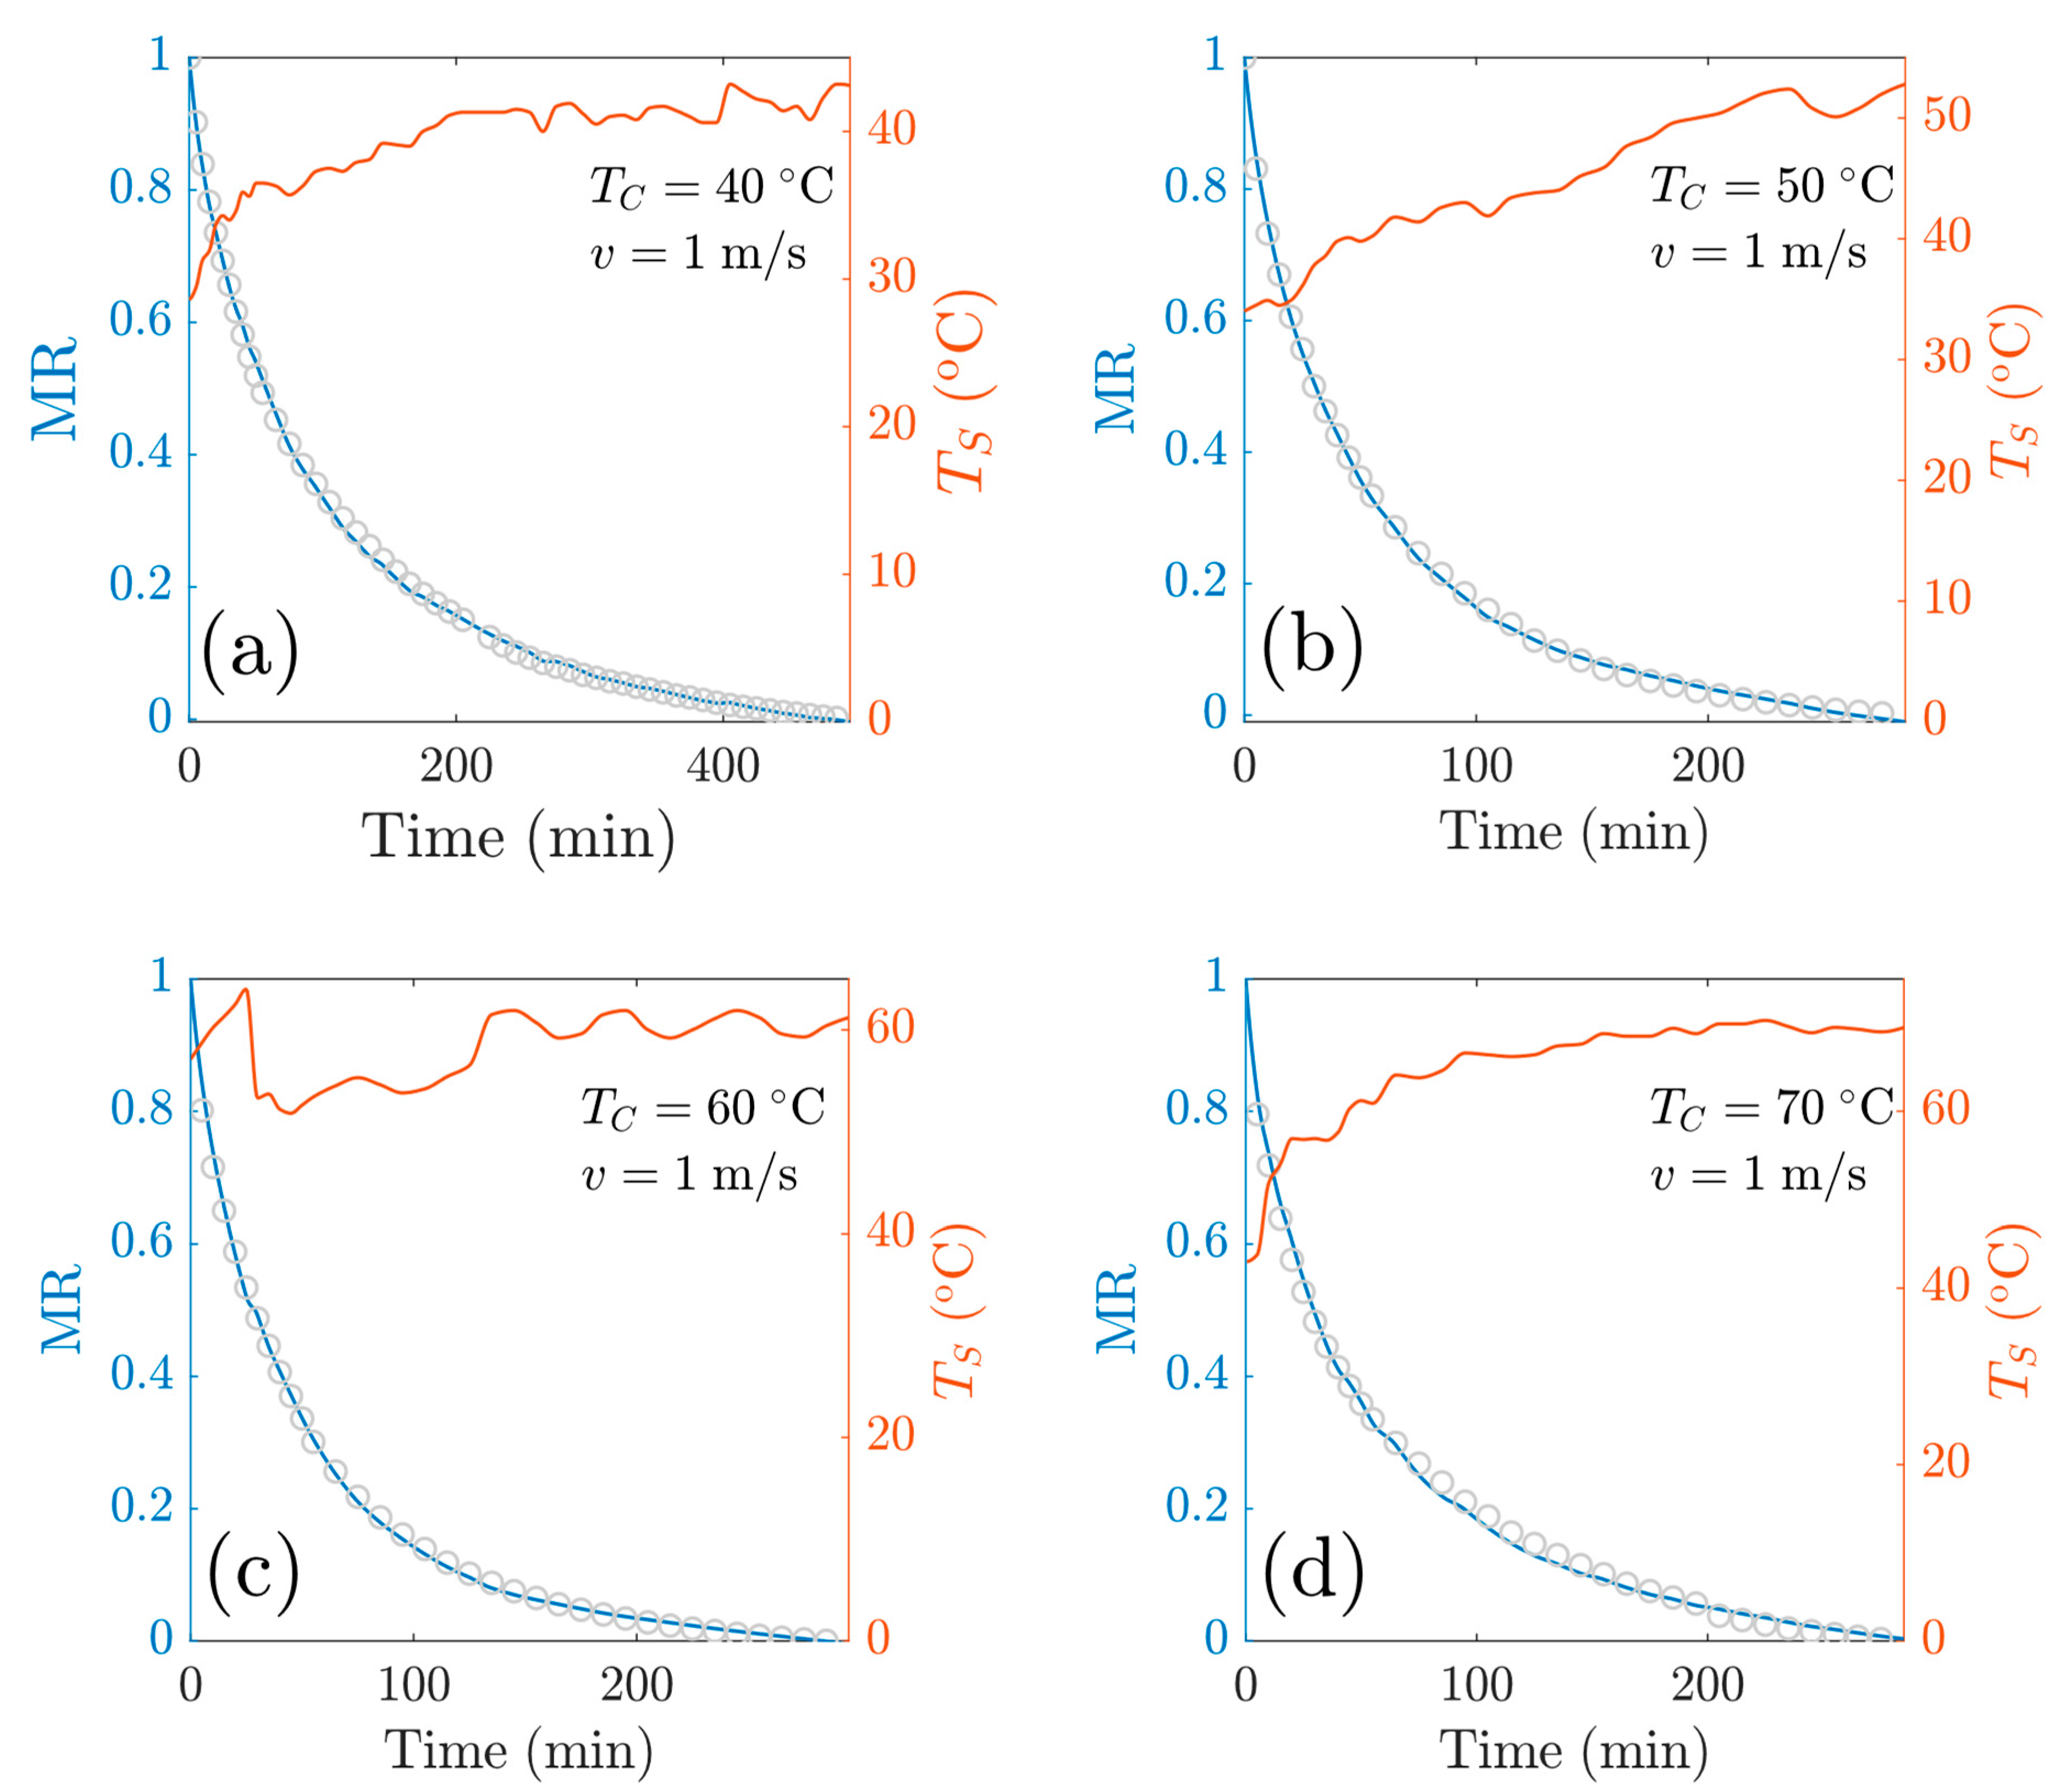
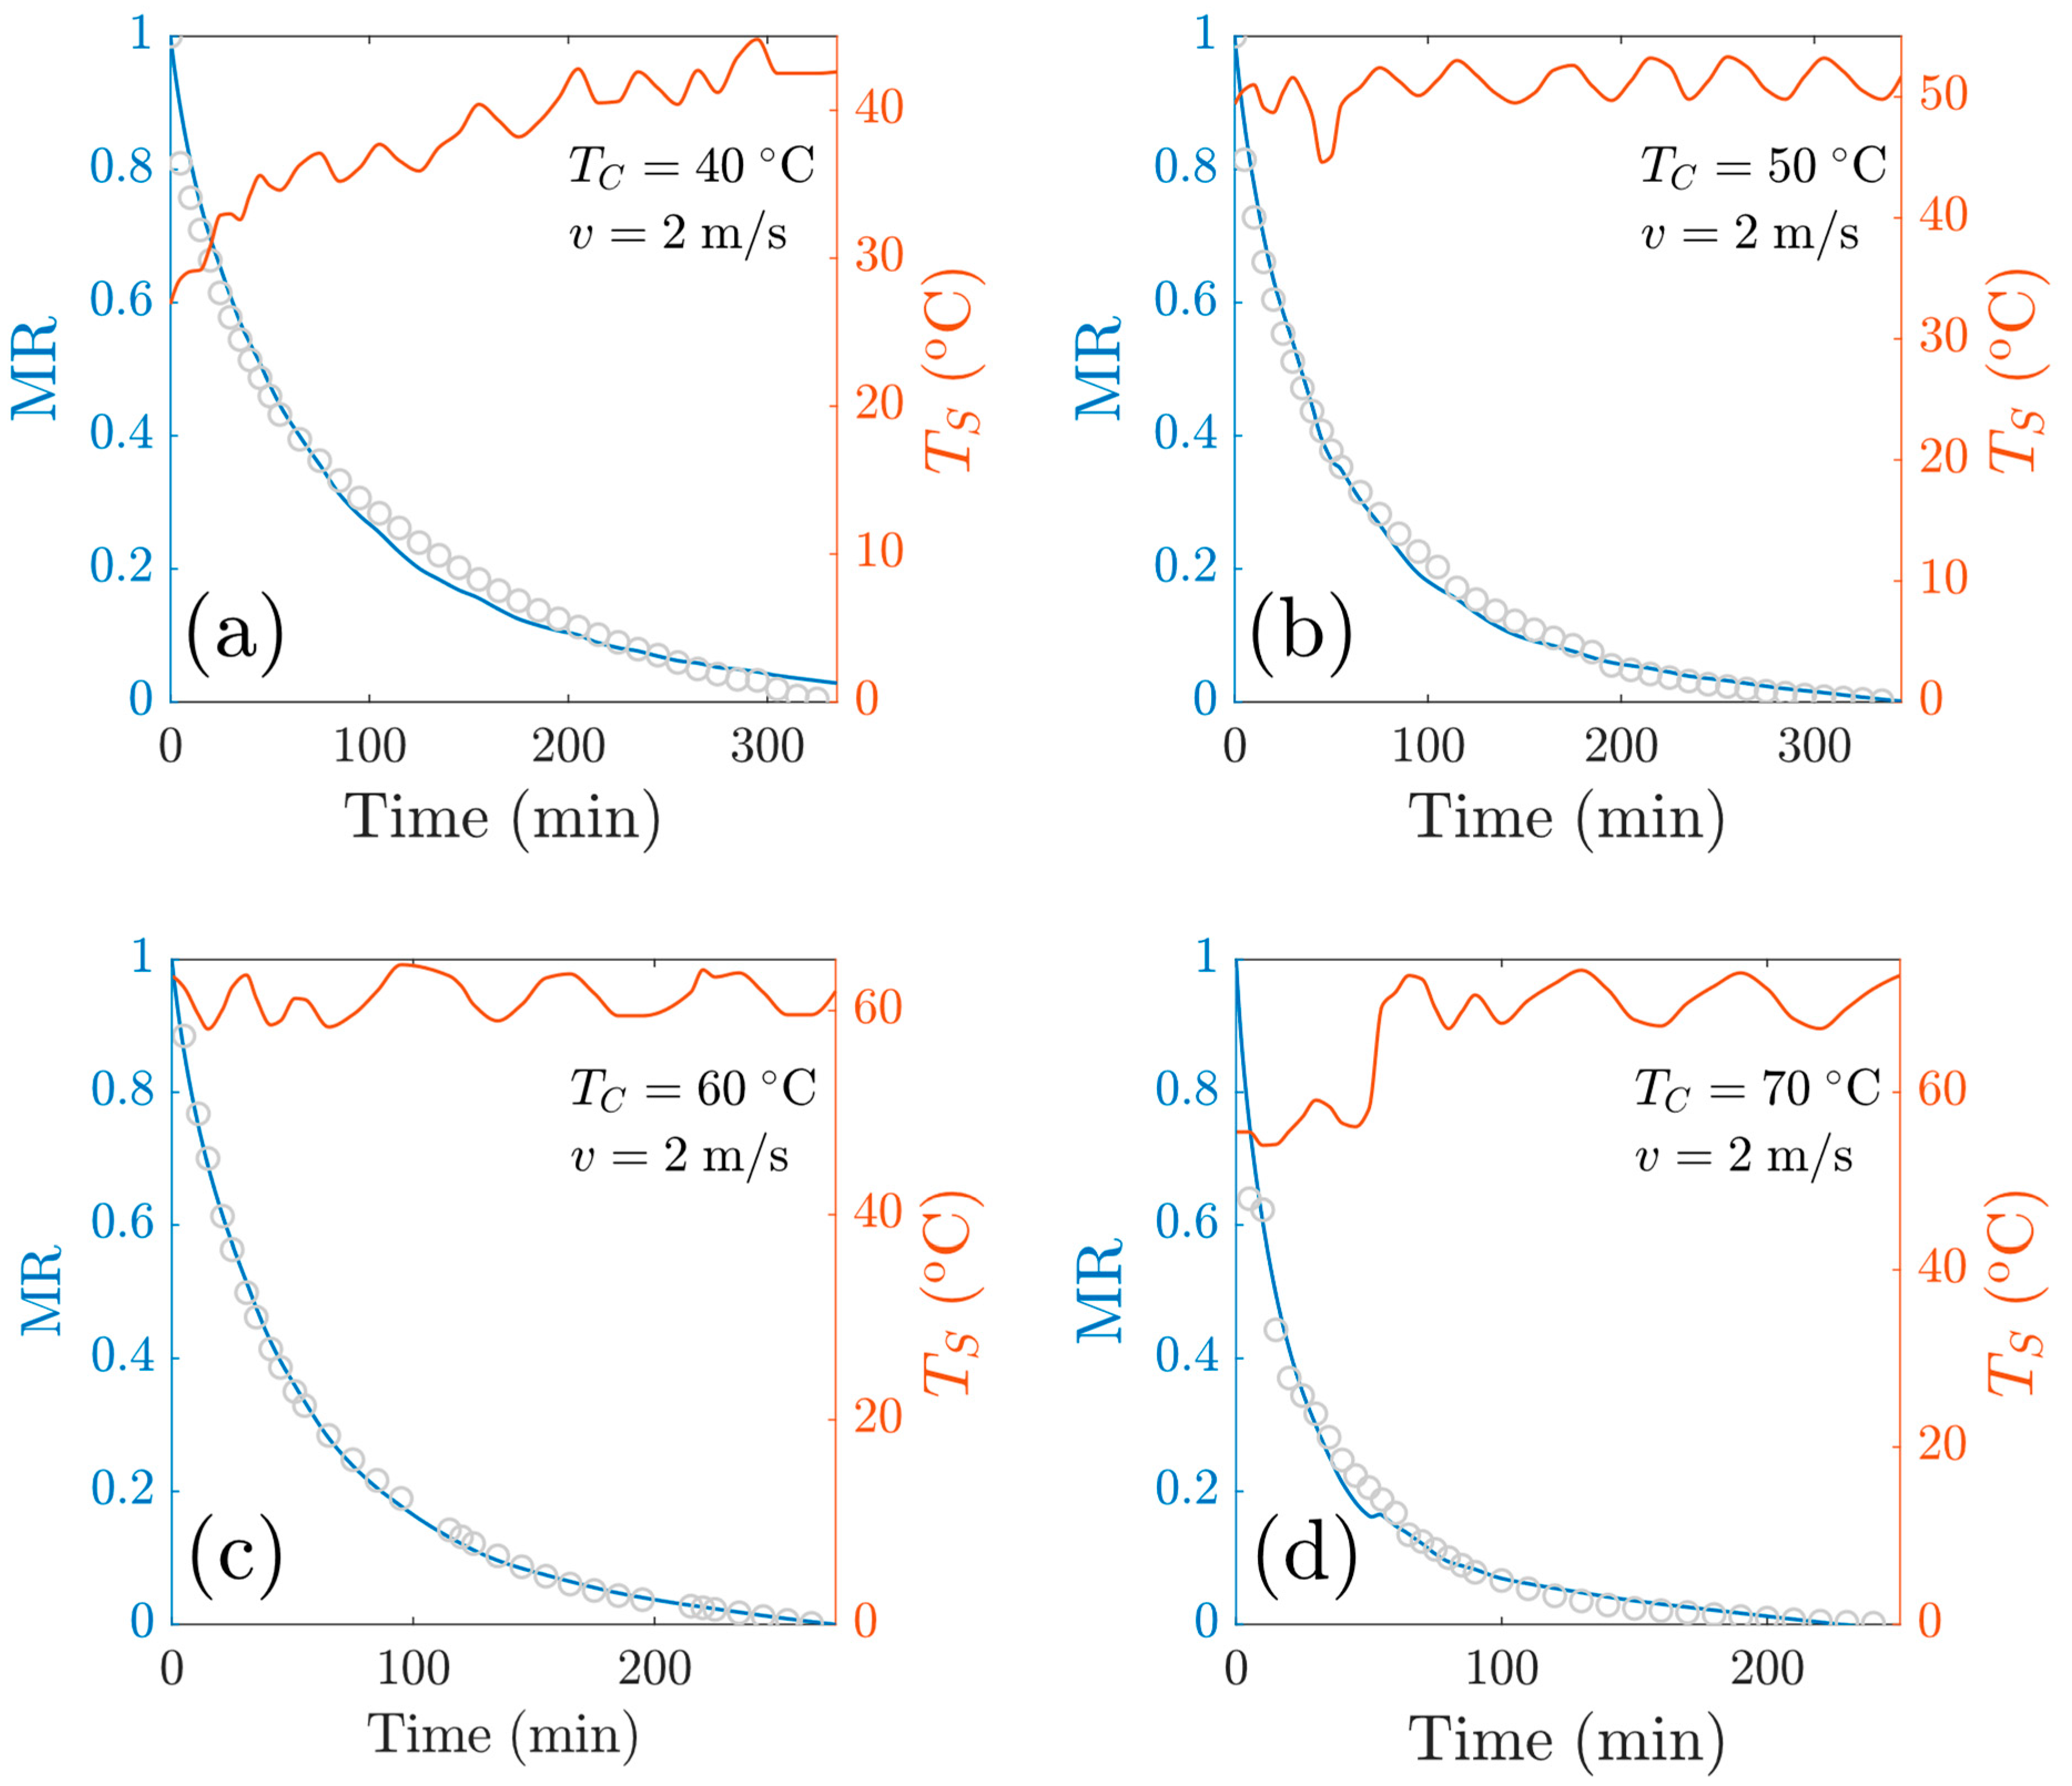
This temperature-dependent model consists of three fitting parameters R1, R3 and qA/q0. Figure 10 shows both the fitting curves for the experiments at v = 1 m/s as well as the sample temperature. Figure 11 shows both the fitting curves for experiments at v = 2 m/s as well as the sample temperature. Overall, the model has comparable goodness of fit with models M1 and M2, as shown in Table A2, Table A3 and Table A4. The goodness-of-fit statistics for the different mathematical models used in this study are presented in Appendix A.
For the experiments at v = 1 m/s, the RMSE values were as follows: 0.0074 (Tc = 40 °C), 0.0076 (Tc = 50 °C), 0.0101 (Tc = 60 °C) and 0.0133 (Tc = 70 °C), and for experiments at v = 2   m / s , the RSME values were 0.0216 (Tc = 40 °C), 0.0207 (Tc = 50 °C), 0.0091 (Tc = 60 °C) and 0.0278 (Tc = 70 °C). From these data, we observe the models show a great capacity to predict the drying kinetics.

4. Conclusions

In this work, mathematical models were implemented to predict the convective drying of goat meat. The experimental data set was compared with thin layer models and a heuristic approach. Our main findings are the following:
  • According to our experimental results, the effect of air temperature on drying kinetics is very important. We observe the drying time decreases as temperature increases. For experiments at v = 1 m/s, we can observe that after 290 min, the samples subjected to Tc = 40 °C reached a moisture content of 0.26 (d.b), at Tc = 50 °C, a value of 0.22 (d.b), at Tc = 60 °C, a value of 0.18 (d.b) and for the conditions at Tc = 70 °C, a value of 0.07 (d.b). The temperature causes a very significant reduction in drying time. This was also corroborated by analyzing the drying rate curves, since it was observed that the initial drying rate for the drying condition at Tc = 70 °C was practically twice the rate at Tc = 40 °C. Furthermore, for experiments at 1 m/s, the constat drying rate was not observed.
  • Regarding the drying kinetics for the four temperatures at v = 2 m/s, a second drying rule was confirmed: As airflow velocity increased, the drying rate increased. The final moisture content for this set of experiments was lower with respect to the experiments performed at v = 1 m/s; in fact, all the samples reached moisture contents below 0.2 (d.b). For these drying conditions, the falling drying rate period was always identified.
  • Regarding the mathematical models, it was observed that they described the drying kinetics’ behavior with an accurate fitting of experimental data. The two-term models, the Midilli model and the Wang and Singh model showed very small RMSE values for all drying conditions. Also, the magnitude of the diffusion coefficients corresponded to the usual values for biological materials (~10−9 m2 s−1), which indicates the reliability of our calculations. In relation to the heuristic model, the drying curves for the four temperatures also showed a good prediction of data. This model considered the effect of temperature oscillation, which allows us to consider the thermal dynamics of the process.

Author Contributions

Conceptualization, O.A.H.-F., C.R.-S. and S.S.-T.; Investigation, V.C.L., D.B.R. and S.S.-T.; Resources, S.S.-T. and C.R.-S.; Methodology, O.A.H.-F., V.C.L., D.B.R. and S.S.-T.; Formal analysis, O.A.H.-F. and S.S.-T.; Software, O.A.H.-F.; Validation and Project administration, S.S.-T.; Writing—original draft, S.S.-T.; Writing—review and editing, O.A.H.-F., C.R.-S. and S.S.-T. All authors have read and agreed to the published version of the manuscript.

Funding

Financial support from IPN, Secretaría de Investigación y Posgrado (Grant No. SIP 20220395, SIP 20230794, 20241532).

Data Availability Statement

The original contributions presented in the study are included in the article/Appendix A, further inquiries can be directed to the corresponding author.

Acknowledgments

V. Carrillo Luis and D. Beristain Rios acknowledge CIIDIR Unidad Oaxaca for providing with all the facilities to perform the experiments, within the framework of the Project SIP 20220395. The authors thank Jorge Hernández Bautista, from the Faculty of Veterinary Medicine and Zootechnics, UABJO, for the preparation of the samples used in the experiments.

Conflicts of Interest

The authors declare no conflicts of interest.

Appendix A

For the heuristic, two-term and Midilli models, the Curve Fitting Toolbox of MATLAB was used for parameter optimization by means of nonlinear regression. For the Wang and Singh model, the POLYFIT instruction of MATLAB was used. This instruction calculates the polynomial coefficients by means of linear regression. Tables with statistical information are shown below. The standard error (RMSE, root mean square error) of the fits to the different models ranges in the interval (0.004, 0.029). Table A1 presents the values concerning the validation of the regression. Furthermore, Table A2, Table A3, Table A4 and Table A5 have information related to the values of the fit parameters as well as the goodness of fit.
Table A1. Definitions for regression validation.
FieldValueDescription
RSS i = 1 n y i y ^ i 2 Sum of squares due to error or residual sum of squares. Here y ^ i is the estimator and n is the sample size.
ESS i = 1 n y ^ i y ¯ 2 Explained sum of squares. Here, y ¯ is the arithmetic mean.
TSS i = 1 n y i y ¯ 2 Total sum of squares.
RSQUARE ( R 2 ) ESS TSS = TSS RSS TSS R-squared (coefficient of determination).
DFE n k 1 Degrees of freedom in the error, where k is the number of predictors.
ADJRSQUARE 1 1 R 2 n 1 n k 1 Degree-of-freedom adjusted coefficient of determination.
RMSE 1 n i = 1 n y i y ^ i 2 Root mean square error (standard error).
Table A2. Temperature-dependent heuristic model.
Air Velocity Coefficients *Goodness
T c R 3 R 1 θ A / θ 0 RSSRSQUAREDFEADJRSQUARERMSE
1 m/s400.00930.0003−1.41300.00290.9993520.99930.0074
500.01640.0005−1.10000.00180.9993320.99920.0076
600.02560.00040.49980.00330.9986330.99860.0101
700.01560.0004−2.00000.00580.9974330.99740.0133
2 m/s400.00830.0006−3.37200.01720.9935370.99930.0216
500.01880.0004−0.77290.01640.9939380.99360.0207
600.02060.0004−0.24900.00260.9990310.99890.0091
700.03470.0006−1.37200.02460.9854320.98450.0278
* 95% confidence bounds.
Table A3. Two-term model (M1).
Air Velocity Coefficients *Goodness
T c b k 1 k 2 RSSRSQUAREDFEADJRSQUARERMSE
1 m/s400.22400.00820.05650.00190.9995520.99950.0061
500.19100.01580.14590.00090.9996320.99960.0053
600.18300.01720.21650.00150.9994330.99940.0068
700.29230.01310.12300.00370.9984320.99830.0107
2 m/s400.22970.00970.15450.00770.9971370.99690.0144
500.26390.01280.01280.00220.9992380.99910.0076
600.72010.05780.01470.00130.9995310.99950.0065
700.38080.02260.21040.01050.9938320.99340.0181
* 95% confidence bounds.
Table A4. Midilli model (M2).
Air Velocity Coefficients *Goodness
T c b k n RSSRSQUAREDFEADJRSQUARERMSE
1 m/s40−0.00010.03180.76260.00120.9997520.99970.0047
50−0.00010.05050.76580.00050.9998320.99980.0041
60−0.00010.05480.76290.00150.9994330.99930.0068
70−0.00020.07810.64820.00070.9997320.99970.0048
2 m/s40−0.00030.06670.61480.00120.9996370.99950.0057
50−0.00010.06320.69330.00110.9996380.99960.0054
60−0.00000.05940.82670.00220.9991310.99910.0084
70−0.00010.13720.63250.00960.9943320.99400.0173
* 95% confidence bounds.
Table A5. Wang and Singh model (M3).
Air Velocity Coefficients *Goodness
T c a 4 a 3 a 2 a 1 a 0 RSSRSQUAREDFEADJRSQUARERMSE
1 m/s400.0463−0.09800.0618−0.11240.12670.07280.9953500.99490.0186
500.0488−0.11730.0861−0.11140.11670.07120.9947300.99400.0195
600.0535−0.12850.0829−0.08400.09460.06810.9939300.99280.0205
700.0601−0.12110.0409−0.09630.14870.06430.9903300.98900.0251
2 m/s400.0459−0.09460.04150.13000.19550.06580.9931350.99230.0215
500.0567−0.11660.05300.08810.11080.06470.9898360.98860.0259
600.0530−0.12640.08430.10580.12420.07530.9967360.99700.0157
700.0633−0.15090.05710.05710.06390.04630.9588300.95330.0446
* 95% confidence bounds.

References

  1. Chen, C.; Pan, Z. An overview of progress, challenges, needs and trends in mathematical modeling approaches in food drying. Dry. Technol. 2023, 41, 2586–2605. [Google Scholar] [CrossRef]
  2. Álvarez, S.; Álvarez, C.; Hamill, R.; Mullen, A.M.; O’Neill, E. Drying dynamics of meat highlighting areas of relevance to dry-aging of beef. Compr. Rev. Food Sci. Food Saf. 2021, 20, 5370–5392. [Google Scholar] [CrossRef] [PubMed]
  3. Baslar, M.; Yalınkılıc, B.; Erol, K.F.; Irkilmez, M.U. Evaluation of the Use of Vacuum-Dehydrated Minced Meat in Beef Patty Production. AgriEngineering 2024, 6, 1712–1724. [Google Scholar] [CrossRef]
  4. García-Pérez, J.; Carcel, J.; Mulet, A.; Riera, E.; Gallego-Juarez, J. Ultrasonic drying for food preservation. In Power Ultrasonics; Gallego-Juárez, J.A., Graff, K.F., Eds.; Woodhead Publishing: Cambridge, UK, 2015; pp. 875–910. [Google Scholar] [CrossRef]
  5. Mediani, A.; Hamezah, H.S.; Jam, F.A.; Mahadi, N.F.; Chan, S.X.Y.; Rohani, E.R.; Che Lah, N.H.; Azlan, U.K.; Khairul Annuar, N.A.; Azman, N.A.F.; et al. A comprehensive review of drying meat products and the associated effects and changes. Front. Nutr. 2022, 9, 1057366. [Google Scholar] [CrossRef]
  6. Ahmat, T.; Barka, M.; Aregba, A.W.; Bruneau, D. Convective Drying Kinetics of Fresh Beef: An Experimental and Modeling Approach. J. Food Process. Preserv. 2015, 39, 2581–2595. [Google Scholar] [CrossRef]
  7. Morales-Cruz, J.; Juárez-Canales, G.; Figueroa-González, J.; Mancillas-Medina, J. Evaluación de la Deshidratación solar en carne de cabra (Caprus dominiuniversi), determinación de su composición química y compararla con una comercial. Investig. Desarro. Cienc. Tecnol. Aliment. 2017, 2, 370–375. [Google Scholar]
  8. Chabbouh, M.; Hajji, W.; Ahmed, S.B.H.; Farhat, A.; Bellagha, S.; Sahli, A. Combined Effects of Osmotic Dehydration and Convective Air Drying on Kaddid Meats: Kinetics and Quality. Dry. Technol. 2011, 29, 1571–1579. [Google Scholar] [CrossRef]
  9. Aykin-Dinçer, E.; Kiliç-Büyükkurt, O.; Erbas, M. Influence of drying techniques and temperatures on drying kinetics and quality characteristics of beef slices. Heat Mass Transf. 2020, 56, 315–320. [Google Scholar] [CrossRef]
  10. Mewa, E.A.; Okoth, M.W.; Kunyanga, C.N.; Rugiri, M.N. Effect of drying air temperature and slice thickness on the physical and microbiological quality of dried beef. LWT 2018, 92, 484–489. [Google Scholar] [CrossRef]
  11. Kamiloğlu, A.; Elbir, T.; Dölek, M.; Eşrefoğlu, E.S. Comparative evaluation of different drying techniques for beef meat. J. Food Process Eng. 2023, 46, e14441. [Google Scholar] [CrossRef]
  12. Drãghici, O. Evaluation of mathematical models which describe the process of drying goat meat. Sci. Pap. Ser. 2021, 21, 237–240. Available online: https://managementjournal.usamv.ro/pdf/vol.21_1/volume_21_1_2021.pdf (accessed on 12 November 2024).
  13. Álvarez, S.; Álvarez, C.; Hamill, R.M.; O’Neill, E.; Mullen, A.M. Influence of meat sample geometry on dehydration dynamics during dry-aging of beef. Meat Sci. 2023, 202, 109216. [Google Scholar] [CrossRef] [PubMed]
  14. Zukál, E.; Incze, K. Drying. In Handbook of Meat Processing; Toldrá, F., Ed.; Wiley Blackwell: Hoboken, NJ, USA, 2010; pp. 219–229. [Google Scholar] [CrossRef]
  15. Nayak, A. A new regularization approach for numerical differentiation. Inverse Probl. Sci. Eng. 2020, 28, 1747–1772. [Google Scholar] [CrossRef]
  16. İrem Ş ahin, F.; Acaralı, N. Effective moisture diffusivity and activation energy during convective drying of bread containing clove oil/orange oil. J. Indian Chem. Soc. 2023, 100, 100952. [Google Scholar] [CrossRef]
  17. Barforoosh, M.Y.; Borghaee, A.M.; Rafiee, S.; Minaei, S.; Beheshti, B. Determining the effective diffusivity coefficient and activation energy in thin-layer drying of Haj Kazemi peach slices and modeling drying kinetics using ANFIS. Int. J. Low-Carbon Technol. 2024, 19, 192–206. [Google Scholar] [CrossRef]
  18. Crank, J. The Mathematics of Diffusion, 2nd ed.; Oxford University Press: London, UK, 1979. [Google Scholar]
  19. Juma Haydary, M.J.R.; Noori, A.W. Process conditions sensitive (PCS) thin-layer mathematical model of hot air convective drying. Chem. Eng. Commun. 2024, 211, 133–145. [Google Scholar] [CrossRef]
  20. Henderson, S. Progress in developing the thin layer drying equation. Trans. ASAE 1974, 17, 1167–1168. [Google Scholar] [CrossRef]
  21. Sharaf-Eldeen, Y.; Blaisdell, J.; Hamdy, M. A model for ear corn drying. Trans. ASAE 1981, 23, 1261–1265. [Google Scholar] [CrossRef]
  22. Demir, V.; Gunhan, T.; Yagcioglu, A. Mathematical modelling of convection drying of green table olives. Biosyst. Eng. 2007, 98, 47–53. [Google Scholar] [CrossRef]
  23. Verma, L.R.; Bucklin, R.; Endan, J.; Wratten, F. Effects of drying air parameters on rice drying models. Trans. ASAE 1985, 28, 296–0301. [Google Scholar] [CrossRef]
  24. Midilli, A.D.N.A.N.; Kucuk, H.A.Y.D.A.R.; Yapar, Z.İ.Y.A. A new model for single-layer drying. Dry. Technol. 2002, 20, 1503–1513. [Google Scholar] [CrossRef]
  25. Toğrul, İ.T.; Pehlivan, D. Mathematical modelling of solar drying of apricots in thin layers. J. Food Eng. 2002, 55, 209–216. [Google Scholar] [CrossRef]
  26. Henderson, S.; Pabis, S. Grain drying theory. I. Temperature effect on drying coefficients. J. Agric. Eng. Res. 1961, 6, 169–174. [Google Scholar]
  27. Popescu, M.; Iancu, P.; Plesu, V.; Bildea, C.S.; Manolache, F.A. Mathematical Modeling of Thin-Layer Drying Kinetics of Tomato Peels: Influence of Drying Temperature on the Energy Requirements and Extracts Quality. Foods 2023, 12, 3883. [Google Scholar] [CrossRef]
  28. Inyang, U.E.; Oboh, I.O.; Etuk, B.R. Kinetic models for drying techniques—Food materials. ACES 2018, 8, 27–48. [Google Scholar] [CrossRef]
  29. Dinçer, I.; Zamfirescu, C. Drying Phenomena: Theory and Applications; John Wiley & Sons: Hoboken, NJ, USA, 2016. [Google Scholar] [CrossRef]
  30. Bates, D.M.; Watts, D.G. Nonlinear Regression Analysis and Its Applications; Wiley: New York, NY, USA, 1988; Volume 2. [Google Scholar] [CrossRef]
  31. Jarantow, S.W.; Pisors, E.D.; Chiu, M.L. Introduction to the use of linear and nonlinear regression analysis in quantitative biological assays. Curr. Protoc. 2023, 3, e801. [Google Scholar] [CrossRef]
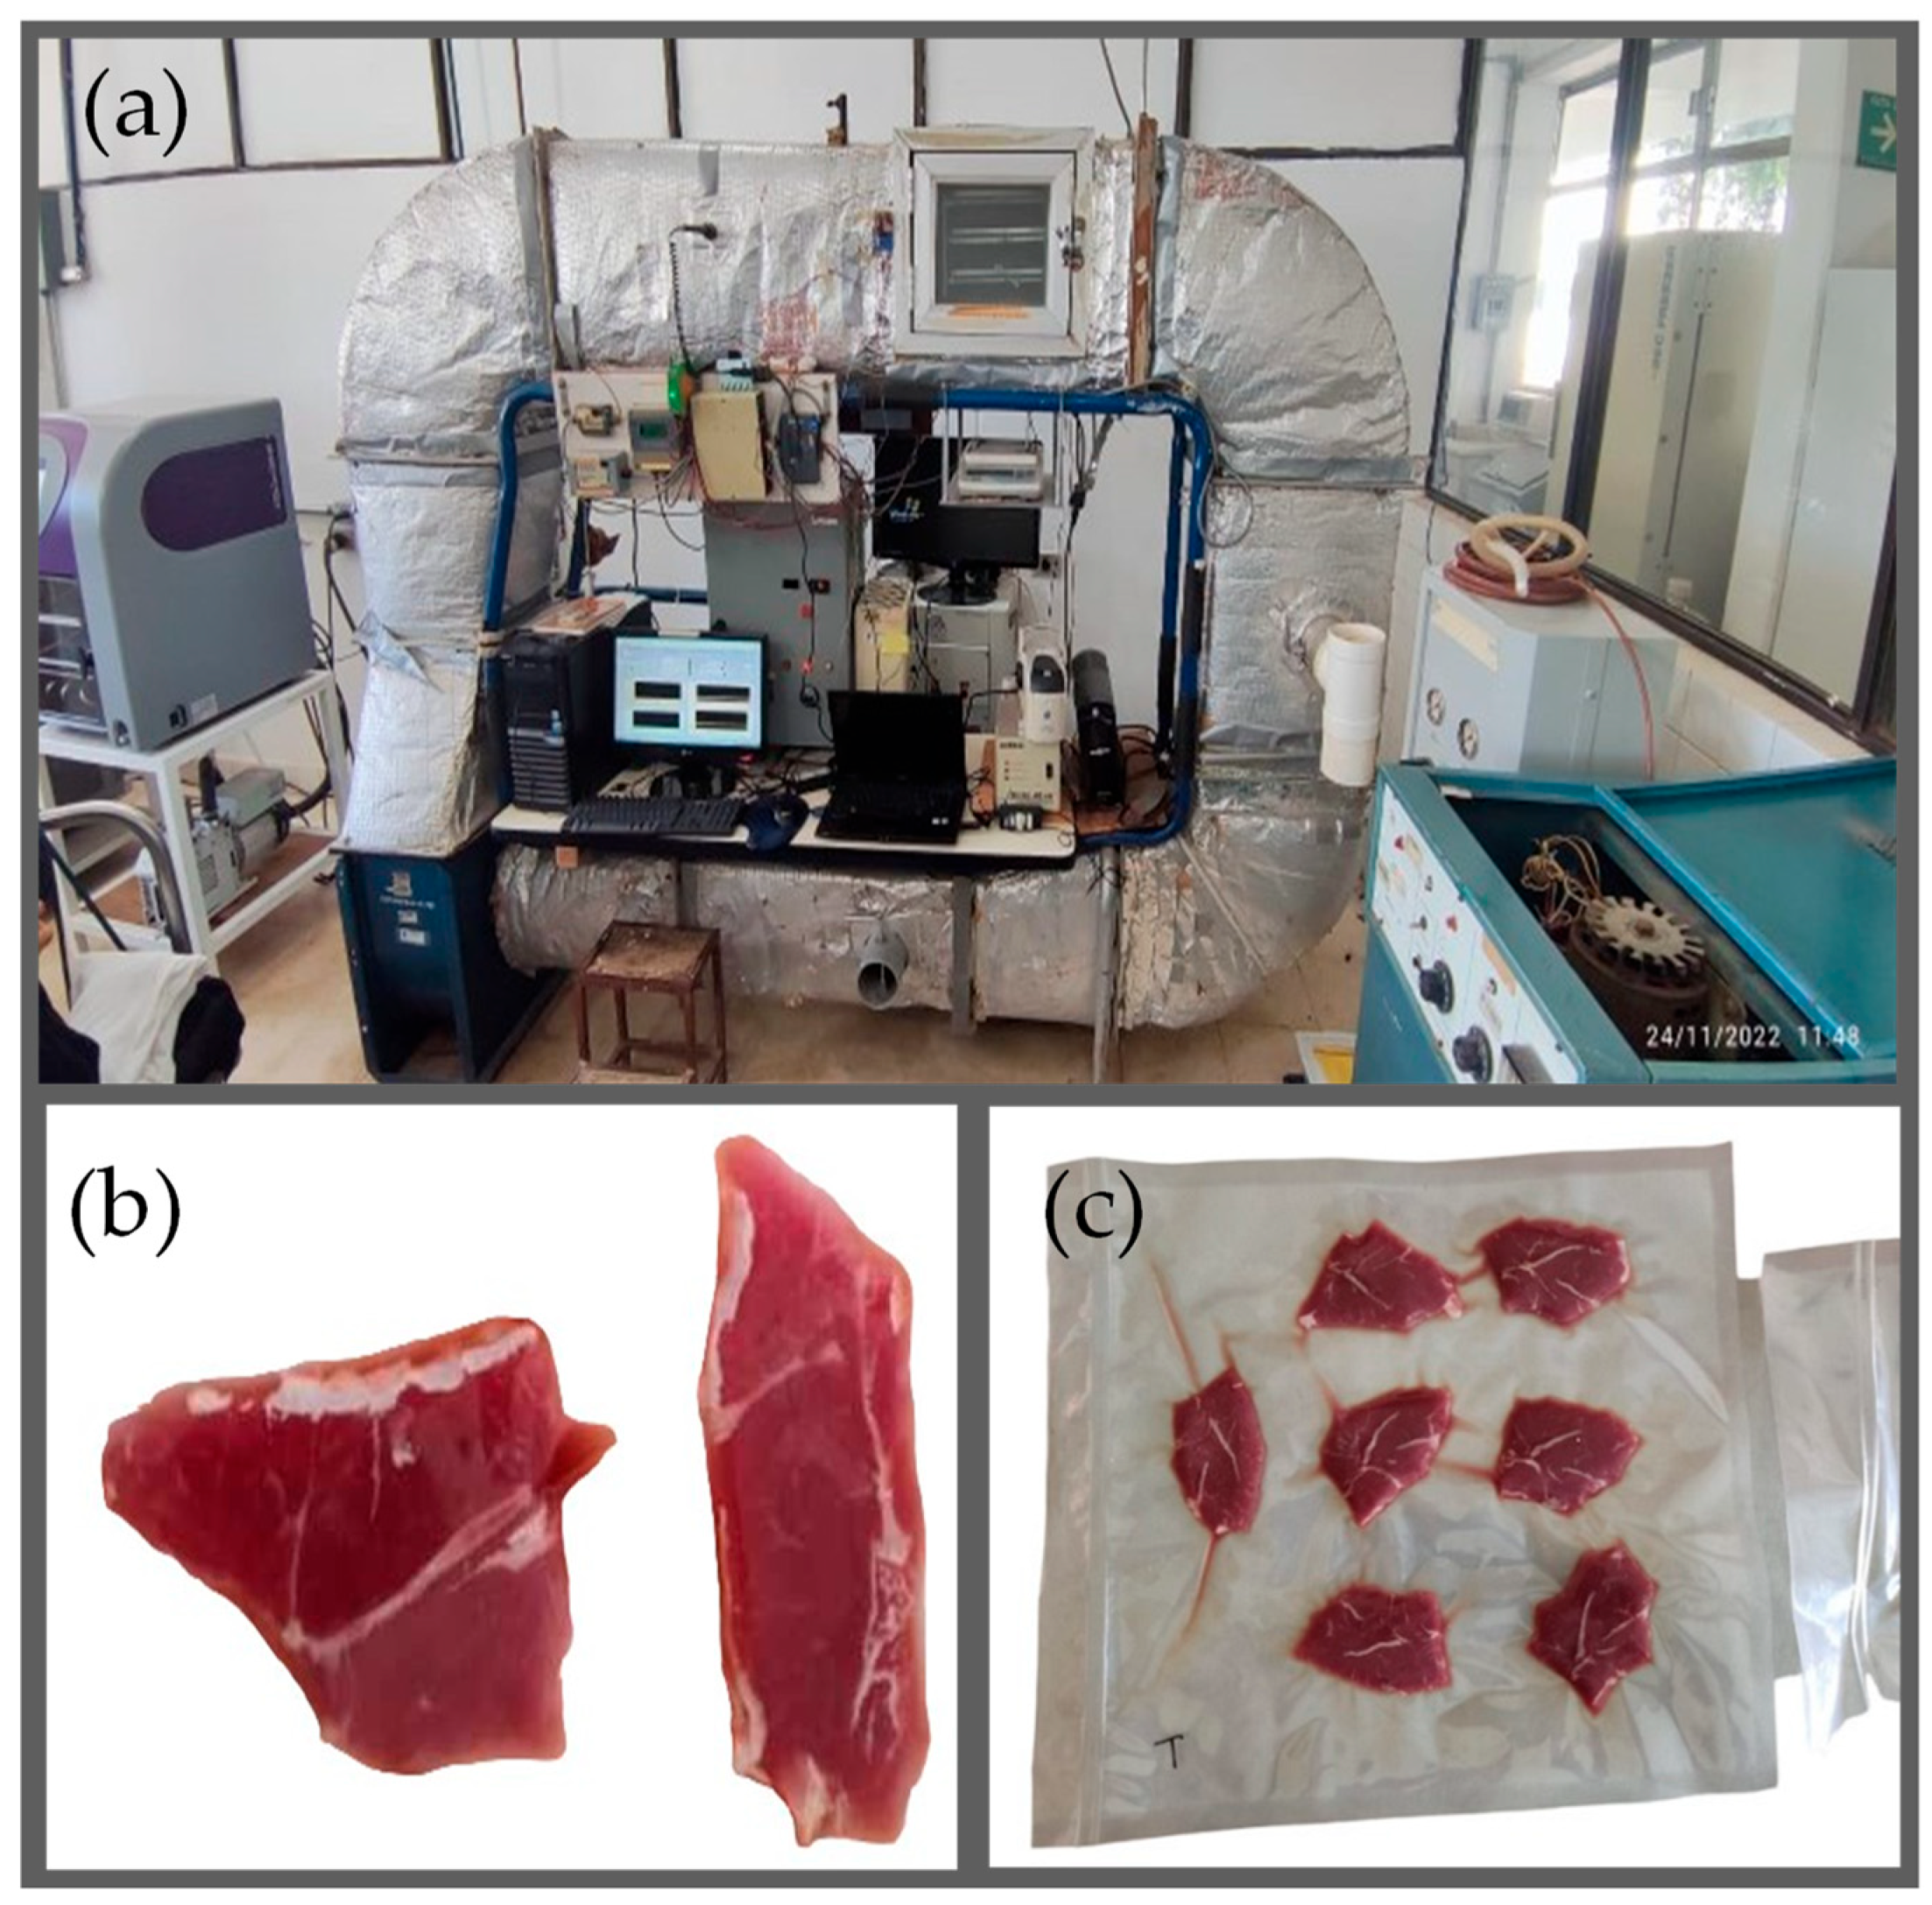
Figure 1. Drying facility and sample preparation. (a) Tunnel dryer. (b) Standard cut. (c) Vacuum packaging.
Foods 13 03836 g001
Figure 2. Drying kinetics for experiments at v = 1 m/s.
Foods 13 03836 g002
Figure 3. Drying rate for experiments at v=1 m/s.
Foods 13 03836 g003
Figure 4. Thermal oscillations for experiments at v = 1 m/s.
Foods 13 03836 g004
Figure 5. Drying kinetics for experiments at v = 2 m/s.
Foods 13 03836 g005
Figure 6. Drying rate for experiments at v = 2 m/s.
Foods 13 03836 g006
Figure 7. Thermal oscillations for experiments at v = 2 m/s.
Foods 13 03836 g007
Figure 8. Reduced moisture content as a function of time at v = 1 m/s. Comparison of experimental data with three mathematical drying models: at a central temperature of (a) Tc = 40 °C; (b) Tc = 50 °C; (c) Tc = 60 °C; (d) Tc = 70 °C.
Foods 13 03836 g008
Figure 9. Reduced moisture content as a function of time at v = 2 m/s. Comparison of experimental data with three mathematical drying models: at a central temperature of (a) Tc = 40 °C; (b) Tc = 50 °C; (c) Tc = 60 °C; (d) Tc = 70 °C.
Foods 13 03836 g009
Figure 10. Reduced moisture content as a function of time at v = 1 m/s. Comparison of experimental data with the Heuristic+ R 1 + θ model: at a central temperature of (a) Tc = 40 °C; (b) Tc = 50 °C; (c) Tc = 60 °C; (d) Tc = 70 °C.
Foods 13 03836 g010
Figure 11. Reduced moisture content as a function of time at v = 2 m/s. Comparison of experimental data with the Heuristic+ R 1 + θ model: at a central temperature of (a) Tc = 40 °C; (b) Tc = 50 °C; (c) Tc = 60 °C; (d) Tc = 70 °C.
Foods 13 03836 g011
Table 1. Mathematical drying models used in the current study.
ModelNameEquationReferences
M1Two-term MR = a exp k 1 t + b exp k 2 t [20]
Special case Two-term exponential: b = 1 a ,   k = k 1 ,   k 2 = k 1 a [21]
Diffusion: b = 1 a ,   k = k 1 ,   k 2 = k 1 b [22]
Verma et al.: b = 1 a ,   k = k 1 ,   k 2 = g [23]
M2Midilli
(Extended)
MR = a exp k t n + b t m [24]
Logarithmic: n = 1 ,   m = 0 [25]
Henderson and Pabis: n = 1 ,   b = 0 [26]
Special case Page: a = 1 ,   b = 0 [27]
Modified Page: a = 1 ,   b = 0 ,   k k n [27]
Newton/Lewis: a = 1 ,   b = 0 ,   n = 1 [27,28]
M3Polynomial MR = a 0 + a 1 t 1 + a 2 t 2 + + a N 1 t N 1 + a N t N
Special case Wang and Singh: a 0 = 1 ,   a 1 = a ,   a 2 = b ,   a k = 0   k > 2 [28]
M4Heuristic+ R 1 MR = 8 π 2 exp a 0 t + 1 9 exp 9 a 0 t + R 2 R 1 t Current
study
with R 2 = 0.1226
M5Heuristic+ R 1 + θ MR = 8 π 2 exp R 3 f θ t + 1 9 exp 9 R 3 f θ t + R 2 R 1 t Current
study
with R 2 = 0.1226   , f θ = 1 + θ A θ 0 θ θ 0 1 .
Table 2. Mathematical meat drying models used in the current study restricted to MR(t=0) = 1. Heuristic models satisfy this condition.
ModelNameEquationParameter
M1Two-Term MR = 1 b exp k 1 t + b exp k 2 t a = 1 b
M2Midilli
(Extended)
MR = exp k t n + b t m a = 1
M3Polynomial MR = 1 + a 1 t 1 + a 2 t 2 + + a N 1 t N 1 + a N t N a 0 = 1
Table 3. Diffusion coefficient D (10−9 m2 s−1).
Air VelocityCoefficientsCentral Drying Temperature Tc (°C)
40506070
1   m s k 1 / k 2 0.150.110.080.11
b 0.770.800.820.71
D 7–2014–4016–4412–33
2   m s k 1 / k 2 0.060.113.940.11
b 0.770.740.280.62
D 0.9–31–35–152–6
Disclaimer/Publisher’s Note: The statements, opinions and data contained in all publications are solely those of the individual author(s) and contributor(s) and not of MDPI and/or the editor(s). MDPI and/or the editor(s) disclaim responsibility for any injury to people or property resulting from any ideas, methods, instructions or products referred to in the content.