

Protein and Oil Contents, Micro- and Macronutrients, and Other Quality Indicators of Soybean Cultivated in Lowland Fields

 and
and 
Abstract
1. Introduction
2. Materials and Methods
2.1. Experiments in the Lowland Fields
2.2. Analyses of Quality Indicators
2.2.1. Moisture
2.2.2. Oil
2.2.3. Oil Composition
2.2.4. Acidity Index
- V—volume of sodium hydroxide (NaOH) used in the titration;
- N—normality of the NaOH solution;
- f—correction factor of the sodium hydroxide (NaOH) solution.
2.2.5. Peroxide Index
- A—volume of sodium thiosulfate used in the sample titration;
- B—volume of sodium thiosulfate used in the blank titration;
- N—normality of the sodium thiosulfate solution;
- f—correction factor of the sodium thiosulfate solution;
- M—mass of the sample.
2.2.6. Iodine Index
- VB—volume used in the blank titration;
- VA—volume used in the sample titration;
- f—sodium thiosulfate correction factor;
- MMKI—molecular mass of potassium iodide;
- M—mass of the sample.
2.2.7. Saponification Index
- VA—volume used in sample titration;
- VB—volume used in blank titration;
- f—correction factor of the HCL solution;
- M—mass of the sample.
2.2.8. Protein
2.2.9. Ash
2.2.10. Carbohydrates
2.2.11. Nutrients
2.2.12. Statistical Analysis
3. Results
3.1. Moisture
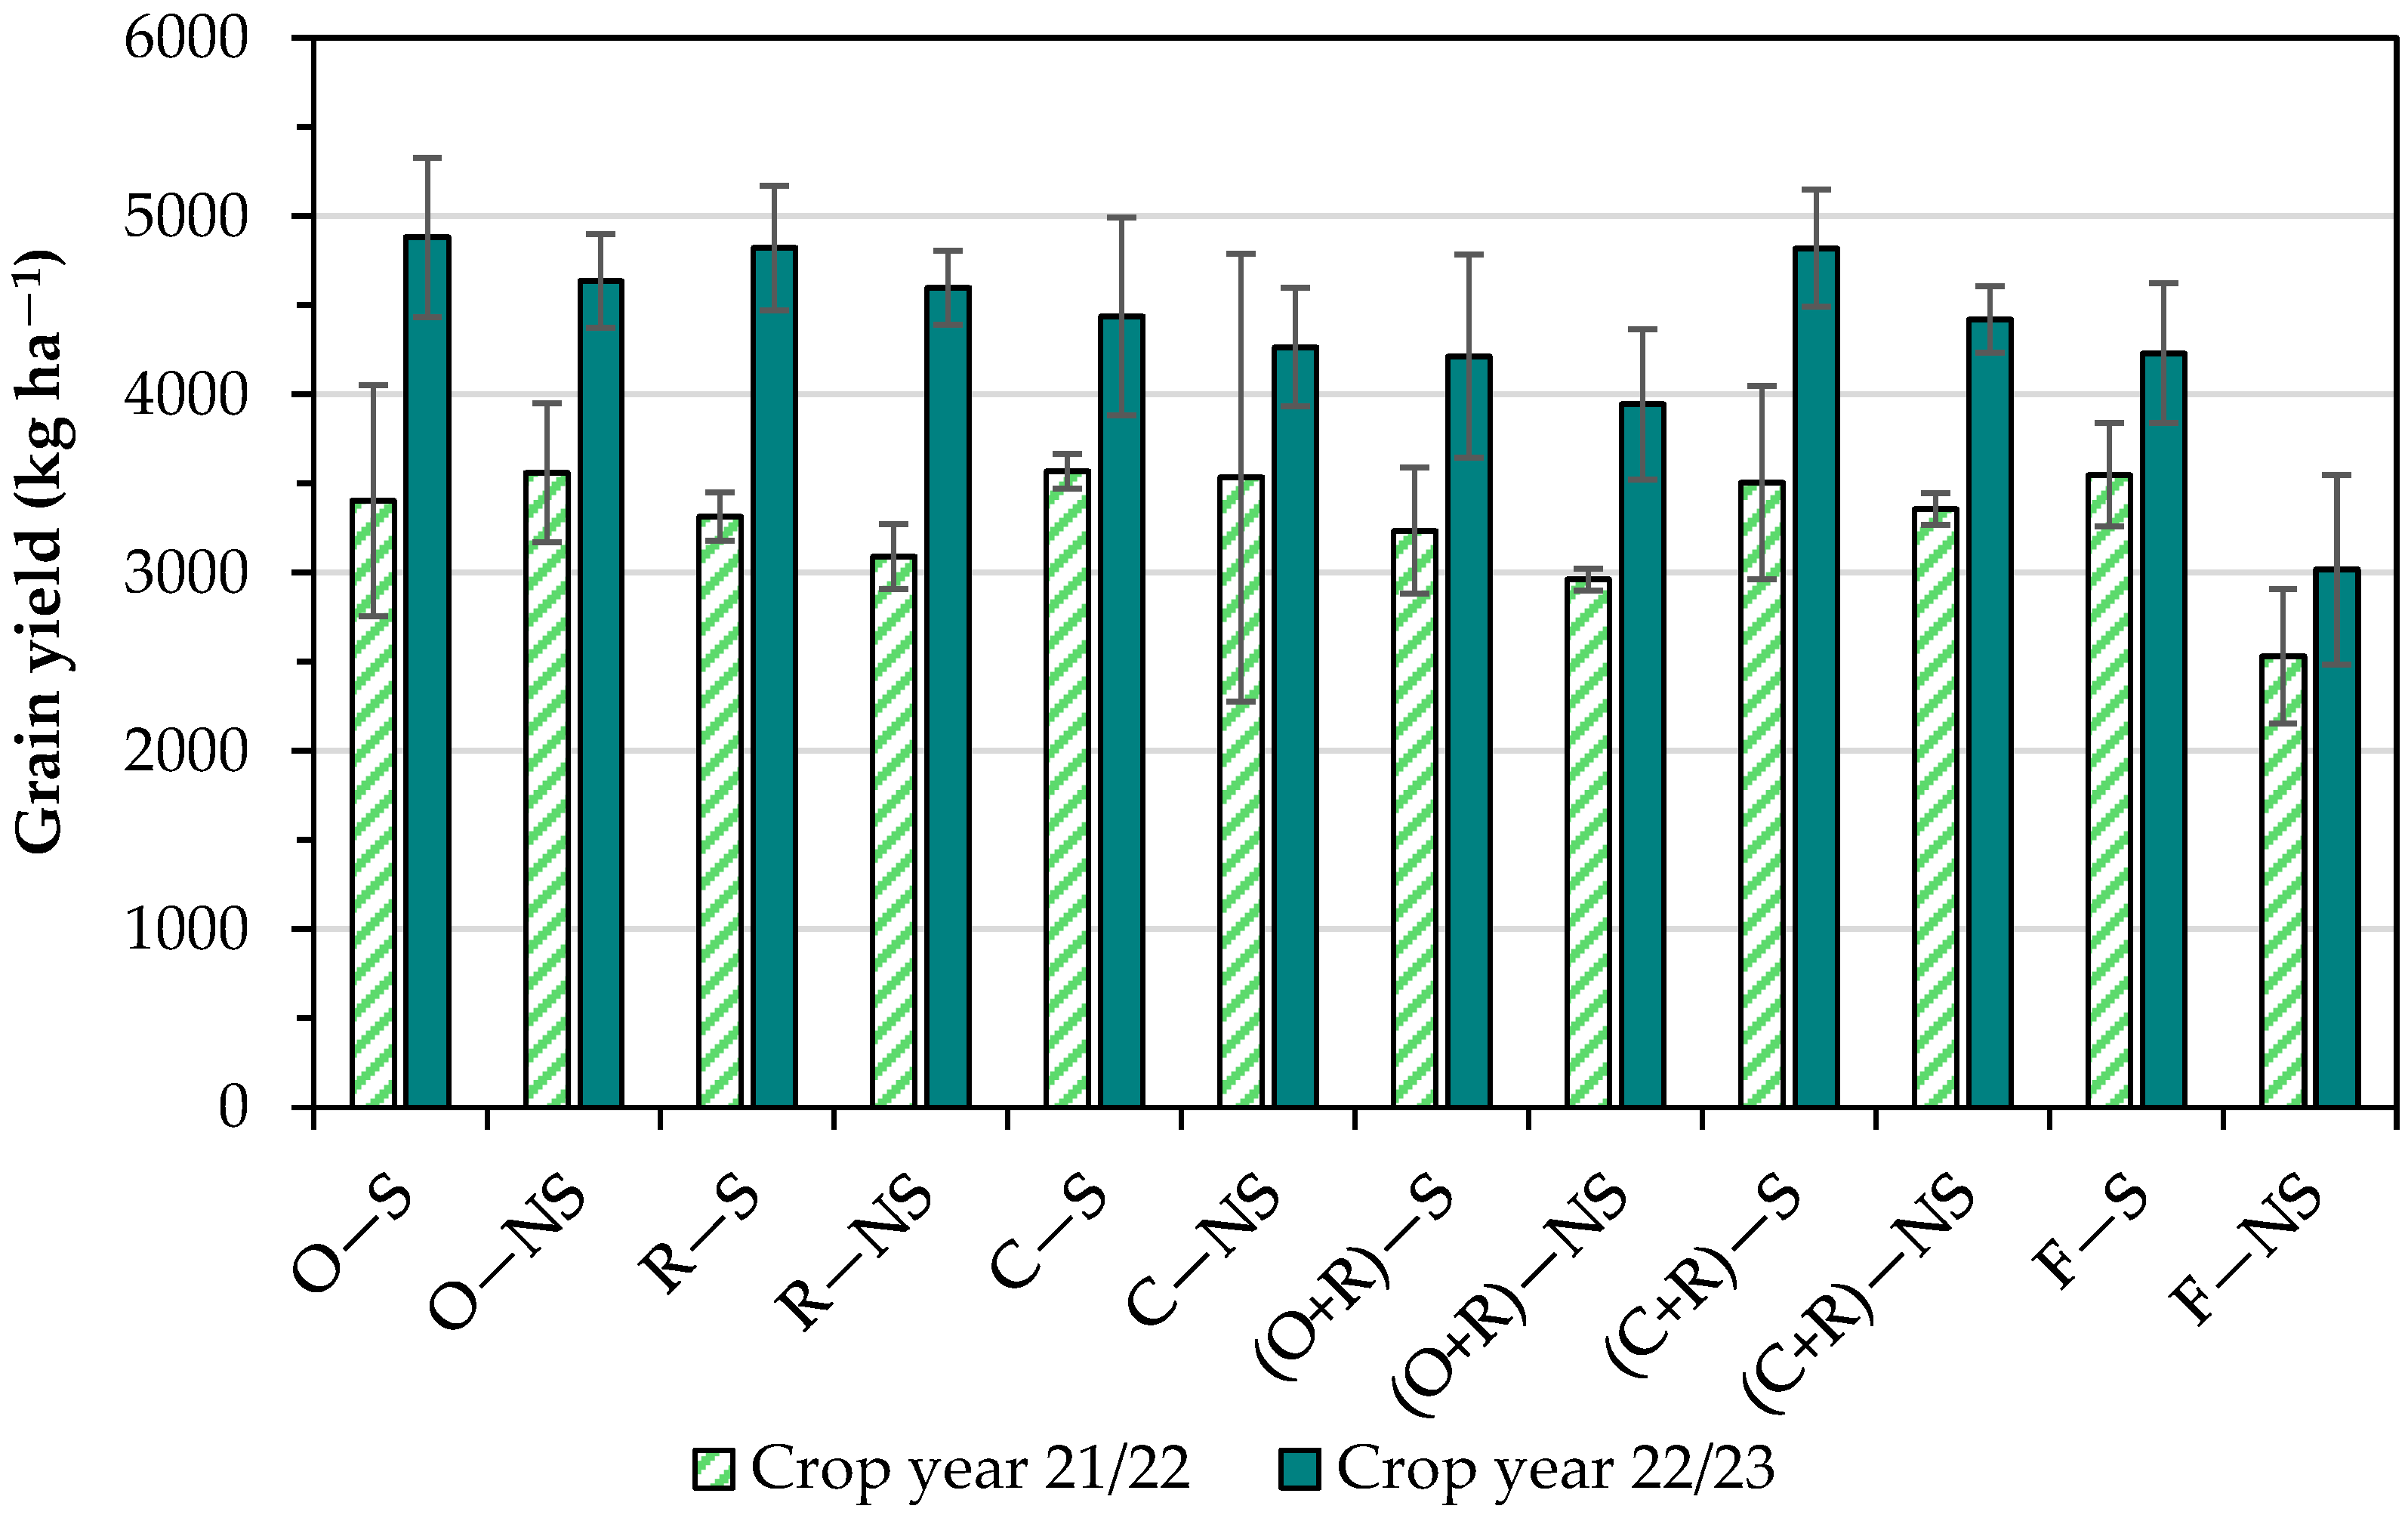
3.2. Grain Yield
3.3. Quality Indicators
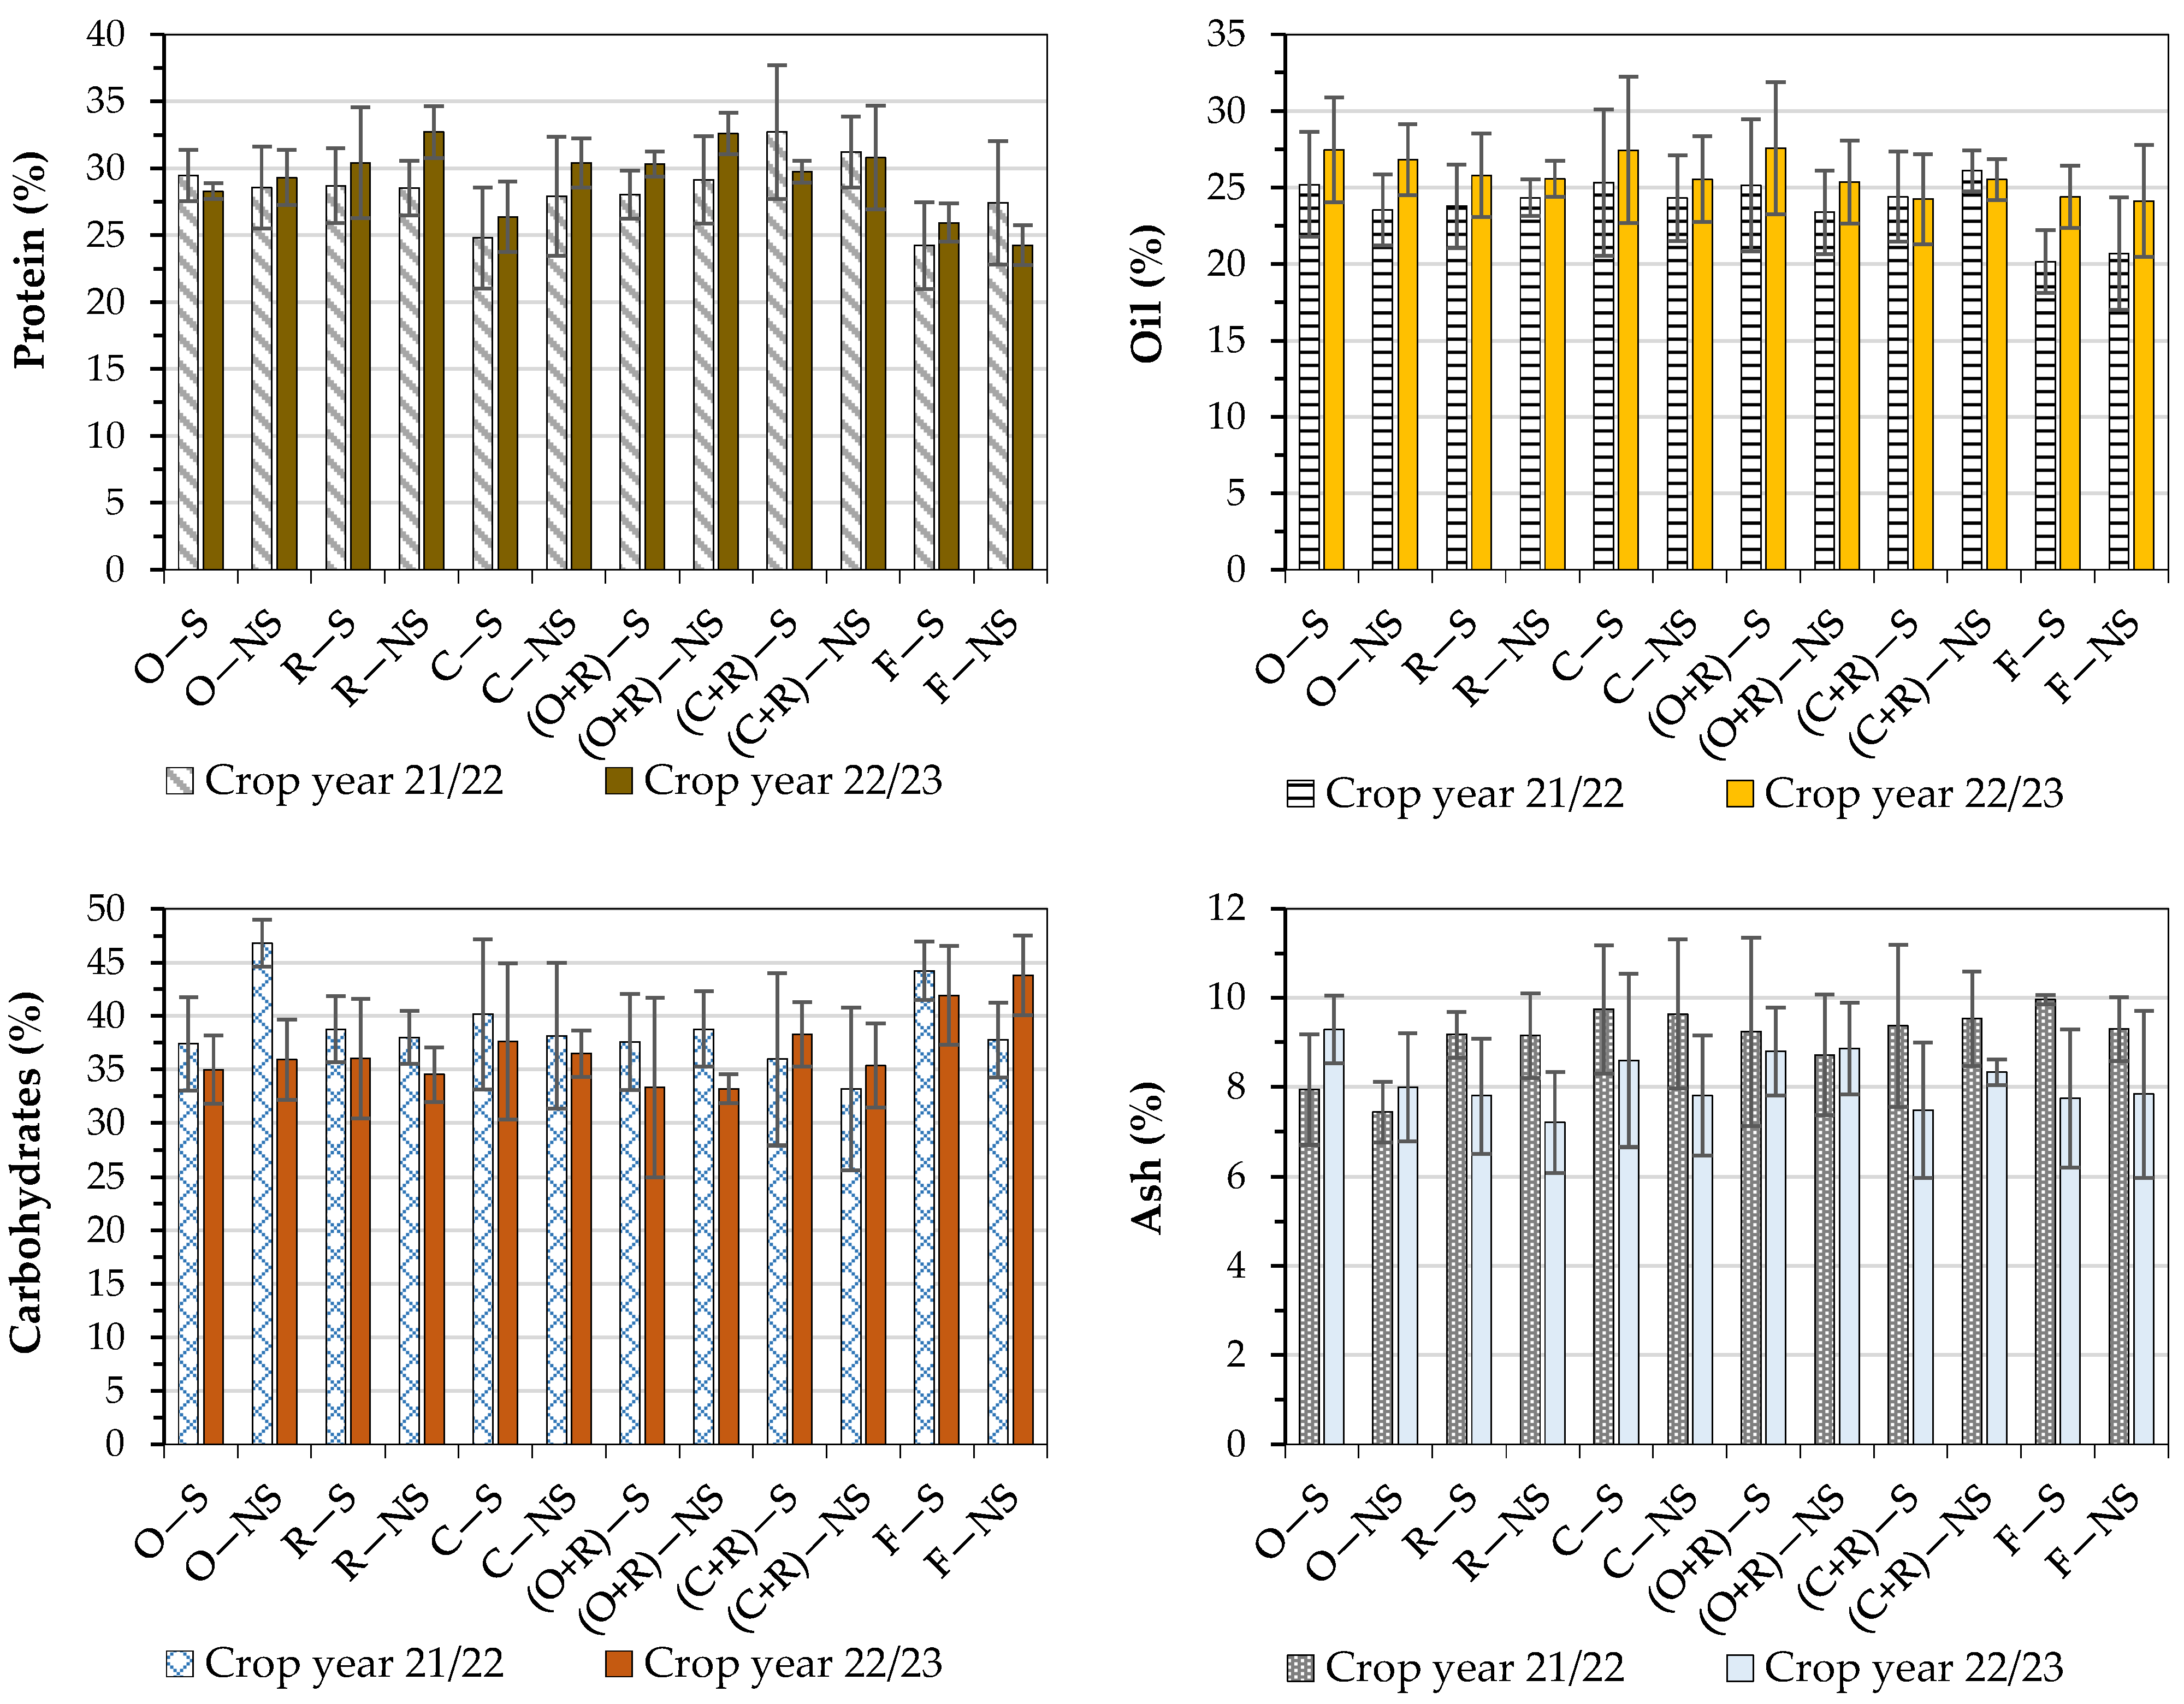
3.3.1. Proteins
3.3.2. Oil
3.3.3. Ash
3.3.4. Carbohydrates
3.3.5. Fatty Acids in the Oil
3.3.6. Acidity Index of Oil
3.3.7. Peroxide Index of Oil
3.3.8. Iodine Index of Oil
3.3.9. Saponification Index of Oil
3.3.10. Nutrients
4. Discussion
5. Conclusions
Author Contributions
Funding
Institutional Review Board Statement
Informed Consent Statement
Data Availability Statement
Acknowledgments
Conflicts of Interest
References
- Jung, J.W.; Park, S.Y.; Oh, S.D.; Jang, Y.; Suh, S.J.; Park, S.K.; Ha, S.H.; Kim, J.K. Metabolomic Variability of Different Soybean Genotypes: β-Carotene-Enhanced (Glycine max), Wild (Glycine soja), and Hybrid (Glycine max × Glycine soja) Soybeans. Foods 2022, 10, 2421. [Google Scholar] [CrossRef]
- Oilseeds: World Markets and Trade—United States Department of Agriculture. Available online: https://apps.fas.usda.gov/psdonline/circulars/oilseeds.pdf (accessed on 5 August 2024).
- Quédraogo, E.R.; Konaté, K.; Sanou, A.; Sama, H.; Compaoré, E.W.R.; Sytar, O.; Hilou, A.; Brestic, M.; Dicko, M.H. Assessing the Quality of Burkina Faso Soybeans Based on Fatty Acid Composition and Pesticide Residue Contamination. Molecules 2022, 27, 6260. [Google Scholar] [CrossRef] [PubMed]
- Szpunar-Krok, E.; Wondołowska-Grabowska, A. Quality Evaluation Indices for Soybean Oil in Relation to Cultivar, Application of N Fertiliser and Seed Inoculation with Bradyrhizobium japonicum. Foods 2022, 11, 762. [Google Scholar] [CrossRef] [PubMed]
- Deng, L. Current Progress in the Utilization of Soy-Based Emulsifiers in Food Applications—A Review. Foods 2021, 10, 1354. [Google Scholar] [CrossRef] [PubMed]
- Jung, K.C.; Kim, B.Y.; Kim, M.J.; Kim, N.K.; Kim, Y.H.; Park, H.M.; Jang, H.S.; Shin, H.C.; Kim, T.J. Development of a Gene-Based Soybean-Origin Discrimination Method Using Allele-Specific Polymerase Chain Reaction. Foods 2023, 12, 4497. [Google Scholar] [CrossRef]
- Ody, L.P.; Baisch, J.S.; Ugalde, G.; Grohs, M.; Dorneles, A.B.; Neu, G.R.F.; Santos, M.S.N.; Ferreira, P.A.A.; Tres, M.V.; Zabot, G.L. Early Sowing and Soil Scarification Improve Protein and Oil Contents in Soybean Grains Cultivated in Lowlands. J. Soil Sci. Plant Nutr. 2024, 24, 1015–1029. [Google Scholar] [CrossRef]
- Pokhrel, S.; Kingery, W.L.; Cox, M.S.; Shankle, M.W.; Shanmugam, S.G. Impact of Cover Crops and Poultry Litter on Selected Soil Properties and Yield in Dryland Soybean Production. Agronomy 2021, 11, 119. [Google Scholar] [CrossRef]
- Confortin, T.C.; Todero, I.; Luft, L.; Ugalde, G.A.; Mazutti, M.A.; Oliveira, Z.B.; Bottega, E.L.; Knies, A.E.; Zabot, G.L.; Tres, M.V. Oil yields, protein contents, and cost of manufacturing of oil obtained from different hybrids and sowing dates of canola. J. Environ. Chem. Eng. 2019, 7, 102972. [Google Scholar] [CrossRef]
- Visentainer, J.V. Analytical aspects of the fame ionization detector response of fatty acid esters in biodiesels and foods. Quim. Nova 2012, 35, 274–279. [Google Scholar] [CrossRef]
- Tedesco, M.; Gianello, C.; Bissani, C.A.; Bohnen, H.; VolkWeiss, S.J. Análises de solo, plantas e outros materiais. Bol. Tec. Solos 1995, 5, 1–170. (In Portuguese) [Google Scholar]
- Oliveira, M.A.; Lorini, I.; Mandarino, J.M.G.; Benassi, V.T.; França-Neto, J.B.; Henning, A.A.; Krzyzanowski, F.C.; Henning, F.A.; Hirakuri, M.H.; Leite, R.S.; et al. Índice de acidez titulável dos grãos de soja colhidos nas safras 2015/2016 e 2016/17 no Brasil. In Proceedings of the VIII Congresso Brasileiro de Soja, Goiânia, Brazil, 11–14 June 2018; pp. 58–60. (In Portuguese). [Google Scholar]
- Instrução Normativa 49/2006—Ministério da Agricultura, Pecuária e Abastecimento. Available online: https://sistemasweb.agricultura.gov.br/sislegis/action/detalhaAto.do?method=visualizarAtoPortalMapa&chave=643062246 (accessed on 4 October 2024). (In Portuguese)
- Meert, L.; Fernandes, F.B.; Müller, M.M.; Rizzardi, D.A.; Espindola, J.S. Coinoculation with Bradyrhizobium japonicum and Azospirillum brasilense on soybean crop. Agron. Crop J. 2020, 29, 118–129. [Google Scholar] [CrossRef]
- Mulazzani, R.P.; Boeno, D.; Ribeiro, B.S.; Alves, A.F.; Zanon, A.J.; Gubiani, P.I. Chemical constraints are the major limiting factor of root deepening in southern Brazil soils. Geoderma Reg. 2024, 38, e00825. [Google Scholar] [CrossRef]
- Toleikiene, M.; Slepetys, J.; Sarunaite, L.; Lazauskas, S.; Deveikyte, I.; Kadziuliene, Z. Soybean Development and Productivity in Response to Organic Management above the Northern Boundary of Soybean Distribution in Europe. Agronomy 2021, 11, 214. [Google Scholar] [CrossRef]
- Grün, E.; Alves, A.F.; Silva, A.L.; Zanon, A.J.; Corrêa, A.R.; Leichtweis, E.M.; Neto, R.C.; Ulguim, A.R. How Do Off-Season Cover Crops Affect Soybean Weed Communities? Agriculture 2024, 14, 1509. [Google Scholar] [CrossRef]
- Wang, J.; Hong, H.; Yan, X.; Nan, J.; Lu, Q.; Gu, Y.; Qiu, L. Stability Evaluation for Main Quality Traits of Soybean in the Northeast and Huang-Huai-Hai Regions. Agronomy 2024, 14, 872. [Google Scholar] [CrossRef]
- Ramos, P.R.; Rodrigues, L.C.; Zabot, G.L.; Oliveira, A.L. Extraction of soybean oil with pressurized ethanol: Prospects for a new processing approach with analysis of the physical properties of crude oil and implementation costs through scale-up in an intermittent process. Processes 2024, 12, 2224. [Google Scholar] [CrossRef]
- Martínez, M.L.; Marín, M.A.; Ribotta, P.D. Optimization of soybean heat-treating using a fluidized bed dryer. J. Food Sci. Technol. 2013, 50, 1144–1150. [Google Scholar] [CrossRef]
- Domínguez-Murillo, A.C.; Urías-Silvas, J.E. Plant-based milk substitutes as probiotic vehicles: Health effect and survival, a review. Food Chem. Adv. 2024, 5, 100830. [Google Scholar] [CrossRef]
- Di, Q.; Piersanti, A.; Zhang, Q.; Miceli, C.; Li, H.; Liu, X. Genome-Wide Association Study Identifies Candidate Genes Related to the Linoleic Acid Content in Soybean Seeds. Int. J. Mol. Sci. 2022, 23, 454. [Google Scholar] [CrossRef]
- Kim, W.G.; Kang, B.H.; Kang, S.; Shin, S.; Chowdhury, S.; Jeong, S.C.; Choi, M.S.; Park, S.K.; Moon, J.K.; Ryu, J.; et al. A Genome-Wide Association Study of Protein, Oil, and Amino Acid Content in Wild Soybean (Glycine soja). Plants 2023, 12, 1665. [Google Scholar] [CrossRef]
- Oliveira, M.B.; Pogorzelski, E.S.; Pfeifemberg, R.; Knies, A.E.; Oliveira, Z.B.; Santos, M.S.N.; Zabot, G.L.; Tres, M.V. Analysis of the cultivation of canola hybrids at different sowing dates. Acta Sci. 2024, 46, e67694. [Google Scholar] [CrossRef]
- Cubukcu, P. Determination oil and fatty acid profiles of selected soybean (Glycine max L.) cultivars under second crop condition in eats Mediterranean agroecology. Turkish J. Field Crops 2023, 28, 82–177. [Google Scholar] [CrossRef]
- Arab, R.; Casal, S.; Pinho, T.; Cruz, R.; Freidja, M.L.; Lorenzo, J.M.; Hano, C.; Madani, K.; Boulekbache-Makhlouf, L. Effects of Seed Roasting Temperature on Sesame Oil Fatty Acid Composition, Lignan, Sterol and Tocopherol Contents, Oxidative Stability and Antioxidant Potential for Food Applications. Molecules 2022, 27, 4508. [Google Scholar] [CrossRef] [PubMed]
- Pasha, M.K.; Dai, L.; Liu, D.; Guo, M.; Du, W. An overview to process design, simulation and sustainability evaluation of biodiesel production. Biotechnol. Biofuels Bioprod. 2021, 14, 129. [Google Scholar] [CrossRef] [PubMed]
- Fonseca, A.F.; Neves, E.; Dipple, F.L.; Lima, T.C. Correlation between productivity and centesimal composition of soybean cultivars. Sci. Electron. Arch. 2020, 13, 54–58. [Google Scholar] [CrossRef]


| Code | Meaning |
|---|---|
| O − S | Oat (cover crop)—Scarified (soil preparation) |
| O − NS | Oat (cover crop)—Non-scarified (soil preparation) |
| R − S | Ryegrass (cover crop)—Scarified (soil preparation) |
| R − NS | Ryegrass (cover crop)—Non-scarified (soil preparation) |
| C − S | Clover (cover crop)—Scarified (soil preparation) |
| C − NS | Clover (cover crop)—Non-scarified (soil preparation) |
| (O + R) − S | Oat + Ryegrass (cover crop)—Scarified (soil preparation) |
| (O + R) − NS | Oat + Ryegrass (cover crop)—Non-scarified (soil preparation) |
| (C + R) − S | Clover + Ryegrass (cover crop)—Scarified (soil preparation) |
| (C + R) − NS | Clover + Ryegrass (cover crop)—Non-scarified (soil preparation) |
| F − S | Fallow (control)—Scarified (soil preparation) |
| F − NS | Fallow (control)—Non-scarified (soil preparation) |
| Treatment | Crop Year 21/22 | Crop Year 22/23 |
|---|---|---|
| Moisture (%) | ||
| O − S | 8.14 ± 0.79 | 11.02 ± 0.21 |
| O − NS | 8.04 ± 0.55 | 11.75 ± 1.44 |
| R − S | 7.62 ± 0.26 | 13.03 ± 0.83 |
| R − NS | 8.64 ± 0.85 | 11.59 ± 1.65 |
| C − S | 7.92 ± 0.54 | 11.55 ± 1.27 |
| C − NS | 8.71 ± 0.65 | 11.57 ± 1.10 |
| (O + R) − S | 8.26 ± 0.92 | 12.05 ± 1.10 |
| (O + R) − NS | 8.58 ± 0.64 | 10.70 ± 0.53 |
| (C + R) − S | 8.72 ± 0.33 | 12.26 ± 0.59 |
| (C + R) − NS | 8.92 ± 0.03 | 11.41 ± 1.01 |
| F − S | 7.67 ± 0.40 | 11.02 ± 0.30 |
| F − NS | 8.03 ± 0.51 | 11.60 ± 1.06 |
| Treatment | Fatty Acids (%) * | ||||
|---|---|---|---|---|---|
| C14:0 | C15:0 | C16:0 | C16:1 | C17:0 | |
| O − S | 0.09 ± 0.01 | 0.01 ± 0.01 | 11.70 ± 0.34 | 0.09 ± 0.01 | 0.06 ± 0.01 |
| O − NS | 0.10 ± 0.05 | 0.01 ± 0.01 | 13.07 ± 0.17 | 0.08 ± 0.01 | 0.08 ± 0.01 |
| R − S | 0.14 ± 0.02 | 0.02 ± 0.01 | 11.55 ± 0.39 | 0.09 ± 0.02 | 0.08 ± 0.01 |
| R − NS | 0.09 ± 0.01 | 0.01 ± 0.01 | 14.85 ± 0.82 | 0.10 ± 0.05 | 0.10 ± 0.02 |
| C − S | 0.09 ± 0.03 | 0.02 ± 0.01 | 14.98 ± 0.32 | 0.08 ± 0.02 | 0.10 ± 0.02 |
| C − NS | 0.08 ± 0.01 | 0.03 ± 0.01 | 12.58 ± 1.10 | 0.07 ± 0.01 | 0.09 ± 0.01 |
| (O + R) − S | 0.08 ± 0.01 | 0.02 ± 0.01 | 14.74 ± 1.07 | 0.06 ± 0.02 | 0.06 ± 0.02 |
| (O + R) − NS | 0.08 ± 0.01 | 0.01 ± 0.01 | 17.10 ± 1.23 | 0.10 ± 0.03 | 0.09 ± 0.01 |
| (C + R) − S | 0.08 ± 0.01 | 0.06 ± 0.02 | 12.36 ± 0.54 | 0.07 ± 0.01 | 0.08 ± 0.01 |
| (C + R) − NS | 0.14 ± 0.06 | 0.01 ± 0.01 | 19.53 ± 1.94 | 0.11 ± 0.06 | 0.12 ± 0.03 |
| F − S | 0.24 ± 0.04 | 0.05 ± 0.02 | 17.72 ± 1.22 | 0.08 ± 0.02 | 0.09 ± 0.02 |
| F − NS | 0.07 ± 0.01 | 0.03 ± 0.01 | 12.51 ± 1.28 | 0.08 ± 0.01 | 0.08 ± 0.01 |
| Treatment | C18:0 | C18:1n9 cis/trans | C18:2n6 cis/trans | C18:3n3 | C20:0 |
| O − S | 3.98 ± 0.60 | 23.79 ± 1.80 | 52.18 ± 1.58 | 6.23 ± 0.77 | 0.38 ± 0.03 |
| O − NS | 4.85 ± 1.37 | 24.74 ± 2.56 | 49.44 ± 1.53 | 5.59 ± 1.47 | 0.64 ± 0.07 |
| R − S | 4.11 ± 0.54 | 24.75 ± 0.62 | 51.82 ± 1.22 | 5.99 ± 0.44 | 0.37 ± 0.11 |
| R − NS | 5.34 ± 1.25 | 25.47 ± 1.64 | 46.28 ± 1.93 | 5.05 ± 0.91 | 0.81 ± 0.05 |
| C − S | 5.41 ± 1.01 | 23.46 ± 2.74 | 45.62 ± 2.07 | 4.74 ± 0.42 | 0.83 ± 0.06 |
| C − NS | 4.82 ± 0.23 | 25.67 ± 1.23 | 49.52 ± 1.76 | 5.21 ± 0.56 | 0.53 ± 0.13 |
| (O + R) − S | 5.42 ± 1.00 | 24.76 ± 2.10 | 47.16 ± 1.83 | 4.89 ± 0.68 | 0.79 ± 0.14 |
| (O + R) − NS | 6.00 ± 1.31 | 23.62 ± 2.48 | 42.70 ± 2.03 | 4.63 ± 0.94 | 1.27 ± 0.12 |
| (C + R) − S | 4.47 ± 0.38 | 24.95 ± 2.32 | 48.96 ± 1.98 | 4.46 ± 1.87 | 0.38 ± 0.04 |
| (C + R) − NS | 6.29 ± 1.88 | 23.89 ± 1.84 | 40.68 ± 2.36 | 4.95 ± 1.10 | 1.73 ± 0.13 |
| F − S | 5.62 ± 1.87 | 23.23 ± 2.52 | 45.34 ± 2.23 | 5.03 ± 1.54 | 1.10 ± 0.18 |
| F − NS | 4.42 ± 0.36 | 24.94 ± 1.45 | 49.32 ± 2.21 | 5.42 ± 0.32 | 0.42 ± 0.07 |
| Treatment | C20:1n9 | C20:3n6 | C20:5n3 | C22:0 | C24:0 |
| O − S | 0.16 ± 0.03 | 0.05 ± 0.01 | 0.35 ± 0.05 | 0.57 ± 0.10 | 0.15 ± 0.01 |
| O − NS | 0.19 ± 0.05 | 0.03 ± 0.01 | 0.40 ± 0.15 | 0.52 ± 0.12 | 0.21 ± 0.07 |
| R − S | 0.15 ± 0.05 | 0.02 ± 0.01 | 0.30 ± 0.10 | 0.40 ± 0.08 | 0.17 ± 0.02 |
| R − NS | 0.21 ± 0.04 | 0.04 ± 0.01 | 0.80 ± 0.10 | 0.53 ± 0.05 | 0.25 ± 0.01 |
| C − S | 0.20 ± 0.04 | 0.03 ± 0.01 | 3.53 ± 0.13 | 0.50 ± 0.04 | 0.27 ± 0.09 |
| C − NS | 0.19 ± 0.01 | 0.03 ± 0.01 | 0.17 ± 0.10 | 0.60 ± 0.11 | 0.30 ± 0.07 |
| (O + R) − S | 0.20 ± 0.02 | 0.02 ± 0.02 | 0.31 ± 0.01 | 1.03 ± 0.03 | 0.23 ± 0.01 |
| (O + R) − NS | 0.21 ± 0.03 | 0.06 ± 0.03 | 0.57 ± 0.03 | 2.56 ± 0.16 | 0.31 ± 0.08 |
| (C + R) − S | 0.17 ± 0.03 | 0.02 ± 0.01 | 0.36 ± 0.08 | 0.42 ± 0.05 | 0.22 ± 0.07 |
| (C + R) − NS | 0.25 ± 0.08 | 0.11 ± 0.01 | 0.95 ± 0.11 | 0.74 ± 0.02 | 0.34 ± 0.09 |
| F − S | 0.23 ± 0.10 | 0.05 ± 0.01 | 0.28 ± 0.06 | 0.65 ± 0.05 | 0.28 ± 0.06 |
| F − NS | 0.17 ± 0.03 | 0.02 ± 0.01 | 0.66 ± 0.06 | 0.40 ± 0.15 | 0.19 ± 0.05 |
| Treatment | Fatty Acids (%) * | ||||
|---|---|---|---|---|---|
| C14:0 | C15:0 | C16:0 | C16:1 | C17:0 | |
| O − S | 0.12 ± 0.04 | 0.07 ± 0.01 | 16.18 ± 1.04 | 0.10 ± 0.03 | 0.10 ± 0.02 |
| O − NS | 0.14 ± 0.02 | 0.00 ± 0.00 | 12.02 ± 1.25 | 0.10 ± 0.06 | 0.09 ± 0.02 |
| R − S | 0.08 ± 0.01 | 0.02 ± 0.01 | 11.62 ± 0.37 | 0.08 ± 0.01 | 0.06 ± 0.01 |
| R − NS | 0.09 ± 0.01 | 0.02 ± 0.01 | 11.61 ± 0.36 | 0.08 ± 0.01 | 0.08 ± 0.01 |
| C − S | 0.11 ± 0.02 | 0.04 ± 0.01 | 21.86 ± 1.46 | 0.10 ± 0.06 | 0.12 ± 0.02 |
| C − NS | 0.08 ± 0.01 | 0.02 ± 0.01 | 17.57 ± 1.19 | 0.06 ± 0.01 | 0.06 ± 0.01 |
| (O + R) − S | 0.11 ± 0.05 | 0.02 ± 0.01 | 15.53 ± 1.06 | 0.10 ± 0.03 | 0.09 ± 0.02 |
| (O + R) − NS | 0.23 ± 0.03 | 0.02 ± 0.01 | 11.83 ± 0.58 | 0.08 ± 0.01 | 0.08 ± 0.01 |
| (C + R) − S | 0.08 ± 0.01 | 0.02 ± 0.01 | 13.32 ± 1.98 | 0.07 ± 0.01 | 0.09 ± 0.01 |
| (C + R) − NS | 0.08 ± 0.01 | 0.02 ± 0.01 | 12.72 ± 1.49 | 0.07 ± 0.01 | 0.08 ± 0.01 |
| F − S | 0.08 ± 0.01 | 0.02 ± 0.01 | 15.61 ± 1.99 | 0.08 ± 0.01 | 0.09 ± 0.02 |
| F − NS | 0.08 ± 0.01 | 0.02 ± 0.01 | 12.82 ± 1.44 | 0.08 ± 0.01 | 0.08 ± 0.01 |
| Treatment | C18:0 | C18:1n9 cis/trans | C18:2n6 cis/trans | C18:3n3 | C20:0 |
| O − S | 5.36 ± 1.07 | 22.86 ± 1.87 | 44.38 ± 2.96 | 5.20 ± 0.60 | 1.08 ± 0.18 |
| O − NS | 4.44 ± 0.75 | 24.92 ± 2.20 | 48.28 ± 3.95 | 5.36 ± 0.90 | 0.45 ± 0.18 |
| R − S | 4.45 ± 0.97 | 26.00 ± 1.59 | 50.08 ± 3.20 | 5.64 ± 1.25 | 0.44 ± 0.07 |
| R − NS | 4.39 ± 0.19 | 24.76 ± 2.52 | 51.00 ± 1.71 | 5.67 ± 0.38 | 0.45 ± 0.05 |
| C − S | 7.12 ± 1.42 | 24.79 ± 1.02 | 36.32 ± 1.57 | 3.84 ± 1.34 | 1.95 ± 0.15 |
| C − NS | 5.78 ± 1.17 | 23.07 ± 0.85 | 43.52 ± 2.92 | 3.68 ± 1.39 | 1.04 ± 0.28 |
| (O + R) − S | 4.86 ± 1.50 | 22.13 ± 1.48 | 49.18 ± 2.32 | 5.86 ± 1.29 | 0.77 ± 0.16 |
| (O + R) − NS | 4.36 ± 0.87 | 24.43 ± 2.08 | 51.49 ± 2.71 | 5.78 ± 1.09 | 0.39 ± 0.11 |
| (C + R) − S | 5.16 ± 1.28 | 25.75 ± 1.32 | 48.25 ± 2.72 | 5.04 ± 1.00 | 0.70 ± 0.16 |
| (C + R) − NS | 5.07 ± 0.58 | 26.32 ± 0.98 | 48.56 ± 1.94 | 4.92 ± 0.60 | 0.60 ± 0.11 |
| F − S | 5.23 ± 1.56 | 24.31 ± 1.82 | 47.15 ± 2.19 | 5.35 ± 1.20 | 0.86 ± 0.10 |
| F − NS | 4.51 ± 0.65 | 23.93 ± 1.47 | 50.83 ± 2.87 | 5.86 ± 0.57 | 0.52 ± 0.17 |
| Treatment | C20:1n9 | C20:3n6 | C20:5n3 | C22:0 | C24:0 |
| O − S | 0.17 ± 0.07 | 0.07 ± 0.01 | 1.18 ± 0.08 | 2.24 ± 0.14 | 0.16 ± 0.02 |
| O − NS | 0.18 ± 0.07 | 0.00 ± 0.00 | 3.33 ± 0.23 | 0.43 ± 0.11 | 0.24 ± 0.06 |
| R − S | 0.18 ± 0.04 | 0.05 ± 0.01 | 0.29 ± 0.07 | 0.63 ± 0.16 | 0.18 ± 0.02 |
| R − NS | 0.17 ± 0.03 | 0.02 ± 0.01 | 0.80 ± 0.09 | 0.54 ± 0.03 | 0.28 ± 0.01 |
| C − S | 0.27 ± 0.07 | 0.09 ± 0.02 | 0.86 ± 0.06 | 0.87 ± 0.16 | 0.36 ± 0.06 |
| C − NS | 0.21 ± 0.04 | 0.03 ± 0.01 | 0.32 ± 0.07 | 0.63 ± 0.05 | 0.29 ± 0.03 |
| (O + R) − S | 0.18 ± 0.03 | 0.04 ± 0.01 | 0.23 ± 0.07 | 0.53 ± 0.07 | 0.25 ± 0.09 |
| (O + R) − NS | 0.17 ± 0.05 | 0.02 ± 0.01 | 0.45 ± 0.13 | 0.43 ± 0.07 | 0.20 ± 0.01 |
| (C + R) − S | 0.21 ± 0.04 | 0.04 ± 0.01 | 0.35 ± 0.02 | 0.60 ± 0.03 | 0.28 ± 0.02 |
| (C + R) − NS | 0.20 ± 0.01 | 0.03 ± 0.01 | 0.37 ± 0.08 | 0.63 ± 0.07 | 0.30 ± 0.02 |
| F − S | 0.22 ± 0.08 | 0.04 ± 0.01 | 0.17 ± 0.09 | 0.54 ± 0.07 | 0.22 ± 0.01 |
| F − NS | 0.17 ± 0.01 | 0.03 ± 0.01 | 0.34 ± 0.04 | 0.47 ± 0.10 | 0.22 ± 0.05 |
| Total Protein | ||||
| Cover Crop | N | Average | Grouping * | |
| R | 8 | 31.6 | A | |
| O + R | 8 | 31.5 | A | |
| C + O | 8 | 30.3 | A | |
| O | 8 | 28.8 | A | |
| C | 8 | 28.4 | A | B |
| F | 8 | 25.1 | B | |
| Carbohydrates | ||||
| Cover Crop | N | Average | Grouping * | |
| F | 8 | 42.9 | A | |
| C | 8 | 37.0 | A | B |
| C + R | 8 | 36.8 | A | B |
| O | 8 | 35.4 | B | |
| R | 8 | 35.3 | B | |
| O + R | 8 | 33.3 | B | |
| C15:0 Fatty Acid | ||||
| Soil Preparation | N | Average | Grouping * | |
| S | 24 | 0.03 | A | |
| NS | 24 | 0.02 | B | |
| C18:3n3 Fatty Acid | ||||
| Cover Crop | N | Average | Grouping * | |
| O + R | 8 | 5.82 | A | |
| R | 8 | 5.65 | A | B |
| F | 8 | 5.60 | A | B |
| O | 8 | 5.28 | A | B |
| C + R | 8 | 4.98 | A | B |
| C | 8 | 3.76 | B | |
| C20:3n6 Fatty Acid | ||||
| Soil Preparation | N | Average | Grouping * | |
| S | 24 | 0.06 | A | |
| NS | 24 | 0.02 | B | |
| Treatment | N | P | K | Ca | Mg | S | Zn | Cu | Fe | Mn |
|---|---|---|---|---|---|---|---|---|---|---|
| kg ton−1 | g ton−1 | |||||||||
| O − S | 42.51 ± 2.60 | 5.70 ± 0.36 | 27.13 ± 1.72 | 2.96 ± 0.32 | 2.37 ± 0.14 | 2.93 ± 0.24 | 38.00 ± 1.03 | 10.76 ± 1.33 | 118.53 ± 6.95 | 44.23 ± 2.96 |
| O − NS | 37.90 ± 11.27 | 5.58 ± 0.56 | 19.41 ± 0.62 | 3.03 ± 0.21 | 2.41 ± 0.18 | 3.11 ± 0.29 | 37.05 ± 1.36 | 11.68 ± 1.07 | 122.02 ± 5.00 | 45.20 ± 2.87 |
| R − S | 43.32 ± 4.80 | 5.22 ± 0.75 | 19.73 ± 0.98 | 3.01 ± 0.27 | 2.57 ± 0.13 | 2.93 ± 0.22 | 36.46 ± 1.57 | 10.0 ± 1.14 | 120.30 ± 5.65 | 43.92 ± 1.13 |
| R − NS | 44.93 ± 2.74 | 5.60 ± 0.53 | 18.87 ± 0.38 | 2.85 ± 0.22 | 2.42 ± 0.23 | 3.18 ± 0.29 | 35.54 ± 2.63 | 10.55 ± 1.10 | 116.95 ± 8.67 | 45.99 ± 3.34 |
| C − S | 37.87 ± 4.46 | 5.12 ± 0.39 | 19.42 ± 0.78 | 2.98 ± 0.19 | 2.47 ± 0.21 | 2.85 ± 0.18 | 37.21 ± 1.43 | 10.94 ± 1.55 | 111.42 ± 6.86 | 43.83 ± 2.35 |
| C − NS | 42.87 ± 4.63 | 5.47 ± 0.50 | 19.45 ± 0.97 | 3.02 ± 0.28 | 2.41 ± 0.17 | 2.99 ± 0.17 | 35.18 ± 2.48 | 11.18 ± 0.90 | 119.02 ± 6.01 | 43.58 ± 3.34 |
| (O + R) − S | 42.88 ± 2.17 | 5.40 ± 0.66 | 29.29 ± 1.44 | 2.90 ± 0.27 | 2.51 ± 0.13 | 3.12 ± 0.26 | 36.75 ± 3.07 | 10.97 ± 1.60 | 116.39 ± 9.46 | 44.45 ± 2.09 |
| (O + R) − NS | 45.56 ± 3.32 | 5.47 ± 0.67 | 19.16 ± 0.68 | 2.79 ± 0.19 | 2.45 ± 022 | 3.05 ± 0.32 | 35.52 ± 2.59 | 9.73 ± 1.42 | 118.15 ± 6.65 | 47.08 ± 2.74 |
| (C + R) − S | 43.95 ± 5.15 | 5.54 ± 0.43 | 19.36 ± 0.79 | 2.88 ± 0.18 | 2.44 ± 0.14 | 3.19 ± 0.20 | 34.95 ± 1.82 | 10.31 ± 1.66 | 116.57 ± 5.24 | 45.85 ± 2.43 |
| (C + R) − NS | 46.27 ± 3.40 | 5.48 ± 0.53 | 19.60 ± 0.69 | 3.05 ± 0.18 | 2.41 ± 0.20 | 3.12 ± 0.31 | 36.15 ± 1.37 | 11.26 ± 1.43 | 117.97 ± 7.87 | 44.58 ± 3.02 |
| F − S | 38.40 ± 3.97 | 5.56 ± 0.40 | 19.70 ± 0.70 | 3.00 ± 0.27 | 2.48 ± 013 | 3.11 ± 0.20 | 36.36 ± 2.57 | 10.94 ± 1.05 | 116.94 ± 9.12 | 43.98 ± 3.41 |
| F − NS | 42.96 ± 8.46 | 5.79 ± 0.37 | 19.68 ± 0.76 | 2.89 ± 0.28 | 2.43 ± 0.17 | 3.05 ± 0.36 | 30.02 ± 2.45 | 11.29 ± 1.43 | 117.74 ± 10.22 | 44.25 ± 2.49 |
Disclaimer/Publisher’s Note: The statements, opinions and data contained in all publications are solely those of the individual author(s) and contributor(s) and not of MDPI and/or the editor(s). MDPI and/or the editor(s) disclaim responsibility for any injury to people or property resulting from any ideas, methods, instructions or products referred to in the content. |
© 2024 by the authors. Licensee MDPI, Basel, Switzerland. This article is an open access article distributed under the terms and conditions of the Creative Commons Attribution (CC BY) license (https://creativecommons.org/licenses/by/4.0/).
Share and Cite
Baisch, J.S.; Grohs, M.; Ferreira, P.A.A.; Ugalde, G.A.; Tres, M.V.; Zabot, G.L. Protein and Oil Contents, Micro- and Macronutrients, and Other Quality Indicators of Soybean Cultivated in Lowland Fields. Foods 2024, 13, 3719. https://doi.org/10.3390/foods13233719
Baisch JS, Grohs M, Ferreira PAA, Ugalde GA, Tres MV, Zabot GL. Protein and Oil Contents, Micro- and Macronutrients, and Other Quality Indicators of Soybean Cultivated in Lowland Fields. Foods. 2024; 13(23):3719. https://doi.org/10.3390/foods13233719
Chicago/Turabian StyleBaisch, Jéssica Streck, Mara Grohs, Paulo Ademar Avelar Ferreira, Gustavo Andrade Ugalde, Marcus Vinícius Tres, and Giovani Leone Zabot. 2024. "Protein and Oil Contents, Micro- and Macronutrients, and Other Quality Indicators of Soybean Cultivated in Lowland Fields" Foods 13, no. 23: 3719. https://doi.org/10.3390/foods13233719
APA StyleBaisch, J. S., Grohs, M., Ferreira, P. A. A., Ugalde, G. A., Tres, M. V., & Zabot, G. L. (2024). Protein and Oil Contents, Micro- and Macronutrients, and Other Quality Indicators of Soybean Cultivated in Lowland Fields. Foods, 13(23), 3719. https://doi.org/10.3390/foods13233719