

Intelligent System/Equipment for Quality Deterioration Detection of Fresh Food: Recent Advances and Application


Abstract
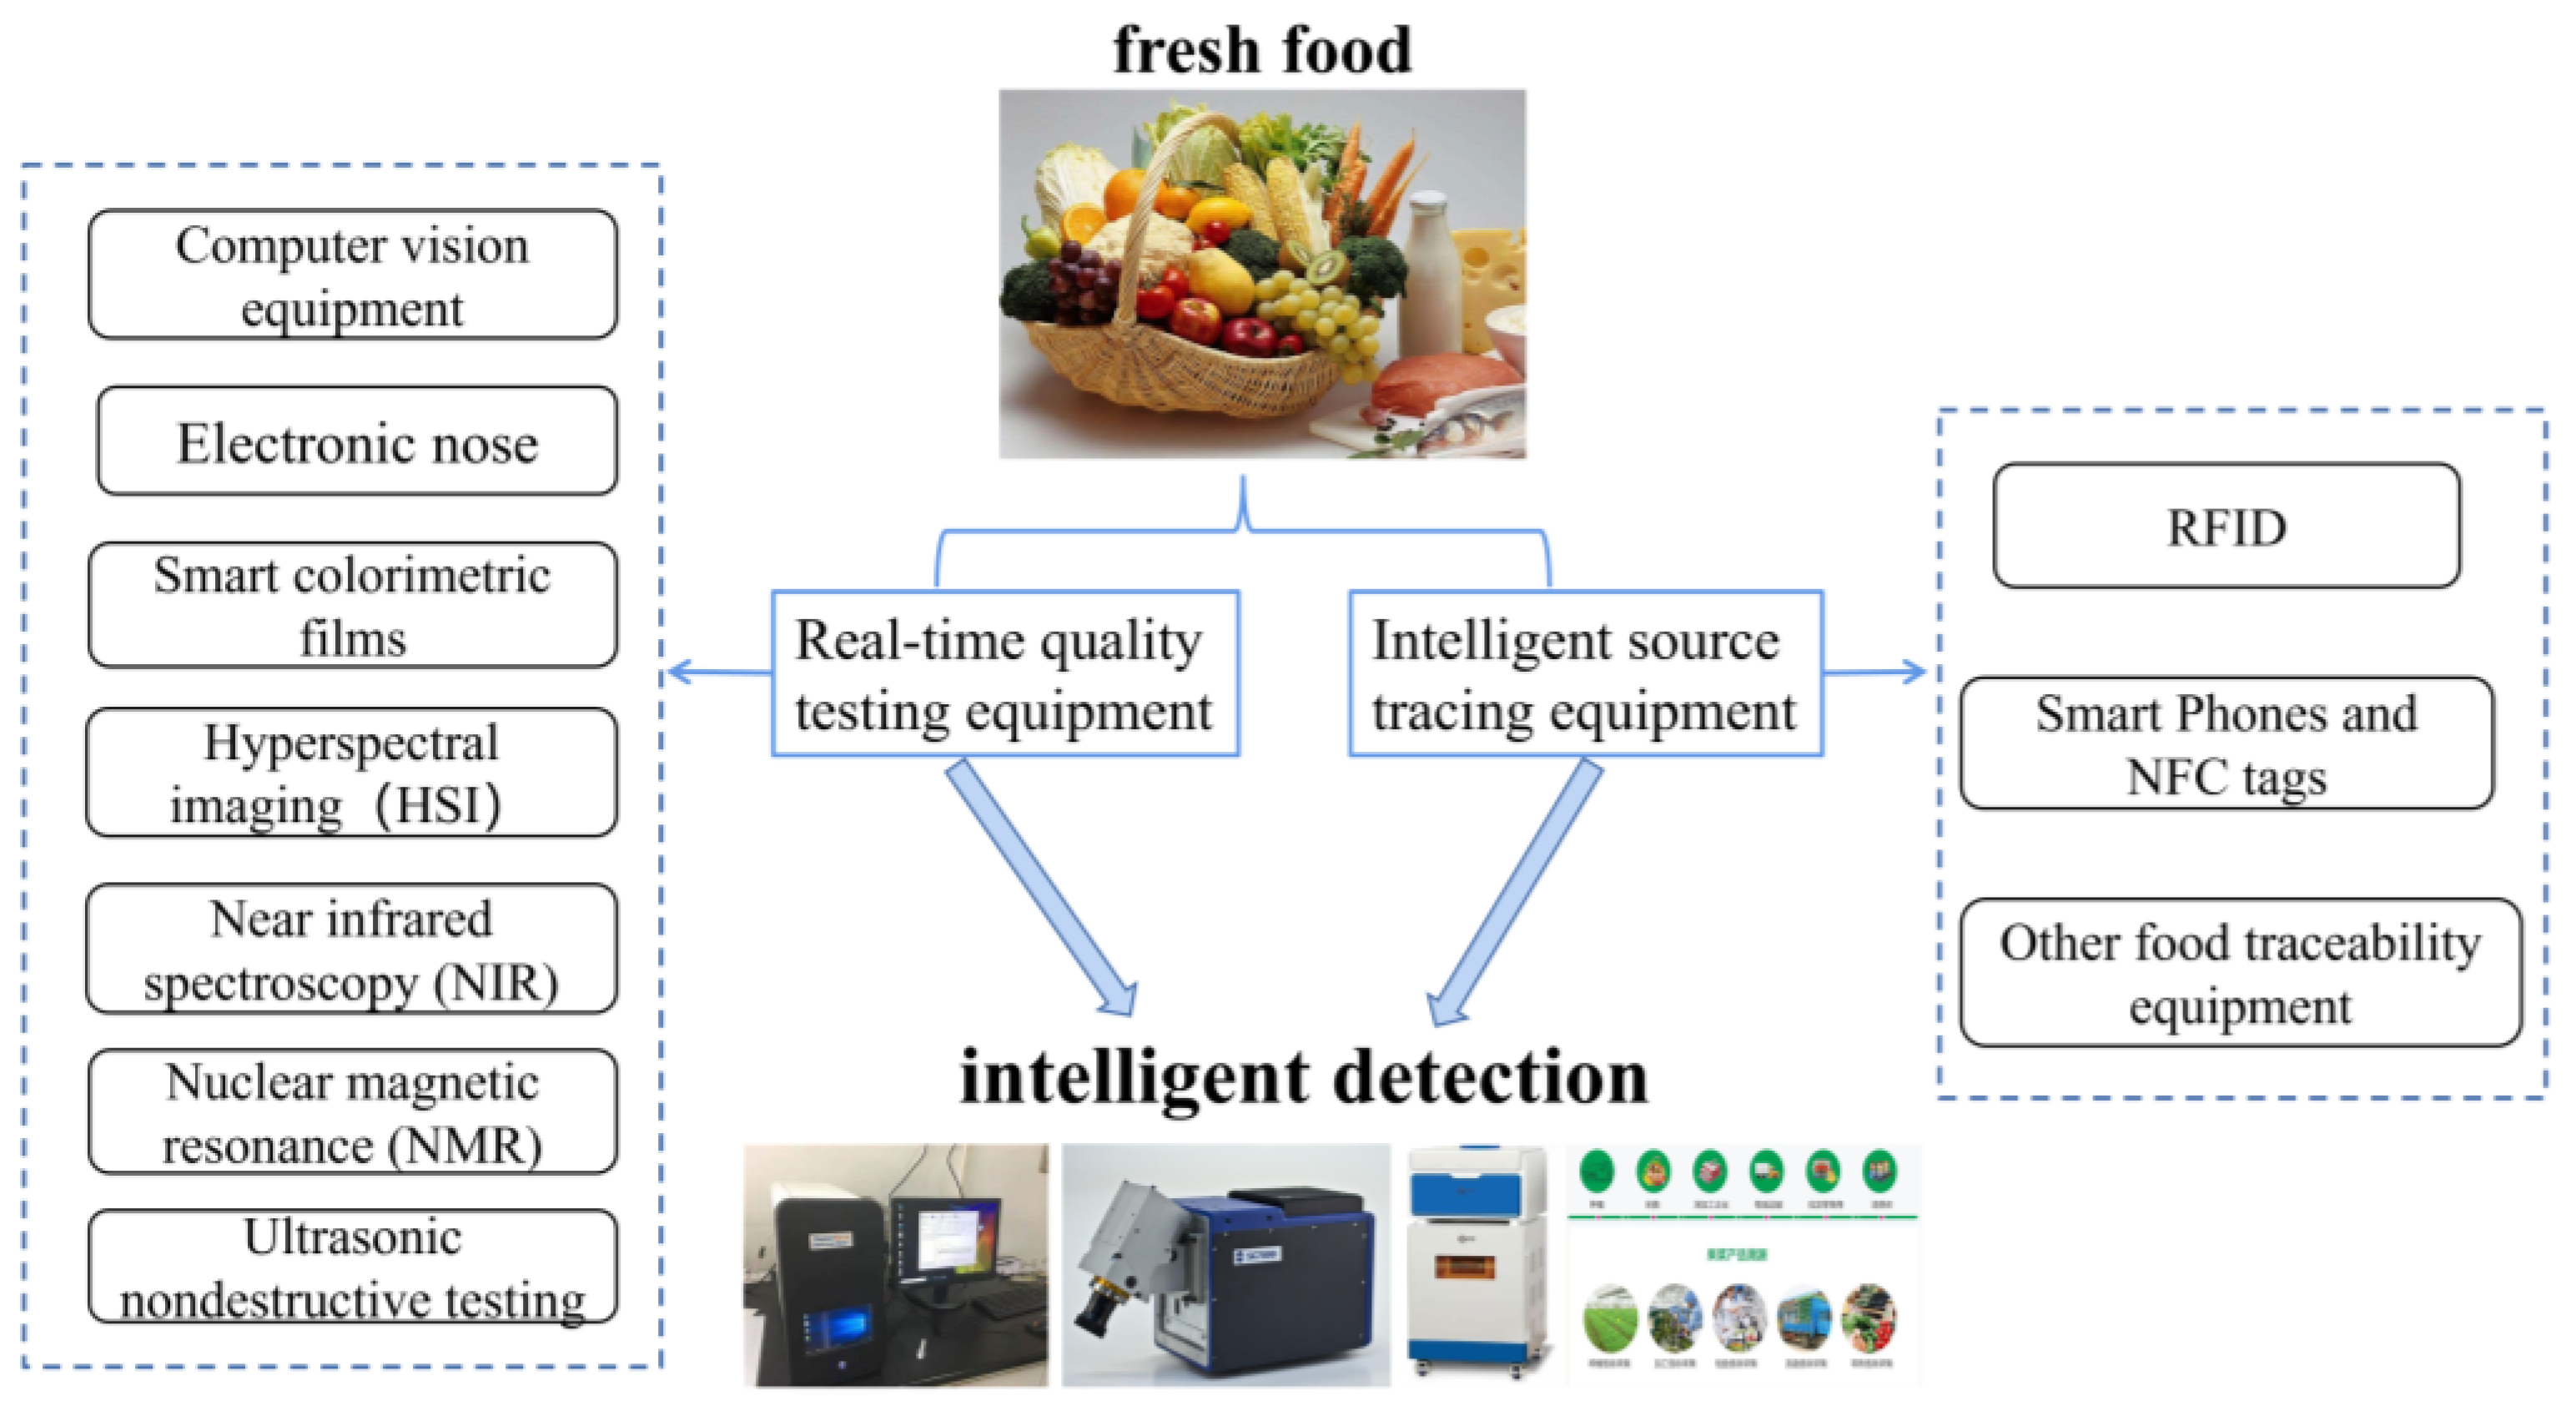
1. Introduction
2. Intelligent Detection Equipment Based on Sensory Bionics
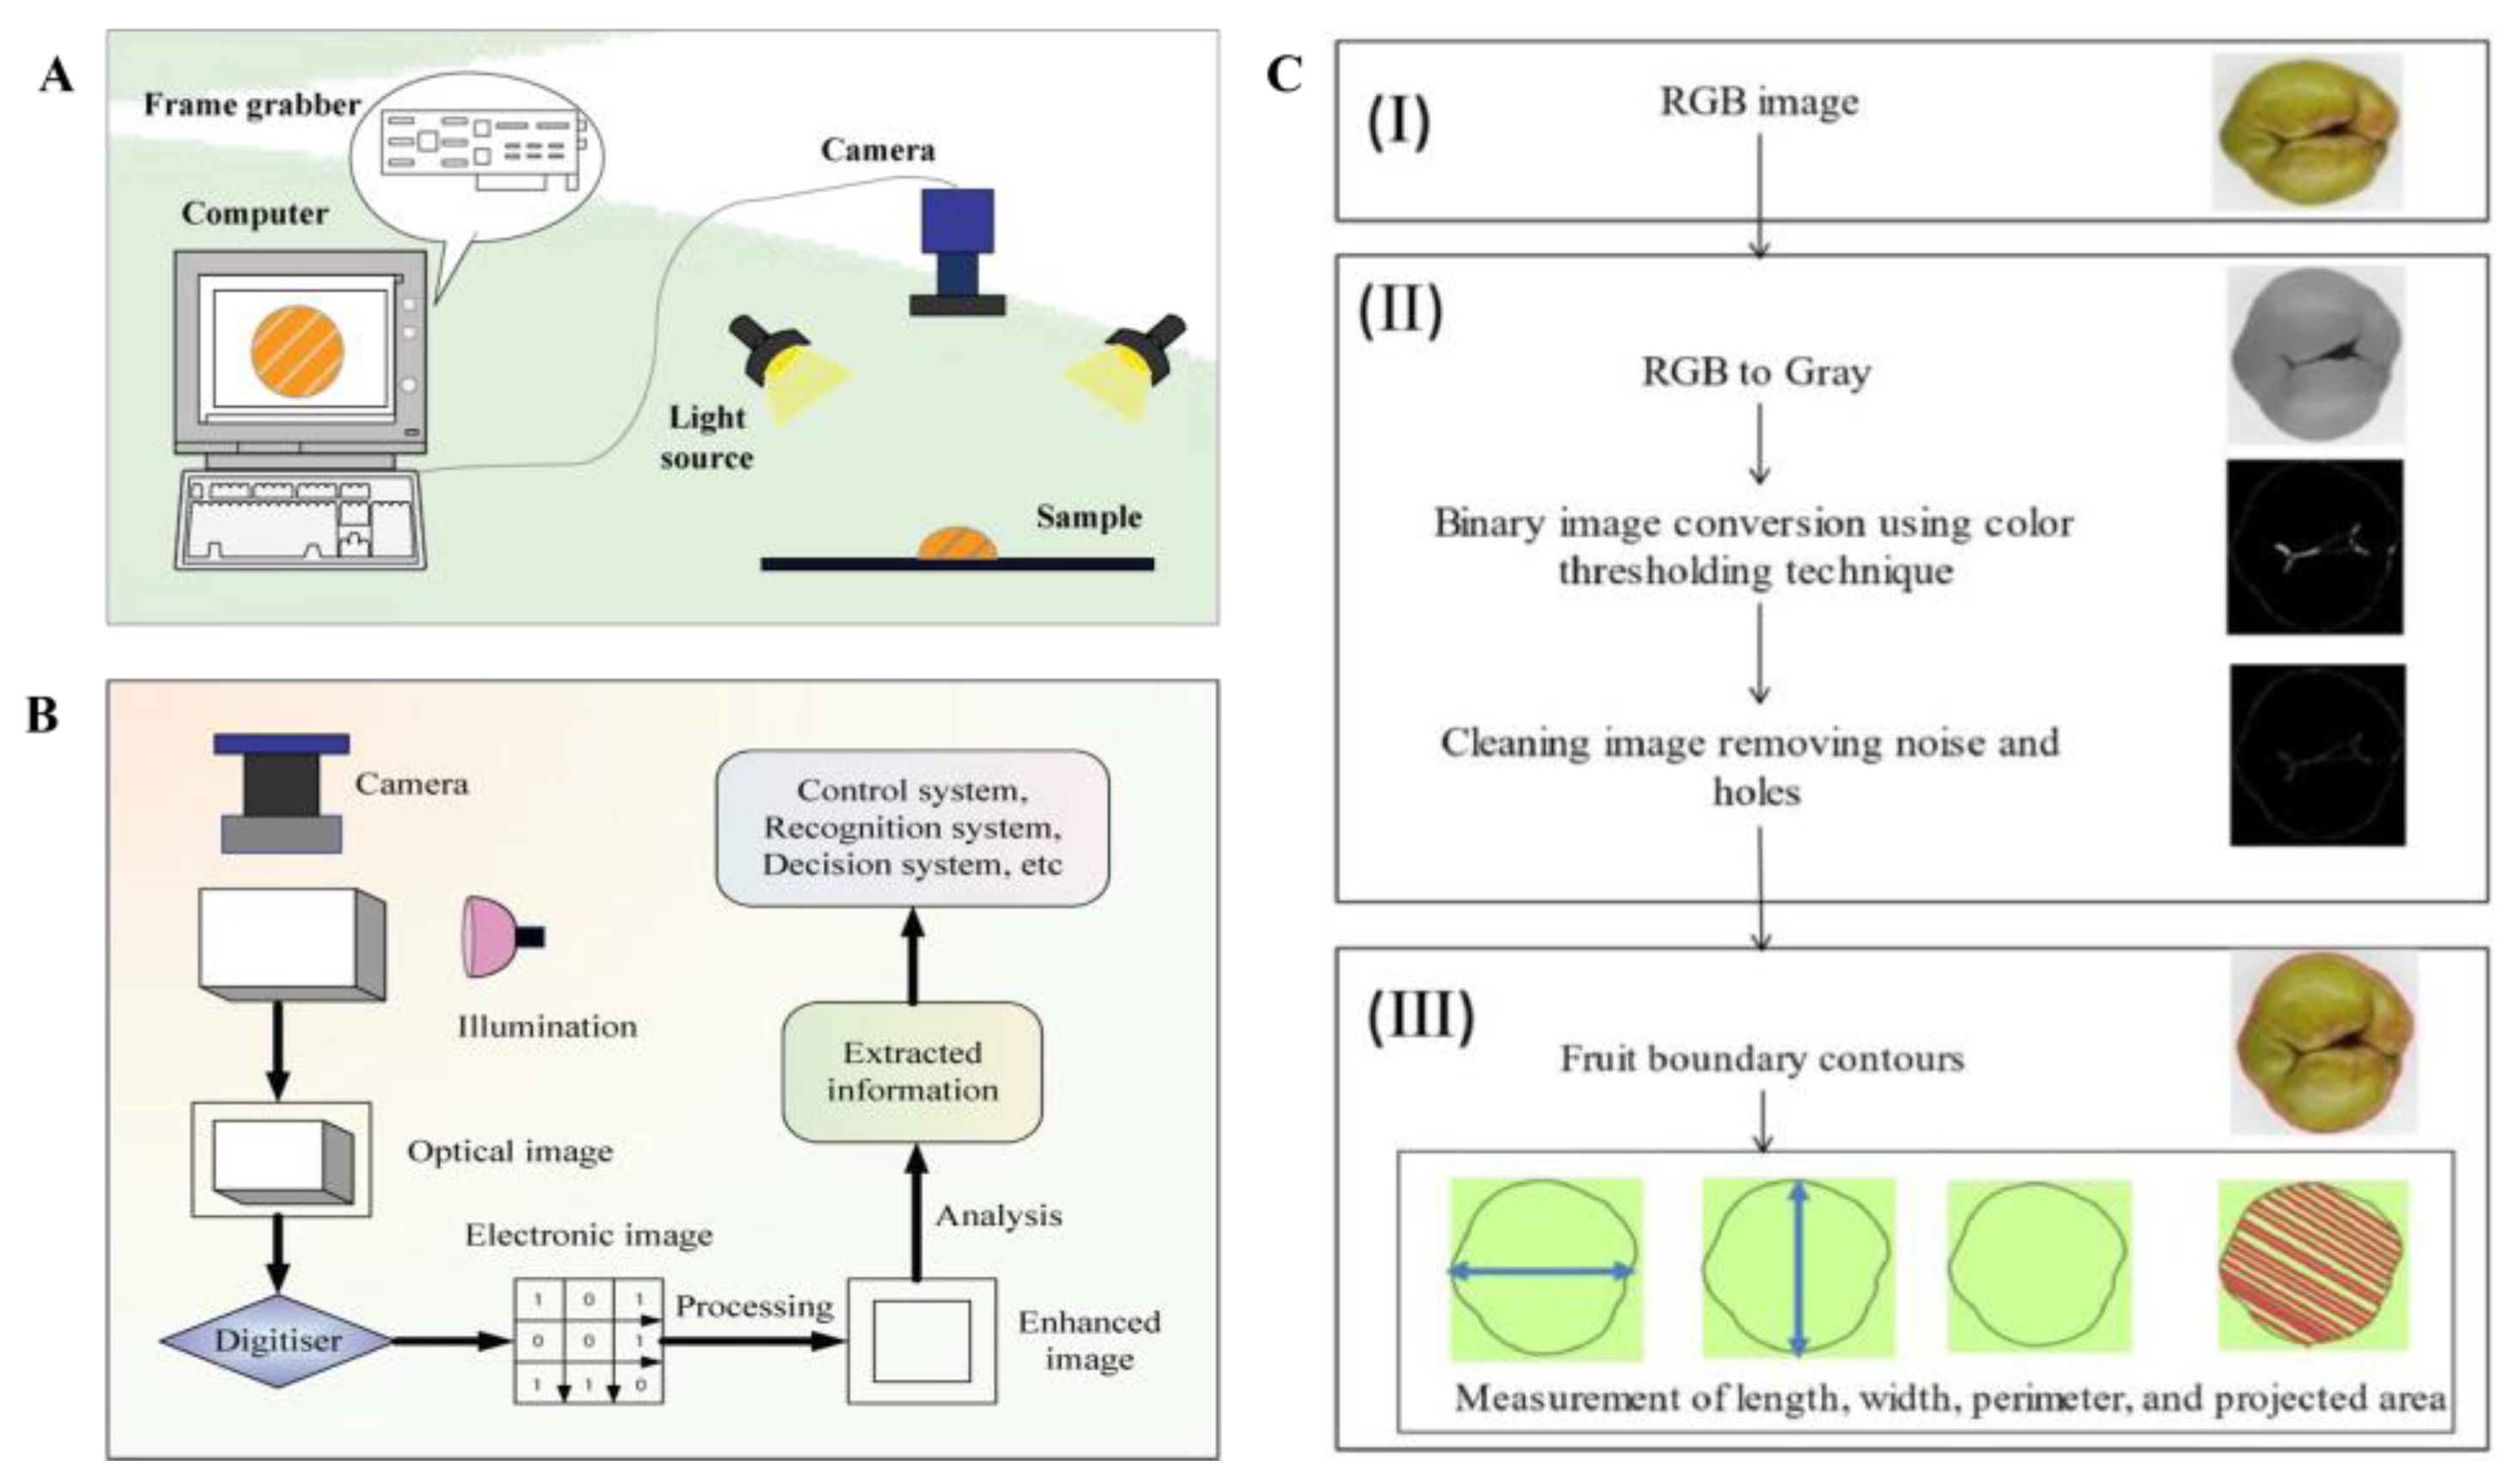
2.1. Computer Vision Equipment
2.2. Intelligent Packaging Film
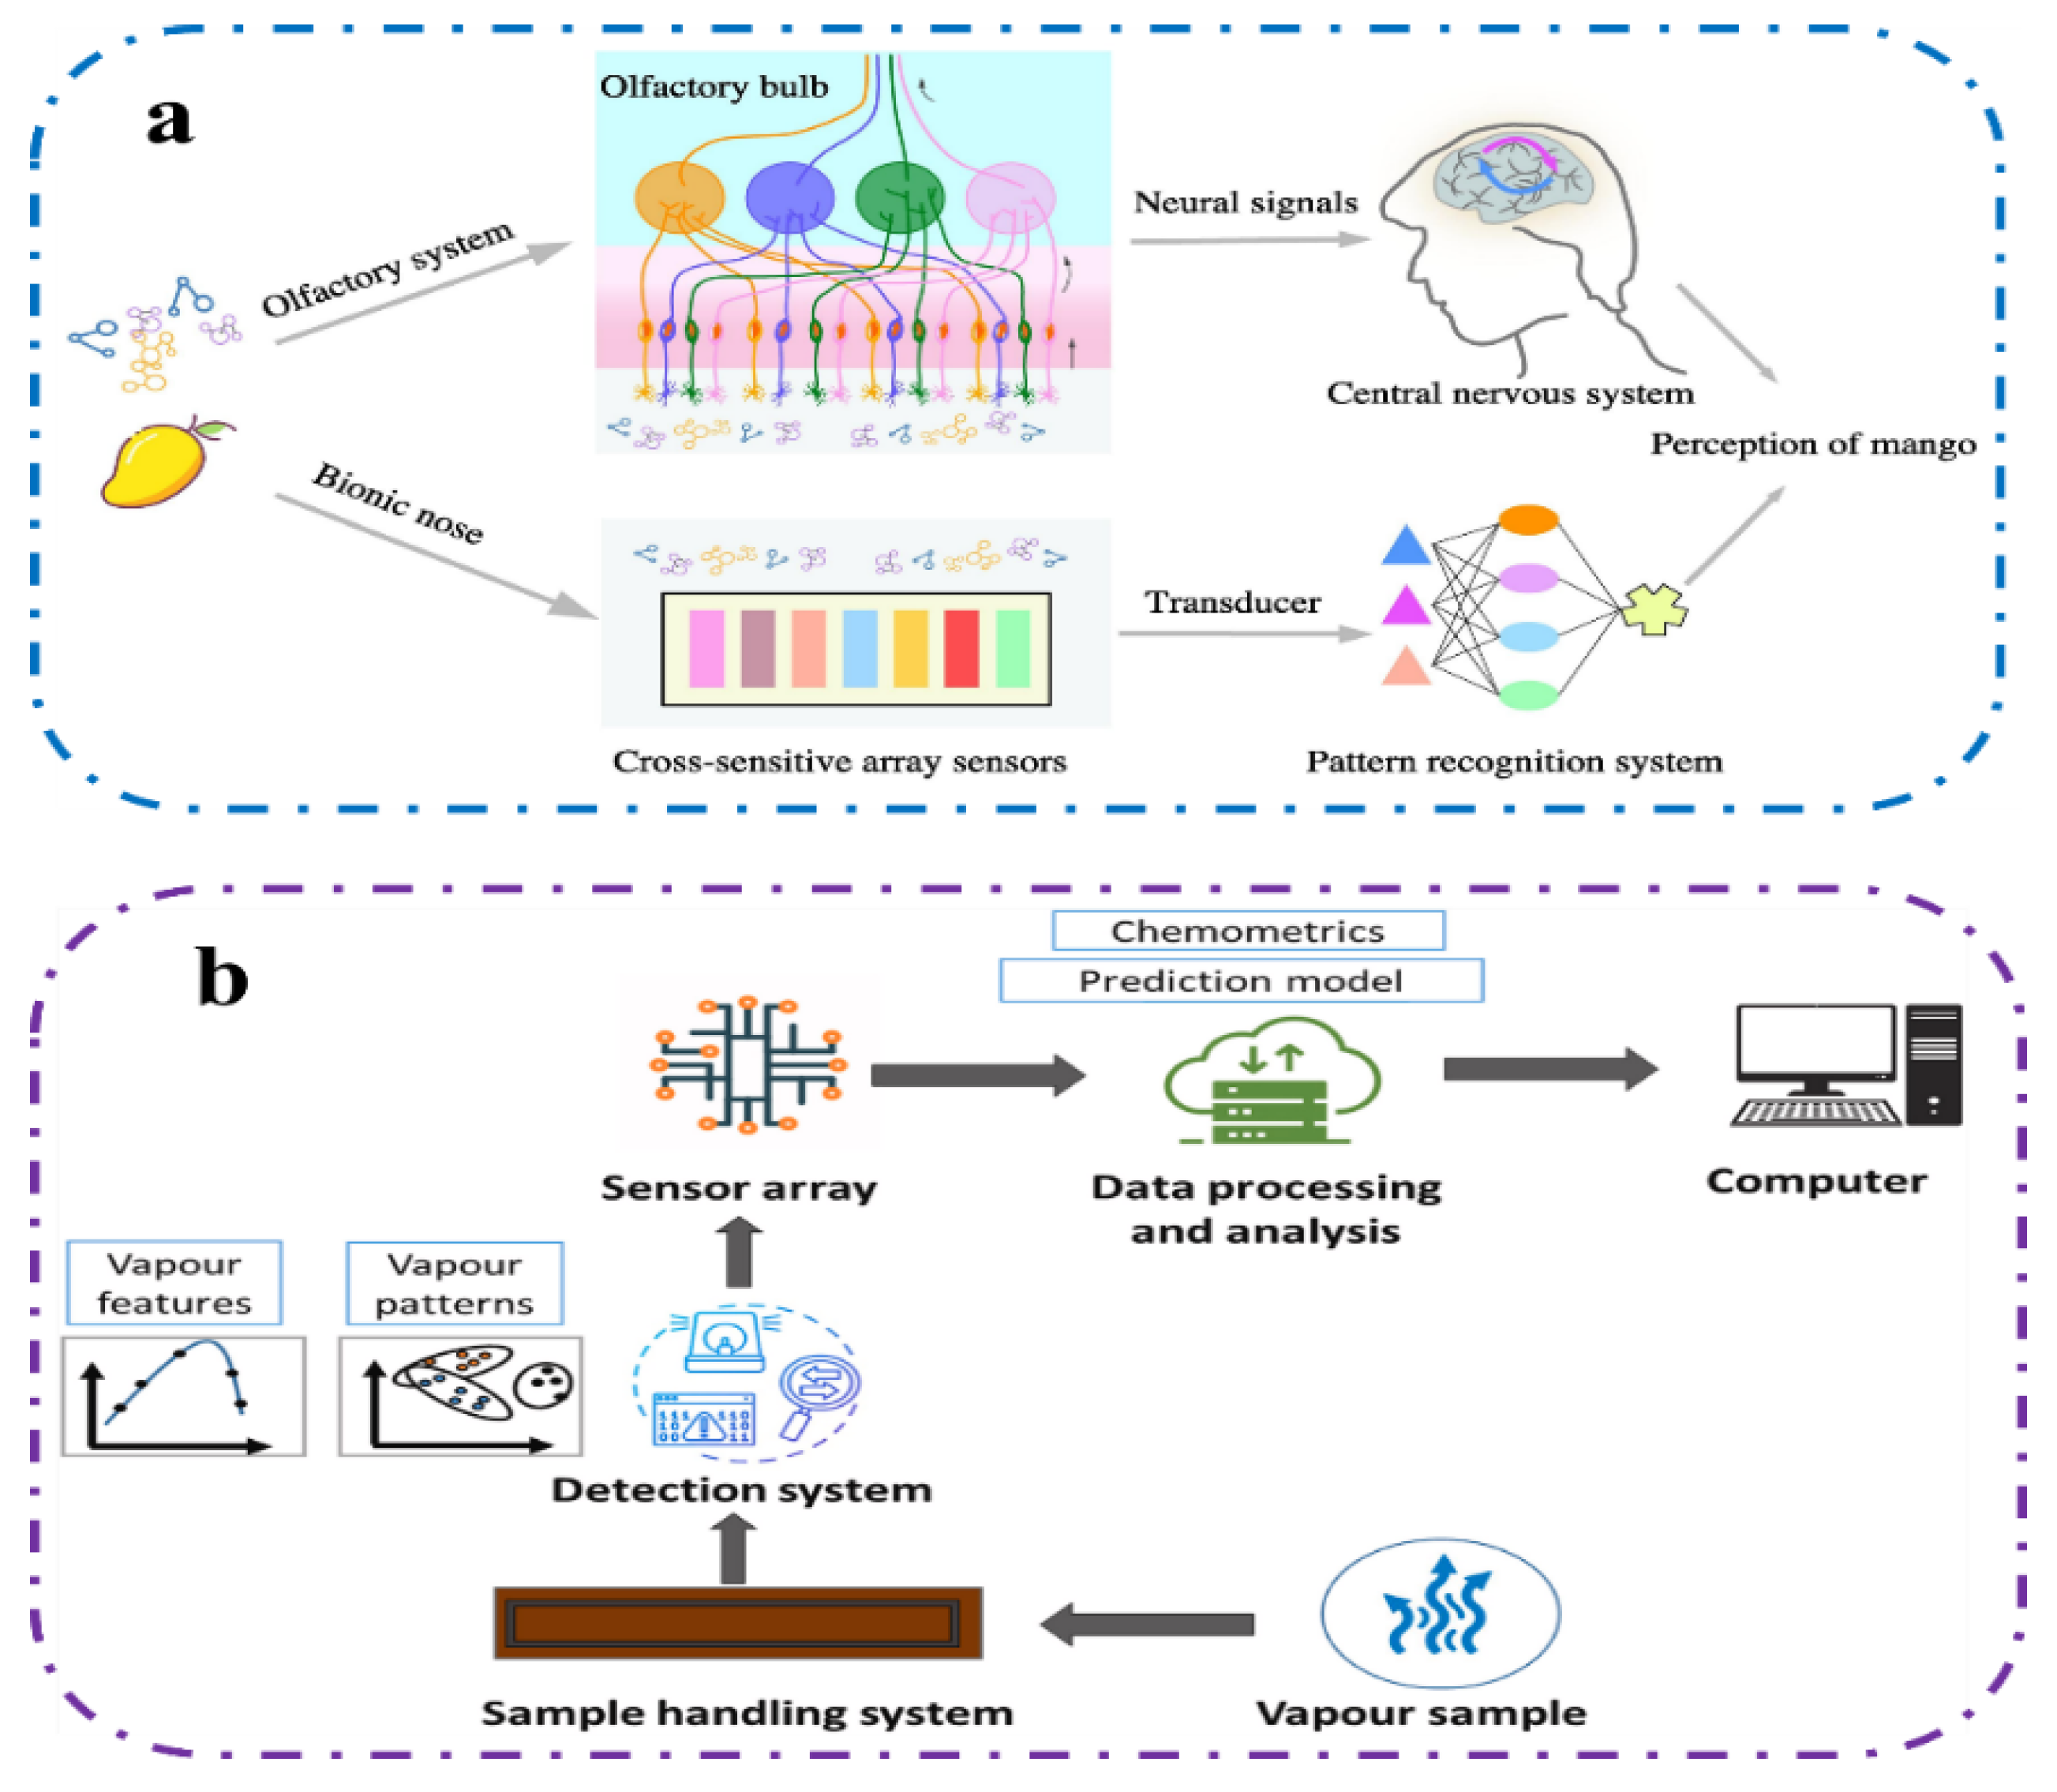
2.3. Electronic Nose
2.4. Other Detection Devices
3. Spectrum and Imaging Testing Equipment
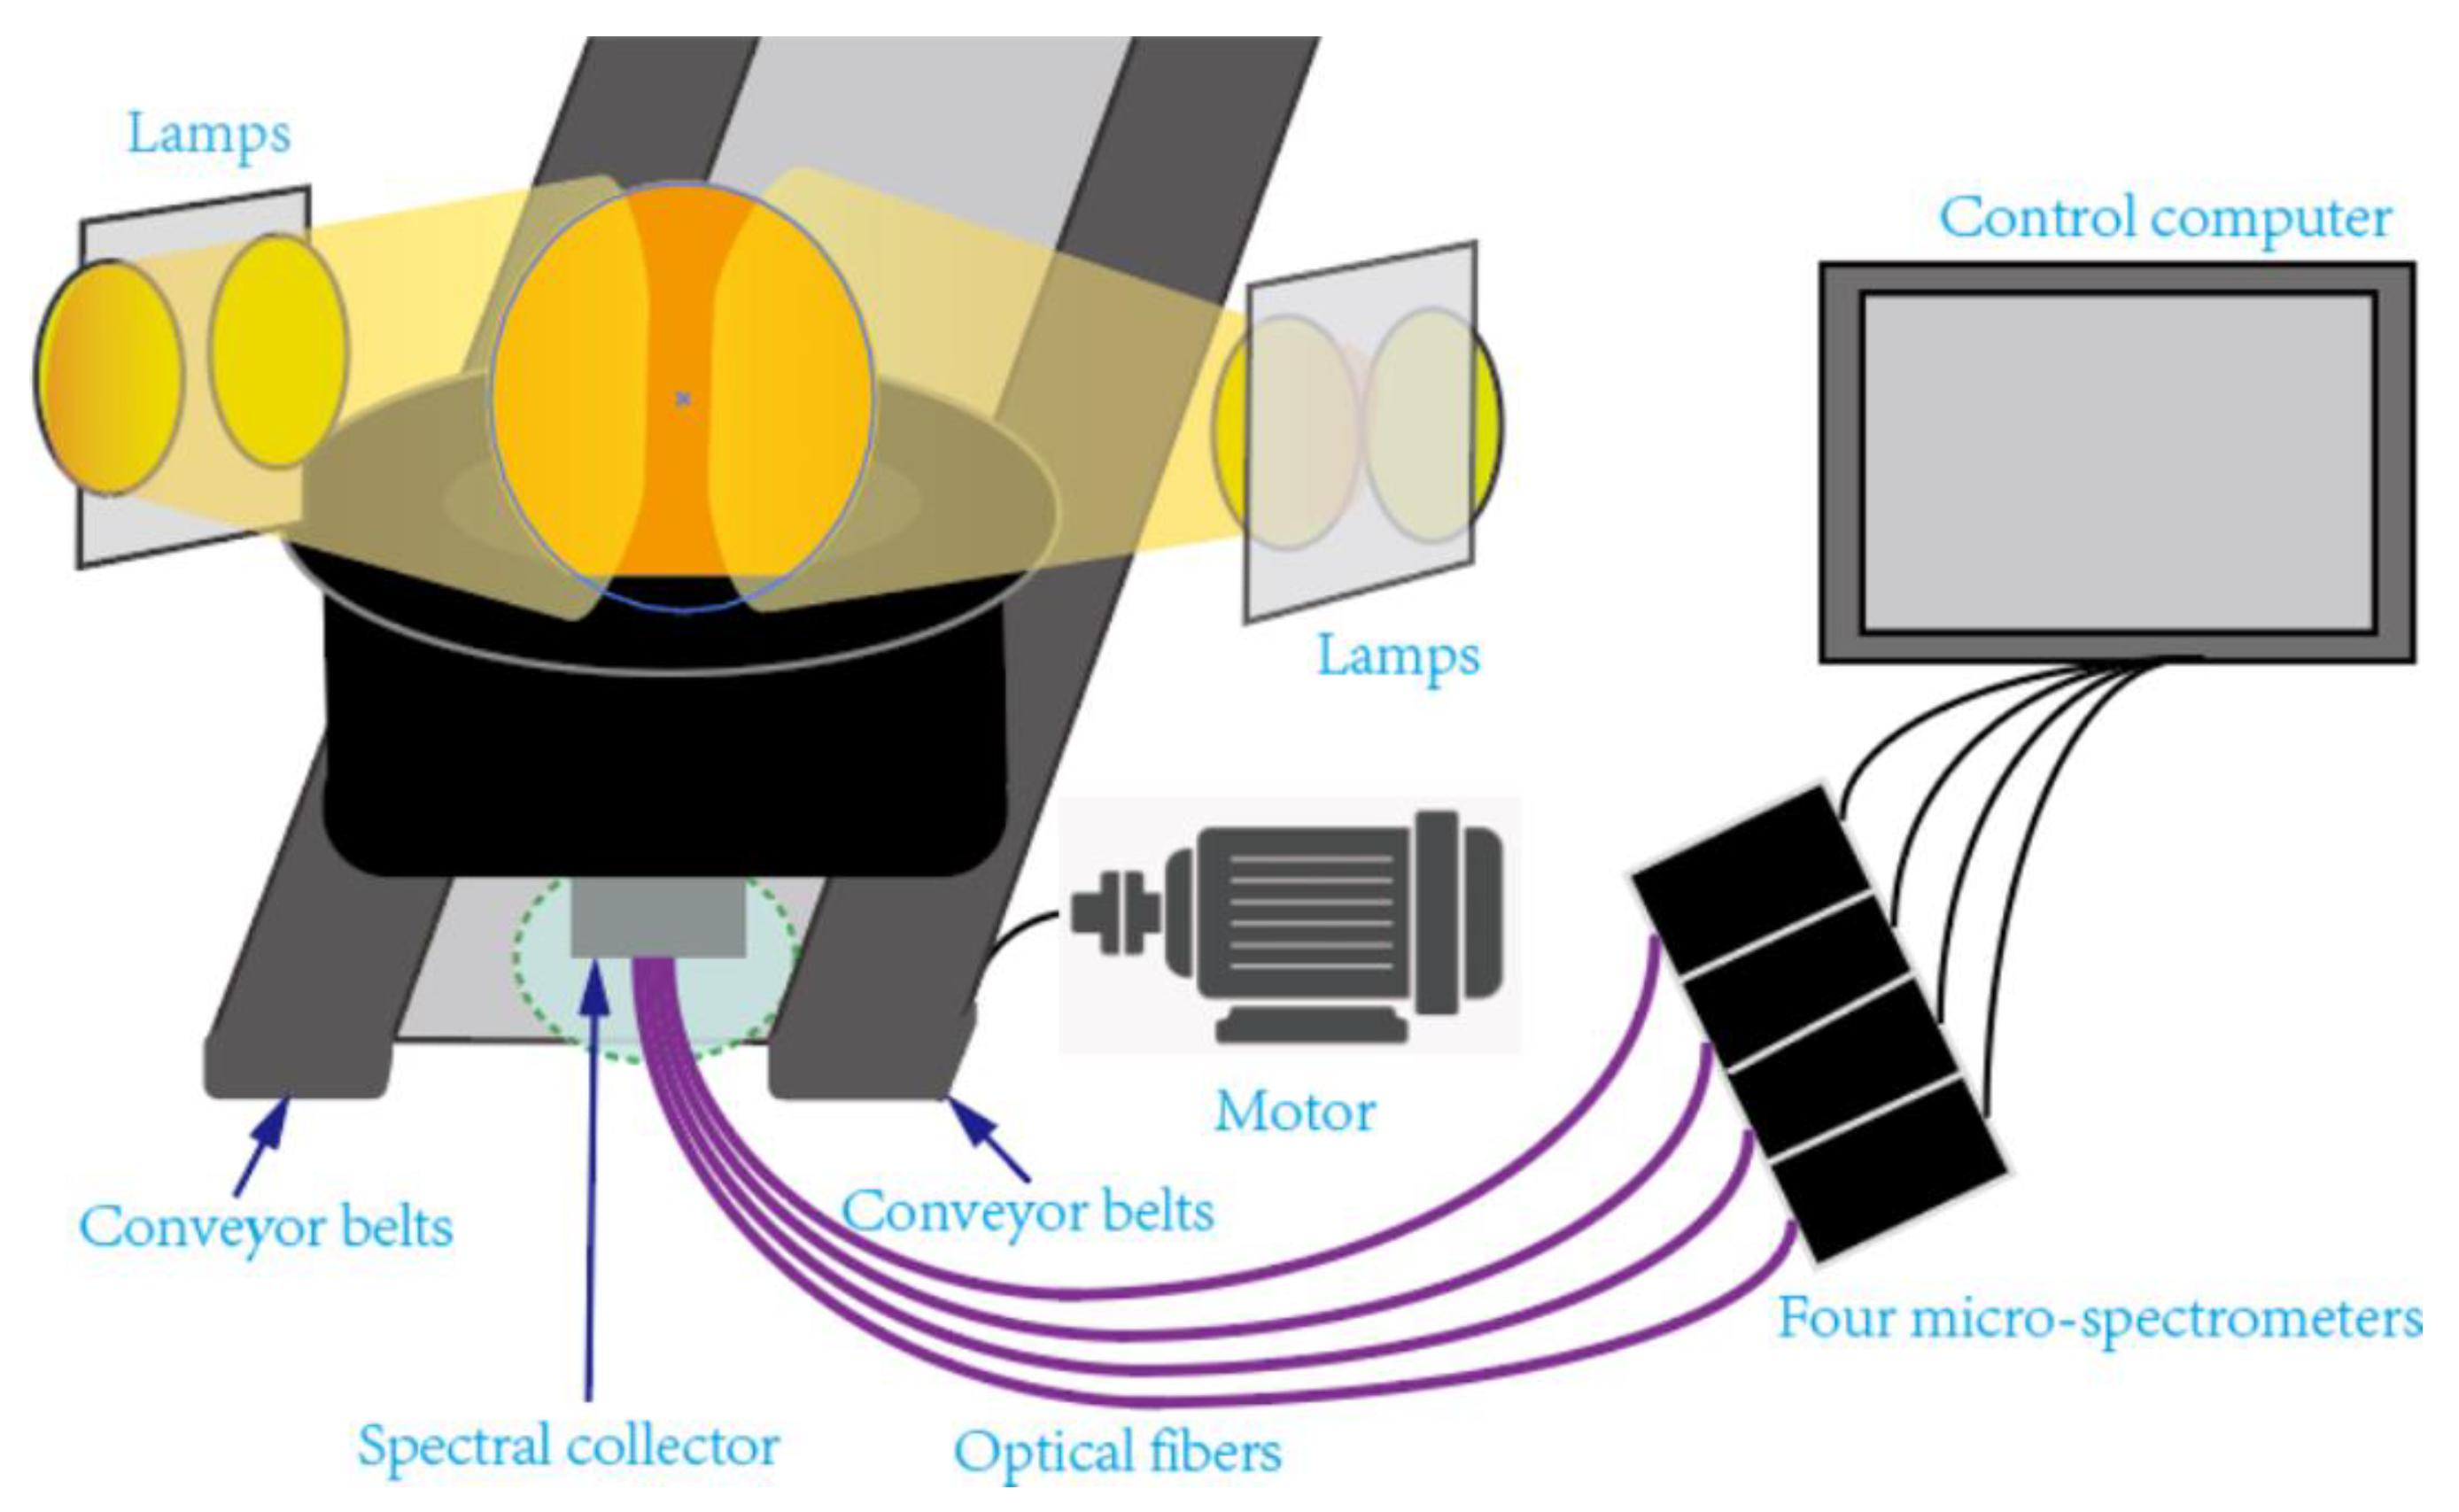
3.1. Near-Infrared Spectrum Equipment
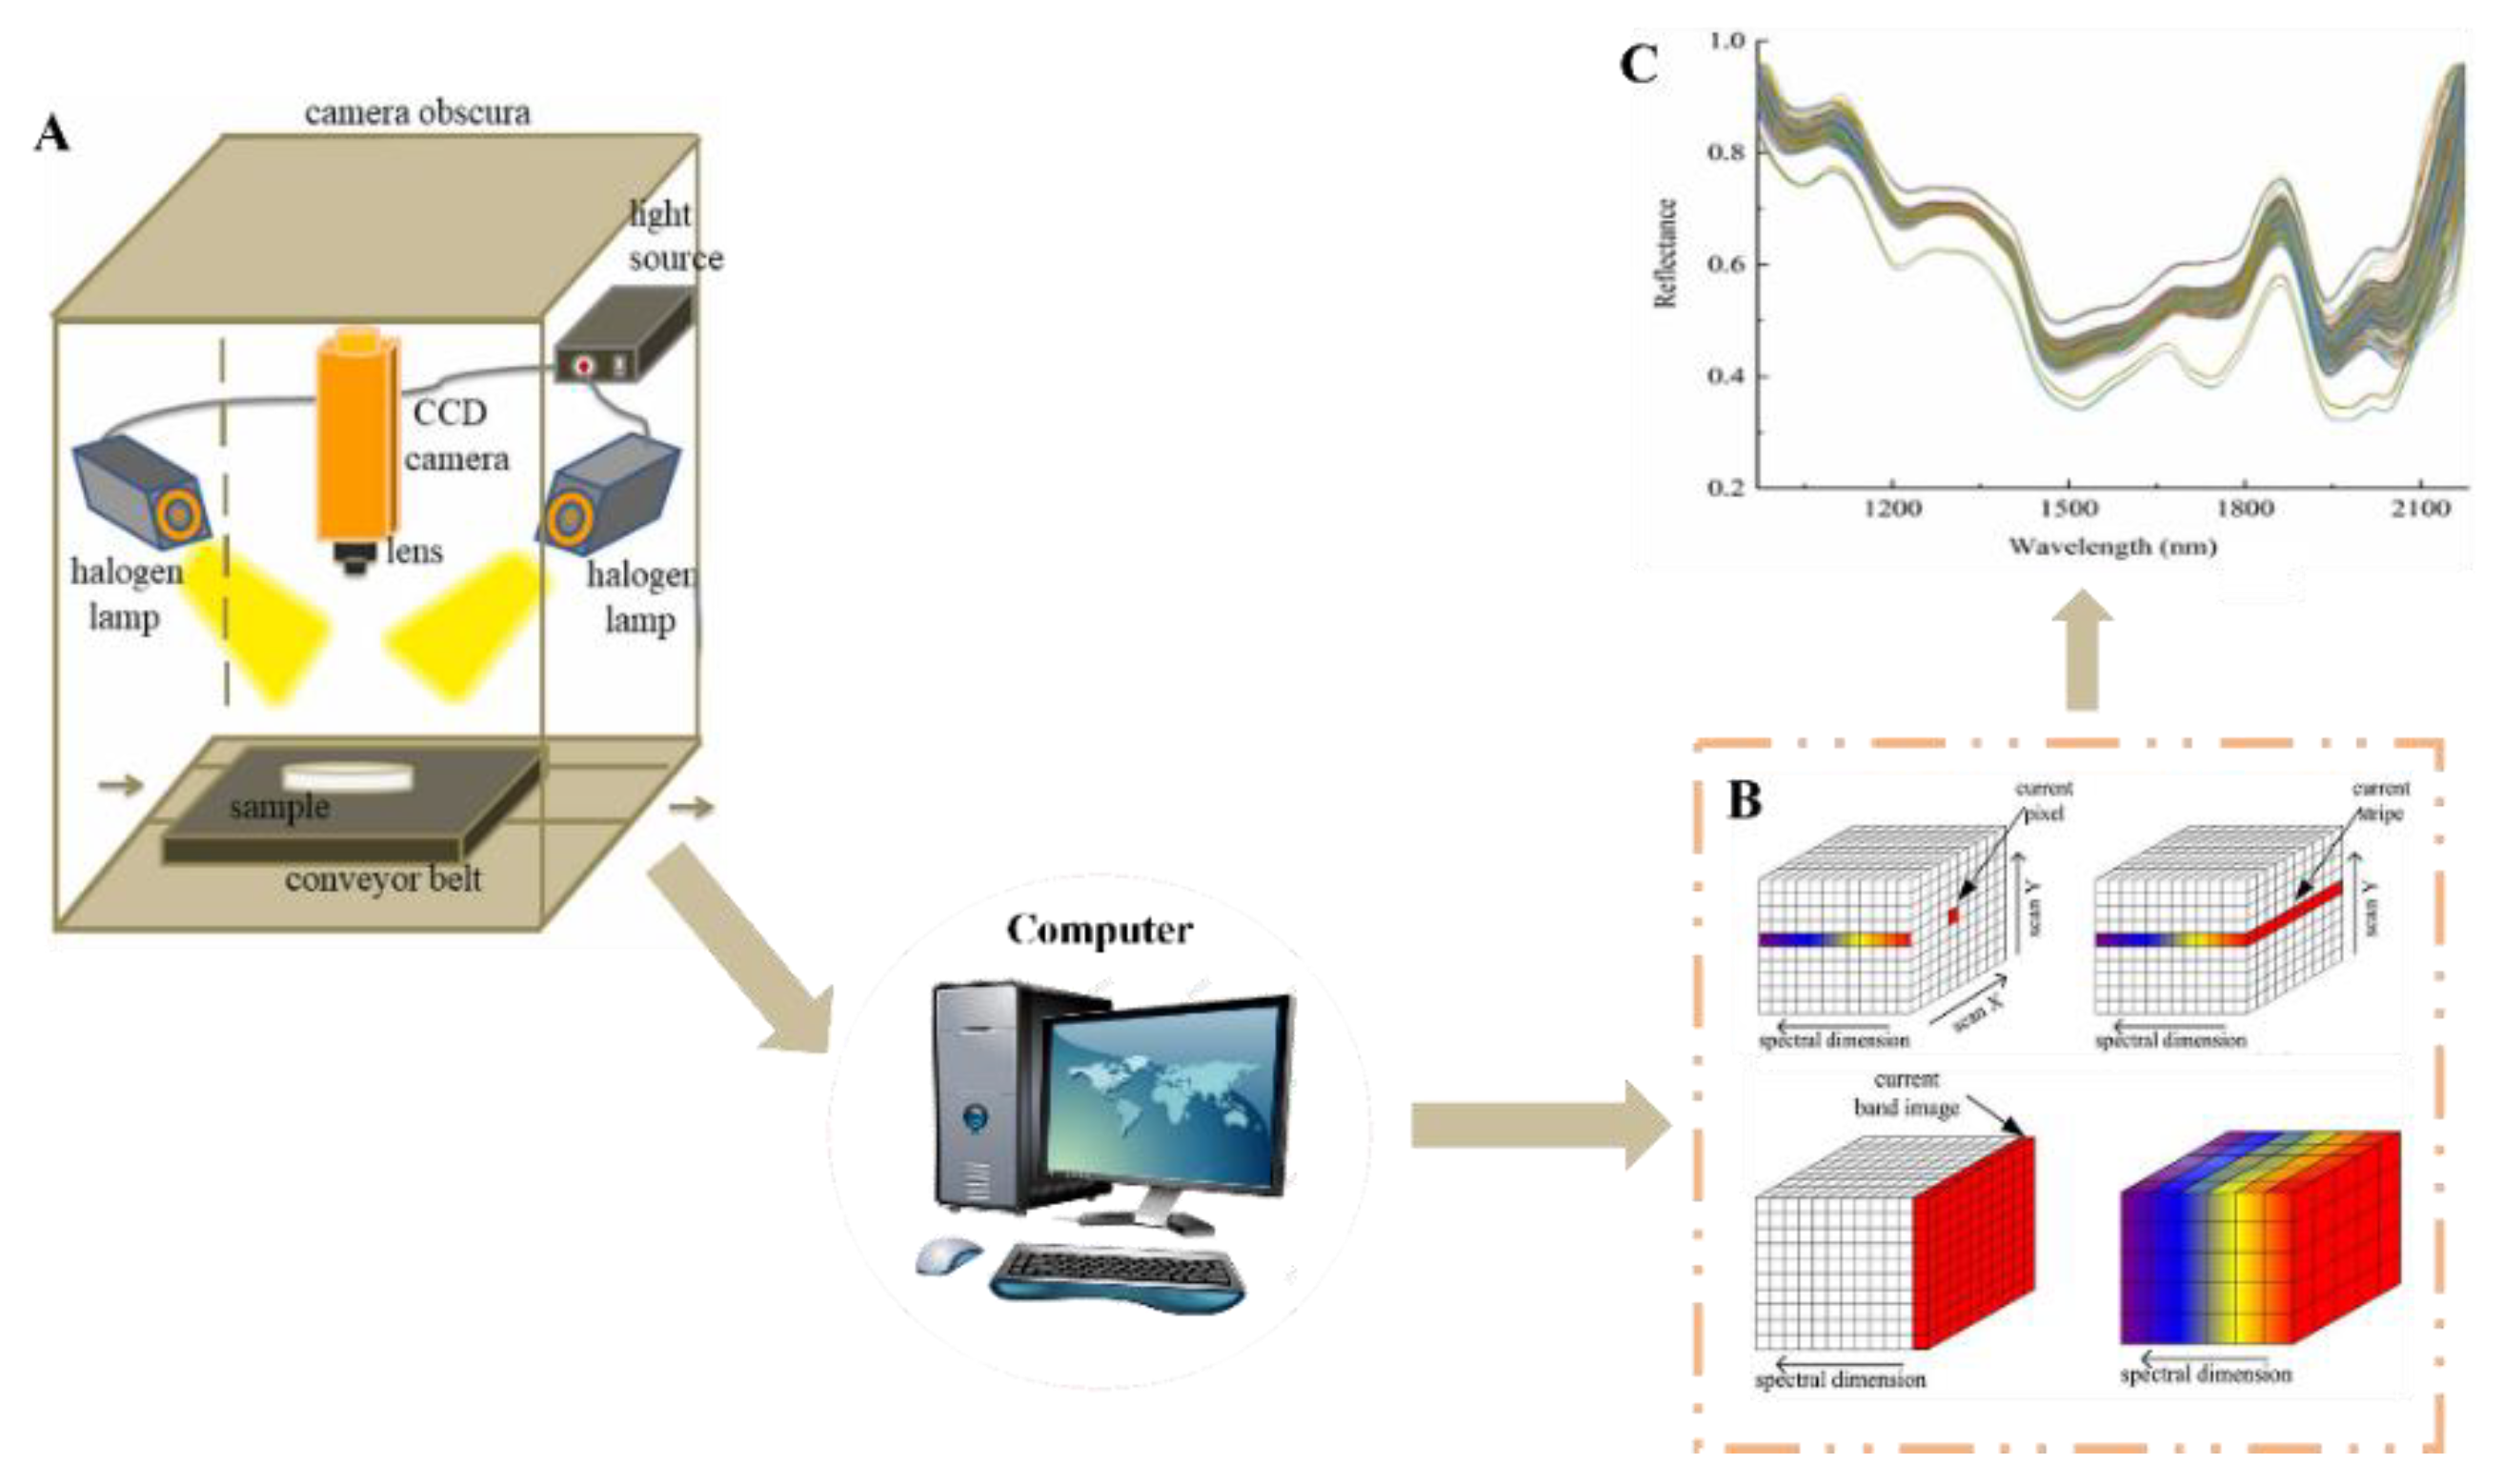
3.2. Hyperspectral Imaging Equipment
4. Nuclear Magnetic Resonance (NMR) Detection Equipment
5. Ultrasonic Testing Equipment
6. Intelligent Source Tracing Equipment
6.1. Radio-Frequency Identification (RFID) Equipment
6.2. Smart Phones and Near-Field Communication (NFC) Tags
6.3. Other Food Traceability Equipment
7. Conclusions and Future Outlook
Author Contributions
Funding
Conflicts of Interest
References
- Zhang, D.; Shen, Z.; Li, Y. Requirement Analysis and Service Optimization of Multiple Category Fresh Products in Online Retailing Using Importance-Kano Analysis. J. Retail. Consum. Serv. 2023, 72, 103253. [Google Scholar] [CrossRef]
- Liu, Y.; Ma, D.; Hu, J.; Zhang, Z. Sales Mode Selection of Fresh Food Supply Chain Based on Blockchain Technology under Different Channel Competition. Comput. Ind. Eng. 2021, 162, 107730. [Google Scholar] [CrossRef]
- Zhang, M.; De Baerdemaeker, J.; Schrevens, E. Effects of Different Varieties and Shelf Storage Conditions of Chicory on Deteriorative Color Changes Using Digital Image Processing and Analysis. Food Res. Int. 2003, 36, 669–676. [Google Scholar] [CrossRef]
- An, J.; Zhang, M.; Lu, Q. Changes in Some Quality Indexes in Fresh-Cut Green Asparagus Pretreated with Aqueous Ozone and Subsequent Modified Atmosphere Packaging. J. Food Eng. 2007, 78, 340–344. [Google Scholar] [CrossRef]
- Wang, Y.; Zhang, M.; Mujumdar, A.S.; Mothibe, K.J.; Roknul Azam, S.M. Study of Drying Uniformity in Pulsed Spouted Microwave–Vacuum Drying of Stem Lettuce Slices with Regard to Product Quality. Dry. Technol. 2013, 31, 91–101. [Google Scholar] [CrossRef]
- Yu, Y.; Xiao, T. Pricing and Cold-Chain Service Level Decisions in a Fresh Agri-Products Supply Chain with Logistics Outsourcing. Comput. Ind. Eng. 2017, 111, 56–66. [Google Scholar] [CrossRef]
- Wu, X.-F.; Zhang, M.; Adhikari, B.; Sun, J. Recent Developments in Novel Freezing and Thawing Technologies Applied to Foods. Crit. Rev. Food Sci. Nutr. 2017, 57, 3620–3631. [Google Scholar] [CrossRef]
- Wu, Y.; Duan, Y.; Wei, Y.; An, D.; Liu, J. Application of Intelligent and Unmanned Equipment in Aquaculture: A Review. Comput. Electron. Agric. 2022, 199, 107201. [Google Scholar] [CrossRef]
- Jiang, H.; Zhang, M.; Bhandari, B.; Adhikari, B. Application of Electronic Tongue for Fresh Foods Quality Evaluation: A Review. Food Rev. Int. 2018, 34, 746–769. [Google Scholar] [CrossRef]
- Zhuang, Q.; Peng, Y.; Nie, S.; Guo, Q.; Li, Y.; Zuo, J.; Chen, Y. Non-Destructive Detection of Frozen Pork Freshness Based on Portable Fluorescence Spectroscopy. J. Food Compos. Anal. 2023, 118, 105175. [Google Scholar] [CrossRef]
- Dong, K.; Guan, Y.; Wang, Q.; Huang, Y.; An, F.; Zeng, Q.; Luo, Z.; Huang, Q. Non-Destructive Prediction of Yak Meat Freshness Indicator by Hyperspectral Techniques in the Oxidation Process. Food Chem. X 2023, 17, 100541. [Google Scholar] [CrossRef] [PubMed]
- Hameed, K.; Chai, D.; Rassau, A. A Comprehensive Review of Fruit and Vegetable Classification Techniques. Image Vis. Comput. 2018, 80, 24–44. [Google Scholar] [CrossRef]
- Dou, J.-F.; Kou, X.-H.; Wu, C.-E.; Fan, G.-J.; Li, T.-T.; Li, X.-J.; Zhou, D.-D.; Yan, Z.-C.; Zhu, J.-P. Recent Advances and Development of Postharvest Management Research for Fresh Jujube Fruit: A Review. Sci. Hortic. 2023, 310, 111769. [Google Scholar] [CrossRef]
- Taheri-Garavand, A.; Nasiri, A.; Banan, A.; Zhang, Y.-D. Smart Deep Learning-Based Approach for Non-Destructive Freshness Diagnosis of Common Carp Fish. J. Food Eng. 2020, 278, 109930. [Google Scholar] [CrossRef]
- Dudnyk, I.; Janeček, E.-R.; Vaucher-Joset, J.; Stellacci, F. Edible Sensors for Meat and Seafood Freshness. Sens. Actuator B-Chem. 2018, 259, 1108–1112. [Google Scholar] [CrossRef]
- Nadimi, M.; Divyanth, L.G.; Paliwal, J. Automated Detection of Mechanical Damage in Flaxseeds Using Radiographic Imaging and Machine Learning. Food Bioprocess. Technol. 2023, 16, 526–536. [Google Scholar] [CrossRef]
- Gopi, K.; Mazumder, D.; Sammut, J.; Saintilan, N. Determining the Provenance and Authenticity of Seafood: A Review of Current Methodologies. Trends Food Sci. Technol. 2019, 91, 294–304. [Google Scholar] [CrossRef]
- Sun, Y.; Zhang, M.; Fang, Z. Efficient Physical Extraction of Active Constituents from Edible Fungi and Their Potential Bioactivities: A Review. Trends Food Sci. Technol. 2020, 105, 468–482. [Google Scholar] [CrossRef]
- Zhu, L.; Spachos, P. Support Vector Machine and YOLO for a Mobile Food Grading System. Internet Things 2021, 13, 100359. [Google Scholar] [CrossRef]
- Su, Q.; Kondo, N.; Li, M.; Sun, H.; Al Riza, D.F.; Habaragamuwa, H. Potato Quality Grading Based on Machine Vision and 3D Shape Analysis. Comput. Electron. Agric. 2018, 152, 261–268. [Google Scholar] [CrossRef]
- Benalia, S.; Cubero, S.; Prats-Montalbán, J.M.; Bernardi, B.; Zimbalatti, G.; Blasco, J. Computer Vision for Automatic Quality Inspection of Dried Figs (Ficus carica L.) in Real-Time. Comput. Electron. Agric. 2016, 120, 17–25. [Google Scholar] [CrossRef]
- Hashim, S.B.H.; Elrasheid Tahir, H.; Liu, L.; Zhang, J.; Zhai, X.; Ali Mahdi, A.; Nureldin Awad, F.; Hassan, M.M.; Zou, X.; Shi, J. Intelligent Colorimetric pH Sensoring Packaging Films Based on Sugarcane Wax/Agar Integrated with Butterfly Pea Flower Extract for Optical Tracking of Shrimp Freshness. Food Chem. 2022, 373, 131514. [Google Scholar] [CrossRef] [PubMed]
- Liu, L.; Wu, W.; Zheng, L.; Yu, J.; Sun, P.; Shao, P. Intelligent Packaging Films Incorporated with Anthocyanins-Loaded Ovalbumin-Carboxymethyl Cellulose Nanocomplexes for Food Freshness Monitoring. Food Chem. 2022, 387, 132908. [Google Scholar] [CrossRef] [PubMed]
- Xu, F.; Ge, L.; Li, Z.; Lin, H.; Mao, X. Development and Application of a Tyrosinase-Based Time-Temperature Indicator (TTI) for Determining the Quality of Turbot Sashimi. J. Ocean. Univ. China 2017, 16, 847–854. [Google Scholar] [CrossRef]
- Ezhilan, M.; Nesakumar, N.; Babu, K.J.; Srinandan, C.S.; Rayappan, J.B.B. Freshness Assessment of Broccoli Using Electronic Nose. Measurement 2019, 145, 735–743. [Google Scholar] [CrossRef]
- Grassi, S.; Benedetti, S.; Magnani, L.; Pianezzola, A.; Buratti, S. Seafood Freshness: E-Nose Data for Classification Purposes. Food Control 2022, 138, 108994. [Google Scholar] [CrossRef]
- da Silva Ferreira, M.V.; de Moraes, I.A.; Passos, R.V.L.; Barbin, D.F.; Barbosa, J.L. Determination of Pitaya Quality Using Portable NIR Spectroscopy and Innovative Low-Cost Electronic Nose. Sci. Hortic. 2023, 310, 111784. [Google Scholar] [CrossRef]
- Wijaya, D.R.; Sarno, R.; Zulaika, E.; Sabila, S.I. Development of Mobile Electronic Nose for Beef Quality Monitoring. Procedia Comput. Sci. 2017, 124, 728–735. [Google Scholar] [CrossRef]
- Choi, J.-H.; Chen, P.-A.; Lee, B.; Yim, S.-H.; Kim, M.-S.; Bae, Y.-S.; Lim, D.-C.; Seo, H.-J. Portable, Non-Destructive Tester Integrating VIS/NIR Reflectance Spectroscopy for the Detection of Sugar Content in Asian Pears. Sci. Hortic. 2017, 220, 147–153. [Google Scholar] [CrossRef]
- De Marchi, M. On-Line Prediction of Beef Quality Traits Using near Infrared Spectroscopy. Meat Sci. 2013, 94, 455–460. [Google Scholar] [CrossRef]
- Xu, X.; Mo, J.; Xie, L.; Ying, Y. Influences of Detection Position and Double Detection Regions on Determining Soluble Solids Content (SSC) for Apples Using On-Line Visible/Near-Infrared (Vis/NIR) Spectroscopy. Food Anal. Meth. 2019, 12, 2078–2085. [Google Scholar] [CrossRef]
- Xu, S.; Ren, J.; Lu, H.; Wang, X.; Sun, X.; Liang, X. Nondestructive Detection and Grading of Flesh Translucency in Pineapples with Visible and Near-Infrared Spectroscopy. Postharvest Biol. Technol. 2022, 192, 112029. [Google Scholar] [CrossRef]
- Qin, J.; Burks, T.F.; Zhao, X.; Niphadkar, N.; Ritenour, M.A. Development of a Two-Band Spectral Imaging System for Real-Time Citrus Canker Detection. J. Food Eng. 2012, 108, 87–93. [Google Scholar] [CrossRef]
- Tang, X.; Rao, L.; Xie, L.; Yan, M.; Chen, Z.; Liu, S.; Chen, L.; Xiao, S.; Ding, N.; Zhang, Z.; et al. Quantification and Visualization of Meat Quality Traits in Pork Using Hyperspectral Imaging. Meat Sci. 2023, 196, 109052. [Google Scholar] [CrossRef]
- Huang, X.; Meng, Q.; Wu, Z.; He, F.; Tian, P.; Lin, J.; Zhu, H.; Zhou, X.; Huang, Y. Detection of Early Bruises in Gongcheng Persimmon Using Hyperspectral Imaging. Infrared Phys. Technol. 2022, 125, 104316. [Google Scholar] [CrossRef]
- Shao, Y.; Liu, Y.; Xuan, G.; Shi, Y.; Li, Q.; Hu, Z. Detection and Analysis of Sweet Potato Defects Based on Hyperspectral Imaging Technology. Infrared Phys. Technol. 2022, 127, 104403. [Google Scholar] [CrossRef]
- Lv, W.; Zhang, M.; Wang, Y.; Adhikari, B. Online Measurement of Moisture Content, Moisture Distribution, and State of Water in Corn Kernels during Microwave Vacuum Drying Using Novel Smart NMR/MRI Detection System. Dry. Technol. 2018, 36, 1592–1602. [Google Scholar] [CrossRef]
- Nakashima, Y.; Shiba, N. Nondestructive Measurement of Intramuscular Fat Content of Fresh Beef Meat by a Hand-Held Magnetic Resonance Sensor. Int. J. Food Prop. 2021, 24, 1722–1736. [Google Scholar] [CrossRef]
- Nakashima, Y. Development of a Hand-Held Magnetic Resonance Sensor for the Nondestructive Quantification of Fat and Lean Meat of Fresh Tuna. J. Food Meas. Charact. 2020, 14, 2947–2955. [Google Scholar] [CrossRef]
- Cheng, S.; Tang, Y.; Zhang, T.; Song, Y.; Wang, X.; Wang, H.; Wang, H.; Tan, M. Approach for Monitoring the Dynamic States of Water in Shrimp during Drying Process with LF-NMR and MRI. Dry. Technol. 2018, 36, 841–848. [Google Scholar] [CrossRef]
- Fu, Y.; Wang, Y.; Lin, W.; Deng, Y.; Sun, H.; Yu, Y.; Lan, Y.; Cai, H.; Sun, Q. A Novel Non-Destructive Detection of Deteriorative Dried Longan Fruits Using Machine Learning Algorithms Based on Low Field Nuclear Magnetic Resonance. J. Food Meas. Charact. 2022, 16, 652–661. [Google Scholar] [CrossRef]
- Kim, K.-B.; Lee, S.; Kim, M.-S.; Cho, B.-K. Determination of Apple Firmness by Nondestructive Ultrasonic Measurement. Postharvest Biol. Technol. 2009, 52, 44–48. [Google Scholar] [CrossRef]
- Mizrach, A.; Flitsanov, U. Nondestructive Ultrasonic Determination of Avocado Softening Process. J. Food Eng. 1999, 40, 139–144. [Google Scholar] [CrossRef]
- Soltani Firouz, M.; Farahmandi, A.; Hosseinpour, S. Early Detection of Freeze Damage in Navel Orange Fruit Using Nondestructive Low Intensity Ultrasound Coupled with Machine Learning. Food Anal. Meth. 2021, 14, 1140–1149. [Google Scholar] [CrossRef]
- de Prados, M.; Fulladosa, E.; Gou, P.; Muñoz, I.; Garcia-Perez, J.V.; Benedito, J. Non-Destructive Determination of Fat Content in Green Hams Using Ultrasound and X-Rays. Meat Sci. 2015, 104, 37–43. [Google Scholar] [CrossRef] [PubMed]
- Sun, D.-W. Computer Vision––An Objective, Rapid and Non-Contact Quality Evaluation Tool for the Food Industry. J. Food Eng. 2004, 61, 1–2. [Google Scholar] [CrossRef]
- Xiao, Z.; Wang, J.; Han, L.; Guo, S.; Cui, Q. Application of Machine Vision System in Food Detection. Front. Nutr. 2022, 9, 888245. [Google Scholar] [CrossRef] [PubMed]
- Xu, J.-C.; Zhang, M.; Mujumdar, A.S.; Adhikari, B. Recent Developments in Smart Freezing Technology Applied to Fresh Foods. Crit. Rev. Food Sci. Nutr. 2017, 57, 2835–2843. [Google Scholar] [CrossRef] [PubMed]
- Dairath, M.H.; Akram, M.W.; Mehmood, M.A.; Sarwar, H.U.; Akram, M.Z.; Omar, M.M.; Faheem, M. Computer Vision-Based Prototype Robotic Picking Cum Grading System for Fruits. Smart Agric. Technol. 2023, 4, 100210. [Google Scholar] [CrossRef]
- Ma, J.; Sun, D.-W.; Qu, J.-H.; Liu, D.; Pu, H.; Gao, W.-H.; Zeng, X.-A. Applications of Computer Vision for Assessing Quality of Agri-Food Products: A Review of Recent Research Advances. Crit. Rev. Food Sci. Nutr. 2016, 56, 113–127. [Google Scholar] [CrossRef]
- Saikumar, A.; Nickhil, C.; Badwaik, L.S. Physicochemical Characterization of Elephant Apple (Dillenia indica L.) Fruit and Its Mass and Volume Modeling Using Computer Vision. Sci. Hortic. 2023, 314, 111947. [Google Scholar] [CrossRef]
- Lind, R.; Murhed, A. Computer Vision in Food Processing: An Overview. In Computer Vision Technology in the Food and Beverage Industries; Elsevier: Amsterdam, The Netherlands, 2012; pp. 133–149. ISBN 978-0-85709-036-2. [Google Scholar]
- Zhang, B.; Gu, B.; Tian, G.; Zhou, J.; Huang, J.; Xiong, Y. Challenges and Solutions of Optical-Based Nondestructive Quality Inspection for Robotic Fruit and Vegetable Grading Systems: A Technical Review. Trends Food Sci. Technol. 2018, 81, 213–231. [Google Scholar] [CrossRef]
- Sivaranjani, A.; Senthilrani, S.; Ashok Kumar, B.; Senthil Murugan, A. An Overview of Various Computer Vision-Based Grading System for Various Agricultural Products. J. Hortic. Sci. Biotechnol. 2022, 97, 137–159. [Google Scholar] [CrossRef]
- Kaushal, S.; Tammineni, D.K.; Rana, P.; Sharma, M.; Sridhar, K.; Chen, H.-H. Computer Vision and Deep Learning-Based Approaches for Detection of Food Nutrients/Nutrition: New Insights and Advances. Trends Food Sci. Technol. 2024, 146, 104408. [Google Scholar] [CrossRef]
- Echegaray, N.; Guzel, N.; Kumar, M.; Guzel, M.; Hassoun, A.; Lorenzo, J.M. Recent Advancements in Natural Colorants and Their Application as Coloring in Food and in Intelligent Food Packaging. Food Chem. 2023, 404, 134453. [Google Scholar] [CrossRef] [PubMed]
- Guo, H.; Shao, C.; Ma, Y.; Zhang, Y.; Lu, P. Development of Active and Intelligent pH Food Packaging Composite Films Incorporated with Litchi Shell Extract as an Indicator. Int. J. Biol. Macromol. 2023, 226, 77–89. [Google Scholar] [CrossRef]
- Lei, Y.; Yao, Q.; Jin, Z.; Wang, Y.-C. Intelligent Films Based on Pectin, Sodium Alginate, Cellulose Nanocrystals, and Anthocyanins for Monitoring Food Freshness. Food Chem. 2023, 404, 134528. [Google Scholar] [CrossRef] [PubMed]
- Azman, N.H.; Khairul, W.M.; Sarbon, N.M. A Comprehensive Review on Biocompatible Film Sensor Containing Natural Extract: Active/Intelligent Food Packaging. Food Control 2022, 141, 109189. [Google Scholar] [CrossRef]
- Wen, Y.; Liu, J.; Jiang, L.; Zhu, Z.; He, S.; He, S.; Shao, W. Development of Intelligent/Active Food Packaging Film Based on TEMPO-Oxidized Bacterial Cellulose Containing Thymol and Anthocyanin-Rich Purple Potato Extract for Shelf Life Extension of Shrimp. Food Packag. Shelf Life 2021, 29, 100709. [Google Scholar] [CrossRef]
- Shi, C.; Han, J.; Sun, X.; Guo, Y.; Yang, X.; Jia, Z. An Intelligent Colorimetric Film Based on Complex Anthocyanins and Bacterial Cellulose Nanofibers for Tilapia Freshness Detection in an Actual Cold Chain. Int. J. Biol. Macromol. 2022, 221, 183–192. [Google Scholar] [CrossRef]
- Wang, F.; Xie, C.; Tang, H.; Hao, W.; Wu, J.; Sun, Y.; Sun, J.; Liu, Y.; Jiang, L. Development, Characterization and Application of Intelligent/Active Packaging of Chitosan/Chitin Nanofibers Films Containing Eggplant Anthocyanins. Food Hydrocoll. 2023, 139, 108496. [Google Scholar] [CrossRef]
- Giannoglou, M.; Touli, A.; Platakou, E.; Tsironi, T.; Taoukis, P.S. Predictive Modeling and Selection of TTI Smart Labels for Monitoring the Quality and Shelf-Life of Frozen Seafood. Innov. Food Sci. Emerg. Technol. 2014, 26, 294–301. [Google Scholar] [CrossRef]
- Gao, T.; Tian, Y.; Zhu, Z.; Sun, D.-W. Modelling, Responses and Applications of Time-Temperature Indicators (TTIs) in Monitoring Fresh Food Quality. Trends Food Sci. Technol. 2020, 99, 311–322. [Google Scholar] [CrossRef]
- Popa, A.; Hnatiuc, M.; Paun, M.; Geman, O.; Hemanth, D.; Dorcea, D.; Son, L.; Ghita, S. An Intelligent IoT-Based Food Quality Monitoring Approach Using Low-Cost Sensors. Symmetry 2019, 11, 374. [Google Scholar] [CrossRef]
- Bhargava, N.; Sharanagat, V.S.; Mor, R.S.; Kumar, K. Active and Intelligent Biodegradable Packaging Films Using Food and Food Waste-Derived Bioactive Compounds: A Review. Trends Food Sci. Technol. 2020, 105, 385–401. [Google Scholar] [CrossRef]
- Jang, E.J.; Padhan, B.; Patel, M.; Pandey, J.K.; Xu, B.; Patel, R. Antibacterial and Biodegradable Food Packaging Film from Bacterial Cellulose. Food Control 2023, 153, 109902. [Google Scholar] [CrossRef]
- Zheng, L.; Liu, L.; Yu, J.; Shao, P. Novel Trends and Applications of Natural pH-Responsive Indicator Film in Food Packaging for Improved Quality Monitoring. Food Control 2022, 134, 108769. [Google Scholar] [CrossRef]
- Jia, W.; Liang, G.; Wang, Y.; Wang, J. Electronic Noses as a Powerful Tool for Assessing Meat Quality: A Mini Review. Food Anal. Meth. 2018, 11, 2916–2924. [Google Scholar] [CrossRef]
- Mohd Ali, M.; Hashim, N.; Abd Aziz, S.; Lasekan, O. Principles and Recent Advances in Electronic Nose for Quality Inspection of Agricultural and Food Products. Trends Food Sci. Technol. 2020, 99, 1–10. [Google Scholar] [CrossRef]
- Lu, L.; Hu, Z.; Hu, X.; Li, D.; Tian, S. Electronic Tongue and Electronic Nose for Food Quality and Safety. Food Res. Int. 2022, 162, 112214. [Google Scholar] [CrossRef]
- Tan, J.; Xu, J. Applications of Electronic Nose (e-Nose) and Electronic Tongue (e-Tongue) in Food Quality-Related Properties Determination: A Review. Artif. Intell. 2020, 4, 104–115. [Google Scholar] [CrossRef]
- Xing, Z.; Zogona, D.; Wu, T.; Pan, S.; Xu, X. Applications, Challenges and Prospects of Bionic Nose in Rapid Perception of Volatile Organic Compounds of Food. Food Chem. 2023, 415, 135650. [Google Scholar] [CrossRef] [PubMed]
- Mohd Ali, M.; Hashim, N.; Bejo, S.K.; Jahari, M.; Shahabudin, N.A. Innovative Non-Destructive Technologies for Quality Monitoring of Pineapples: Recent Advances and Applications. Trends Food Sci. Technol. 2023, 133, 176–188. [Google Scholar] [CrossRef]
- Shi, H.; Zhang, M.; Adhikari, B. Advances of Electronic Nose and Its Application in Fresh Foods: A Review. Crit. Rev. Food Sci. Nutr. 2018, 58, 2700–2710. [Google Scholar] [CrossRef] [PubMed]
- Haghbin, N.; Bakhshipour, A.; Mousanejad, S.; Zareiforoush, H. Monitoring Botrytis Cinerea Infection in Kiwifruit Using Electronic Nose and Machine Learning Techniques. Food Bioprocess. Technol. 2023, 16, 749–767. [Google Scholar] [CrossRef]
- Zhang, L.; Tian, F.; Liu, S.; Dang, L.; Peng, X.; Yin, X. Chaotic Time Series Prediction of E-Nose Sensor Drift in Embedded Phase Space. Sens. Actuator B Chem. 2013, 182, 71–79. [Google Scholar] [CrossRef]
- Górska-Horczyczak, E.; Guzek, D.; Molęda, Z.; Wojtasik-Kalinowska, I.; Brodowska, M.; Wierzbicka, A. Applications of Electronic Noses in Meat Analysis. Food Sci. Technol. 2016, 36, 389–395. [Google Scholar] [CrossRef]
- Castrica, M.; Panseri, S.; Siletti, E.; Borgonovo, F.; Chiesa, L.; Balzaretti, C.M. Evaluation of Smart Portable Device for Food Diagnostics: A Preliminary Study on Cape Hake Fillets (M. capensis and M. paradoxus). J. Chem. 2019, 2019, 2904724. [Google Scholar] [CrossRef]
- Zhang, J.; Wang, X.; Xia, J.; Xing, S.; Zhang, X. Flexible Sensing Enabled Intelligent Manipulator System (FSIMS) for Avocados (Persea Americana Mill) Ripeness Grading. J. Clean. Prod. 2022, 363, 132599. [Google Scholar] [CrossRef]
- Chen, H.; You, Z.; Wang, X.; Qiu, Q.; Ying, Y.; Wang, Y. An Artificial Olfactory Sensor Based on Flexible Metal–Organic Frameworks for Sensing VOCs. Biochem. Eng. J. 2022, 446, 137098. [Google Scholar] [CrossRef]
- Zhang, J.; Zhang, X.; Wei, X.; Xue, Y.; Wan, H.; Wang, P. Recent Advances in Acoustic Wave Biosensors for the Detection of Disease-Related Biomarkers: A Review. Anal. Chim. Acta 2021, 1164, 338321. [Google Scholar] [CrossRef] [PubMed]
- Foerster, J.; Truppel, I.; Bochow-Neß, O.; Geyer, M. Comparison of Acoustic Sensor Systems for Quality Analysis of Asparagus Using Scanning Laser Vibrometry for Visualization. Comput. Electron. Agric. 2013, 91, 10–18. [Google Scholar] [CrossRef]
- Pu, Y.-Y.; O’Donnell, C.; Tobin, J.T.; O’Shea, N. Review of Near-Infrared Spectroscopy as a Process Analytical Technology for Real-Time Product Monitoring in Dairy Processing. Int. Dairy. J. 2020, 103, 104623. [Google Scholar] [CrossRef]
- Jiang, Z.; Ying, J.; Wan, Y.; Wang, C.; Lin, X.; Liu, B. Non-Destructive Evaluation of Soluble Solids Content in Navel Orange by an on-Line Visible near-Infrared System with Four Parallel Spectrometers. Food Meas. 2023, 17, 4225–4235. [Google Scholar] [CrossRef]
- Yang, X.; Zhu, L.; Huang, X.; Zhang, Q.; Li, S.; Chen, Q.; Wang, Z.; Li, J. Determination of the Soluble Solids Content in Korla Fragrant Pears Based on Visible and Near-Infrared Spectroscopy Combined with Model Analysis and Variable Selection. Front. Plant Sci. 2022, 13, 938162. [Google Scholar] [CrossRef] [PubMed]
- Rong, D.; Wang, H.; Ying, Y.; Zhang, Z.; Zhang, Y. Peach Variety Detection Using VIS-NIR Spectroscopy and Deep Learning. Comput. Electron. Agric. 2020, 175, 105553. [Google Scholar] [CrossRef]
- Patel, N.; Toledo-Alvarado, H.; Bittante, G. Performance of Different Portable and Hand-Held near-Infrared Spectrometers for Predicting Beef Composition and Quality Characteristics in the Abattoir without Meat Sampling. Meat Sci. 2021, 178, 108518. [Google Scholar] [CrossRef] [PubMed]
- Li, L.; Jang, X.; Li, B.; Liu, Y. Wavelength Selection Method for Near-Infrared Spectroscopy Based on Standard-Sample Calibration Transfer of Mango and Apple. Comput. Electron. Agric. 2021, 190, 106448. [Google Scholar] [CrossRef]
- Tian, P.; Meng, Q.; Wu, Z.; Lin, J.; Huang, X.; Zhu, H.; Zhou, X.; Qiu, Z.; Huang, Y.; Li, Y. Detection of Mango Soluble Solid Content Using Hyperspectral Imaging Technology. Infrared Phys. Technol. 2023, 129, 104576. [Google Scholar] [CrossRef]
- Zhang, L.; Sun, H.; Rao, Z.; Ji, H. Hyperspectral Imaging Technology Combined with Deep Forest Model to Identify Frost-Damaged Rice Seeds. Spectroc. Acta Pt. A-Molec. Biomolec. Spectr. 2020, 229, 117973. [Google Scholar] [CrossRef]
- Wang, F.; Zhao, C.; Yang, H.; Jiang, H.; Li, L.; Yang, G. Non-Destructive and in-Site Estimation of Apple Quality and Maturity by Hyperspectral Imaging. Comput. Electron. Agric. 2022, 195, 106843. [Google Scholar] [CrossRef]
- Wieme, J.; Mollazade, K.; Malounas, I.; Zude-Sasse, M.; Zhao, M.; Gowen, A.; Argyropoulos, D.; Fountas, S.; Van Beek, J. Application of Hyperspectral Imaging Systems and Artificial Intelligence for Quality Assessment of Fruit, Vegetables and Mushrooms: A Review. Biosyst. Eng. 2022, 222, 156–176. [Google Scholar] [CrossRef]
- Benelli, A.; Cevoli, C.; Fabbri, A.; Ragni, L. Ripeness Evaluation of Kiwifruit by Hyperspectral Imaging. Biosyst. Eng. 2022, 223, 42–52. [Google Scholar] [CrossRef]
- Shao, Y.; Shi, Y.; Wang, K.; Li, F.; Zhou, G.; Xuan, G. Detection of Small Yellow Croaker Freshness by Hyperspectral Imaging. J. Food Compos. Anal. 2023, 115, 104980. [Google Scholar] [CrossRef]
- Sun, Z.; Pan, H.; Zuo, M.; Li, J.; Liang, L.; Ho, C.-T.; Zou, X. Non-Destructive Assessment of Equivalent Umami Concentrations in Salmon Using Hyperspectral Imaging Technology Combined with Multivariate Algorithms. Spectroc. Acta Pt. A-Molec. Biomolec. Spectr. 2023, 285, 121890. [Google Scholar] [CrossRef] [PubMed]
- Zhang, J.; Guo, Z.; Ren, Z.; Wang, S.; Yue, M.; Zhang, S.; Yin, X.; Gong, K.; Ma, C. Rapid Determination of Protein, Starch and Moisture Content in Wheat Flour by near-Infrared Hyperspectral Imaging. J. Food Compos. Anal. 2023, 117, 105134. [Google Scholar] [CrossRef]
- Zhu, D.-Y.; Deng, Z.-H.; Chen, S.-W. A Review of Nuclear Magnetic Resonance (NMR) Technology Applied in the Characterization of Polymer Gels for Petroleum Reservoir Conformance Control. Pet. Sci. 2021, 18, 1760–1775. [Google Scholar] [CrossRef]
- Loudiyi, M.; Temiz, H.T.; Sahar, A.; Haseeb Ahmad, M.; Boukria, O.; Hassoun, A.; Aït-Kaddour, A. Spectroscopic Techniques for Monitoring Changes in the Quality of Milk and Other Dairy Products during Processing and Storage. Crit. Rev. Food Sci. Nutr. 2022, 62, 3063–3087. [Google Scholar] [CrossRef]
- Moraes, T.B.; Colnago, L.A. Noninvasive Analyses of Food Products Using Low-Field Time-Domain NMR: A Review of Relaxometry Methods. Braz. J. Phys. 2022, 52, 43. [Google Scholar] [CrossRef]
- Rodríguez-Alonso, E.; Vergeldt, F.J.; van der Goot, A.J. TD-NMR to Understand Water-Binding Food Properties. Magn. Reson. Chem. 2019, 57, 603–606. [Google Scholar] [CrossRef]
- Chitrakar, B.; Zhang, M.; Bhandari, B. Novel Intelligent Detection of Safer Water Activity by LF-NMR Spectra for Selected Fruits and Vegetables during Drying. Food Bioprocess. Technol. 2019, 12, 1093–1101. [Google Scholar] [CrossRef]
- Ezeanaka, M.C.; Nsor-Atindana, J.; Zhang, M. Online Low-Field Nuclear Magnetic Resonance (LF-NMR) and Magnetic Resonance Imaging (MRI) for Food Quality Optimization in Food Processing. Food Bioprocess. Technol. 2019, 12, 1435–1451. [Google Scholar] [CrossRef]
- Cheng, S.; Li, R.; Yang, H.; Wang, S.; Tan, M. Water Status and Distribution in Shiitake Mushroom and the Effects of Drying on Water Dynamics Assessed by LF-NMR and MRI. Dry. Technol. 2020, 38, 1001–1010. [Google Scholar] [CrossRef]
- Gudjónsdóttir, M.; Romotowska, P.E.; Karlsdóttir, M.G.; Arason, S. Low Field Nuclear Magnetic Resonance and Multivariate Analysis for Prediction of Physicochemical Characteristics of Atlantic Mackerel as Affected by Season of Catch, Freezing Method, and Frozen Storage Duration. Food Res. Int. 2019, 116, 471–482. [Google Scholar] [CrossRef] [PubMed]
- Fan, K.; Zhang, M. Recent Developments in the Food Quality Detected by Non-Invasive Nuclear Magnetic Resonance Technology. Crit. Rev. Food Sci. Nutr. 2019, 59, 2202–2213. [Google Scholar] [CrossRef] [PubMed]
- Wu, J.; Li, Y.; Gao, X. Monitoring a Typical Fermentation Process of Natto by Low-Field Nuclear Magnetic Resonance (LF-NMR) and Magnetic Resonance Imaging (MRI) Techniques. Anal. Methods 2016, 8, 7135–7140. [Google Scholar] [CrossRef]
- Curti, E.; Anedda, R. TD-NMR as a Quality Control Tool for Dairy Products: A Study on Fiore Sardo PDO Cheese. Food Bioprocess. Technol. 2023, 16, 459–465. [Google Scholar] [CrossRef]
- Hatzakis, E. Nuclear Magnetic Resonance (NMR) Spectroscopy in Food Science: A Comprehensive Review. Compr. Rev. Food Sci. Food Saf. 2019, 18, 189–220. [Google Scholar] [CrossRef]
- Wu, X.; Zhang, M.; Bhandari, B. A Novel Infrared Freeze Drying (IRFD) Technology to Lower the Energy Consumption and Keep the Quality of Cordyceps Militaris. Innov. Food Sci. Emerg. Technol. 2019, 54, 34–42. [Google Scholar] [CrossRef]
- Su, Y.; Zhang, M.; Mujumdar, A.S. Recent Developments in Smart Drying Technology. Dry. Technol. 2015, 33, 260–276. [Google Scholar] [CrossRef]
- McClements, D.J. Advances in the Application of Ultrasound in Food Analysis and Processing. Trends Food Sci. Technol. 1995, 6, 293–299. [Google Scholar] [CrossRef]
- Jiang, Q.; Zhang, M.; Xu, B. Application of Ultrasonic Technology in Postharvested Fruits and Vegetables Storage: A Review. Ultrason. Sonochem. 2020, 69, 105261. [Google Scholar] [CrossRef]
- Morrison, D.S.; Abeyratne, U.R. Ultrasonic Technique for Non-Destructive Quality Evaluation of Oranges. J. Food Eng. 2014, 141, 107–112. [Google Scholar] [CrossRef]
- Pandiselvam, R.; Aydar, A.Y.; Kutlu, N.; Aslam, R.; Sahni, P.; Mitharwal, S.; Gavahian, M.; Kumar, M.; Raposo, A.; Yoo, S.; et al. Individual and Interactive Effect of Ultrasound Pre-Treatment on Drying Kinetics and Biochemical Qualities of Food: A Critical Review. Ultrason. Sonochem. 2023, 92, 106261. [Google Scholar] [CrossRef] [PubMed]
- Wang, J.; Fan, L. Effect of Ultrasound Treatment on Microbial Inhibition and Quality Maintenance of Green Asparagus during Cold Storage. Ultrason. Sonochem. 2019, 58, 104631. [Google Scholar] [CrossRef] [PubMed]
- Zhang, X.; Zhang, M.; Devahastin, S.; Guo, Z. Effect of Combined Ultrasonication and Modified Atmosphere Packaging on Storage Quality of Pakchoi (Brassica chinensis L.). Food Bioprocess. Technol. 2019, 12, 1573–1583. [Google Scholar] [CrossRef]
- Charoux, C.M.G.; Ojha, K.S.; O’Donnell, C.P.; Cardoni, A.; Tiwari, B.K. Applications of Airborne Ultrasonic Technology in the Food Industry. J. Food Eng. 2017, 208, 28–36. [Google Scholar] [CrossRef]
- Yildiz, F.; Özdemir, A.T.; Uluışık, S. Evaluation Performance of Ultrasonic Testing on Fruit Quality Determination. J. Food Qual. 2019, 2019, 6810865. [Google Scholar] [CrossRef]
- Mizrach, A. Ultrasonic Technology for Quality Evaluation of Fresh Fruit and Vegetables in Pre- and Postharvest Processes. Postharvest Biol. Technol. 2008, 48, 315–330. [Google Scholar] [CrossRef]
- Feng, L.; Zhang, M.; Adhikari, B.; Guo, Z. Effect of Ultrasound Combined with Controlled Atmosphere on Postharvest Storage Quality of Cucumbers (Cucumis sativus L.). Food Bioprocess. Technol. 2018, 11, 1328–1338. [Google Scholar] [CrossRef]
- Mehannaoui, R. IoT-Based Food Traceability System: Architecture, Technologies, Applications, and Future Trends. Food Control 2023, 145, 109409. [Google Scholar] [CrossRef]
- Corallo, A. The Awareness Assessment of the Italian Agri-Food Industry Regarding Food Traceability Systems. Trends Food Sci. Technol. 2020, 101, 28–37. [Google Scholar] [CrossRef]
- Islam, S. Visualising Food Traceability Systems: A Novel System Architecture for Mapping Material and Information Flow. Trends Food Sci. Technol. 2021, 112, 708–719. [Google Scholar] [CrossRef]
- Liu, X.; Le Bourvellec, C.; Yu, J.; Zhao, L.; Wang, K.; Tao, Y.; Renard, C.M.G.C.; Hu, Z. Trends and Challenges on Fruit and Vegetable Processing: Insights into Sustainable, Traceable, Precise, Healthy, Intelligent, Personalized and Local Innovative Food Products. Trends Food Sci. Technol. 2022, 125, 12–25. [Google Scholar] [CrossRef]
- Zhang, Y.; Wang, W.; Yan, L.; Glamuzina, B.; Zhang, X. Development and Evaluation of an Intelligent Traceability System for Waterless Live Fish Transportation. Food Control 2019, 95, 283–297. [Google Scholar] [CrossRef]
- Ye, H.; Yang, J.; Xiao, G.; Zhao, Y.; Li, Z.; Bai, W.; Zeng, X.; Dong, H. A Comprehensive Overview of Emerging Techniques and Chemometrics for Authenticity and Traceability of Animal-Derived Food. Food Chem. 2023, 402, 134216. [Google Scholar] [CrossRef] [PubMed]
- Gao, G.; Xiao, K.; Chen, M. An Intelligent IoT-Based Control and Traceability System to Forecast and Maintain Water Quality in Freshwater Fish Farms. Comput. Electron. Agric. 2019, 166, 105013. [Google Scholar] [CrossRef]
- Kamilaris, A.; Fonts, A.; Prenafeta-Boldύ, F.X. The Rise of Blockchain Technology in Agriculture and Food Supply Chains. Trends Food Sci. Technol. 2019, 91, 640–652. [Google Scholar] [CrossRef]
- Fan, B.; Qian, J.; Wu, X.; Du, X.; Li, W.; Ji, Z.; Xin, X. Improving Continuous Traceability of Food Stuff by Using Barcode-RFID Bidirectional Transformation Equipment: Two Field Experiments. Food Control 2019, 98, 449–456. [Google Scholar] [CrossRef]
- Urbano, O.; Perles, A.; Pedraza, C.; Rubio-Arraez, S.; Castelló, M.L.; Ortola, M.D.; Mercado, R. Cost-Effective Implementation of a Temperature Traceability System Based on Smart RFID Tags and IoT Services. Sensors 2020, 20, 1163. [Google Scholar] [CrossRef]
- Abad, E.; Palacio, F.; Nuin, M.; de Zárate, A.G.; Juarros, A.; Gómez, J.M.; Marco, S. RFID Smart Tag for Traceability and Cold Chain Monitoring of Foods: Demonstration in an Intercontinental Fresh Fish Logistic Chain. J. Food Eng. 2009, 93, 394–399. [Google Scholar] [CrossRef]
- Cappai, M.G.; Rubiu, N.G.; Pinna, W. Economic Assessment of a Smart Traceability System (RFID+DNA) for Origin and Brand Protection of the Pork Product Labelled “Suinetto Di Sardegna”. Comput. Electron. Agric. 2018, 145, 248–252. [Google Scholar] [CrossRef]
- Conti, M. EVO-NFC: Extra Virgin Olive Oil Traceability Using NFC Suitable for Small-Medium Farms. IEEE Access 2022, 10, 20345–20356. [Google Scholar] [CrossRef]
- Mainetti, L.; Patrono, L.; Stefanizzi, M.L.; Vergallo, R. An Innovative and Low-Cost Gapless Traceability System of Fresh Vegetable Products Using RF Technologies and EPCglobal Standard. Comput. Electron. Agric. 2013, 98, 146–157. [Google Scholar] [CrossRef]
- Ma, T.; Wang, H.; Wei, M.; Lan, T.; Wang, J.; Bao, S.; Ge, Q.; Fang, Y.; Sun, X. Application of Smart-Phone Use in Rapid Food Detection, Food Traceability Systems, and Personalized Diet Guidance, Making Our Diet More Health. Food Res. Int. 2022, 152, 110918. [Google Scholar] [CrossRef] [PubMed]
- Song, T.; Xia, Z.; Liu, C.; Nie, J.; Zhou, Y.; Wadood, S.A.; Zhang, Y.; Li, C.; Rogers, K.M.; Yuan, Y. Model Optimization for Geographical Discrimination of Lentinula Edodes Based Stable Isotopes and Multi-Elements in China. J. Food Compos. Anal. 2023, 118, 105160. [Google Scholar] [CrossRef]
- Pianezze, S.; Camin, F.; Perini, M.; Corazzin, M.; Piasentier, E. Tracing Lamb Meat with Stable Isotope Ratio Analysis: A Review. Small Ruminant Res. 2021, 203, 106482. [Google Scholar] [CrossRef]
- Qian, L.; Li, D.; Song, X.; Zuo, F.; Zhang, D. Identification of Baha’sib Mung Beans Based on Fourier Transform near Infrared Spectroscopy and Partial Least Squares. J. Food Compos. Anal. 2022, 105, 104203. [Google Scholar] [CrossRef]
- Schievano, E.; Sbrizza, M.; Zuccato, V.; Piana, L.; Tessari, M. NMR Carbohydrate Profile in Tracing Acacia Honey Authenticity. Food Chem. 2020, 309, 125788. [Google Scholar] [CrossRef]
- Alfian, G.; Syafrudin, M.; Farooq, U.; Ma’arif, M.R.; Syaekhoni, M.A.; Fitriyani, N.L.; Lee, J.; Rhee, J. Improving Efficiency of RFID-Based Traceability System for Perishable Food by Utilizing IoT Sensors and Machine Learning Model. Food Control 2020, 110, 107016. [Google Scholar] [CrossRef]
- Zuo, J.; Feng, J.; Gameiro, M.G.; Tian, Y.; Liang, J.; Wang, Y.; Ding, J.; He, Q. RFID-Based Sensing in Smart Packaging for Food Applications: A Review. Future Foods 2022, 6, 100198. [Google Scholar] [CrossRef] [PubMed]
- Feng, J.; Fu, Z.; Wang, Z.; Xu, M.; Zhang, X. Development and Evaluation on a RFID-Based Traceability System for Cattle/Beef Quality Safety in China. Food Control 2013, 31, 314–325. [Google Scholar] [CrossRef]
- Hosseinpour, S.; Ilkhchi, A.H.; Aghbashlo, M. An Intelligent Machine Vision-Based Smartphone App for Beef Quality Evaluation. J. Food Eng. 2019, 248, 9–22. [Google Scholar] [CrossRef]
- Song, W.; Jiang, N.; Wang, H.; Vincent, J. Use of Smartphone Videos and Pattern Recognition for Food Authentication. Sens. Actuator B-Chem. 2020, 304, 127247. [Google Scholar] [CrossRef]
- Badia-Melis, R.; Mishra, P.; Ruiz-García, L. Food Traceability: New Trends and Recent Advances. A Review. Food Control 2015, 57, 393–401. [Google Scholar] [CrossRef]
- Pigini, D.; Conti, M. NFC-Based Traceability in the Food Chain. Sustainability 2017, 9, 1910. [Google Scholar] [CrossRef]
- Barge, P.; Biglia, A.; Comba, L.; Ricauda Aimonino, D.; Tortia, C.; Gay, P. Radio Frequency IDentification for Meat Supply-Chain Digitalisation. Sensors 2020, 20, 4957. [Google Scholar] [CrossRef]
- Chen, J.; Huang, Y.; Xia, P.; Zhang, Y.; Zhong, Y. Design and Implementation of Real-time Traceability Monitoring System for Agricultural Products Supply Chain under Internet of Things Architecture. Concurr. Comput. Pract. Exp. 2019, 31, e4766. [Google Scholar] [CrossRef]
- Kim, Y.G.; Woo, E. Consumer Acceptance of a Quick Response (QR) Code for the Food Traceability System: Application of an Extended Technology Acceptance Model (TAM). Food Res. Int. 2016, 85, 266–272. [Google Scholar] [CrossRef]
- Qian, J.; Xing, B.; Zhang, B.; Yang, H. Optimizing QR Code Readability for Curved Agro-Food Packages Using Response Surface Methodology to Improve Mobile Phone-Based Traceability. Food Packag. Shelf Life 2021, 28, 100638. [Google Scholar] [CrossRef]
- Yang, X.; Qian, J.; Li, J.; Ji, Z.; Fan, B.; Xing, B.; Li, W. A Real-Time Agro-Food Authentication and Supervision System on a Novel Code for Improving Traceability Credibility. Food Control 2016, 66, 17–26. [Google Scholar] [CrossRef]
- Zhi, L.; Xianmei, G.; Jian, Y.; Duoyong, Z.; Bin, L.; Zihong, Z.; Piao, C.; Dongguang, W. Quality Evaluation and Origin Traceability of the Imported and Domestic Saffron Spice (Crocus sativus L.) Products in China Market Using Chemical Composition and Stable Isotope Analysis. J. Food Compos. Anal. 2023, 118, 105202. [Google Scholar] [CrossRef]
- Liu, Y.; Ma, D.; Wang, X.; Liu, L.; Fan, Y.; Cao, J. Prediction of Chemical Composition and Geographical Origin Traceability of Chinese Export Tilapia Fillets Products by near Infrared Reflectance Spectroscopy. LWT—Food Sci. Technol. 2015, 60, 1214–1218. [Google Scholar] [CrossRef]
- Huo, Y.; Kamal, G.M.; Wang, J.; Liu, H.; Zhang, G.; Hu, Z.; Anwar, F.; Du, H. 1 H NMR-Based Metabolomics for Discrimination of Rice from Different Geographical Origins of China. J. Cereal Sci. 2017, 76, 243–252. [Google Scholar] [CrossRef]
- Wang, L.; He, Y.; Wu, Z. Design of a Blockchain-Enabled Traceability System Framework for Food Supply Chains. Foods 2022, 11, 744. [Google Scholar] [CrossRef] [PubMed]
- Lei, M.; Liu, S.; Luo, N.; Yang, X.; Sun, C. Trusted-Auditing Chain: A Security Blockchain Prototype Used in Agriculture Traceability. Heliyon 2022, 8, e11477. [Google Scholar] [CrossRef]
- Feng, H.; Wang, X.; Duan, Y.; Zhang, J.; Zhang, X. Applying Blockchain Technology to Improve Agri-Food Traceability: A Review of Development Methods, Benefits and Challenges. J. Clean. Prod. 2020, 260, 121031. [Google Scholar] [CrossRef]

| Equipment | Methods/Composition | Products | Function | Ref. |
|---|---|---|---|---|
| CV | The double-layer classifier detects ripeness and brown spots areas separately | Banana | Maturity detection classification | [19] |
| 3D stereo depth camera combined with deep learning algorithms | Potato | Evaluation of 3D shape defect detection | [20] | |
| Image segmentation techniques and vision system algorithms | Fig | Online quality classification | [21] | |
| Intelligent packaging film | Sugarcane wax, butterfly pea flower extract, and agar as the substrate | Shrimp | Freshness detection | [22] |
| Blueberry anthocyanins were encapsulated into protein–polysaccharide complexes | Mushroom | Storage freshness detection | [23] | |
| Time–temperature indicator (TTI) based on tyrosinase and tyrosine reactions | Turbot sashimi | Metamorphism detection | [24] | |
| Electronic nose | The sensor array consists of six chemo-resistive sensors capable of detecting various volatile organic compounds | Broccoli | Freshness detection | [25] |
| It consists of four specific metal oxide sensors, a photoionization detector, and a battery | Fish | Distinguishing fish | [26] | |
| Combined with near-infrared spectroscopy (NIR) | Pitaya | Predicting shelf life | [27] | |
| Combined with smart refrigerator and smart phone | Beef | Monitoring metamorphism | [28] | |
| NIR | Handheld instrument: consists of a portable battery, built-in sensor, and results display | Pear | Checking the sugar content | [29] |
| The measurement was made directly on the carcass surface using a fiber optic probe | Beef | Online inspection of beef quality | [30] | |
| It is composed of NIR testing, transportation part, classification operation and calculation control | Apple | Determination of soluble solid content | [31] | |
| It consists of nine halogen lamps and two spectral sensors | Pineapple | Testing the transparency of pineapple pulp | [32] | |
| HSI | Light source: twenty tungsten halide spotlights; image acquisition: spectroscope, two different wavelength bandpass filters and monochrome camera | Citrus | Determination of citrus canker | [33] |
| Using SpecimIQ hyperspectral camera combined with artificial neural network (ANN) algorithm | Pork | Quality prediction and freshness | [34] | |
| It consists of hyperspectral imager, halogen lamp, sample tray and computer, combined with minimum noise analysis method | Persimmon | Identification of health/injury | [35] | |
| Hyperspectral imager, light source and computer were used and then the algorithm is combined to build the model | Sweet potato | Defect detection | [36] | |
| NMR | Combined with microwave vacuum drying (MVD) | Corn kernels | Real-time determination of moisture status during drying | [37] |
| Lightweight handheld MR Scanner: a planar RF coil and a single-sided magnetic circuit form the sensor | Tuna and Beef | Quantitative analysis of fat content | [38,39] | |
| Transverse relaxation and magnetic resonance imaging were measured | Shrimp | Testing of dryness and quality | [40] | |
| Combined with deep learning neural network (DLNN) algorithm, lateral relaxation time was measured | Longan | Distinguishing between healthy fruit and defective fruit | [41] | |
| US | It is composed of ultrasonic pulse generator, special ultrasonic transmitting and receiving transducer, digital oscilloscope, and computer | Apple | Evaluating maturity and shelf life | [42] |
| The wave amplitude and propagation time at different distances on the pericarp are measured using ultrasonic probes | Avocado | Monitoring of internal changes | [43] | |
| The ultrasonic characteristics were measured by the through transmission mode, and then combined with the SVM method | Orange | Online grading | [44] | |
| It is composed of narrow-band ultrasonic transducer, ultrasonic pulse generator, digital oscilloscope, and computer | Raw ham | Determination of fat content | [45] |
| Equipment | Methods/Composition | Products | Function | Ref. |
|---|---|---|---|---|
| RFID | Barcode–RFID bidirectional conversion device | Beef | Segmentation of beef | [130] |
| It is composed of RFID technology and information processing system | Pumpkin | Cold chain monitoring | [131] | |
| Consists of smart tags and commercial readers | Fish | Real-time traceability and cold chain monitoring | [132] | |
| RFID technology is combined with molecular analysis algorithms (DNAs) | Pork | Origin tracing and disease surveillance | [133] | |
| NFC and Smartphones | The information is stored in NFC tags and accessed using smartphones | Olive oil | Complete history tracing | [134] |
| The combination of NFC, RFID, and data matrix technology | Vegetables | Tracking and transmitting data in storage | [135] | |
| The information is stored in an NFC chip and accessed by a smartphone | Cherry | Improving information transparency | [136] | |
| Stable isotope analysis | δ13C, δ15N, δ2H, δ18O, δ34S | Lentinus edodes | Identifying the origin | [137] |
| 13C,12C; 15N, 14N; 36S, 34S, 33S, 32S; 18O, 17O, 16O; 1H, 2H | Mutton | Geographic identification and tracing | [138] | |
| NIR | NIR combined partial least squares | Mung bean | Origin and brand protection | [139] |
| NMR | The sugar content was detected by NMR | Honey | Authenticity detection | [140] |
Disclaimer/Publisher’s Note: The statements, opinions and data contained in all publications are solely those of the individual author(s) and contributor(s) and not of MDPI and/or the editor(s). MDPI and/or the editor(s) disclaim responsibility for any injury to people or property resulting from any ideas, methods, instructions or products referred to in the content. |
© 2024 by the authors. Licensee MDPI, Basel, Switzerland. This article is an open access article distributed under the terms and conditions of the Creative Commons Attribution (CC BY) license (https://creativecommons.org/licenses/by/4.0/).
Share and Cite
Wang, D.; Zhang, M.; Jiang, Q.; Mujumdar, A.S. Intelligent System/Equipment for Quality Deterioration Detection of Fresh Food: Recent Advances and Application. Foods 2024, 13, 1662. https://doi.org/10.3390/foods13111662
Wang D, Zhang M, Jiang Q, Mujumdar AS. Intelligent System/Equipment for Quality Deterioration Detection of Fresh Food: Recent Advances and Application. Foods. 2024; 13(11):1662. https://doi.org/10.3390/foods13111662
Chicago/Turabian StyleWang, Dianyuan, Min Zhang, Qiyong Jiang, and Arun S. Mujumdar. 2024. "Intelligent System/Equipment for Quality Deterioration Detection of Fresh Food: Recent Advances and Application" Foods 13, no. 11: 1662. https://doi.org/10.3390/foods13111662
APA StyleWang, D., Zhang, M., Jiang, Q., & Mujumdar, A. S. (2024). Intelligent System/Equipment for Quality Deterioration Detection of Fresh Food: Recent Advances and Application. Foods, 13(11), 1662. https://doi.org/10.3390/foods13111662