
Autoformer-Based Model for Predicting and Assessing Wheat Quality Changes of Pesticide Residues during Storage

 ,
,
Abstract
1. Introduction
2. Materials and Methods
2.1. Materials
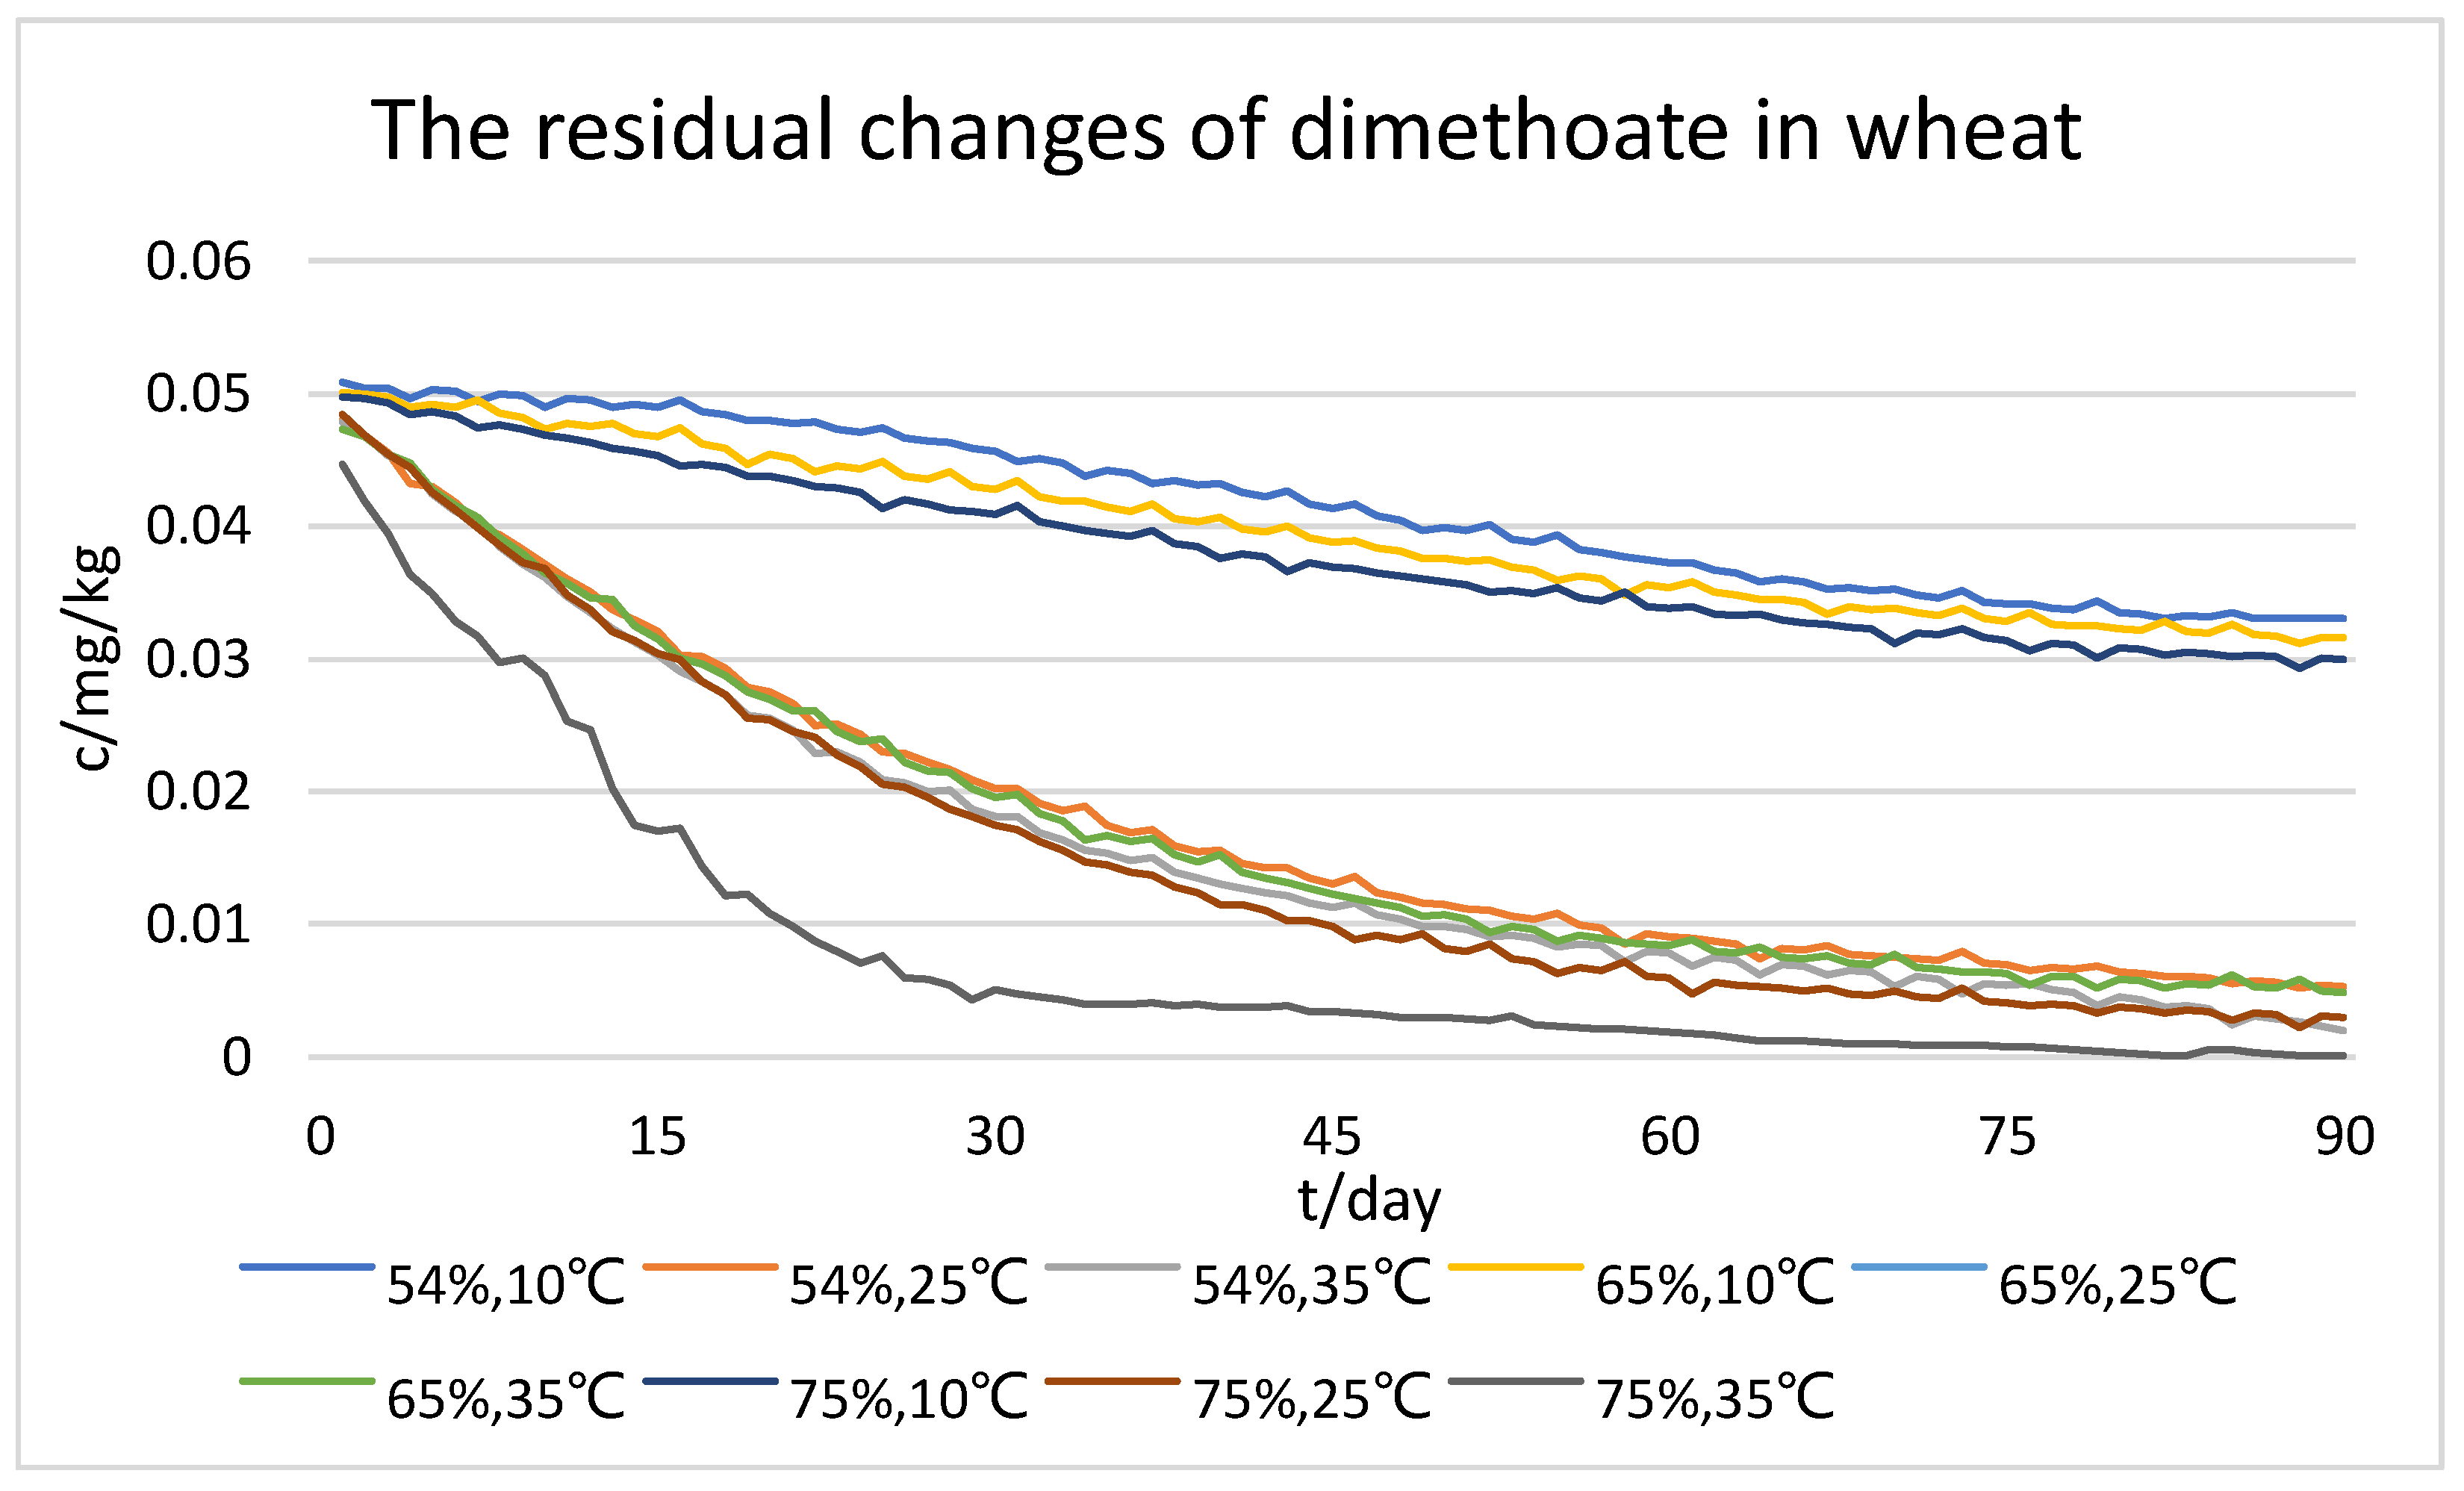
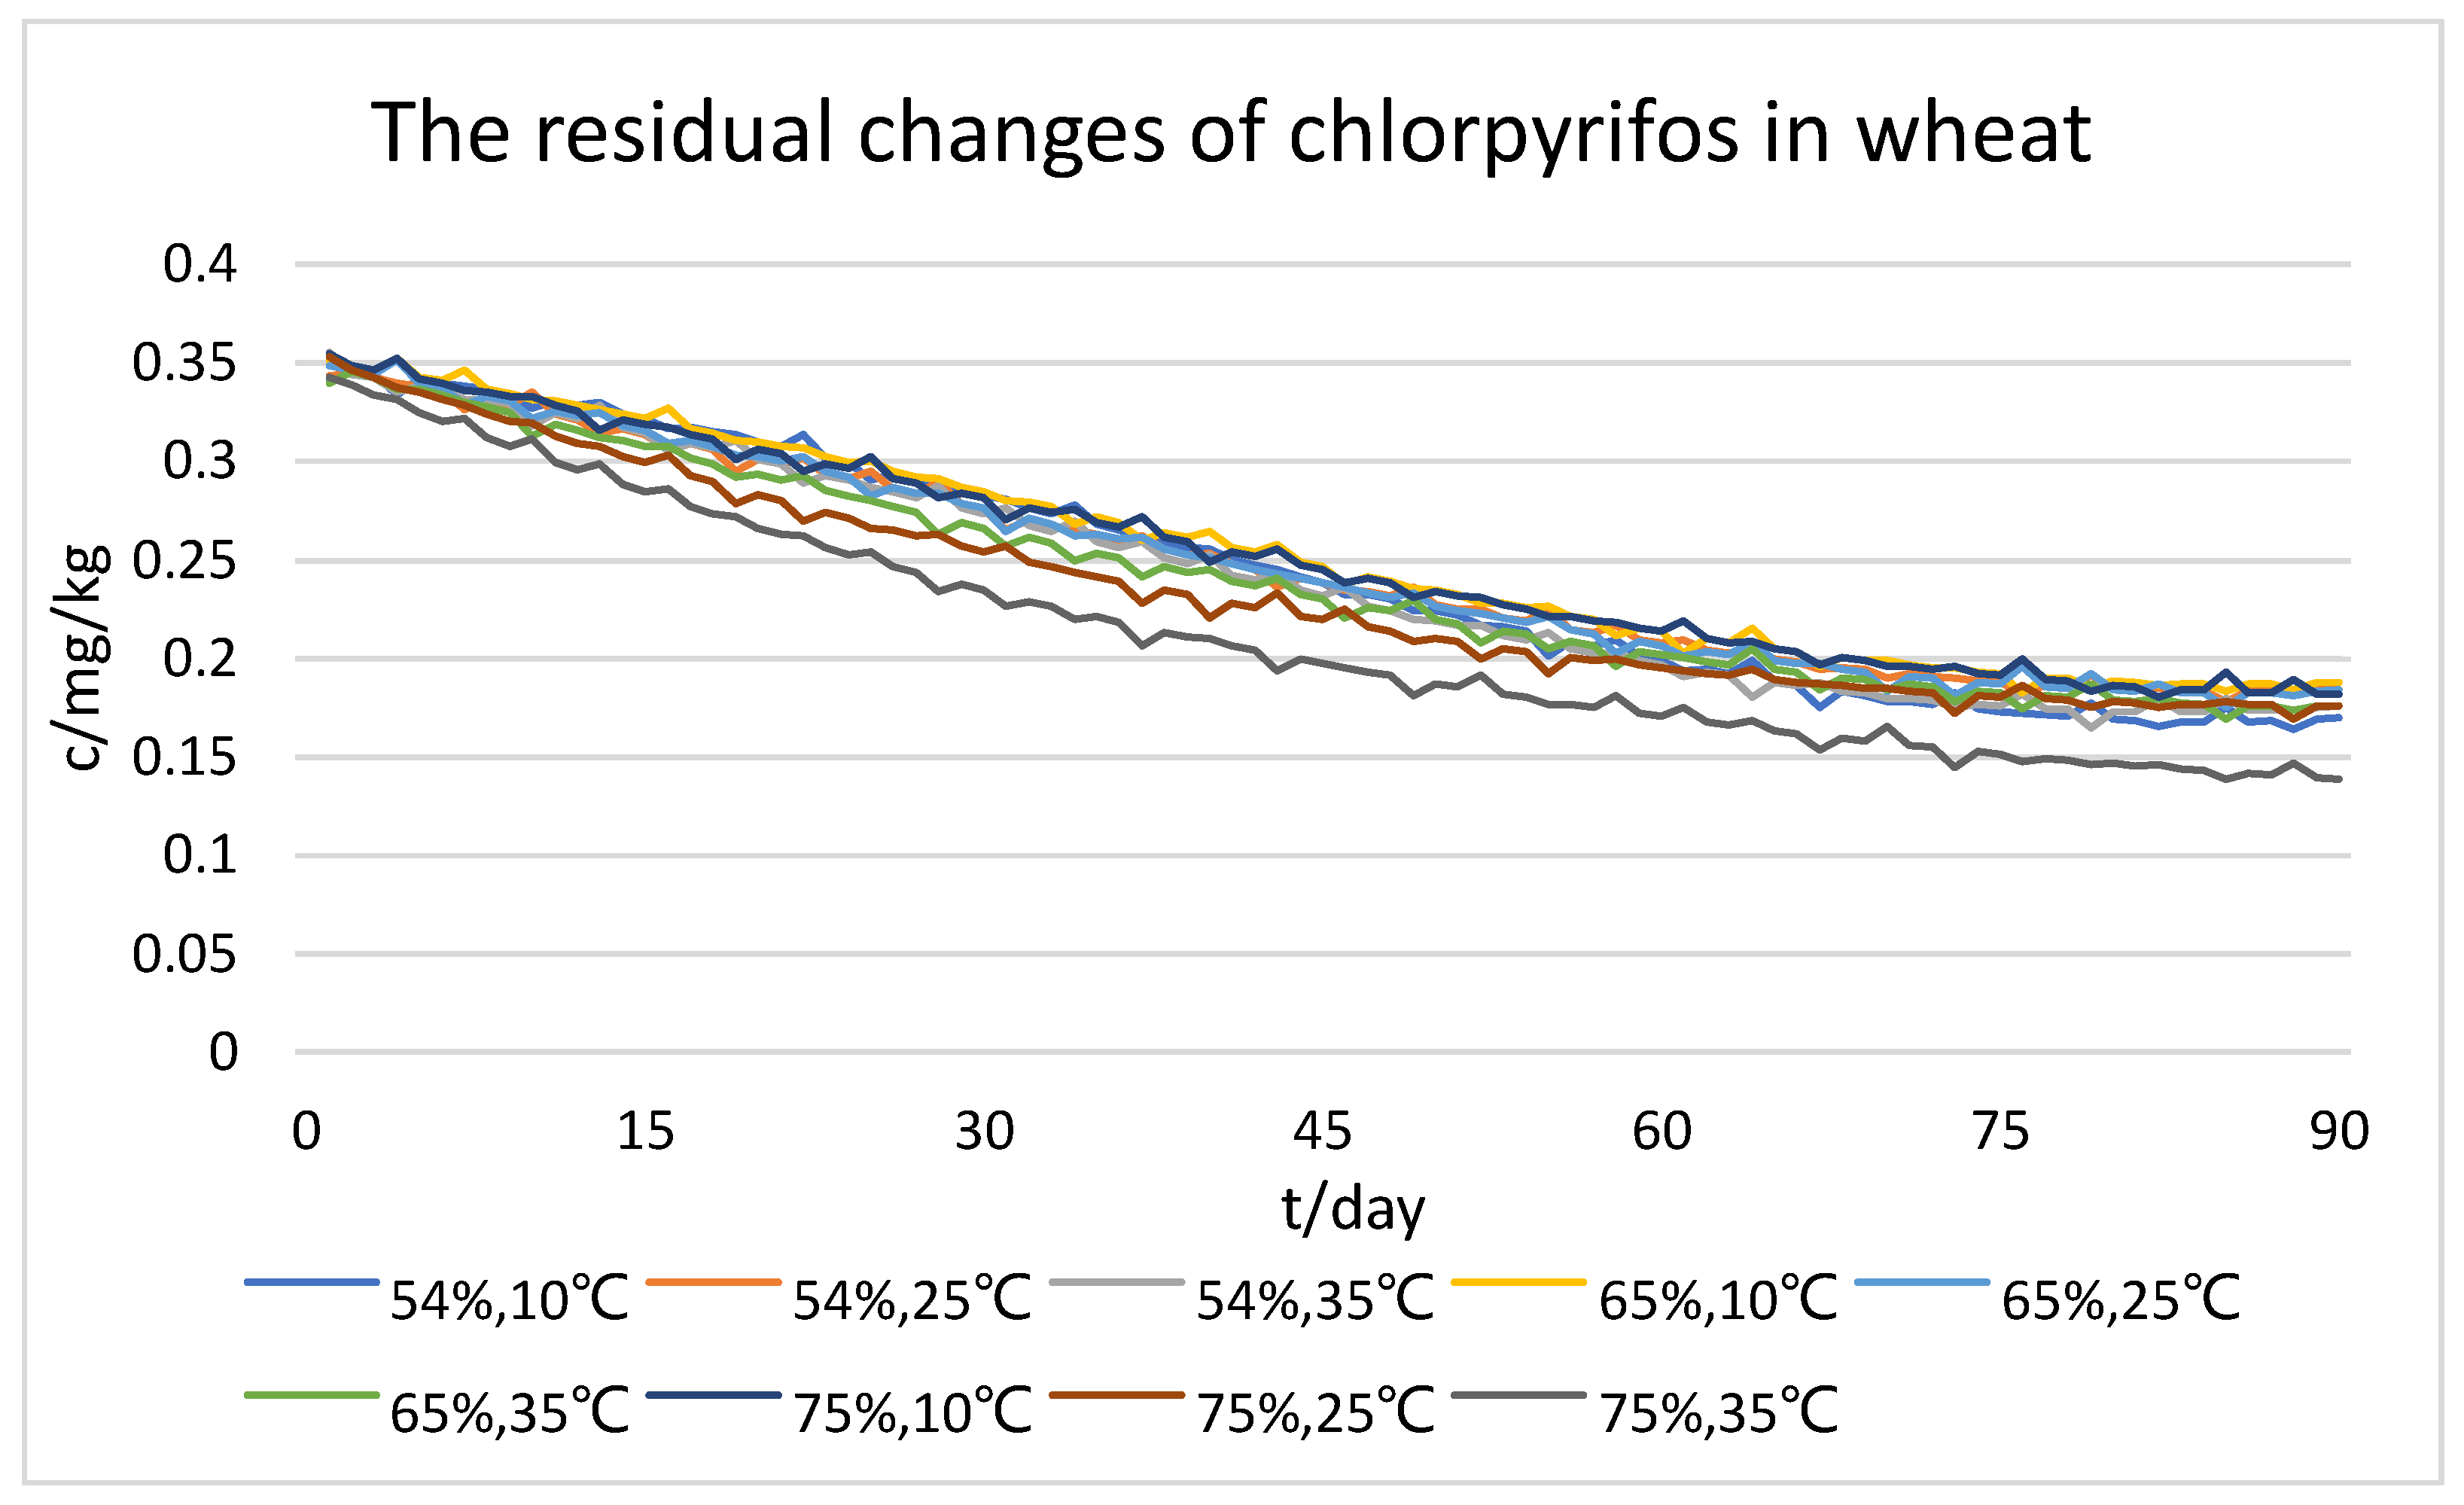
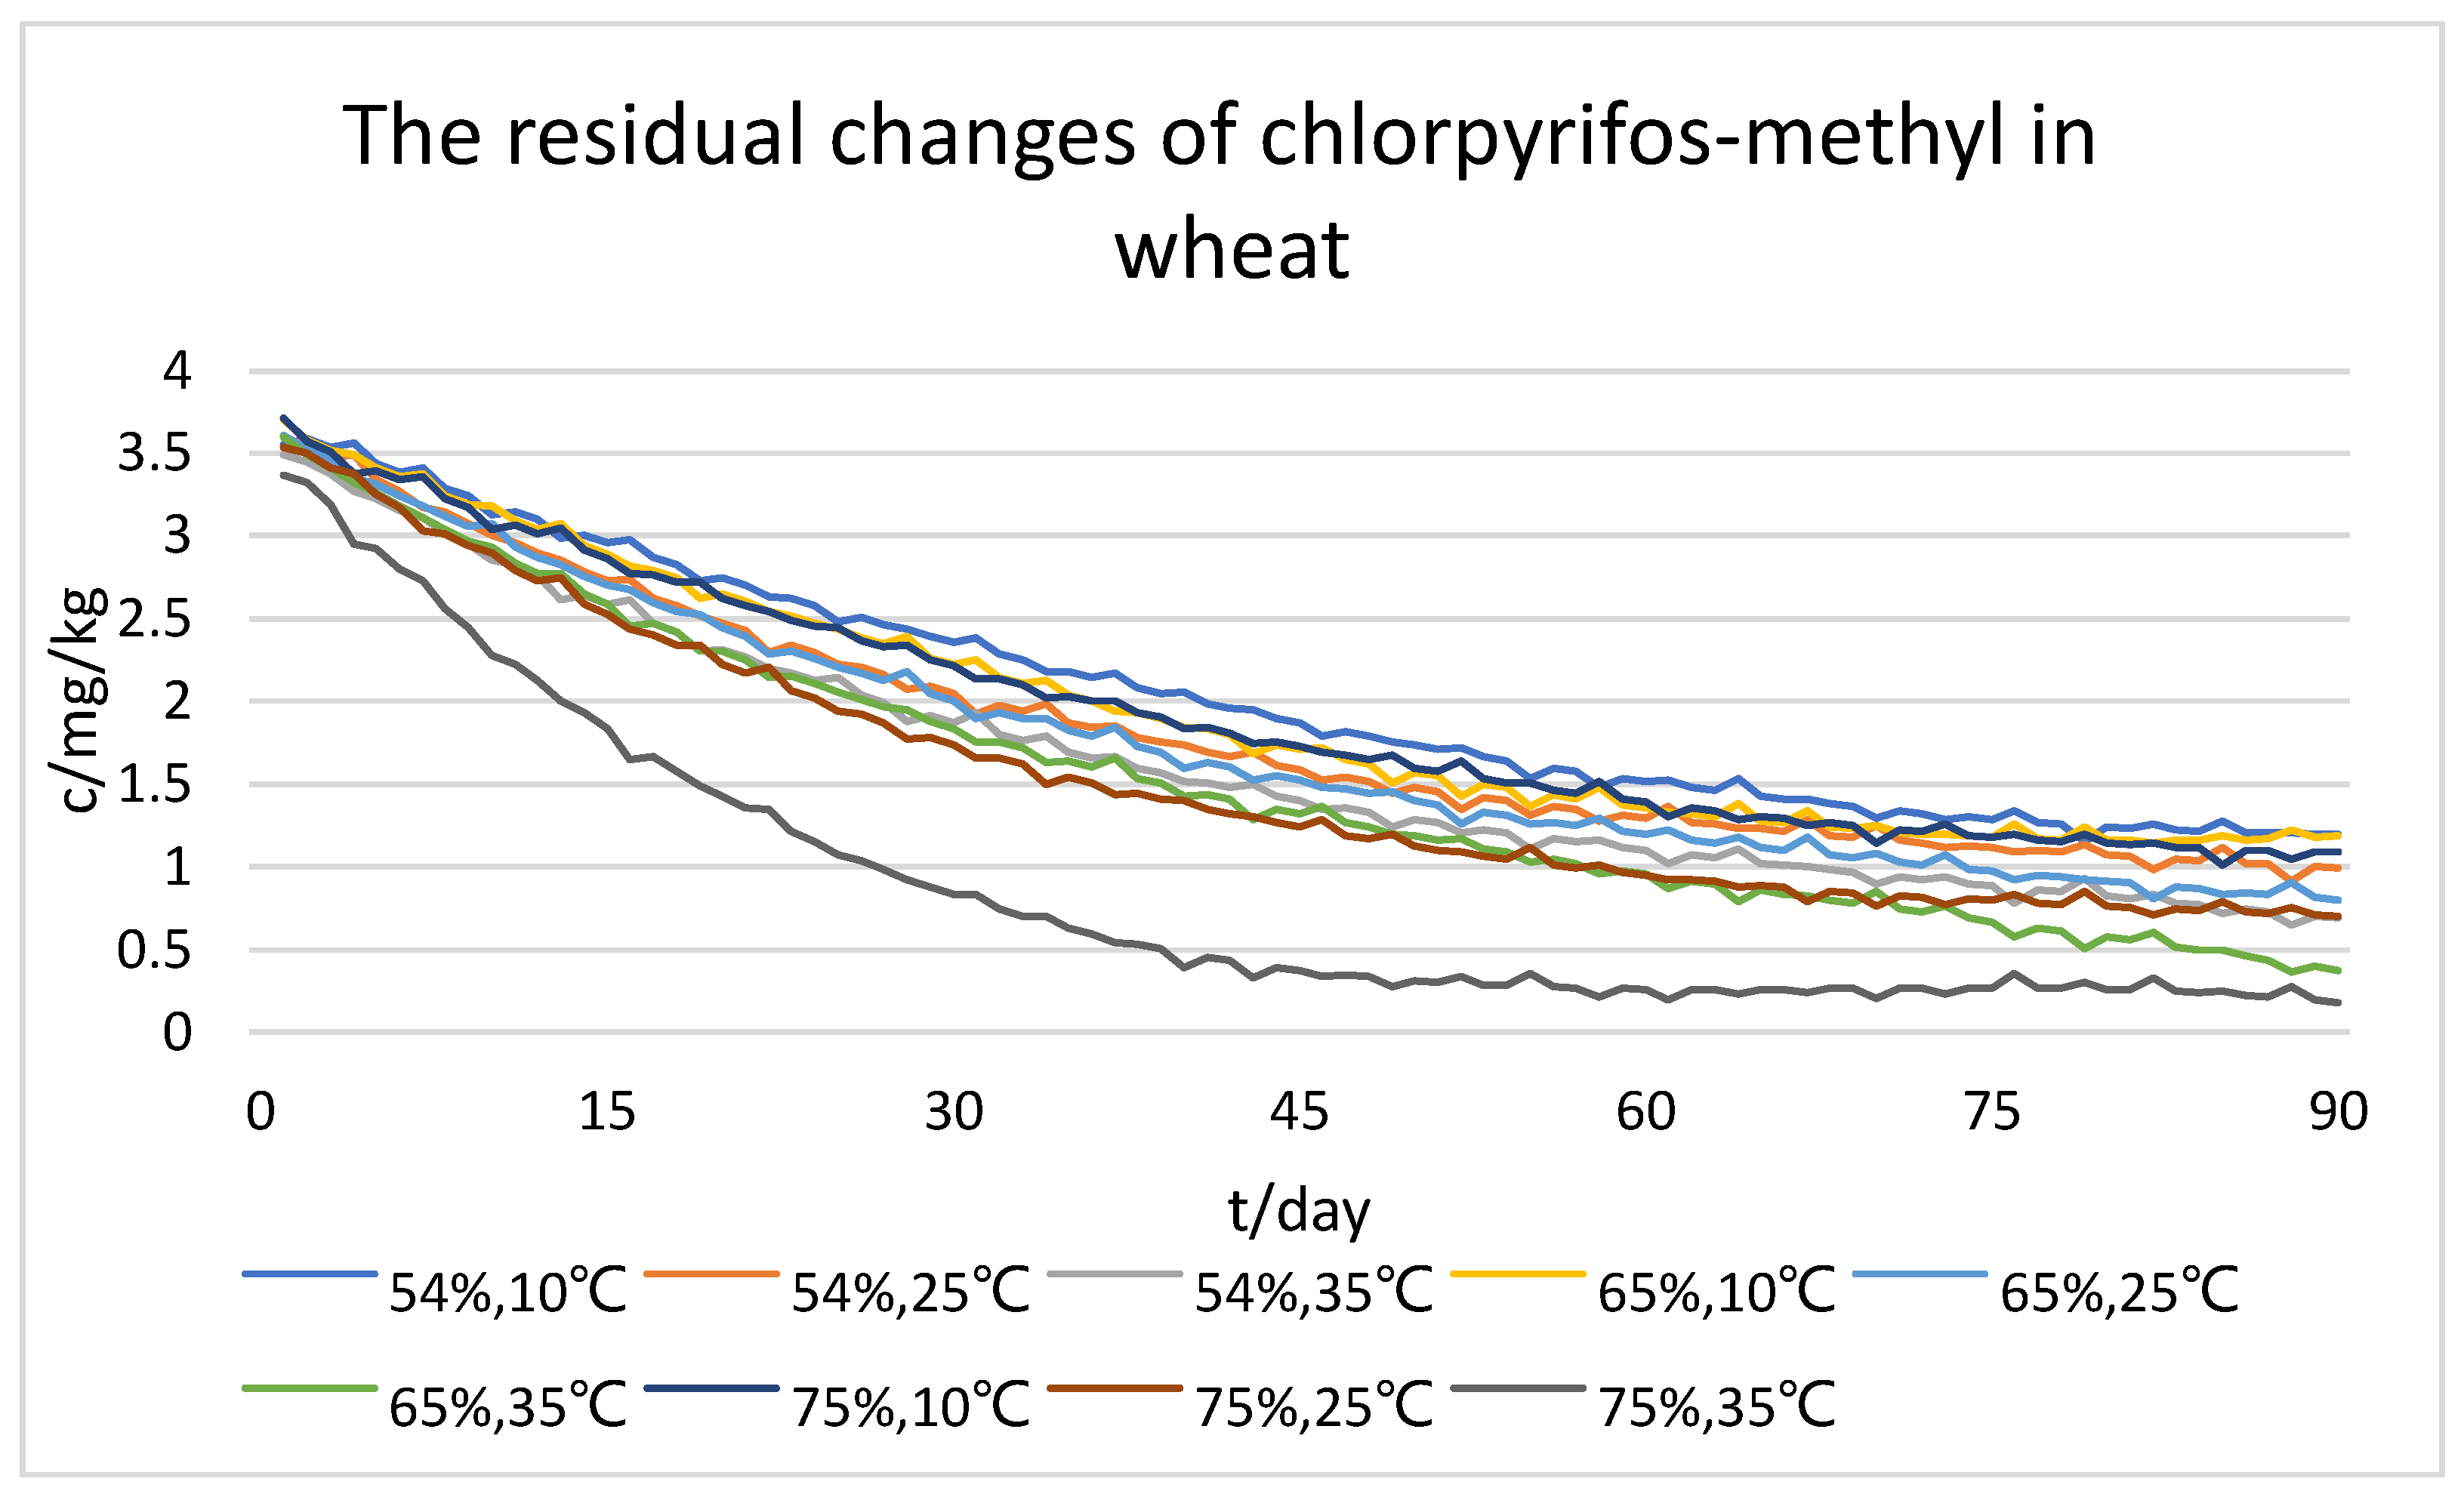
2.1.1. Data
2.1.2. Experimental Environment
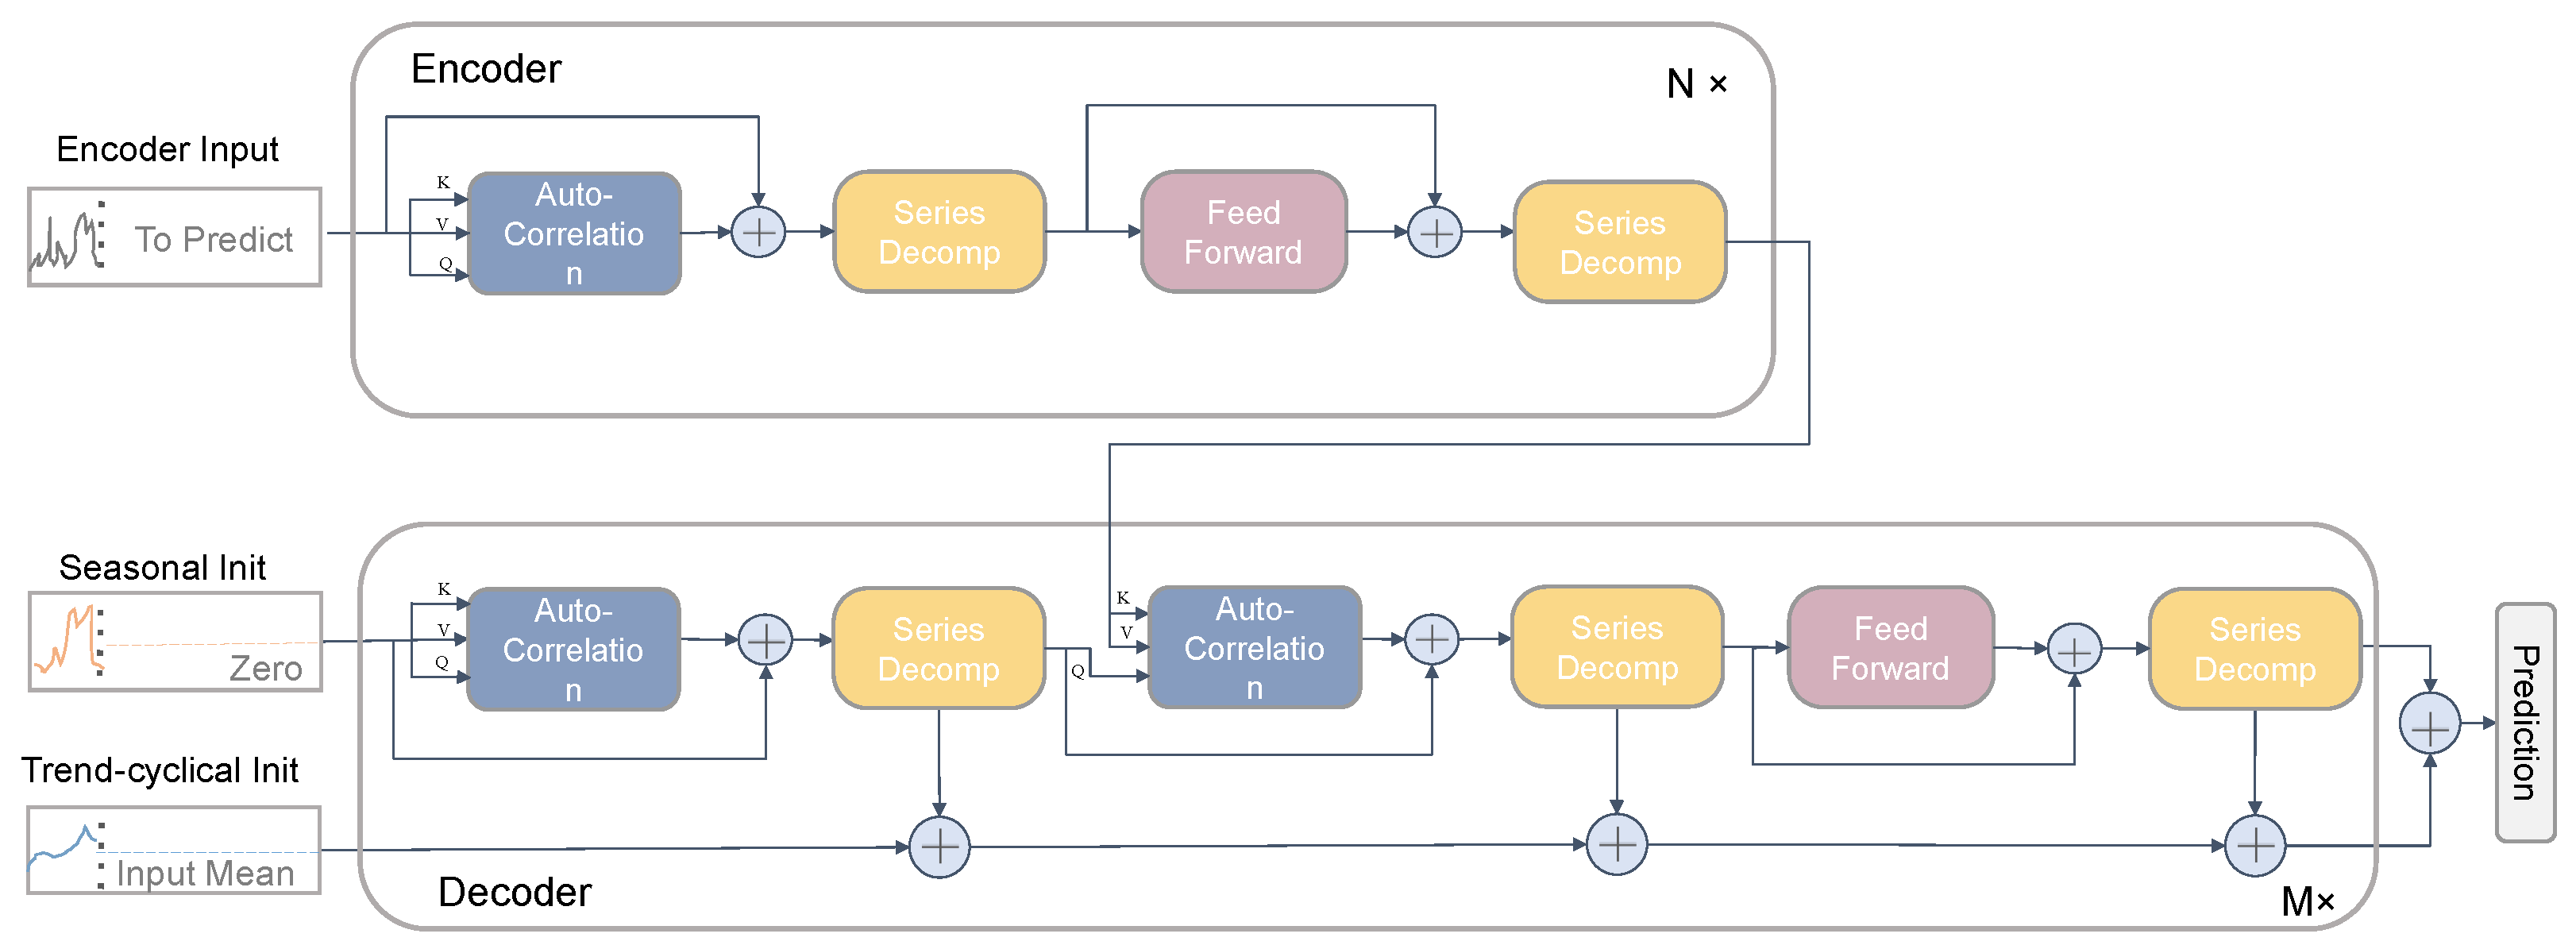
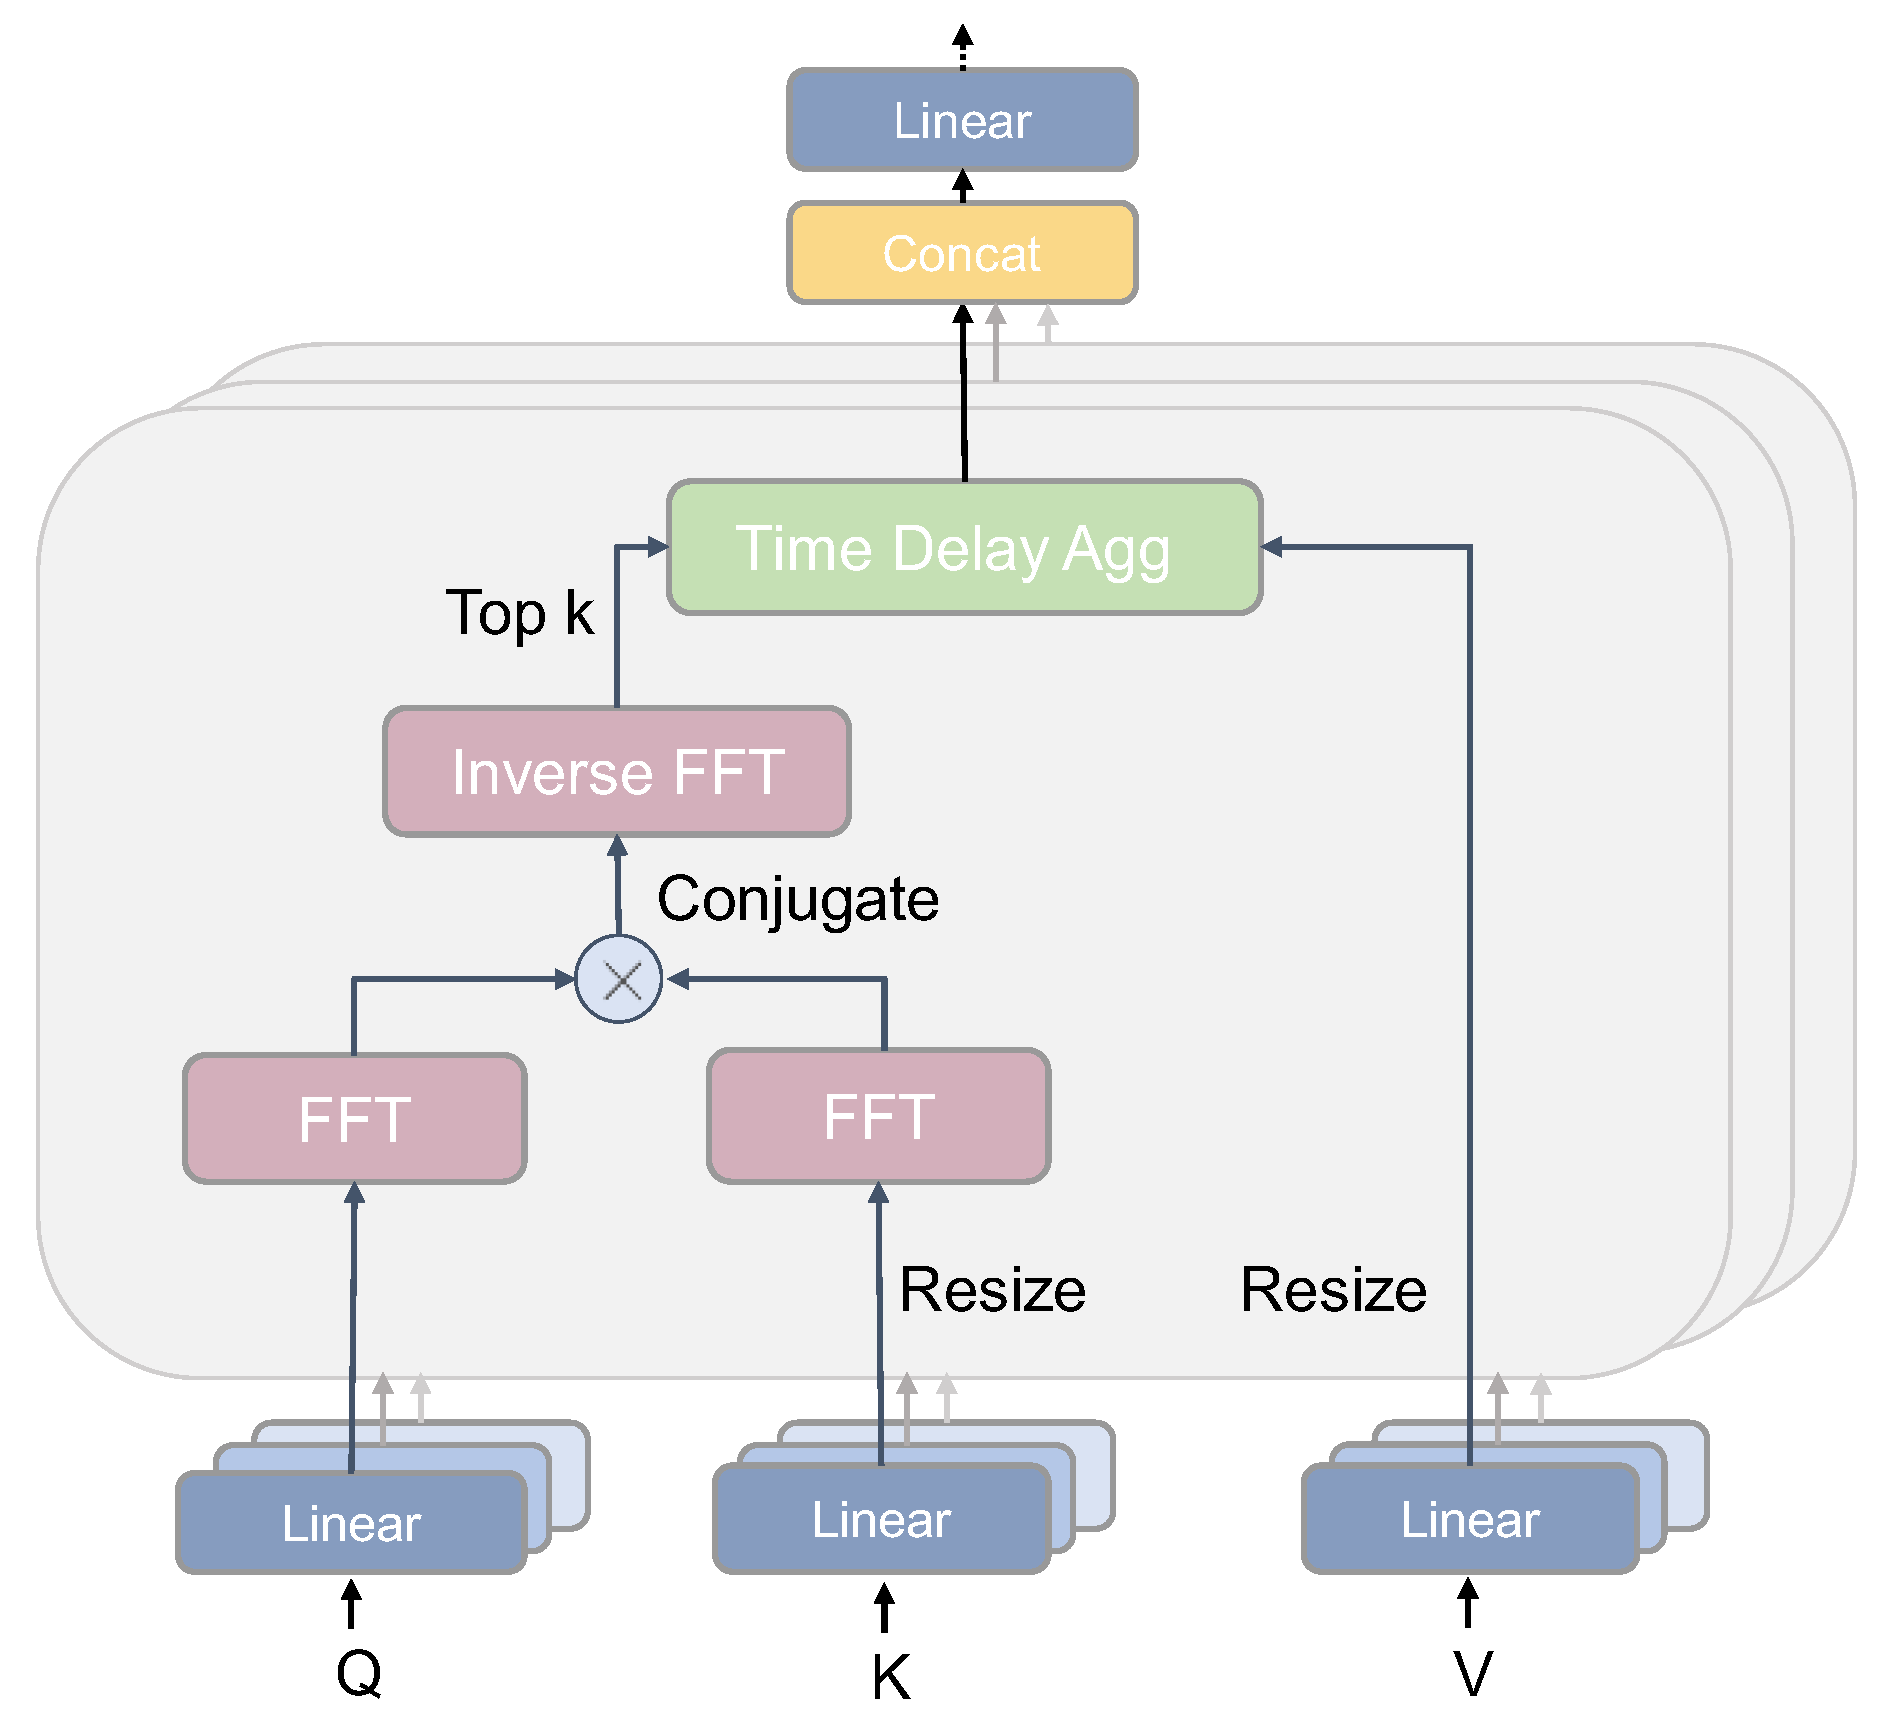
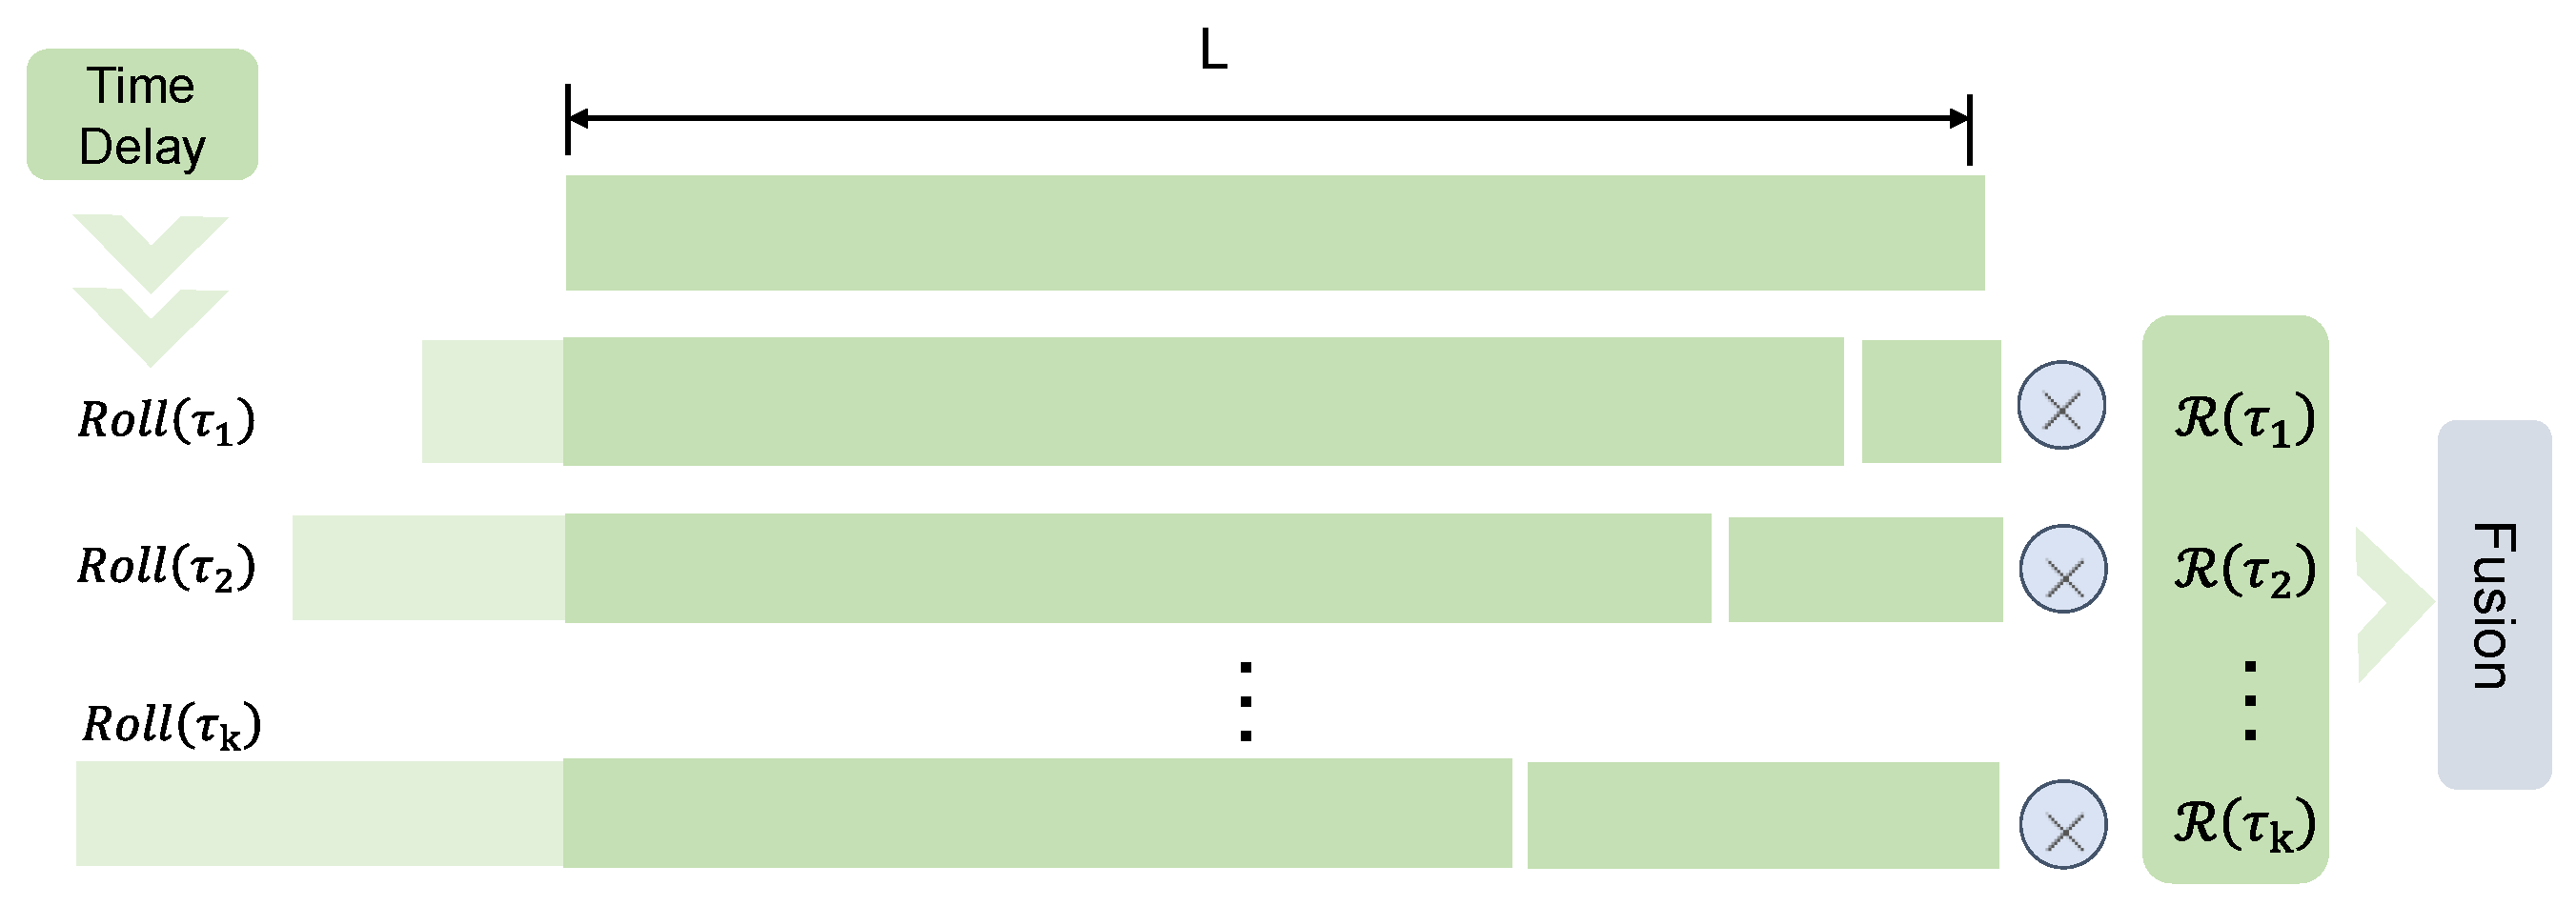
2.2. Autoformer-Based Model for Predicting the Pesticide Residue Changes in Wheat
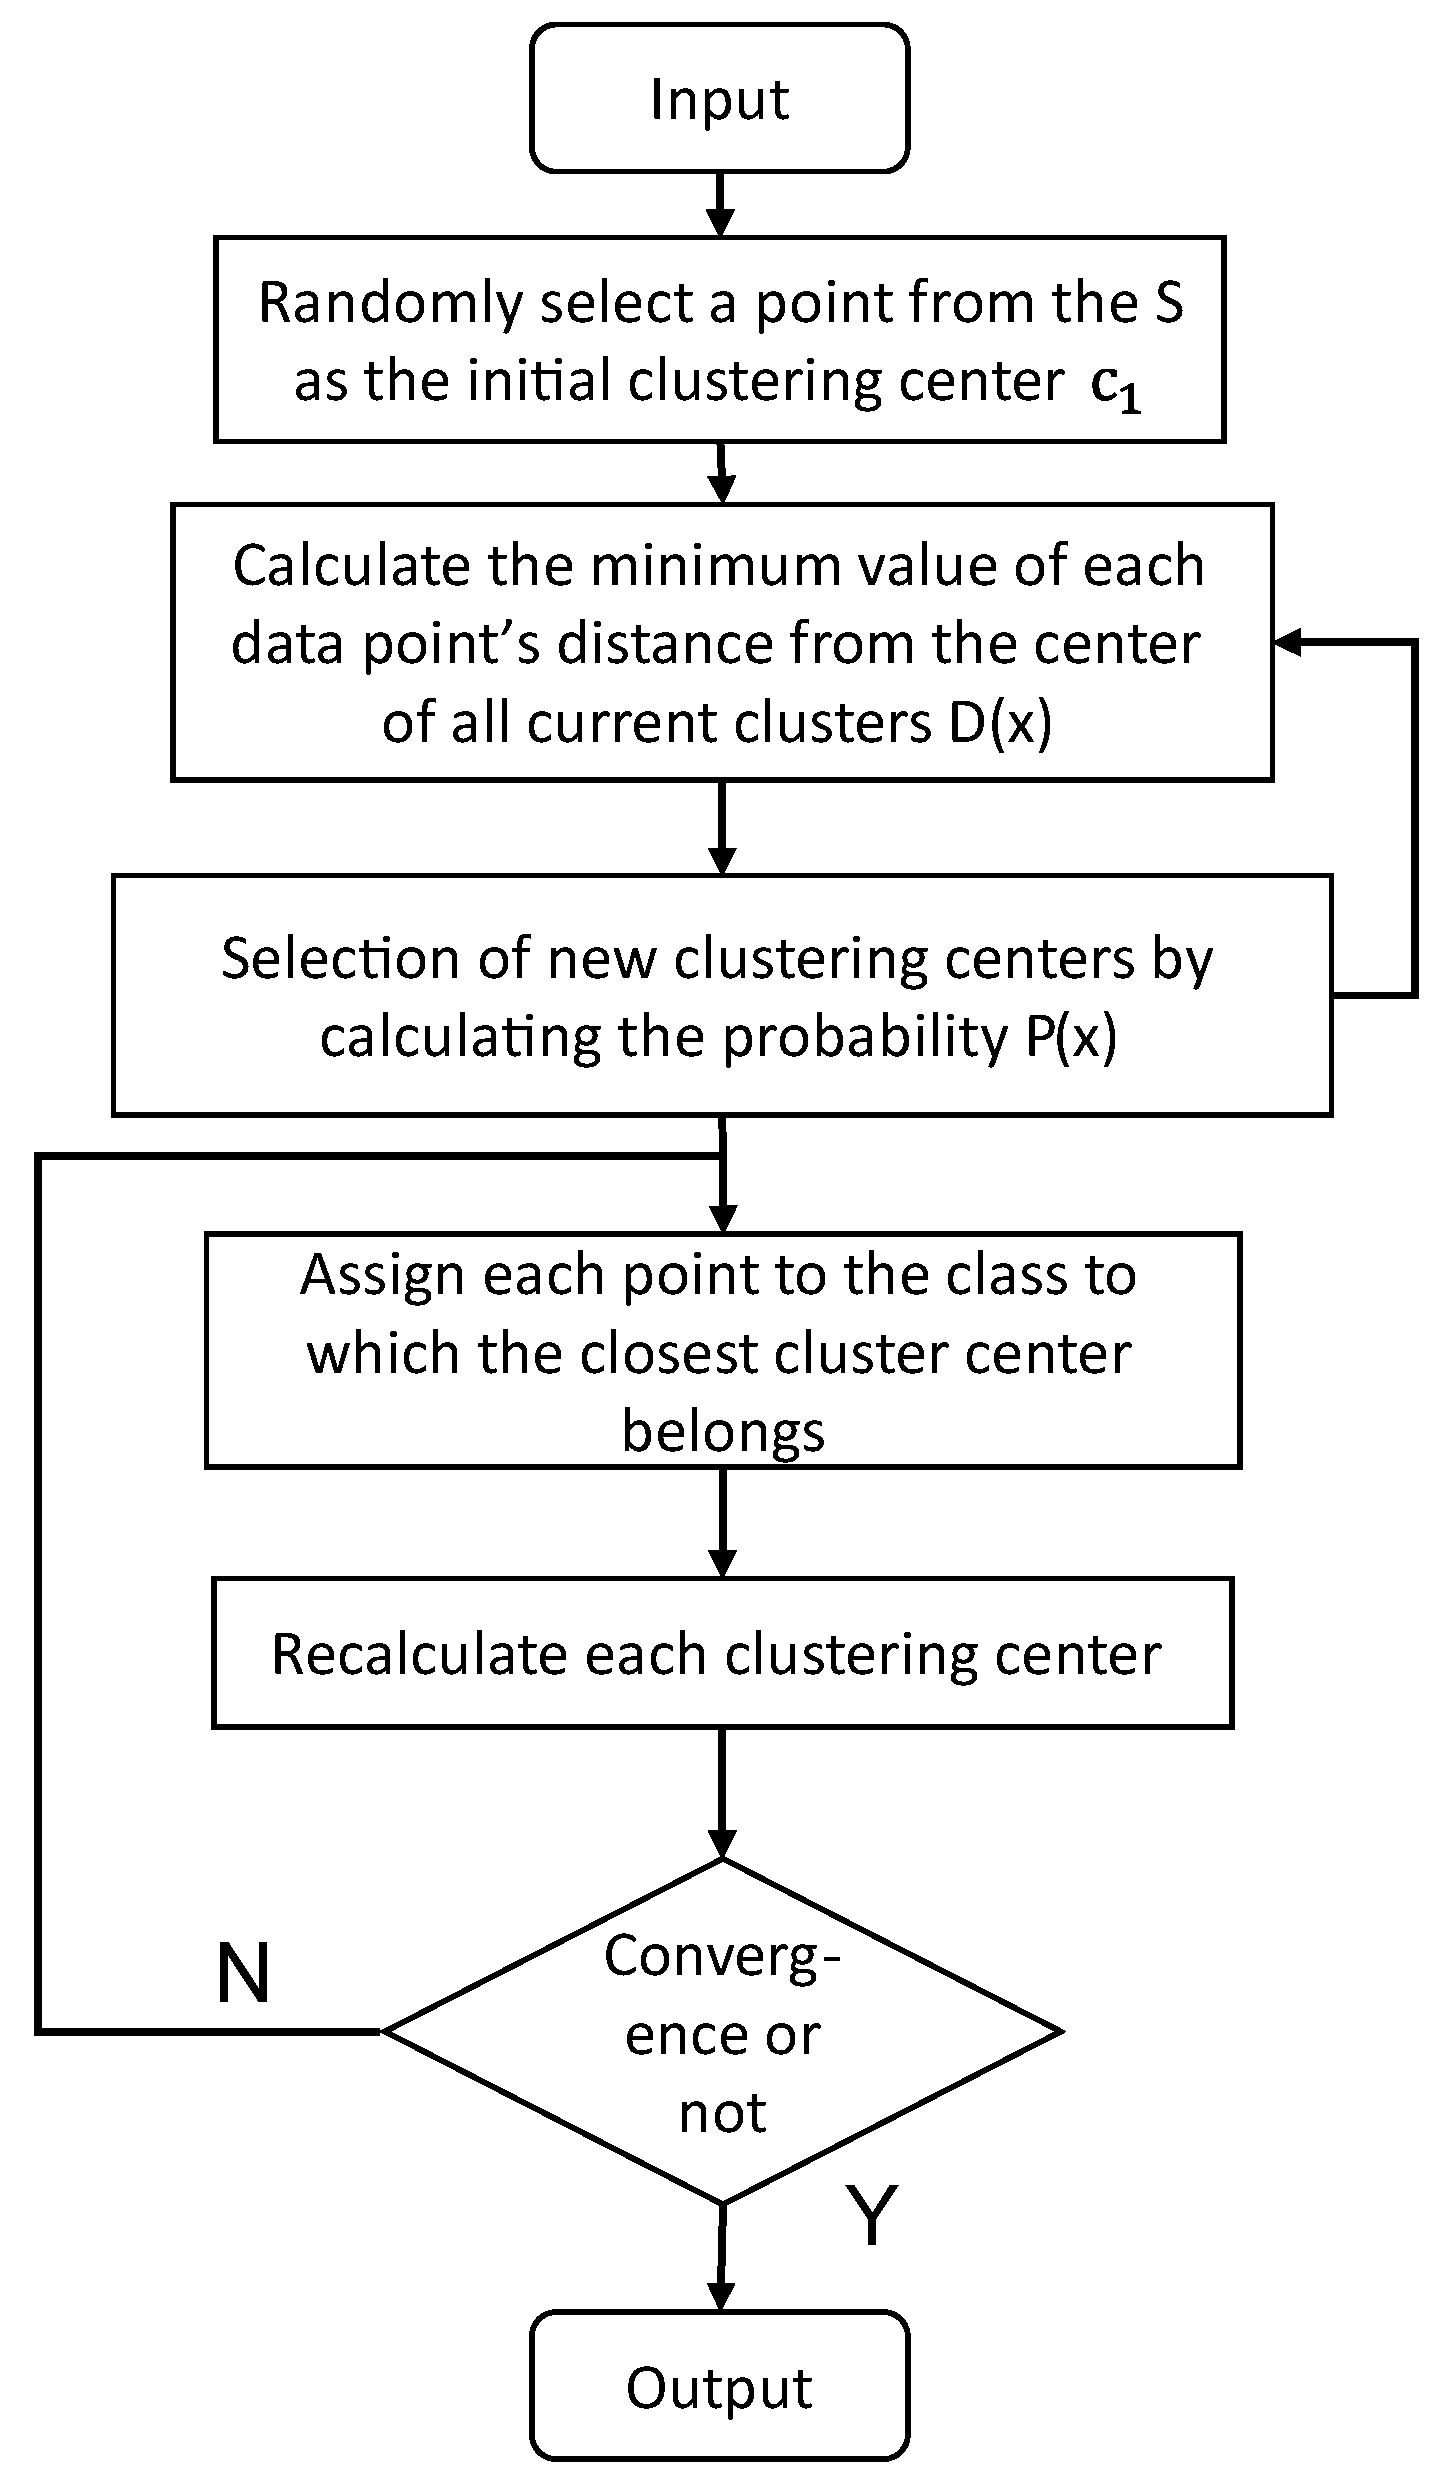
2.3. K-Means++-Based Model for Wheat Quality Assessment
- (1)
- Randomly select a point from S as the initial clustering center .
- (2)
- For each data point x in S, calculate the minimum distance between each point and the currently existing clustering center, denoted by ).
- (3)
- Select the next cluster center from S with probability and add it to the set of selected clustering.
- (4)
- Iterate step (2) and step (3) up to k clustering centers.
- (5)
- Execute the standard K-means algorithm to allocate data points to the closest cluster centers and modify the locations of the cluster centers until convergence.
2.4. Model Evaluation Metrics
2.4.1. Evaluation Metrics for Predictive Models
2.4.2. Evaluation Metrics for Clustering Models
3. Results and Discussion
3.1. Dataset of Wheat Quality Assessment
3.2. Comparison of Models for Predicting Changes in Pesticide Residues in Wheat
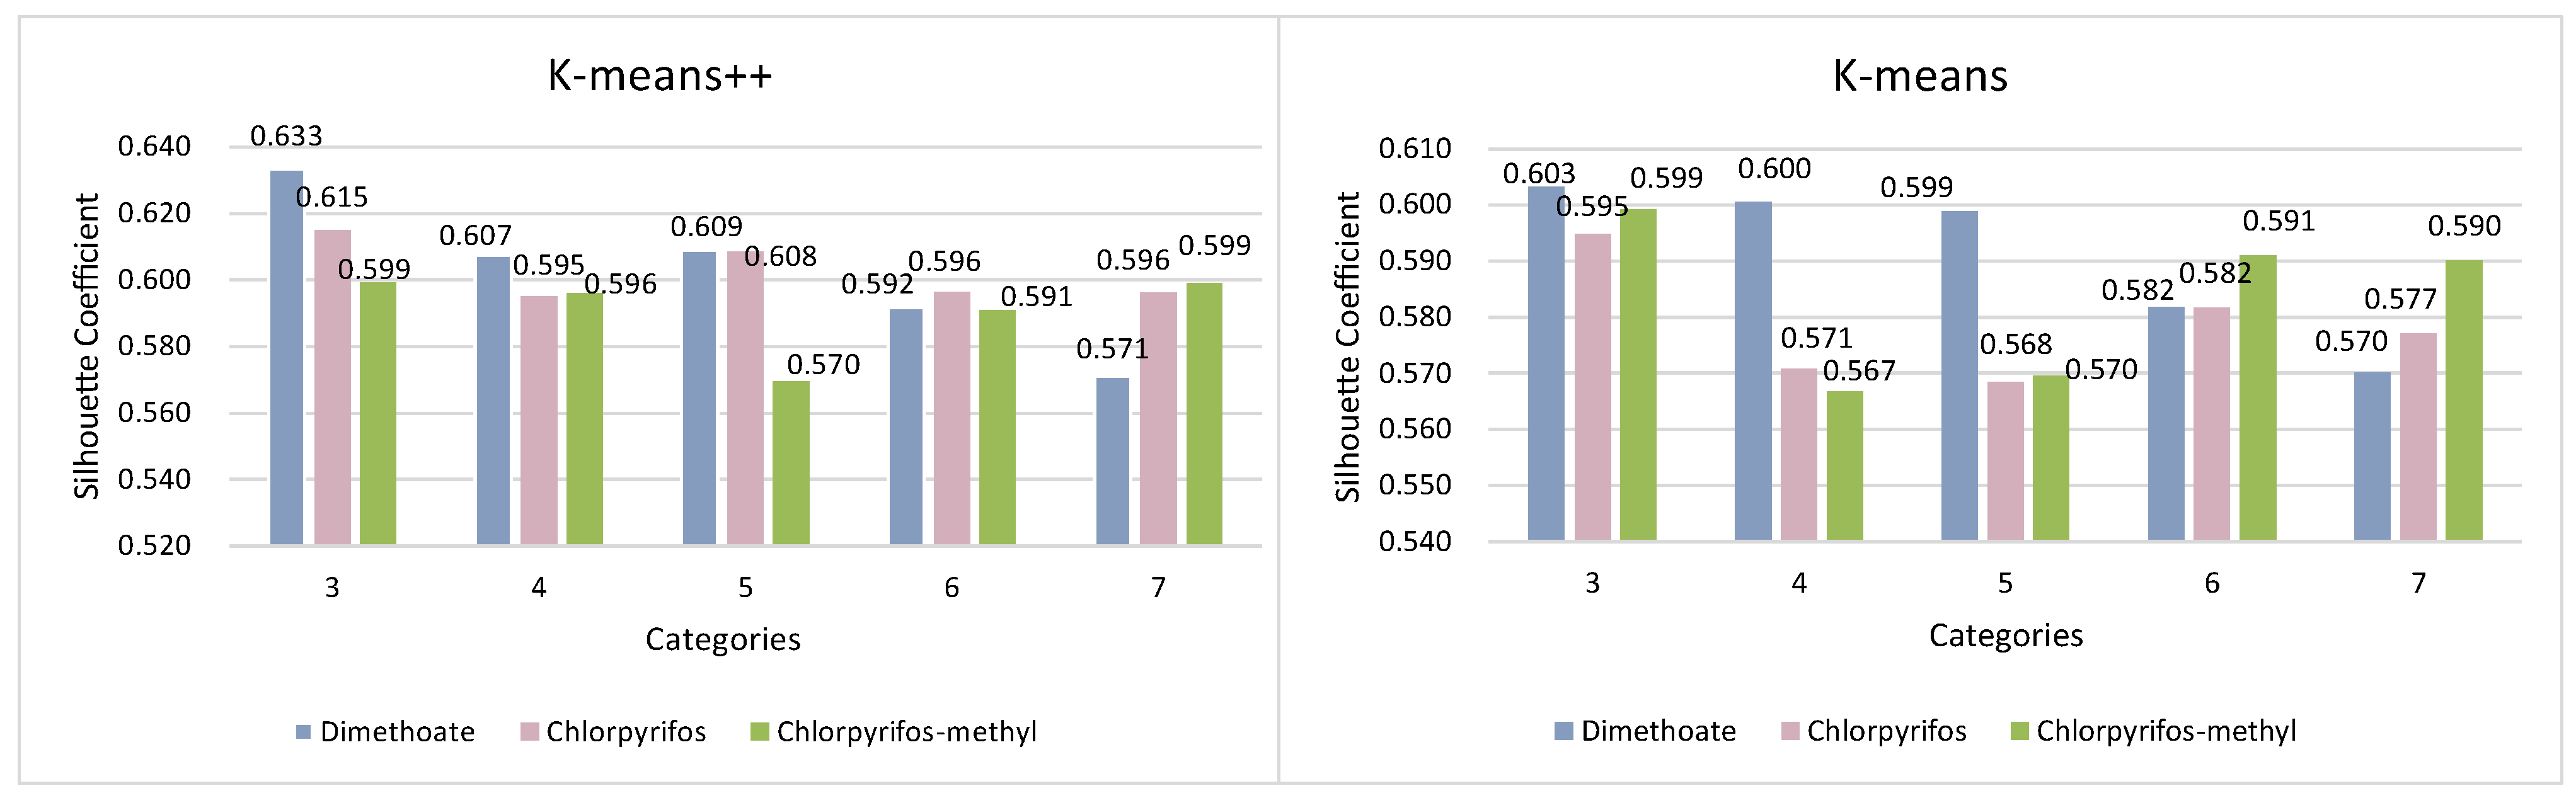
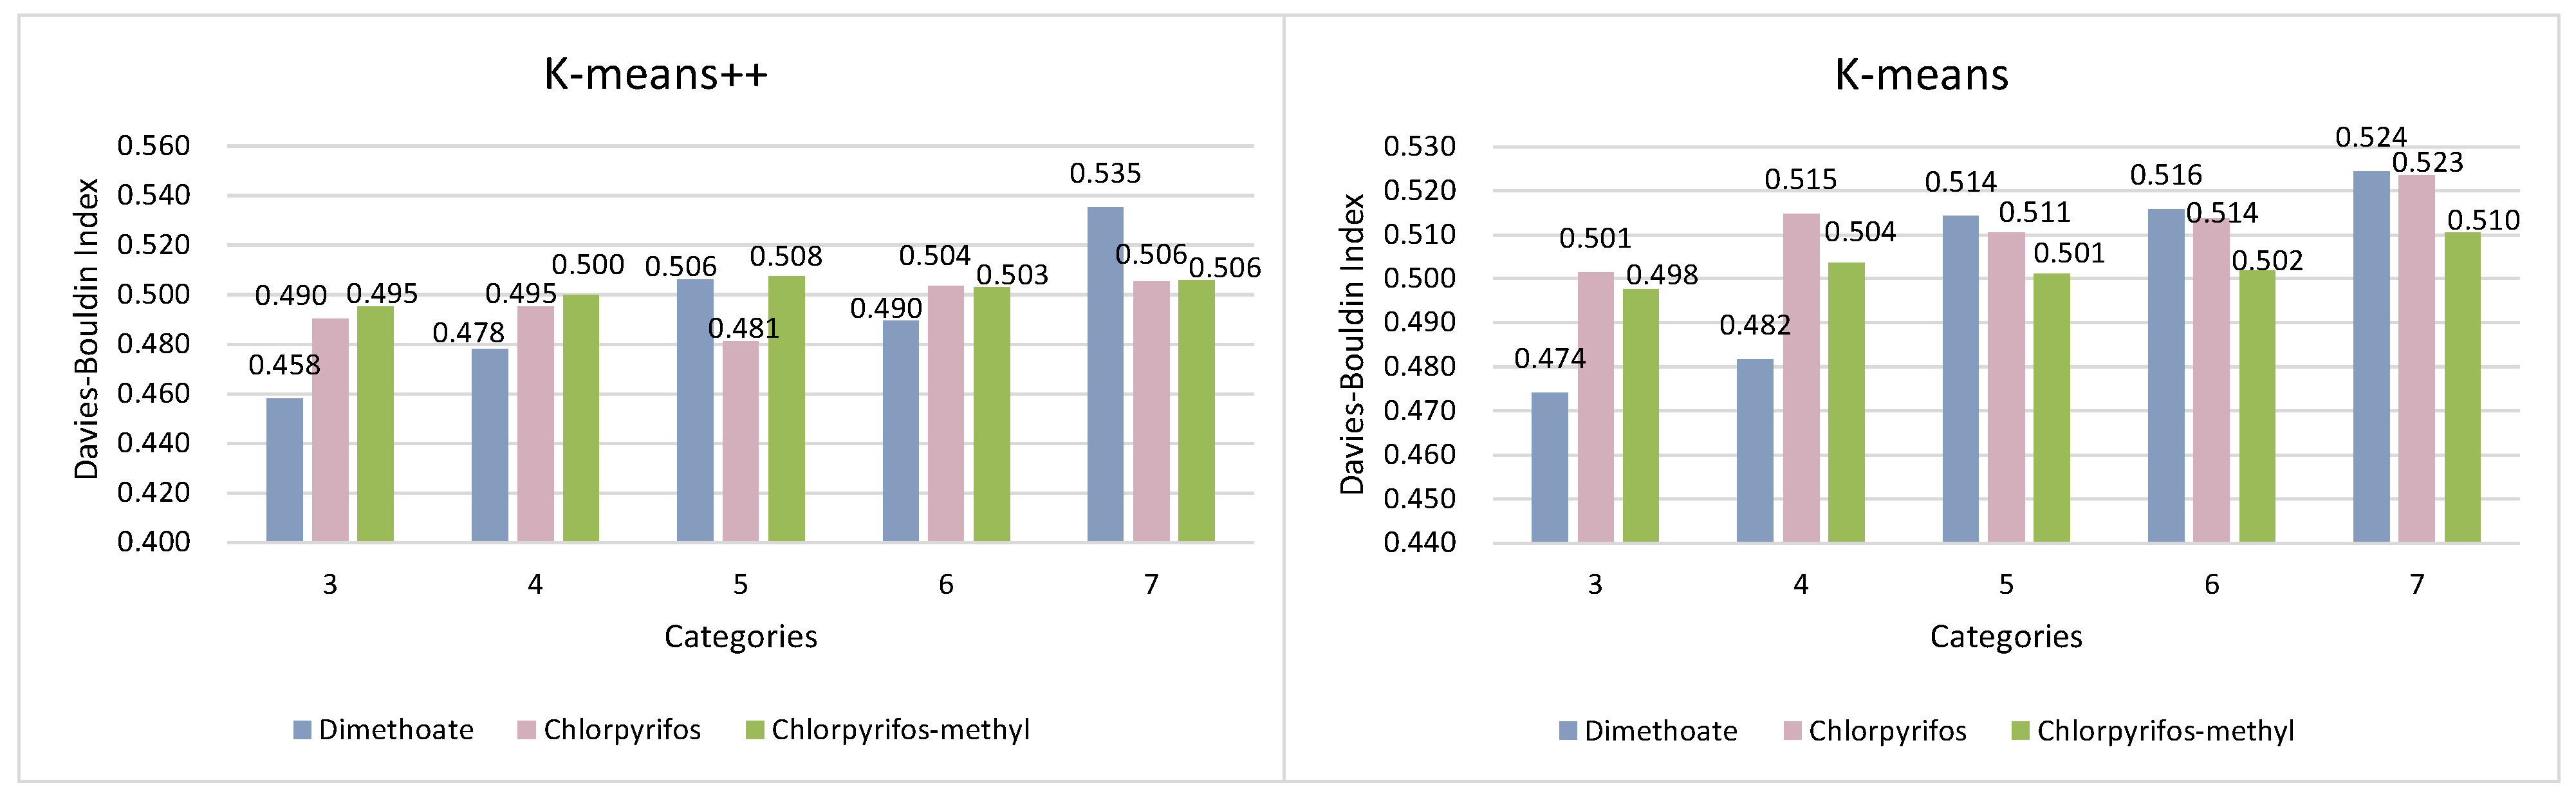
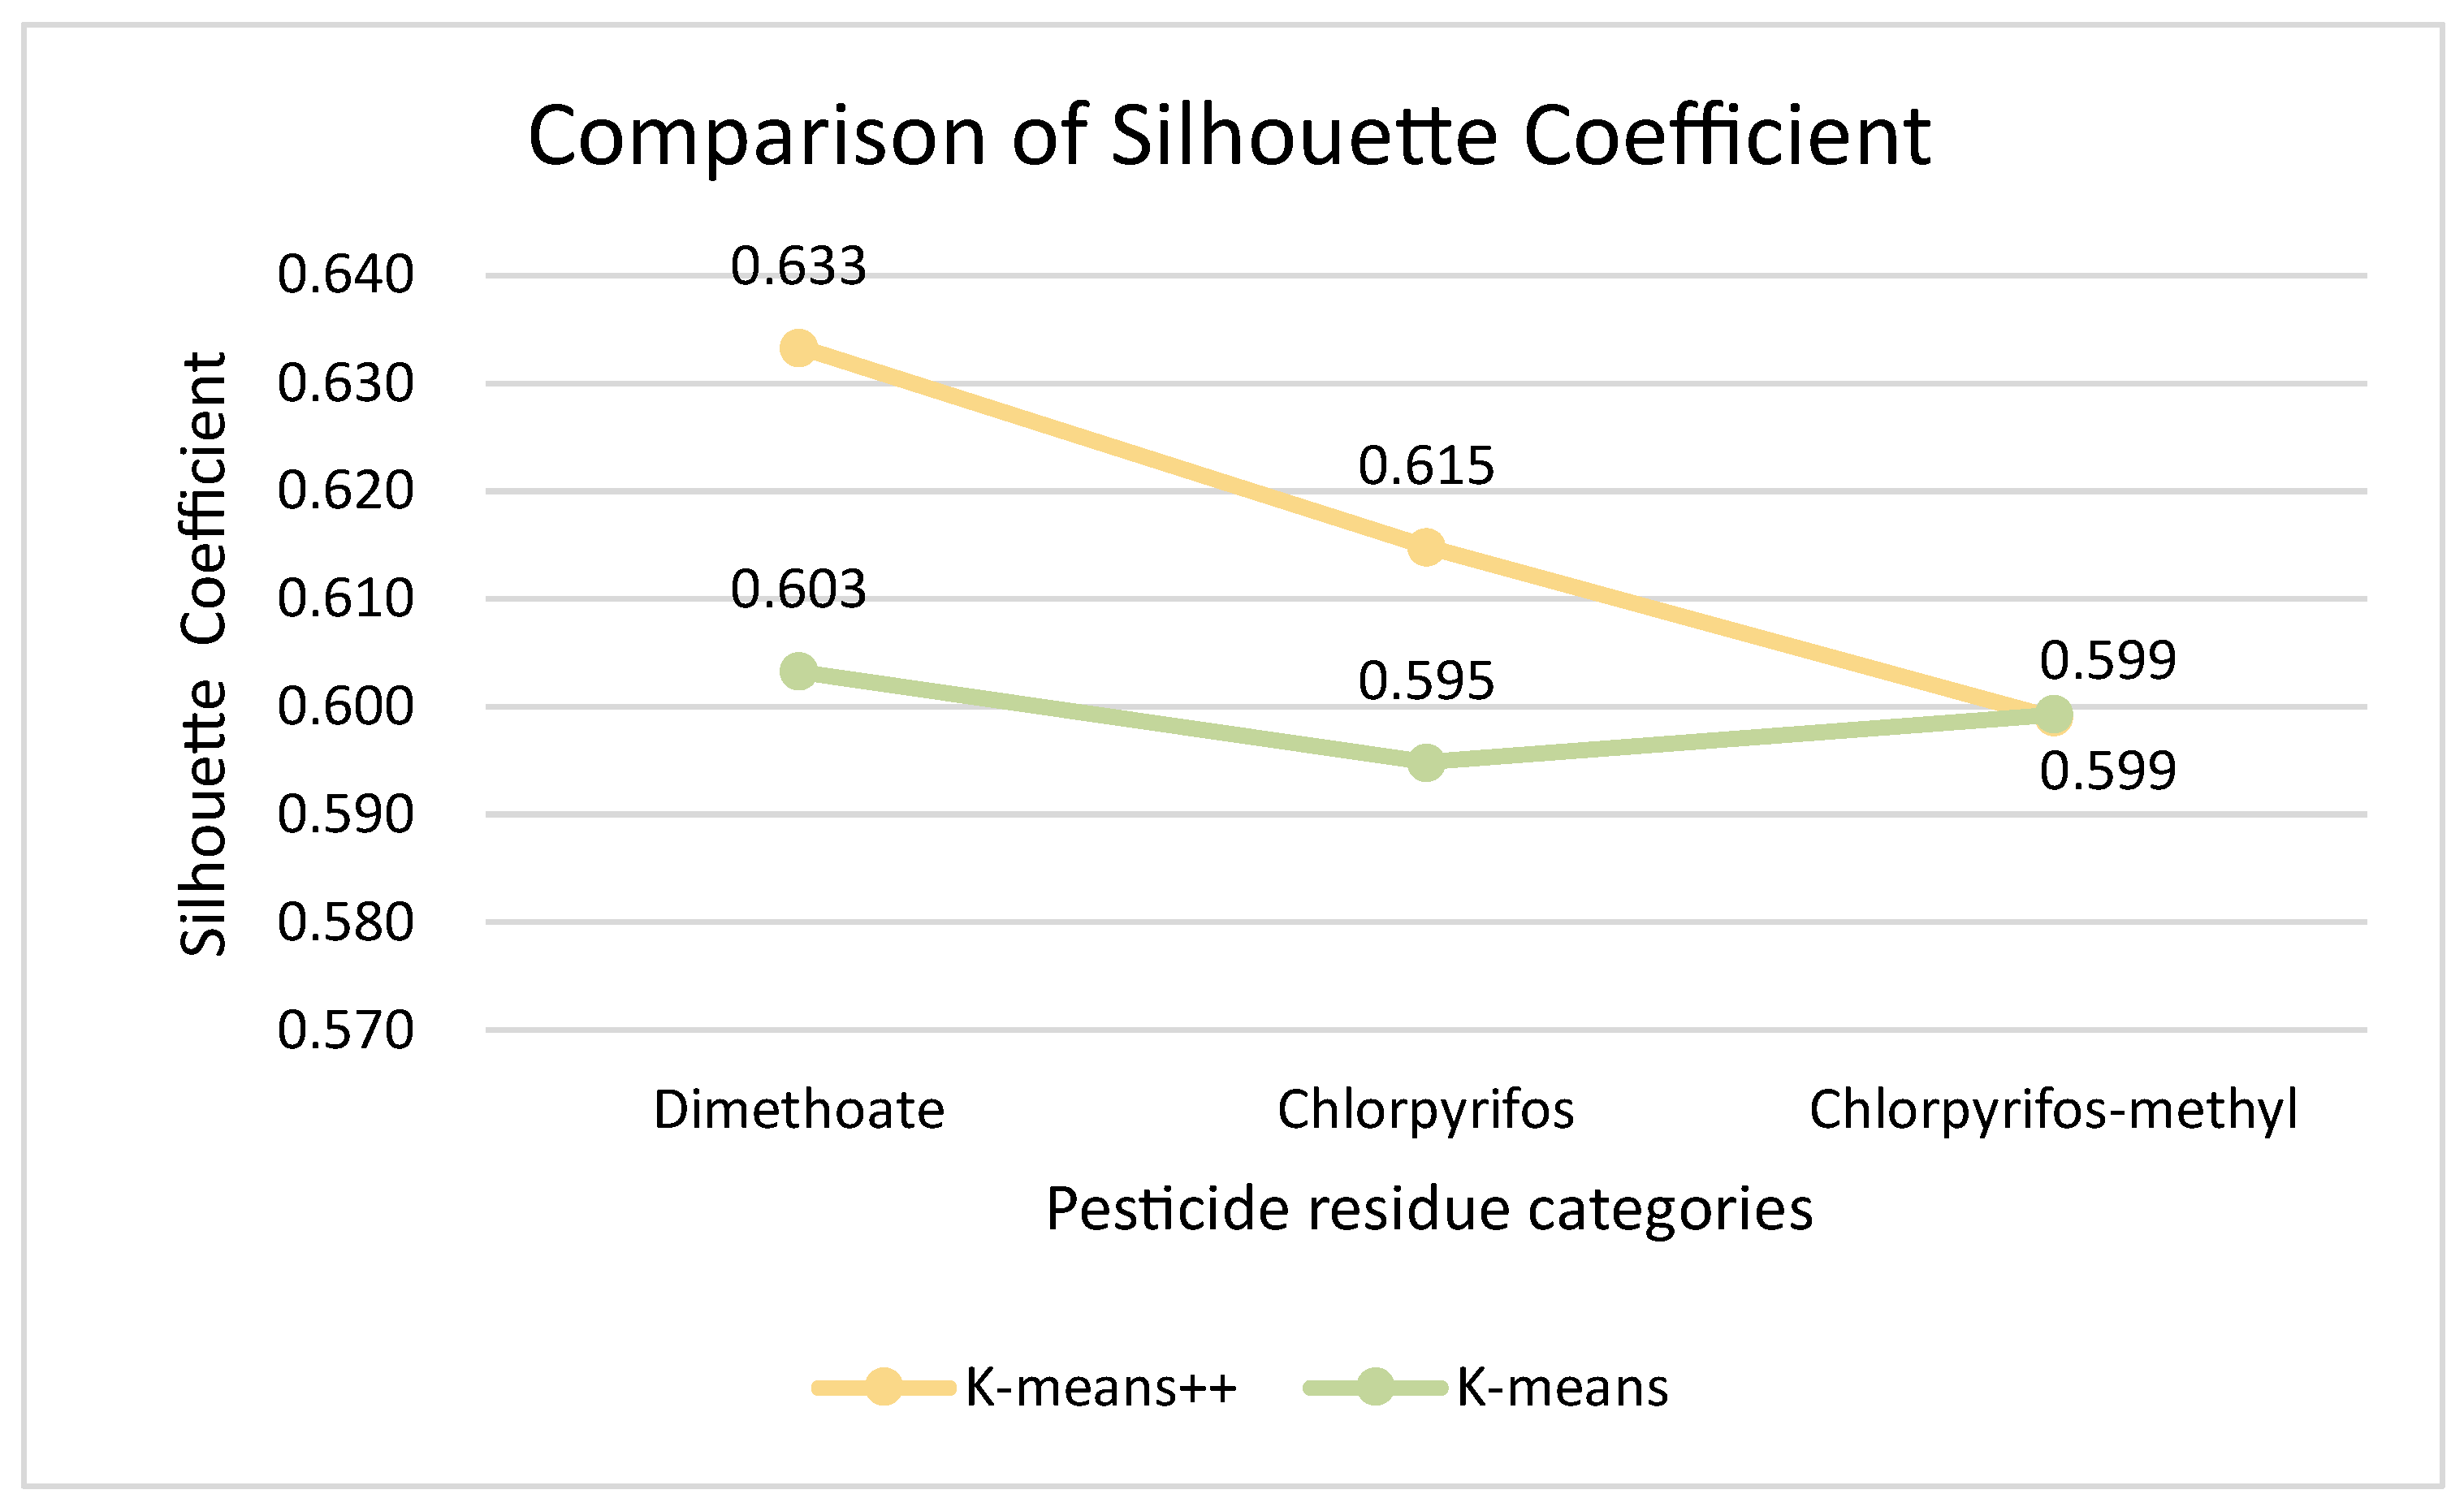
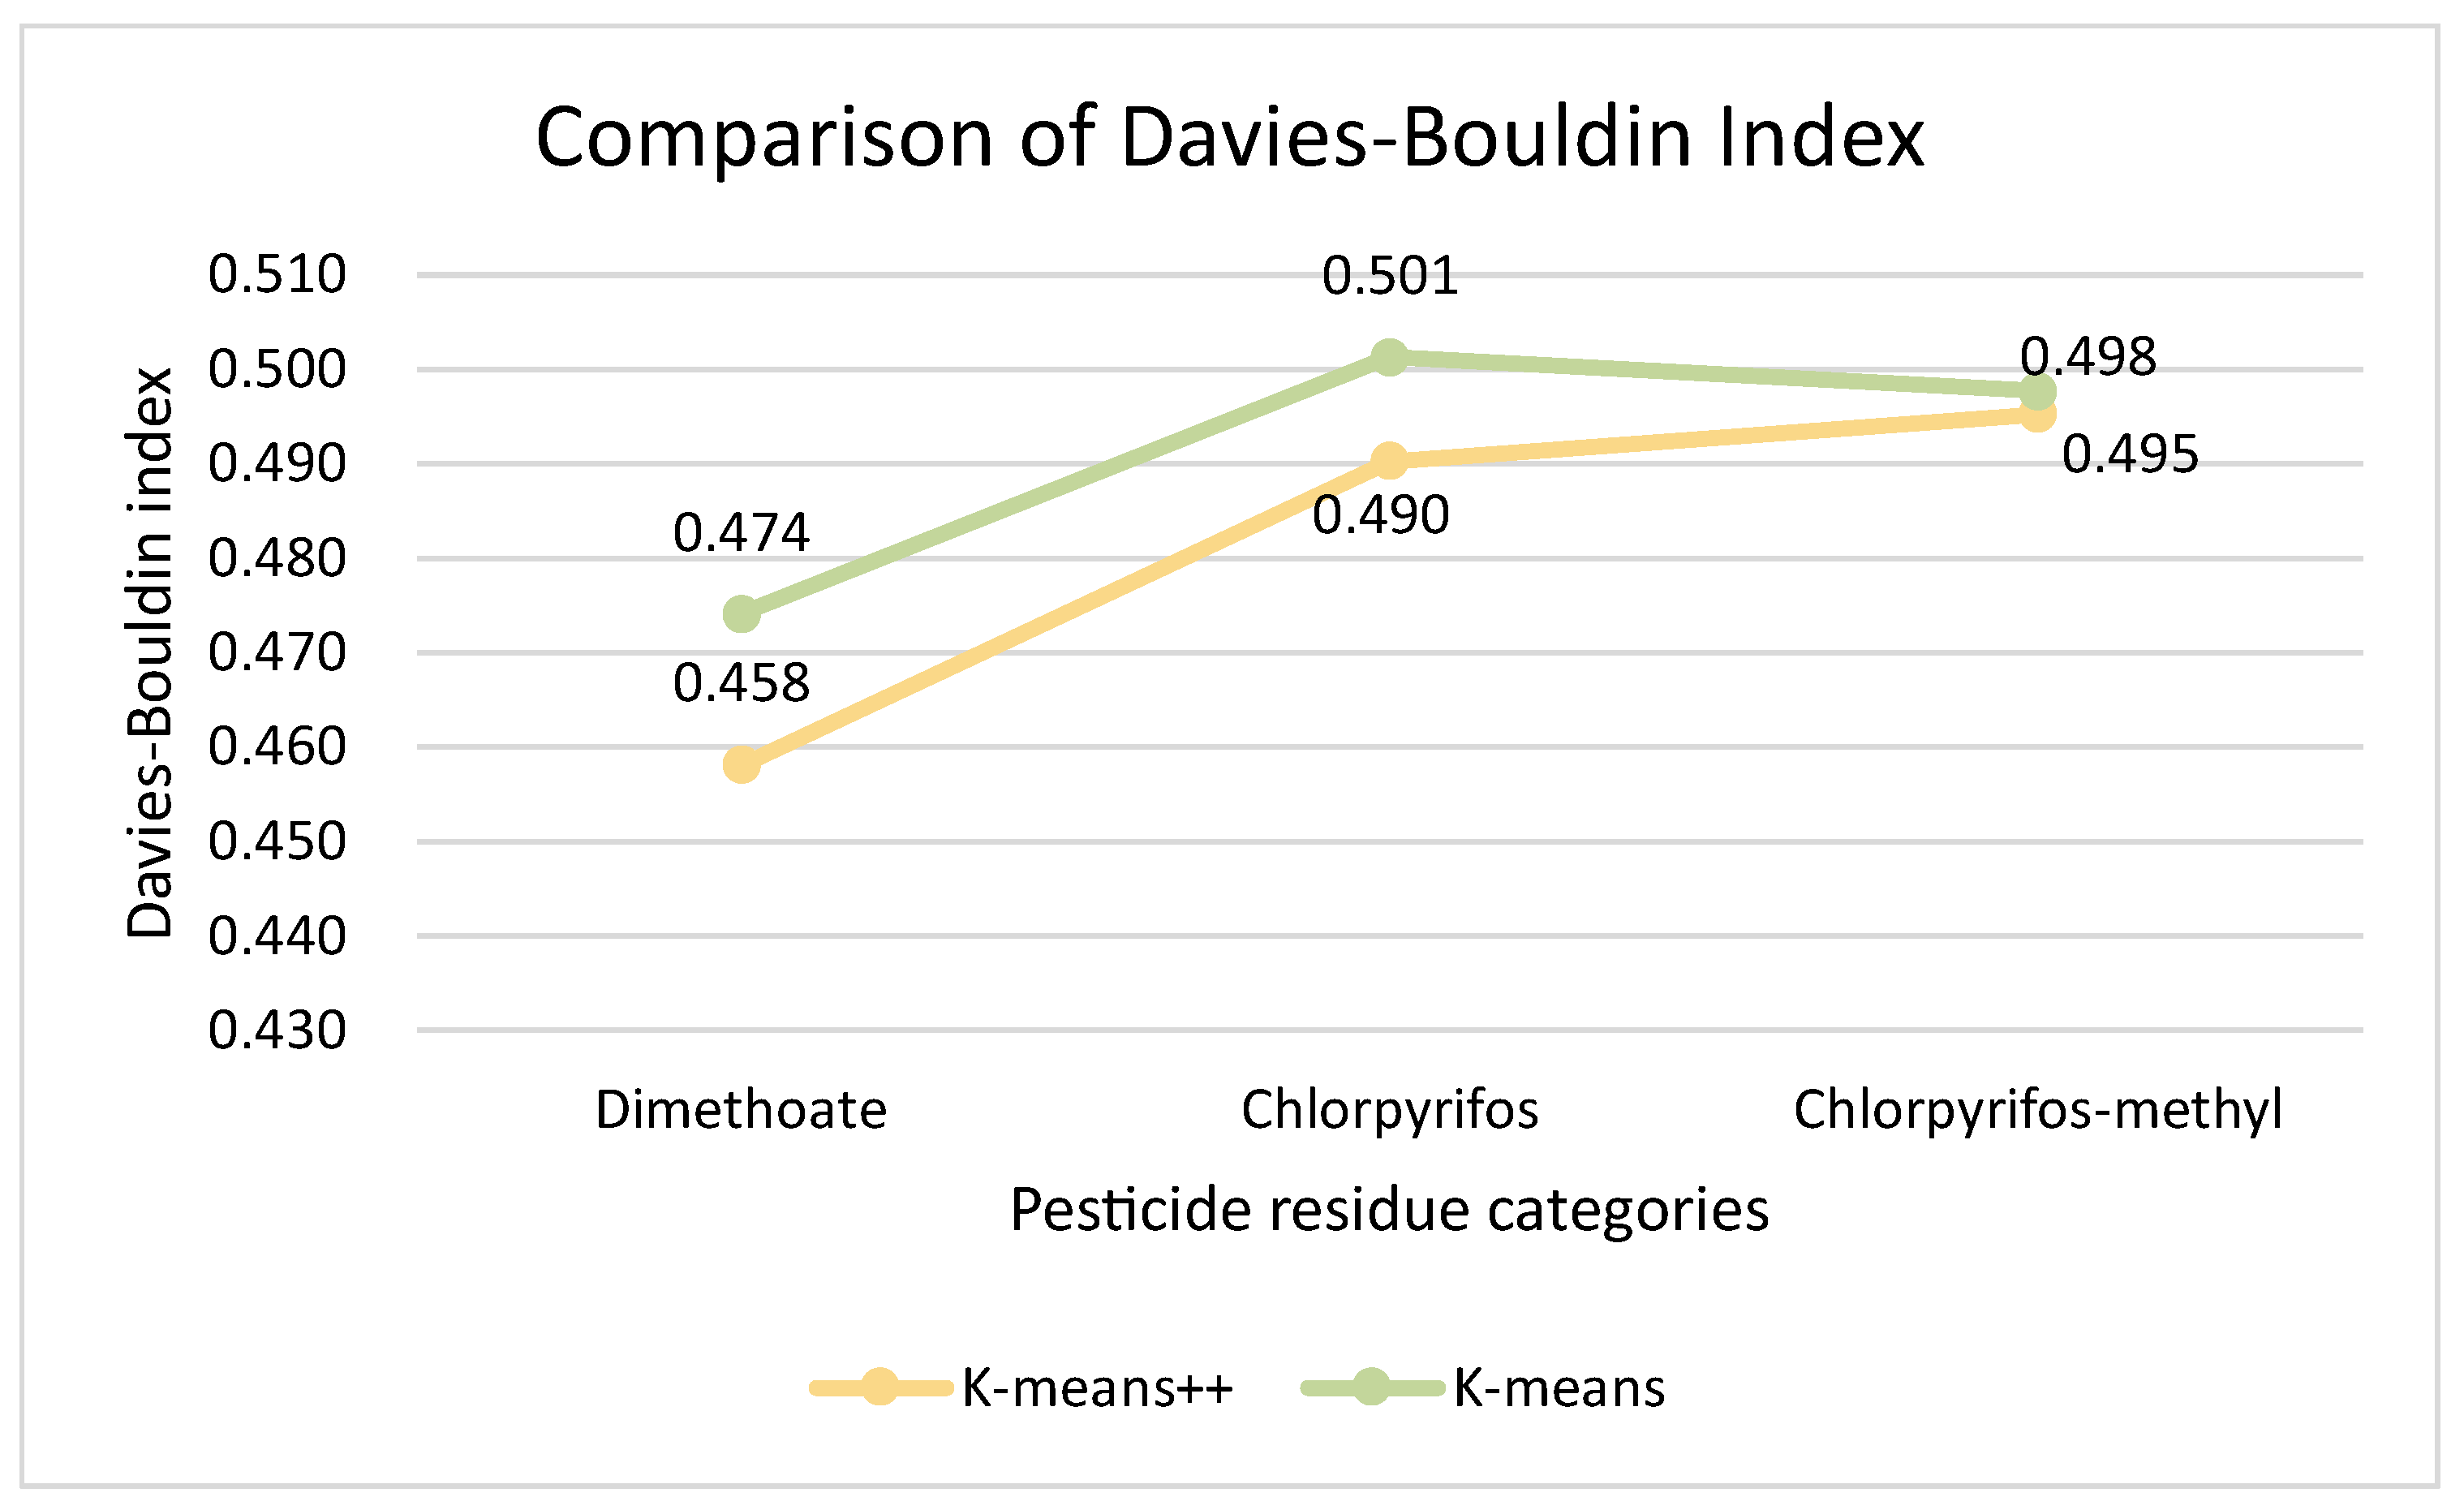
3.3. Comparison of Clustering Models for Wheat Quality Assessment
4. Conclusions
Author Contributions
Funding
Data Availability Statement
Conflicts of Interest
References
- Lovegrove, A.; Dunn, J.; Pellny, T.K.; Hood, J.; Burridge, A.J.; America, A.H.P.; Gilissen, L.; Timmer, R.; Proos-Huijsmans, Z.A.M.; van Straaten, J.P.; et al. Comparative Compositions of Grain of Bread Wheat, Emmer and Spelt Grown with Different Levels of Nitrogen Fertilisation. Foods 2023, 12, 843. [Google Scholar] [CrossRef]
- Zhao, P.; Huang, B.; Li, Y.; Han, Y.; Zou, N.; Gu, K.; Li, X.; Pan, C. Rapid Multiplug Filtration Cleanup with Multiple-Walled Carbon Nanotubes and Gas Chromatography–Triple-Quadruple Mass Spectrometry Detection for 186 Pesticide Residues in Tomato and Tomato Products. J. Agric. Food Chem. 2014, 62, 3710–3725. [Google Scholar] [CrossRef]
- Kumar, C.; Ram, C.L.; Jha, S.N.; Vishwakarma, R.K. Warehouse Storage Management of Wheat and Their Role in Food Security. Front. Sustain. Food Syst. 2021, 5, 675626. [Google Scholar] [CrossRef]
- Xiong, C.; Ma, H.; Zhu, E.; Xu, W.; Liu, Q. Degradation Kinetic Study of Eight Pesticides Residues in Wheat Grain During Simulated Storage. J. Chin. Cereals Oils Assoc. 2020, 35, 139–146. [Google Scholar]
- Liu, Q.; Liu, Y.; Dong, F.; Sallach, J.B.; Wu, X.; Liu, X.; Xu, J.; Zheng, Y.; Li, Y. Uptake Kinetics and Accumulation of Pesticides in Wheat (Triticum aestivum L.): Impact of Chemical and Plant Properties. Environ. Pollut. 2021, 275, 116637. [Google Scholar] [CrossRef]
- Yu, L.; Zhang, H.; Niu, X.; Wu, L.; Zhang, Y.; Wang, B. Fate of Chlorpyrifos, Omethoate, Cypermethrin, and Deltamethrin during Wheat Milling and Chinese Steamed Bread Processing. Food Sci. Nutr. 2021, 9, 2791–2800. [Google Scholar] [CrossRef]
- Rodriguez, F.S.; Armstrong, P.R.; Maghirang, E.B.; Yaptenco, K.F.; Scully, E.D.; Arthur, F.H.; Brabec, D.L.; Adviento-Borbe, A.D.; Suministrado, D.C. NIR Spectroscopy Detects Chlorpyrifos-Methyl Pesticide Residue in Rough, Brown, and Milled Rice. Appl. Eng. Agric. 2020, 36, 983–993. [Google Scholar] [CrossRef]
- Mebdoua, S.; Ounane, G. Evaluation of Pesticide Residues in Wheat Grains and Its Products from Algeria. Food Addit. Contam. Part B 2019, 12, 289–295. [Google Scholar] [CrossRef]
- Ding, Z.; Lin, M.; Song, X.; Wu, H.; Xiao, J. Quantitative Modeling of the Degradation of Pesticide Residues in Wheat Flour Supply Chain. Foods 2023, 12, 788. [Google Scholar] [CrossRef] [PubMed]
- Yigit, N.; Velioglu, Y.S. Effects of Processing and Storage on Pesticide Residues in Foods. Crit. Rev. Food Sci. Nutr. 2020, 60, 3622–3641. [Google Scholar] [CrossRef] [PubMed]
- González-Curbelo, M.Á.; Socas-Rodríguez, B.; Herrero, M.; Herrera-Herrera, A.V.; Hernández-Borges, J. Dissipation Kinetics of Organophosphorus Pesticides in Milled Toasted Maize and Wheat Flour (Gofio) during Storage. Food Chem. 2017, 229, 854–859. [Google Scholar] [CrossRef]
- Ramachandran, R.P. Integrated Approach on Stored Grain Quality Management with CO2 Monitoring-A Review. J. Stored Prod. Res. 2022, 96, 101950. [Google Scholar] [CrossRef]
- Rakić, S.; Janković, S.; Marčetić, M.; Rajičić, V.; Rakić, R.; Rakić, V.; Kolarić, L. Functional Properties of Wheat Kernels (Triticumaestivum L.) during Storage. J. Stored Prod. Res. 2020, 87, 101587. [Google Scholar] [CrossRef]
- Fazel-Niari, Z.; Afkari-Sayyah, A.H.; Abbaspour-Gilandeh, Y.; Herrera-Miranda, I.; Hernández-Hernández, J.L.; Hernández-Hernández, M. Quality Assessment of Components of Wheat Seed Using Different Classifications Models. Appl. Sci. 2022, 12, 4133. [Google Scholar] [CrossRef]
- Kibar, H. Influence of Storage Conditions on the Quality Properties of Wheat Varieties. J. Stored Prod. Res. 2015, 62, 8–15. [Google Scholar] [CrossRef]
- Yewle, N.R.; Stroshine, R.L.; Ambrose, R.K.; Baributsa, D. Short-Term Hermetic Storage of Wet Maize and Its Effect on Quality. Foods 2023, 12, 891. [Google Scholar] [CrossRef] [PubMed]
- Liang, X.; Zhang, A.; Yang, W.; Fan, X. Application of LF-NMR and DSC in the Analysis of Wheat Storage Quality Deterioration. Food Res. Dev. 2021, 42, 103–109. [Google Scholar]
- Nyarko, S.K.; Akyereko, Y.G.; Akowuah, J.O.; Wireko-Manu, F.D. Comparative Studies on Grain Quality and Pesticide Residues in Maize Stored in Hermetic and Polypropylene Storage Bags. Agriculture 2021, 11, 772. [Google Scholar] [CrossRef]
- Escalante-Aburto, A.; Figueroa-Cárdenas, J.d.D.; Dominguez-Lopez, A.; García-Lara, S.; Ponce-García, N. Multivariate Analysis on the Properties of Intact Cereal Kernels and Their Association with Viscoelasticity at Different Moisture Contents. Foods 2023, 12, 808. [Google Scholar] [CrossRef]
- Atluri, G.; Karpatne, A.; Kumar, V. Spatio-Temporal Data Mining: A Survey of Problems and Methods. ACM Comput. Surv. 2019, 51, 1–41. [Google Scholar] [CrossRef]
- Auslander, N.; Wolf, Y.I.; Koonin, E.V. In Silico Learning of Tumor Evolution through Mutational Time Series. Proc. Natl. Acad. Sci. USA 2019, 116, 9501–9510. [Google Scholar] [CrossRef]
- Puangragsa, U.; Setakornnukul, J.; Dankulchai, P.; Phasukkit, P. 3D Kinect Camera Scheme with Time-Series Deep-Learning Algorithms for Classification and Prediction of Lung Tumor Motility. Sensors 2022, 22, 2918. [Google Scholar] [CrossRef]
- Wang, Z. Risk Prediction of Sports Events Based on Gray Neural Network Model. Complexity 2021, 2021, 6214036. [Google Scholar] [CrossRef]
- Gupta, A.; Liu, T.; Crick, C. Utilizing Time Series Data Embedded in Electronic Health Records to Develop Continuous Mortality Risk Prediction Models Using Hidden Markov Models: A Sepsis Case Study. Stat. Methods Med. Res. 2020, 29, 3409–3423. [Google Scholar] [CrossRef]
- Wang, P.; Tian, H.; Zhang, Y.; Han, D.; Wang, J.; Yin, M. Crop Growth Monitoring and Yield Estimation Based on Deep Learning: State of the Art and Beyond. Trans. Chin. Soc. Agric. Mach. 2022, 53, 1–14. [Google Scholar]
- Devi, M.; Kumar, J.; Malik, D.P.; Mishra, P. Forecasting of Wheat Production in Haryana Using Hybrid Time Series Model. J. Agric. Food Res. 2021, 5, 100175. [Google Scholar] [CrossRef]
- Jeong, J.H.; Resop, J.P.; Mueller, N.D.; Fleisher, D.H.; Yun, K.; Butler, E.E.; Timlin, D.J.; Shim, K.-M.; Gerber, J.S.; Reddy, V.R.; et al. Random Forests for Global and Regional Crop Yield Predictions. PLoS ONE 2016, 11, e0156571. [Google Scholar] [CrossRef] [PubMed]
- Agarwal, D.; Bachan, P. Machine Learning Approach for the Classification of Wheat Grains. Smart Agric. Technol. 2023, 3, 100136. [Google Scholar] [CrossRef]
- Lin, L.; Liu, J.; Zhang, X.; Liang, X. Automatic Translation of Spoken English Based on Improved Machine Learning Algorithm. J. Intell. Fuzzy Syst. 2021, 40, 2385–2395. [Google Scholar] [CrossRef]
- Sindwani, A.; Kumar, A.; Gautam, C.; Purohit, G.; Tanwar, P. Prediction and Monitoring of Stored Food Grains Health Using IoT Enable Nodes. In Proceedings of the 2020 IEEE International Conference on Computing, Power and Communication Technologies (GUCON), Greater Noida, India, 2–4 October 2020; IEEE: Greater Noida, India, 2020; pp. 516–522. [Google Scholar]
- Duan, S.; Yang, W.; Wang, X.; Mao, S.; Zhang, Y. Temperature Forecasting for Stored Grain: A Deep Spatiotemporal Attention Approach. IEEE Internet Things J. 2021, 8, 17147–17160. [Google Scholar] [CrossRef]
- Yang, W.; Wang, X.; Cao, S.; Wang, H.; Mao, S. Multi-Class Wheat Moisture Detection with 5GHz Wi-Fi: A Deep LSTM Approach. In Proceedings of the 2018 27th International Conference on Computer Communication and Networks (ICCCN), Hangzhou, China, 30 July–2 August 2018; IEEE: Hangzhou, China, 2018; pp. 1–9. [Google Scholar]
- Jubair, S.; Tucker, J.R.; Henderson, N.; Hiebert, C.W.; Badea, A.; Domaratzki, M.; Fernando, W.G.D. GPTransformer: A Transformer-Based Deep Learning Method for Predicting Fusarium Related Traits in Barley. Front. Plant Sci. 2021, 12, 761402. [Google Scholar] [CrossRef] [PubMed]
- GB 2763-2021; National Food Safety Standard-In Maximum Residue Limits for Pesticides in Food. China Agriculture Press: Beijing, China, 2021; 95–97, 165–166, 192–193.
- PyTorch. Available online: https://pytorch.org/ (accessed on 4 March 2023).
- Wu, H.; Xu, J.; Wang, J.; Long, M. Autoformer: Decomposition Transformers with Auto-Correlation for Long-Term Series Forecasting. Adv. Neural Inf. Process. Syst. 2022, 34, 22419–22430. [Google Scholar]
- Vaswani, A.; Shazeer, N.; Parmar, N.; Uszkoreit, J.; Jones, L.; Gomez, A.N.; Kaiser, L.; Polosukhin, I. Attention Is All You Need. Adv. Neural Inf. Process. Syst. 2017, 30. [Google Scholar] [CrossRef]
- Geiger, A.; Liu, D.; Alnegheimish, S.; Cuesta-Infante, A.; Veeramachaneni, K. TadGAN: Time Series Anomaly Detection Using Generative Adversarial Networks. In Proceedings of the 2020 IEEE International Conference on Big Data (Big Data), Atlanta, GA, USA, 10–13 December 2020; IEEE: Atlanta, GA, USA, 2020; pp. 33–43. [Google Scholar]
- Chechetkin, V.R.; Lobzin, V.V. Detection of Large-Scale Noisy Multi-Periodic Patterns with Discrete Double Fourier Transform. II. Study of Correlations Between Patterns. Fluct. Noise Lett. 2021, 20, 2150003. [Google Scholar] [CrossRef]
- Du, G.; Li, X.; Zhang, L.; Liu, L.; Zhao, C. Novel Automated K-Means++ Algorithm for Financial Data Sets. Math. Probl. Eng. 2021, 2021, 1–12. [Google Scholar] [CrossRef]
- Shahapure, K.R.; Nicholas, C. Cluster Quality Analysis Using Silhouette Score. In Proceedings of the 2020 IEEE 7th International Conference on Data Science and Advanced Analytics (DSAA), Sydney, NSW, Australia, 6–9 October 2020; IEEE: Sydney, NSW, Australia, 2020; pp. 747–748. [Google Scholar]
- Singh, A.K.; Mittal, S.; Malhotra, P.; Srivastava, Y.V. Clustering Evaluation by Davies-Bouldin Index (DBI) in Cereal Data Using K-Means. In Proceedings of the 2020 Fourth International Conference on Computing Methodologies and Communication (ICCMC), Erode, India, 11–13 March 2020; IEEE: Erode, India, 2020; pp. 306–310. [Google Scholar]


| Dataset | Training Set | Test Set | Validation Set |
|---|---|---|---|
| 2655 | 1858 | 531 | 266 |
| Computer information | Operating system | Windows 10 64-bit |
| CPU | Intel(R) Core(TM) i5-8265U CPU @ 1.60 GHz (8 CPUs) ~1.8 GHz | |
| GPU | Radeon 540X Series | |
| RAM | 16 GB | |
| Toolkit | Python 3.7 | Numpy 1.21.5 |
| Scikit_Learn 1.0.2 | ||
| Pandas 0.25.1 | ||
| Torch 1.12.0 | ||
| Matplotlib 3.5.2 |
| Model | MAE | MSE | RMSE | MAPE | SMAPE |
|---|---|---|---|---|---|
| RNN | 0.28169 | 0.04516 | 0.88492 | 0.55132 | 7.32437 |
| LSTM | 0.24352 | 0.04324 | 0.83203 | 0.43147 | 6.43174 |
| Transformer | 0.16428 | 0.03986 | 0.28255 | 0.19966 | 2.43713 |
| Autoformer | 0.11017 | 0.01358 | 0.04681 | 0.11654 | 0.13005 |
| Categories | Sample Size | Quality Level | ||
|---|---|---|---|---|
| Dimethoate 1 | 0.03950035 | 0.03341637 | 810 | Level 1 |
| Dimethoate 2 | 0.04434314 | 0.03039072 | 1080 | Level 2 |
| Dimethoate 3 | 0.04900005 | 0.04175411 | 765 | Level 3 |
| Chlorpyrifos 1 | 0.22891236 | 0.17001536 | 855 | Level 1 |
| Chlorpyrifos 2 | 0.28989454 | 0.20340521 | 765 | Level 2 |
| Chlorpyrifos 3 | 0.33112902 | 0.25336484 | 1035 | Level 3 |
| Chlorpyrifos-methyl 1 | 1.77091609 | 1.22453220 | 890 | Level 1 |
| Chlorpyrifos-methyl 2 | 2.43346228 | 1.54720279 | 935 | Level 2 |
| Chlorpyrifos-methyl 3 | 3.20258731 | 2.02372957 | 830 | Level 3 |
Disclaimer/Publisher’s Note: The statements, opinions and data contained in all publications are solely those of the individual author(s) and contributor(s) and not of MDPI and/or the editor(s). MDPI and/or the editor(s) disclaim responsibility for any injury to people or property resulting from any ideas, methods, instructions or products referred to in the content. |
© 2023 by the authors. Licensee MDPI, Basel, Switzerland. This article is an open access article distributed under the terms and conditions of the Creative Commons Attribution (CC BY) license (https://creativecommons.org/licenses/by/4.0/).
Share and Cite
Liu, Y.; Zhang, Q.; Dong, W.; Li, Z.; Liu, T.; Wei, W.; Zuo, M. Autoformer-Based Model for Predicting and Assessing Wheat Quality Changes of Pesticide Residues during Storage. Foods 2023, 12, 1833. https://doi.org/10.3390/foods12091833
Liu Y, Zhang Q, Dong W, Li Z, Liu T, Wei W, Zuo M. Autoformer-Based Model for Predicting and Assessing Wheat Quality Changes of Pesticide Residues during Storage. Foods. 2023; 12(9):1833. https://doi.org/10.3390/foods12091833
Chicago/Turabian StyleLiu, Yingjie, Qingchuan Zhang, Wei Dong, Zihan Li, Tianqi Liu, Wei Wei, and Min Zuo. 2023. "Autoformer-Based Model for Predicting and Assessing Wheat Quality Changes of Pesticide Residues during Storage" Foods 12, no. 9: 1833. https://doi.org/10.3390/foods12091833
APA StyleLiu, Y., Zhang, Q., Dong, W., Li, Z., Liu, T., Wei, W., & Zuo, M. (2023). Autoformer-Based Model for Predicting and Assessing Wheat Quality Changes of Pesticide Residues during Storage. Foods, 12(9), 1833. https://doi.org/10.3390/foods12091833