Article

Effects of Light Shading, Fertilization, and Cultivar Type on the Stable Isotope Distribution of Hybrid Rice

1
State Key Laboratory for Managing Biotic and Chemical Threats to the Quality and Safety of Agro-Products, Hangzhou 310021, China
2
China National Rice Research Institute, Hangzhou 310006, China
3
Institute of Agro-Product Safety and Nutrition, Zhejiang Academy of Agricultural Sciences, Key Laboratory of Information Traceability for Agricultural Products, Ministry of Agriculture and Rural Affairs of China, Hangzhou 310021, China
4
Department of Food Science, University of Home Economics Lahore, Lahore 54700, Pakistan
5
National Isotope Centre, GNS Science, 30 Gracefield Road, Lower Hutt 5040, New Zealand
6
Research Center for Plants and Human Health, Institute of Urban Agriculture, Chinese Academy of Agricultural Sciences, Chengdu 610213, China
*
Authors to whom correspondence should be addressed.
These authors contributed equally to this work.
Foods 2023, 12(9), 1832; https://doi.org/10.3390/foods12091832
Submission received: 10 March 2023 / Revised: 10 April 2023 / Accepted: 24 April 2023 / Published: 28 April 2023

Abstract

:
The effect of fertilizer supply and light intensity on the distribution of elemental contents (%C and %N) and light stable isotopes (C, N, H, and O) in different rice fractions (rice husk, brown rice, and polished rice) of two hybrid rice cultivars (maintainer lines You-1B and Zhong-9B) were investigated. Significant variations were observed for δ13C (−31.3 to −28.3‰), δ15N (2.4 to 2.7‰), δ2H (−125.7 to −84.7‰), and δ18O (15.1‰ to 23.7‰) values in different rice fractions among different cultivars. Fertilizer treatments showed a strong association with %N, δ15N, δ2H, and δ18O values while it did not impart any significant variation for the %C and δ13C values. Light intensity levels also showed a significant influence on the isotopic values of different rice fractions. The δ13C values showed a positive correlation with irradiance. The δ2H and δ15N values decreased with an increase in the irradiance. The light intensity levels did not show any significant change for δ18O values in rice fractions. Multivariate ANOVA showed a significant interaction effect of different factors (light intensity, fertilizer concentration, and rice variety) on the isotopic composition of rice fractions. It is concluded that all environmental and cultivation factors mentioned above significantly influenced the isotopic values and should be considered when addressing the authenticity and origin of rice. Furthermore, care should be taken when selecting rice fractions for traceability and authenticity studies since isotopic signatures vary considerably among different rice fractions.

1. Introduction

Rice (Oryza sativa L.) is a major cereal crop consumed by half of the global population and widely planted in Asia, Africa, and parts of America. In 2020, the total area under rice cultivation exceeded 195 million hectares. The quality characteristics of rice are mainly associated with its growing conditions, and recently the traceability of rice back to its growing origins has gained increasing interest from consumers, producers, and related industries since it is vulnerable to economic fraud [1]. Many methods have been developed to address the authenticity of rice, including multi-element, spectroscopic, omic, and DNA-based analysis [2,3,4,5]. Most recently, stable isotope analysis (SIA) has been widely employed to authenticate organic rice, determine its geographic origin, and identify rice cultivars [6,7]. However, there may be unknown stable isotope effects on rice, caused by cultivar type, light intensity, environmental factors, and fertilizer treatments which may reduce the accurate determination of its geographical origin, especially when it is procured from nearby or adjoining localities. Therefore, identifying the range of stable isotope compositions (δ13C, δ15N, δ2H, and δ18O) in different rice fractions according to the differences in light intensity level, fertilizer type and concentration, and cultivar/variety would improve the validity of traceability methods for rice and its products.
Different factors such as plant physiology, photosynthetic processes, climatic factors (temperature, sunshine, humidity, precipitation), and cultivation practices have been shown to induce stable isotope fractionation in plants [8]. Generally, the δ13C values of plants reflect plant photosynthetic processes and water use efficiency. Carbon found in mature rice grains originates from the assimilation of CO2 during the grain filling period [9]. Solar irradiance is the main factor that affects the net CO2 assimilation rate and high temperature is also associated with stomatal closure and a reduction in CO2 assimilation. Conversely, if the temperature is below the optimum range, the net CO2 assimilation rate will become light-limited and lead to reduced photosynthetic productivity [10]. In addition, plant photosynthesis is also affected internally by photozymes, hydrolase C3 reductase, and CO2 fixation enzymes [11]. This internal physiological response is referred as the physiological index which mainly reflects stomatal conductance, transpiration rates, net photosynthetic rate, and intercellular CO2 concentration. Plant δ2H and δ18O values reflect physical factors such as rainfall and evapotranspiration, and are also associated with plant physiological parameters such as transpiration and stomatal conductance [12]. Nitrogen isotopes are mostly associated with farming practices, crop types, and soil characteristics and also reflect significant correlations between plant growth, photosynthetic capacity, and respiration rate [8,12].
Many studies have reported the limitation of stable isotopes in addressing the authenticity of agro-products when the samples are procured from close geographical locations or from a region where the same agricultural practices (fertilizer, etc.) are adopted [13]. Therefore, it is very important to understand the effects of different factors (light intensity, fertilizer type and concentration, and cultivar type) on the composition of rice stable isotopes. To explore these effects, we conducted two field experiments with a split plot design using two commonly used Chinese hybrid rice cultivars (maintainer lines) Zhong-9B and You-1B. The objective of this study was to investigate the variability of %C, %N, δ13C, δ15N, δ2H, and δ18O values in different rice fractions (husk, polished rice, and brown rice) in response to different fertilizer regimes and light intensity levels, and to identify how light shading and fertilizer application control isotopic ratios in rice. The results from this study will contribute more insight into the localized climatic, environmental, and farming effects on the isotopic composition of rice and will allow us to better predict rice origin and authenticity using stable isotope-based traceability models.

2. Material and Methods

2.1. Field Experiment

Field trials were carried out in 2018 at an experimental field at the China National Rice Research Institute (CNRRI) in Fuyang, Zhejiang province. Two commonly used hybrid rice maintainer lines (Zhong9B and You1B, which are the most popular cultivars in China provided by CNRRI), were studied. In total, three nitrogen treatments (N0, N6, and N12) with three light intensities (shading; 50% and 75%, and non-shading; ambient light) were arranged in a split plot design. The size of each plot was 10 m2 with 3 replicates for each treatment. Nitrogenous fertilizer was applied as 0 kg/ha (N0), 90 kg/ha (N6), and 180 kg/ha (N12), respectively, at different growing stages including basal planting, tillering, and heading stages which accounted for 50%, 30%, and 20% of the application, respectively. Phosphate fertilizers were used only as basal fertilizer, whereas potash was used as both basal and tillering fertilizers and the fertilizer proportion was N:P:K = 1:0.5:0.5, respectively.
In the case of N0, urea was not applied during the entire production period. In total, 450 kg/ha of super phosphate was applied as basal fertilizer and 150 kg/ha of potash as basal (75 kg/ha) and tillering stage (75 kg/ha), respectively. For N6 treatment, 195 kg/ha of urea was applied, including 97.5kg/ha as basal fertilizer, 58.5 kg/ha as tillering fertilizer (7 to 9 days after transplanting), and 39 kg/ha as heading fertilizer (30 days after transplanting), respectively. In the case of N12 treatment, a total of 390 kg/ha of urea was applied, of which 195 kg/ha was basal fertilizer, 117 kg/ha was tillering fertilizer, and 78 kg/ha was applied as heading fertilizer. The application rate of phosphate and potash fertilizers for both N6 and N12 treatments were the same as N0.
For the light intensity investigation, natural sunlight treatment, LS-0 (0% shading, no shading), and shaded treatments, LS-50 (50% shading) and LS-75 (75% shading) were applied. In the shaded treatments, plants were shaded with a shading screen/net. For LS-50, one layer was used and for LS-75 two layers of shading screen were applied over the top of the rice plants.

2.2. Elemental Content and Isotope Ratio Measurements

Rice grains (2 kg) from each plot were harvested at maturity and subsequently threshed by a hulling machine equipped with a rice polisher (PY-200, Hubei Pinyang Technology Co., Ltd., Xiaogan, China) to obtain different fractions including brown rice (BR), polished rice (PR), and rice husk (RH). All fractions were air-dried, then ground into a fine powder, and finally dried at 50 ± 2 °C for 24 h. The samples were stored in desiccators until further analysis. For the determination of elemental contents (% C, % N) and isotopes (δ13C and δ15N), dried powdered samples were weighed (4.5 to 5.5 mg) and packed into tin capsules (3 mm × 5 mm). The samples were combusted in an elemental analyzer (Vario Pyro Cube, Elementar, Hanau, Germany) and the combustion gases were analyzed using an isotope ratio mass spectrometer (IRMS) (IsoPrime100, Isoprime Ltd., Manchester, UK). Sample combustion was carried out in a combustion furnace at 1150 °C and reduction in the N2Ox gases to N2 over copper wire occurred at 850 °C. An inert gas (He) with a flow rate of 230 mL/min was passed through a CentrION prior to mass spectrometry. Acetanilide (Puriss. p.a., Sigma-Aldrich) was used to calibrate elemental % C and % N. For δ13C and δ15N analysis, multipoint calibration was applied using reference standard materials including B2155 (protein, δ13C = −27.0‰, δ15N = +6.0‰), IAEA-CH-6 (sucrose, δ13C = −10.4‰), USGS40 (L-glutamic acid, δ13C = −26.4‰, δ15N = −4.5‰), USGS64 (glycine, δ13C = −40.8‰, δ15N = +1.8‰), and IAEA-N-2 (ammonium sulfate, δ15N = +20.3‰). The δ13C and δ15N values were measured relative to V-PDB and AIR, respectively.
For δ2H and δ 18O isotopes, around 1.0 mg powdered sample of each fraction was weighed into silver capsules (6 mm × 4 mm) and analyzed using EA (Vario Pyro Cube, Elementar, Hanau, Germany) IRMS (IsoPrime100, Isoprime Ltd., Manchester, England). Reference materials USGS54 (Canadian lodgepole pine, δ2H = −150.4‰, δ18O = +17.8‰) and USGS55 (Mexican ziricote, δ2H = −28.2‰, δ18O = +19.1‰) were used to calibrate the δ2H and δ18O measurements. Samples and reference materials were freeze-dried at −60 °C for three days to remove all adsorbed water and subsequently equilibrated for five days in the laboratory and exposed to local atmospheric conditions prior to H and O analysis. Pyrolysis was performed at 1450 °C to convert organic H and O to gaseous H2 and CO, respectively, and finally the analytes were transferred into the IRMS for isotope determination. The δ2H and δ18O values were measured relative to Vienna Standard Mean Ocean Water (V-SMOW). All the samples were analyzed in triplicate. Reference materials were sourced from the International Atomic Energy Agency (IAEA, Vienna, Austria) and the United States Geological Survey (USGS, Reston, Virginia, United States). B2155 was supplied by Elemental Microanalysis (Okehampton, United Kingdom). The analytical precision for δ13C, δ15N, δ2H, and δ18O was less than ±0.1‰, ±0.2‰, ±2‰, and 0.5‰, respectively. The delta values (δ) were calculated as follows:
δ E = R sample   /   R standard 1
where δE represents δ13C, δ15 N, δ2H, and δ18O whereas Rsample and Rstandard represent the 13C/12C, 15N/14N, 2H/1H, or 18O/16O ratios in samples and reference materials, respectively.

2.3. Data Analysis

The effect of light intensity, fertilizer type and concentration, cultivars, and their interaction were studied using %C, %N, δ13C, δ15 N, δ2H, and δ18O of different rice fractions with multivariate analysis of variance. Light shading level, fertilizer type and concentration, and cultivars were considered as fixed variables. Differences among the treatments were evaluated using Duncan’s test at a significance level of 0.05. All analyses were performed using R software (version 3.0.3).

3. Results and Discussion

3.1. Multivariate ANOVA for Elemental Content and Isotope Ratios

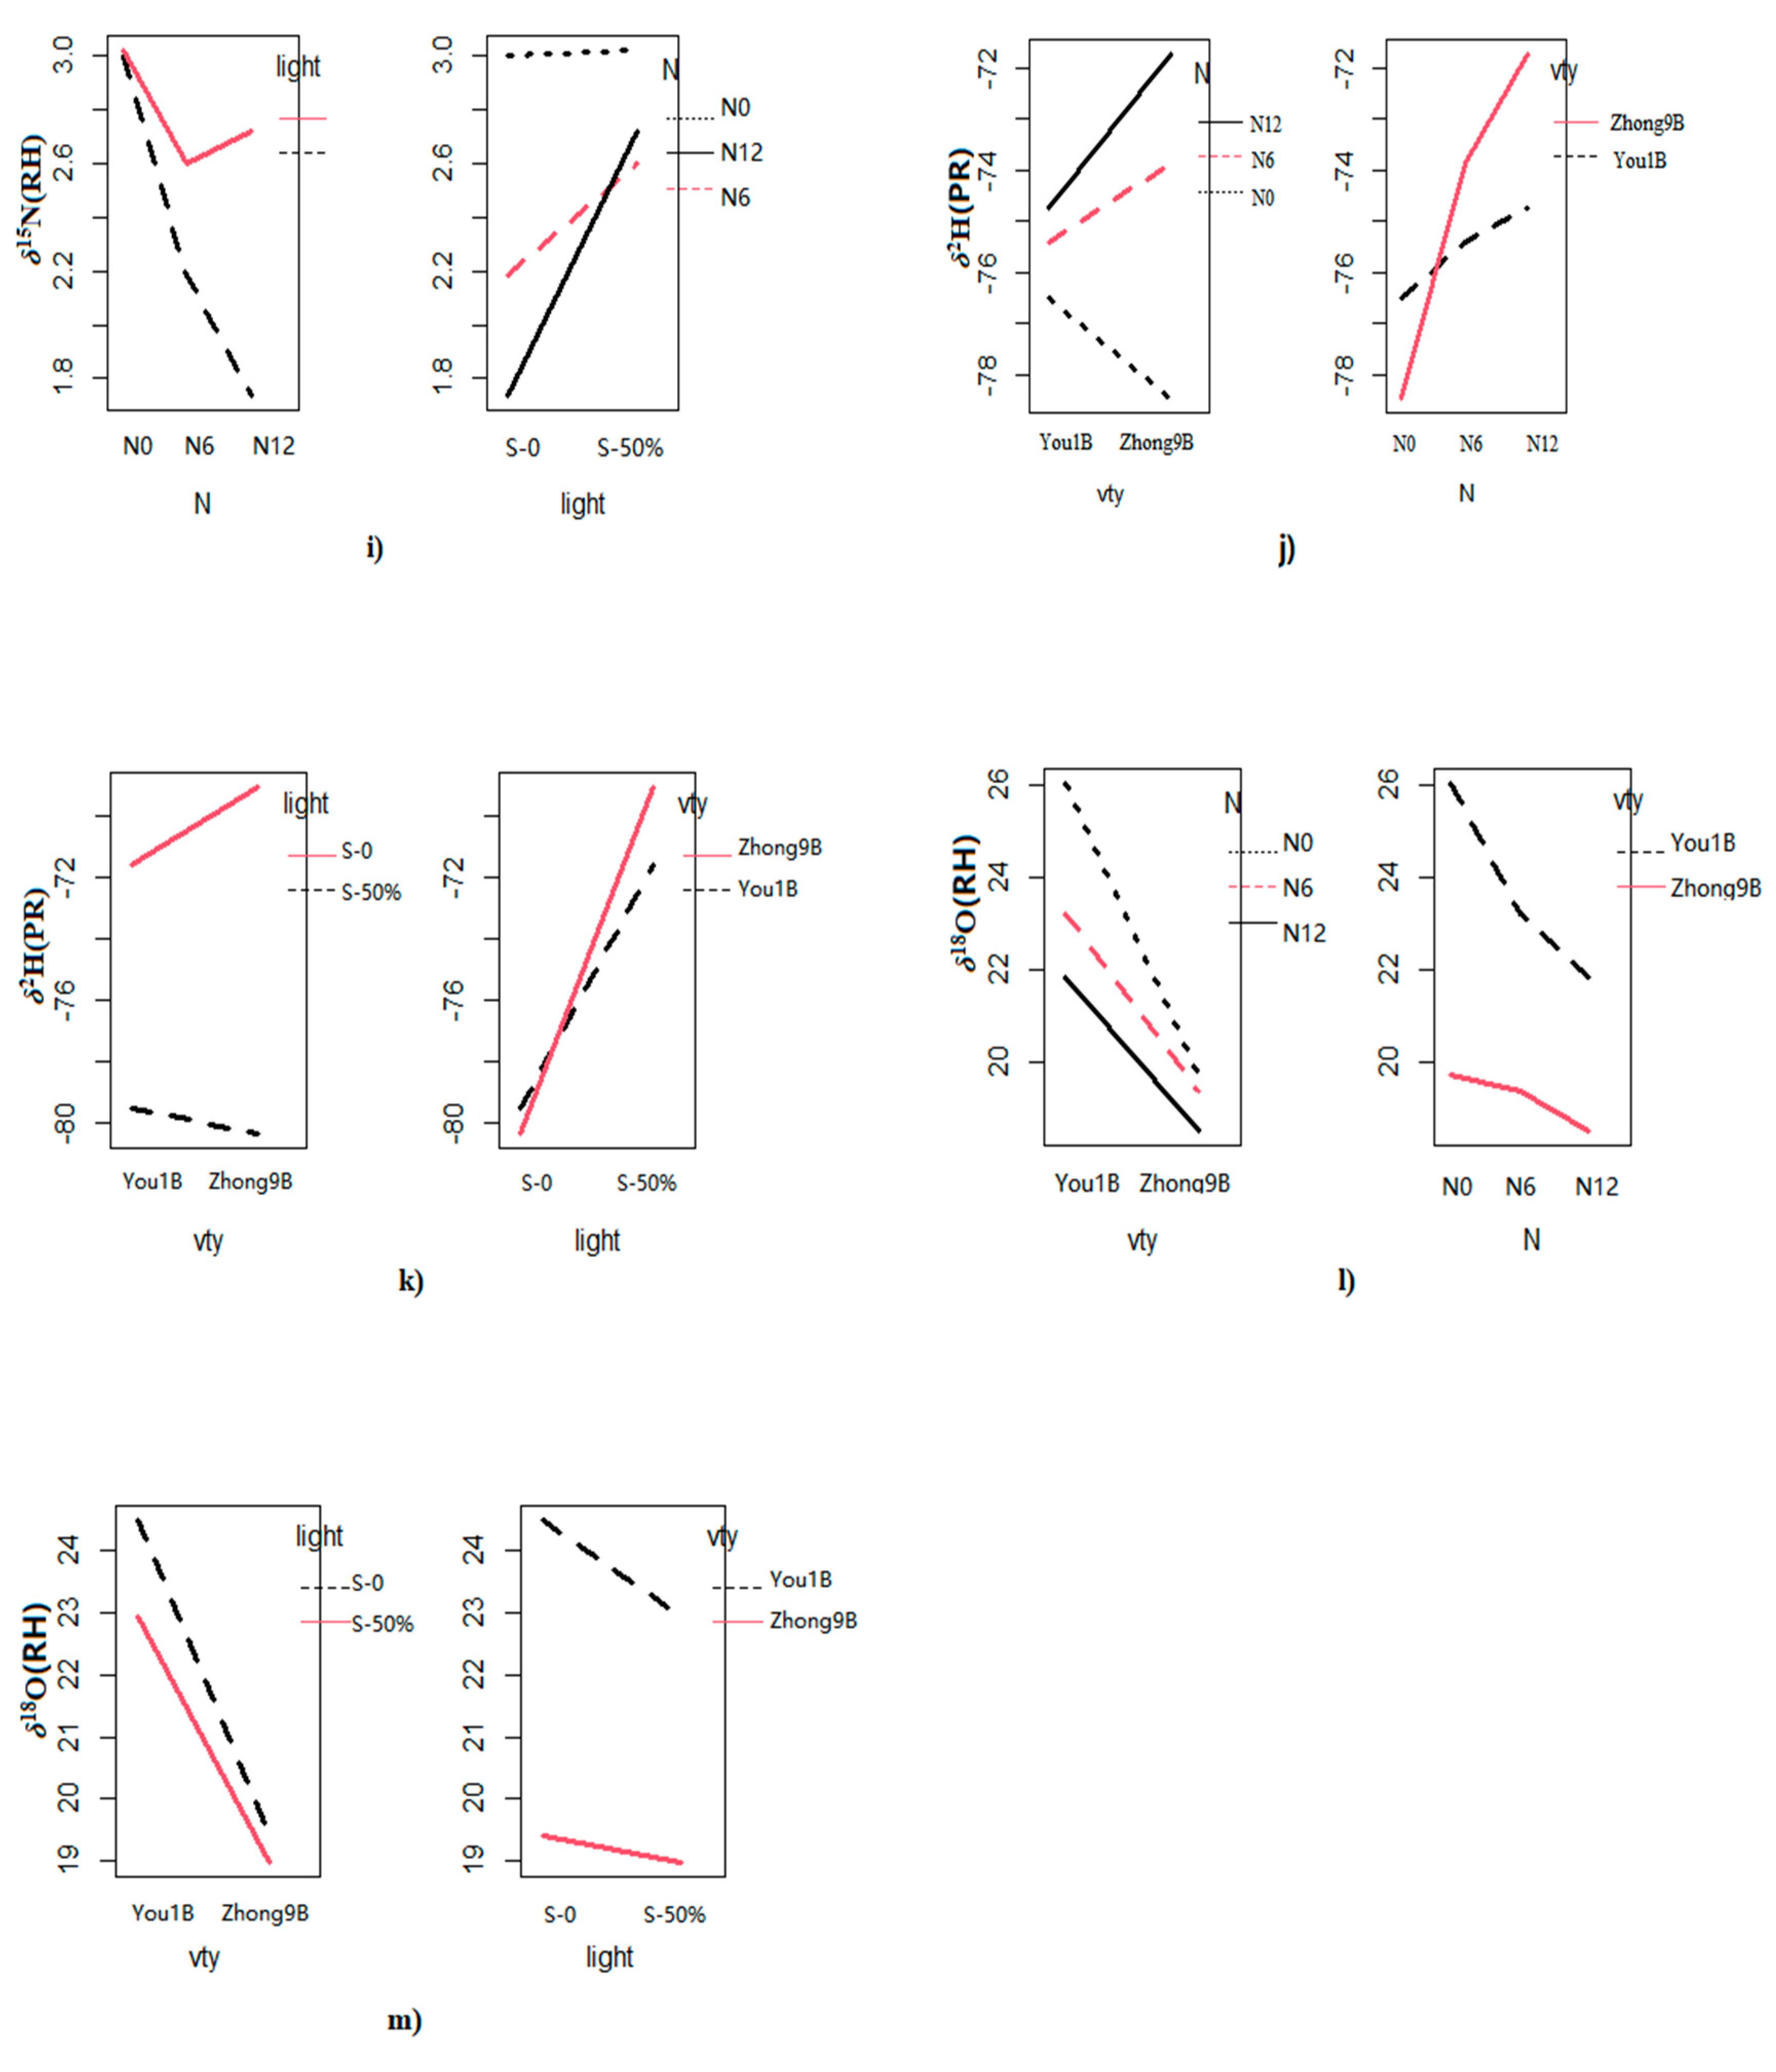
Multivariate analysis of variance was applied to evaluate the effect of different factors such as variety (vty), shading level, and fertilizer (nitrogen) concentration on the carbon (%C), nitrogen (%N), δ13C, δ15N, δ2H, and δ18O values of different rice fractions, including polished rice (PR), brown rice (BR), and rice husk (RH). The results are summarized in Table 1 and shown in Figure 1. The results showed that the carbon content (%C) in different rice fractions was not affected by vty, light shading, fertilizer, or their interactions. For %N, light shading showed a significant influence on the total nitrogen content of PR and BR; however, no significant difference was observed in RH under different light shading levels. Moreover, an interaction (vty × light shading) effect was also observed for PR (Figure 1a). In the case of δ13C, light shading and variety significantly contributed to all rice fractions. The interaction (vty × fertilizer)/(vty × light shading) effect also showed significant influence for PR and (vty × light shading) for RH. No interaction effect was observed for BR (Figure 1b–d).
The δ15N values in RH, PR, and BR were significantly affected by fertilizer concentration, shading level, and interaction (vty × shading level) effects (Figure 1e–g). Significant interaction effects (vty × fertilizer) on δ15N were also observed for PR (Figure 1h) and (fertilizer × light) for RH (Figure 1i). The fertilizer concentration and shading levels were the major factors that contributed significant variation among all rice fractions. In the case of δ2H, the fertilizer concentration and shading level showed a significant difference for PR and BR, whereas no significant difference was observed for RH. The interaction (vty × fertilizer)/(vty × light shading) effect was only observed for PR (Figure 1j,k). Only cultivar imparted a significant variation for the δ2H values in RH. In the case of δ18O, different trends were observed. Almost all factors contributed to a significant variation for RH but no significant differences were observed for BR and PR. The interaction (vty × fertilizer)/(vty × light shading) effects for δ18O are shown in Figure 1l,m, respectively.

3.2. Elemental and Isotope Differences between the Rice Varieties

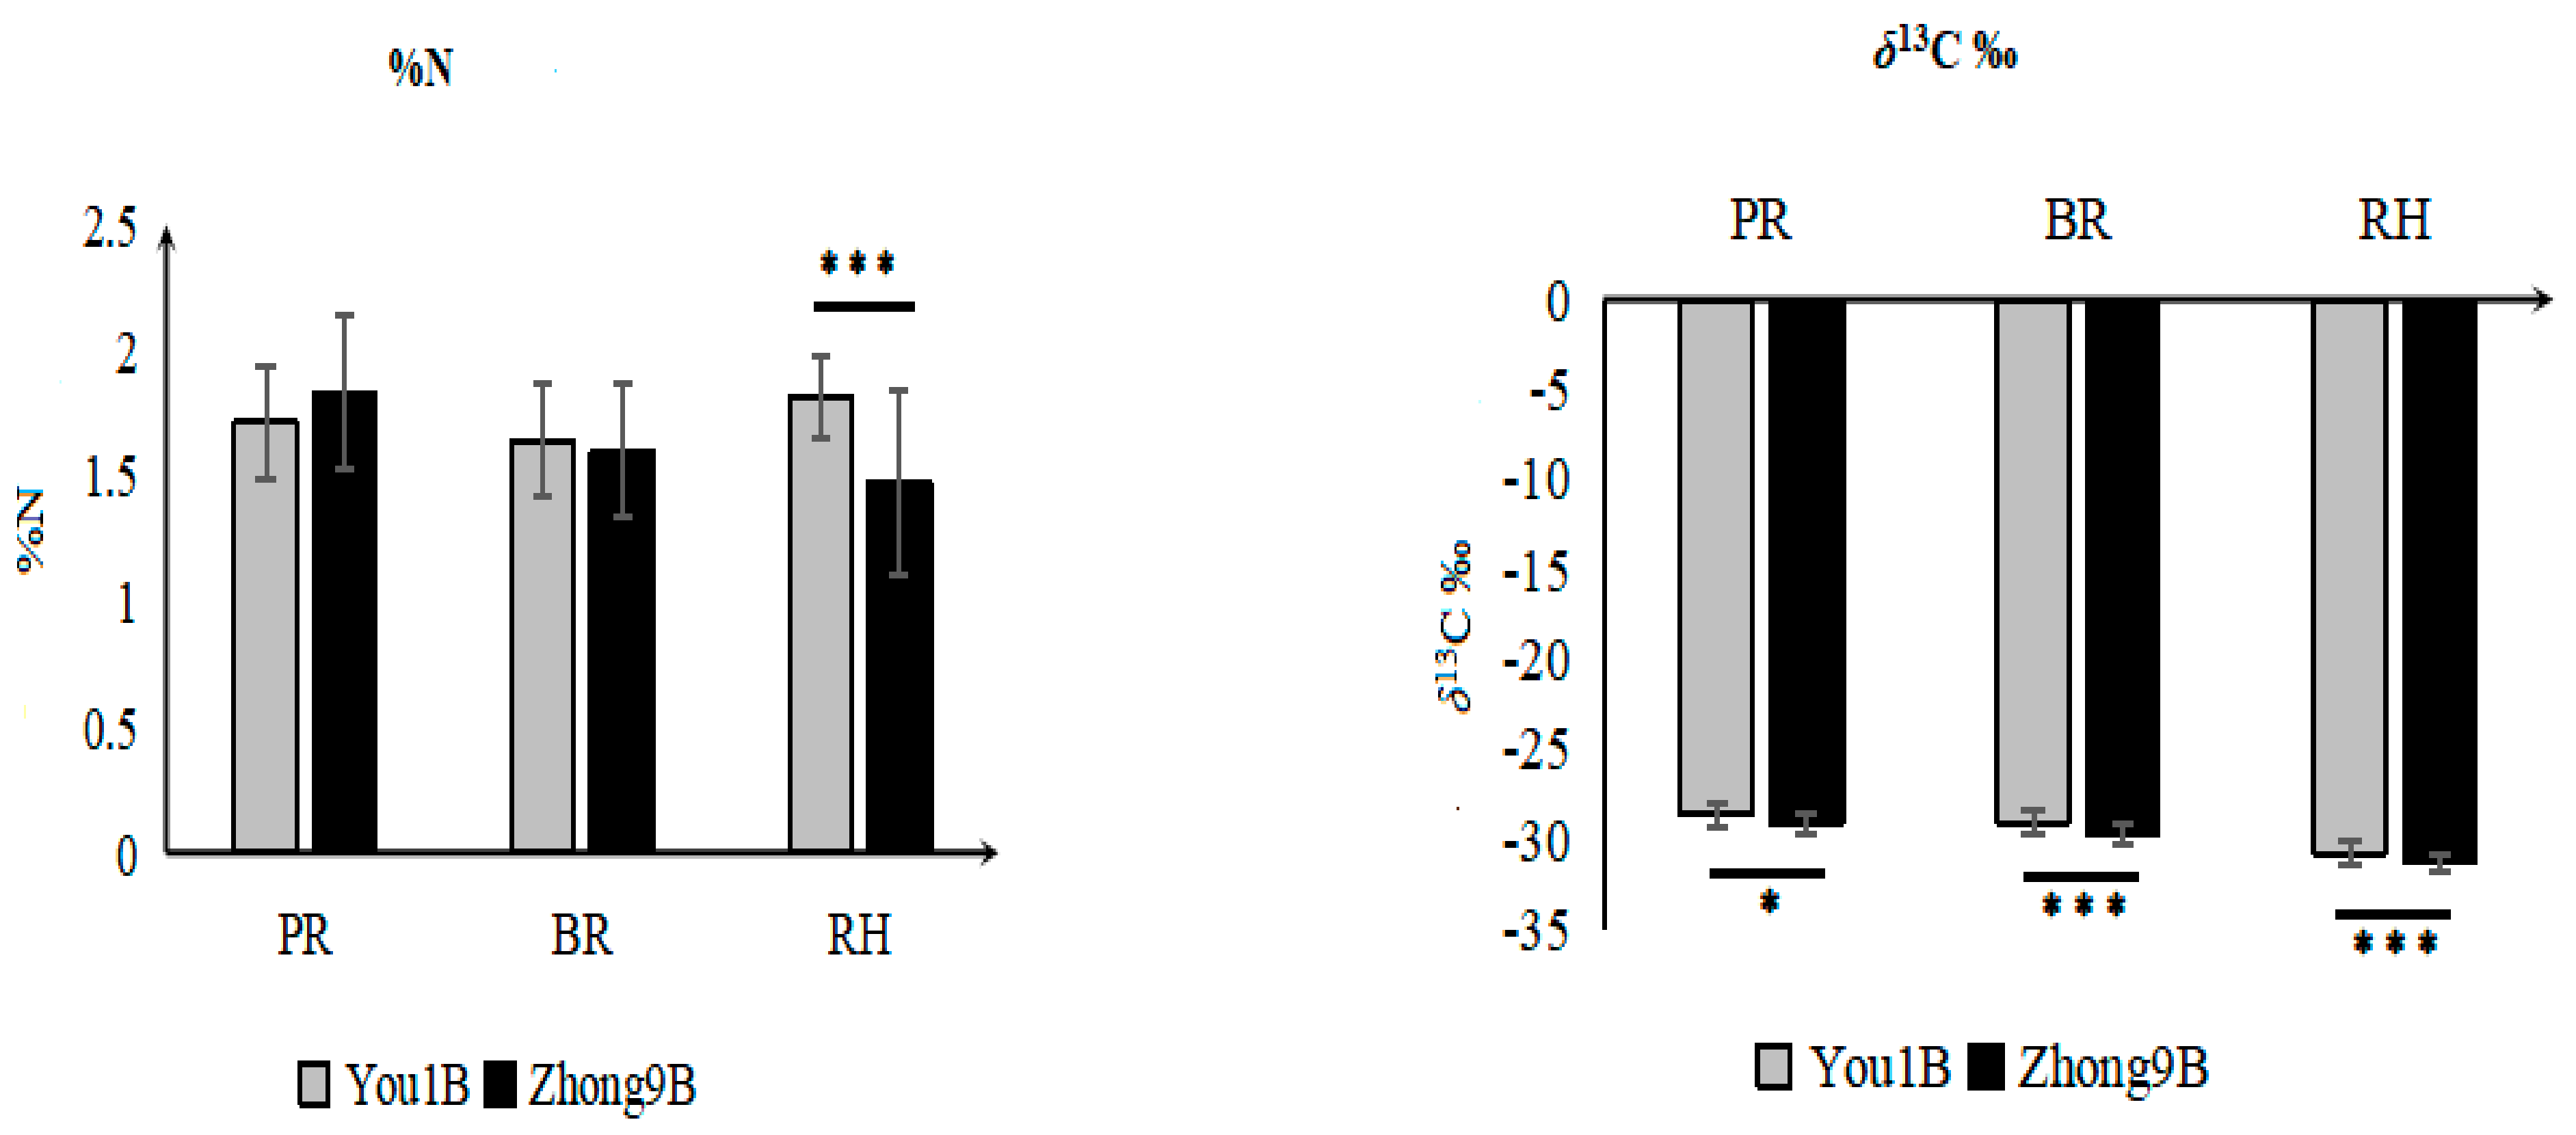
Differences in the %C, %N, δ13C, δ15N, δ2H, and δ18O values among the different rice cultivar fractions under different fertilizer concentrations and light intensities were determined. The results showed significant differences for all the analyzed parameters except for %C. Multiple comparisons were made between %N, δ13C, δ15N, δ2H, and δ18O values (Figure 2). The %N in RH showed a strong significant difference between the two rice varieties. The total %N of You-1B rice (1.8 ± 0.2%) was significantly higher than Zhong-9B rice (1.5 ± 0.4%). Similarly, the δ13C values of You-1B RH (−30.8‰), PR (−28.3‰), and BR (−29.1‰) were significantly higher than Zhong-9B (−31.3‰, −29.2‰, and −29.7‰), respectively. The lower δ13C values of Zhong-9B rice suggest higher water use efficiency. Different factors are responsible for genetic variations in the δ13C values, including diffusive conductance, water use efficiency, stomatal activity, etc. [14]. For the δ18O values, the two varieties also showed significant differences for PR and RH. Higher δ18O values of You-1B RH (23.7‰) indicate higher transpiration rates. Our results are consistent with previous findings where a similar trend was observed for δ18O variations among different rice cultivars [15]. Differences in the δ18O values are mainly due to the vegetative cycle of water [16].
A different pattern was observed for the δ2H values. You-1B BR (−88.6‰) and RH (−125.7‰) were significantly lower than Zhong-9B BR and RH (−84.7‰ and −117.0‰), respectively. This difference suggests that less water fractionation occurred in Zhong-9B rice. A previous study also reported a significant difference in the δ2H values among different rice cultivars [17].
The δ15N values also followed the same trend where Zhong-9B rice values were higher than You-1B, although the difference in traits between rice varieties was primarily reflected in RH. δ15N values of PR, BR, and RH in Zhong-9B and You-1B rice was (2.6‰, 2.5‰, 2.7‰) and (2.5‰, 2.4‰, and 2.4‰), respectively. Our results are consistent with previous findings where significant differences in the δ15N values among different rice cultivars were reported [18].

3.3. Effect of Fertilizer Regimes on Elemental and Isotope Values of Rice Fractions

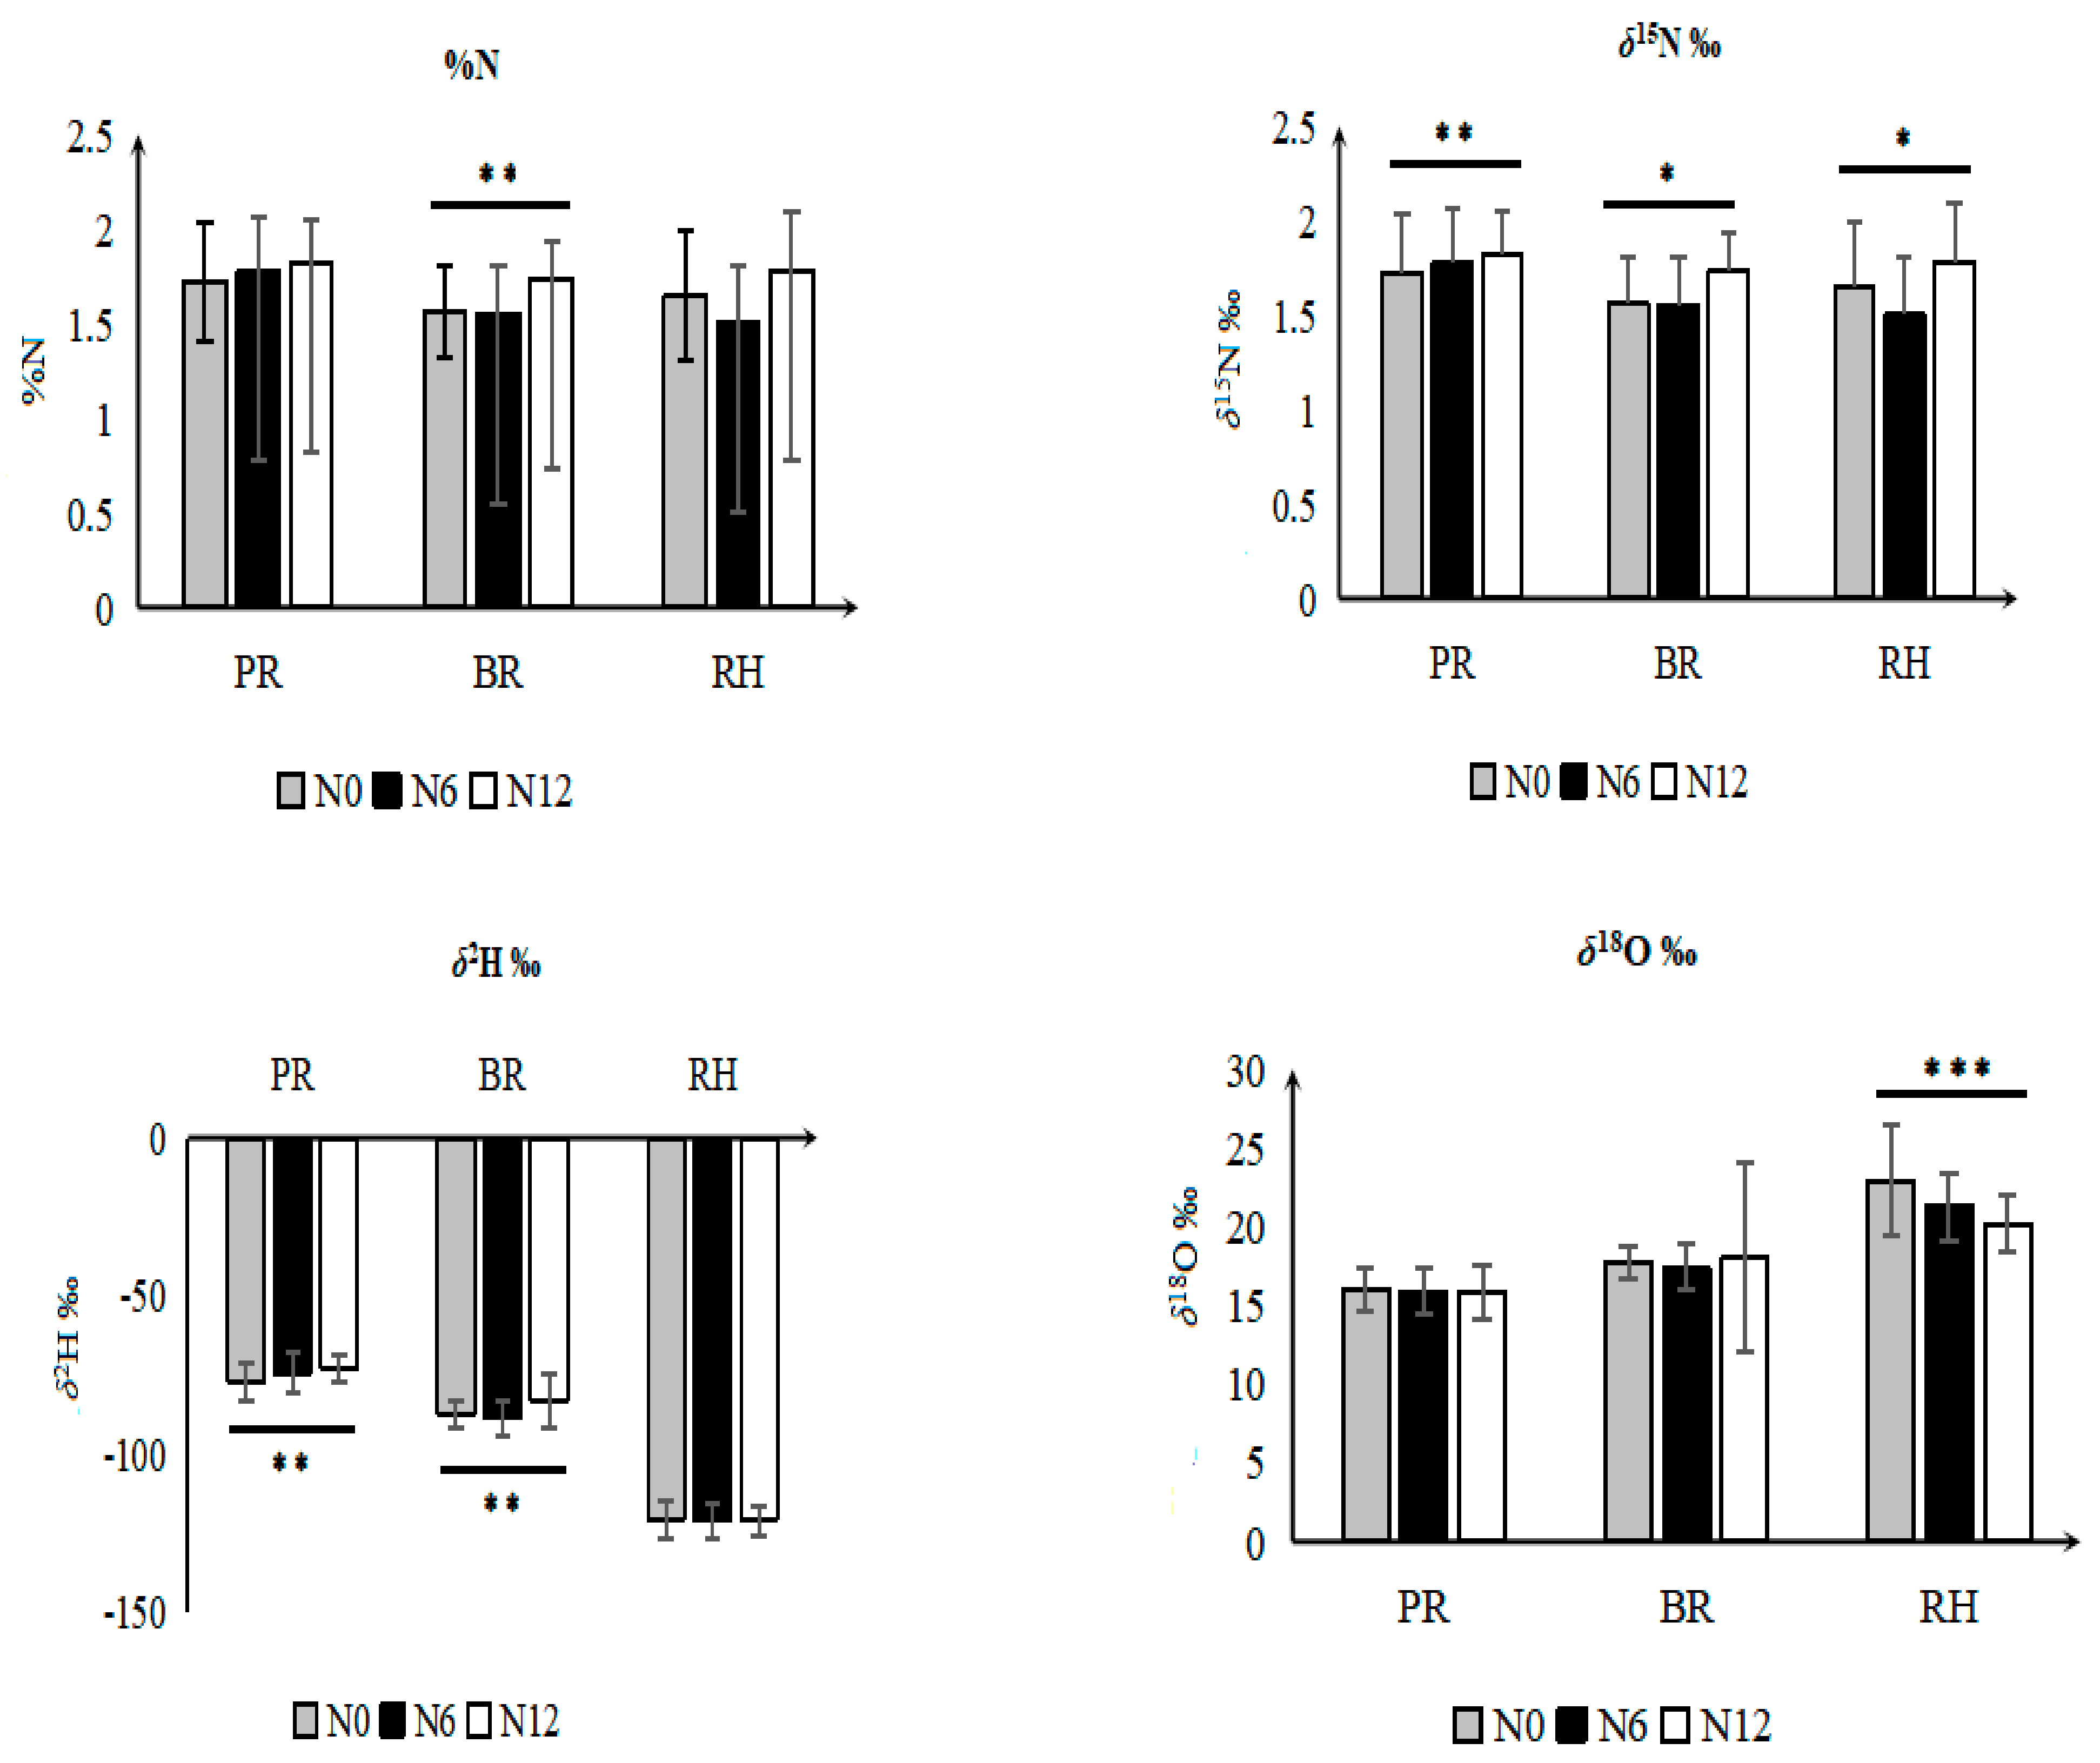
The effect of different fertilizer treatments on the %C, %N, δ13C, δ15N, δ2H, and δ18O values was measured and the results are shown in Figure 3. %N did not show any significant effect among the rice fractions and the only interaction effect (variety × nitrogen) was detected in PR rice (Table 1). The %N and δ15N values among different rice fractions were significantly affected by nitrogen fertilizer application levels. The %N and δ15N values of different rice fractions under different fertilizer concentrations (N0, N6, and N12) followed different patterns of accumulation. Figure 3 shows that the %N of rice grains was higher when subjected to higher nitrogen application levels. The %N for BR (1.8 ± 0.2%) grown under N12 conditions was significantly higher than N6 (1.6 ± 0.26%) and N0 (1.6 ± 0.2%), respectively. However, the δ15N value for N0 was significantly higher than N6 and N12 indicating that the synthetic urea fertilizer application level was negatively correlated with the δ15N values in different rice fractions (Figure 3).
These results appear consistent with previous findings which suggest conventionally fertilized rice has lower δ15N values compared to control samples (without fertilizer) [19]. The interpretation of δ15N signatures in plant tissues is generally complex since it can differ from the nutrient source as 15N fractionation occurs during plant physiological processes, mainly during nitrogen uptake, nitrate assimilation, and reduction, as well as during remobilization to the rice grain [20,21]. Lower δ15N values in the fertilized plant fractions during pre-anthesis reflect the direct N availability from the fertilizer applied. Discrimination against 15N occurs during the assimilation of inorganic nitrogen within the plant, and the enzymes responsible for this isotope discrimination include nitrate reductase and glutamine synthase [22].
Higher N assimilation rates in fertilized plants enhance the uptake of inorganic fertilizer which results in the reduction in 15N in fertilized plants compared to non-fertilized plants [22]. In addition, the isotopic discrimination against 15N is marginal in non-fertilized rice ears (glumes, awns, grains) as compared to fertilized rice ears, probably because N limitation prevents discrimination and promotes a higher efficiency for N remobilization [23]. The higher amount of N carried over into the grain results in a higher 15N discrimination. This fact suggests a decrease in the δ15N values for the rice grain in fertilized plants compared to non-fertilized plants. Discrimination within the plant is lower in the non-fertilized grains (N0; lacking nitrogen fertilizer) because the ratio between the plant demand vs. available N is high [24].
Nitrogen fertilizer application had a significant effect on the δ2H values in PR and BR. The highest δ2H values in PR (−73.2‰) and BR (−83.2‰) were observed for the N12 treatment which indicates that the δ2H values increased with N fertilizer level. There is limited literature on this topic, which restricts the discussion of this mechanism, although a similar trend was observed for the δ2H values in a previous study, where it was reported that BS-fertilized (biogas slurry) rice had higher δ2H values than a control rice (without fertilizer) [19]. The effects of nitrogen application levels on the δ18O values contrasted with δ2H values. There was no significant effect in the PR and BR grains, probably due to a weak or no effect on grain morphological parameters, and a lack of N effect on stomatal conductance and transpiration rates [25].
A significant difference was observed in the δ18O values in RH. The mean δ18O values for N6 (21.3‰) and N12 (20.2‰) treatments were significantly lower than N0 treatments (22.9‰) suggesting that the δ18O values in RH decreased with increasing nitrogen fertilization. Lower δ18O values in RH than the rice grain may be associated with progressive enrichment in plant components from the root, to the stem, to the leaf, and finally to the grain, as well as physiological factors such as dehydration and plant tissue degradation that occurs during husk development [26].

3.4. Elemental and Isotopic Variations among Different Light Shading Treatments

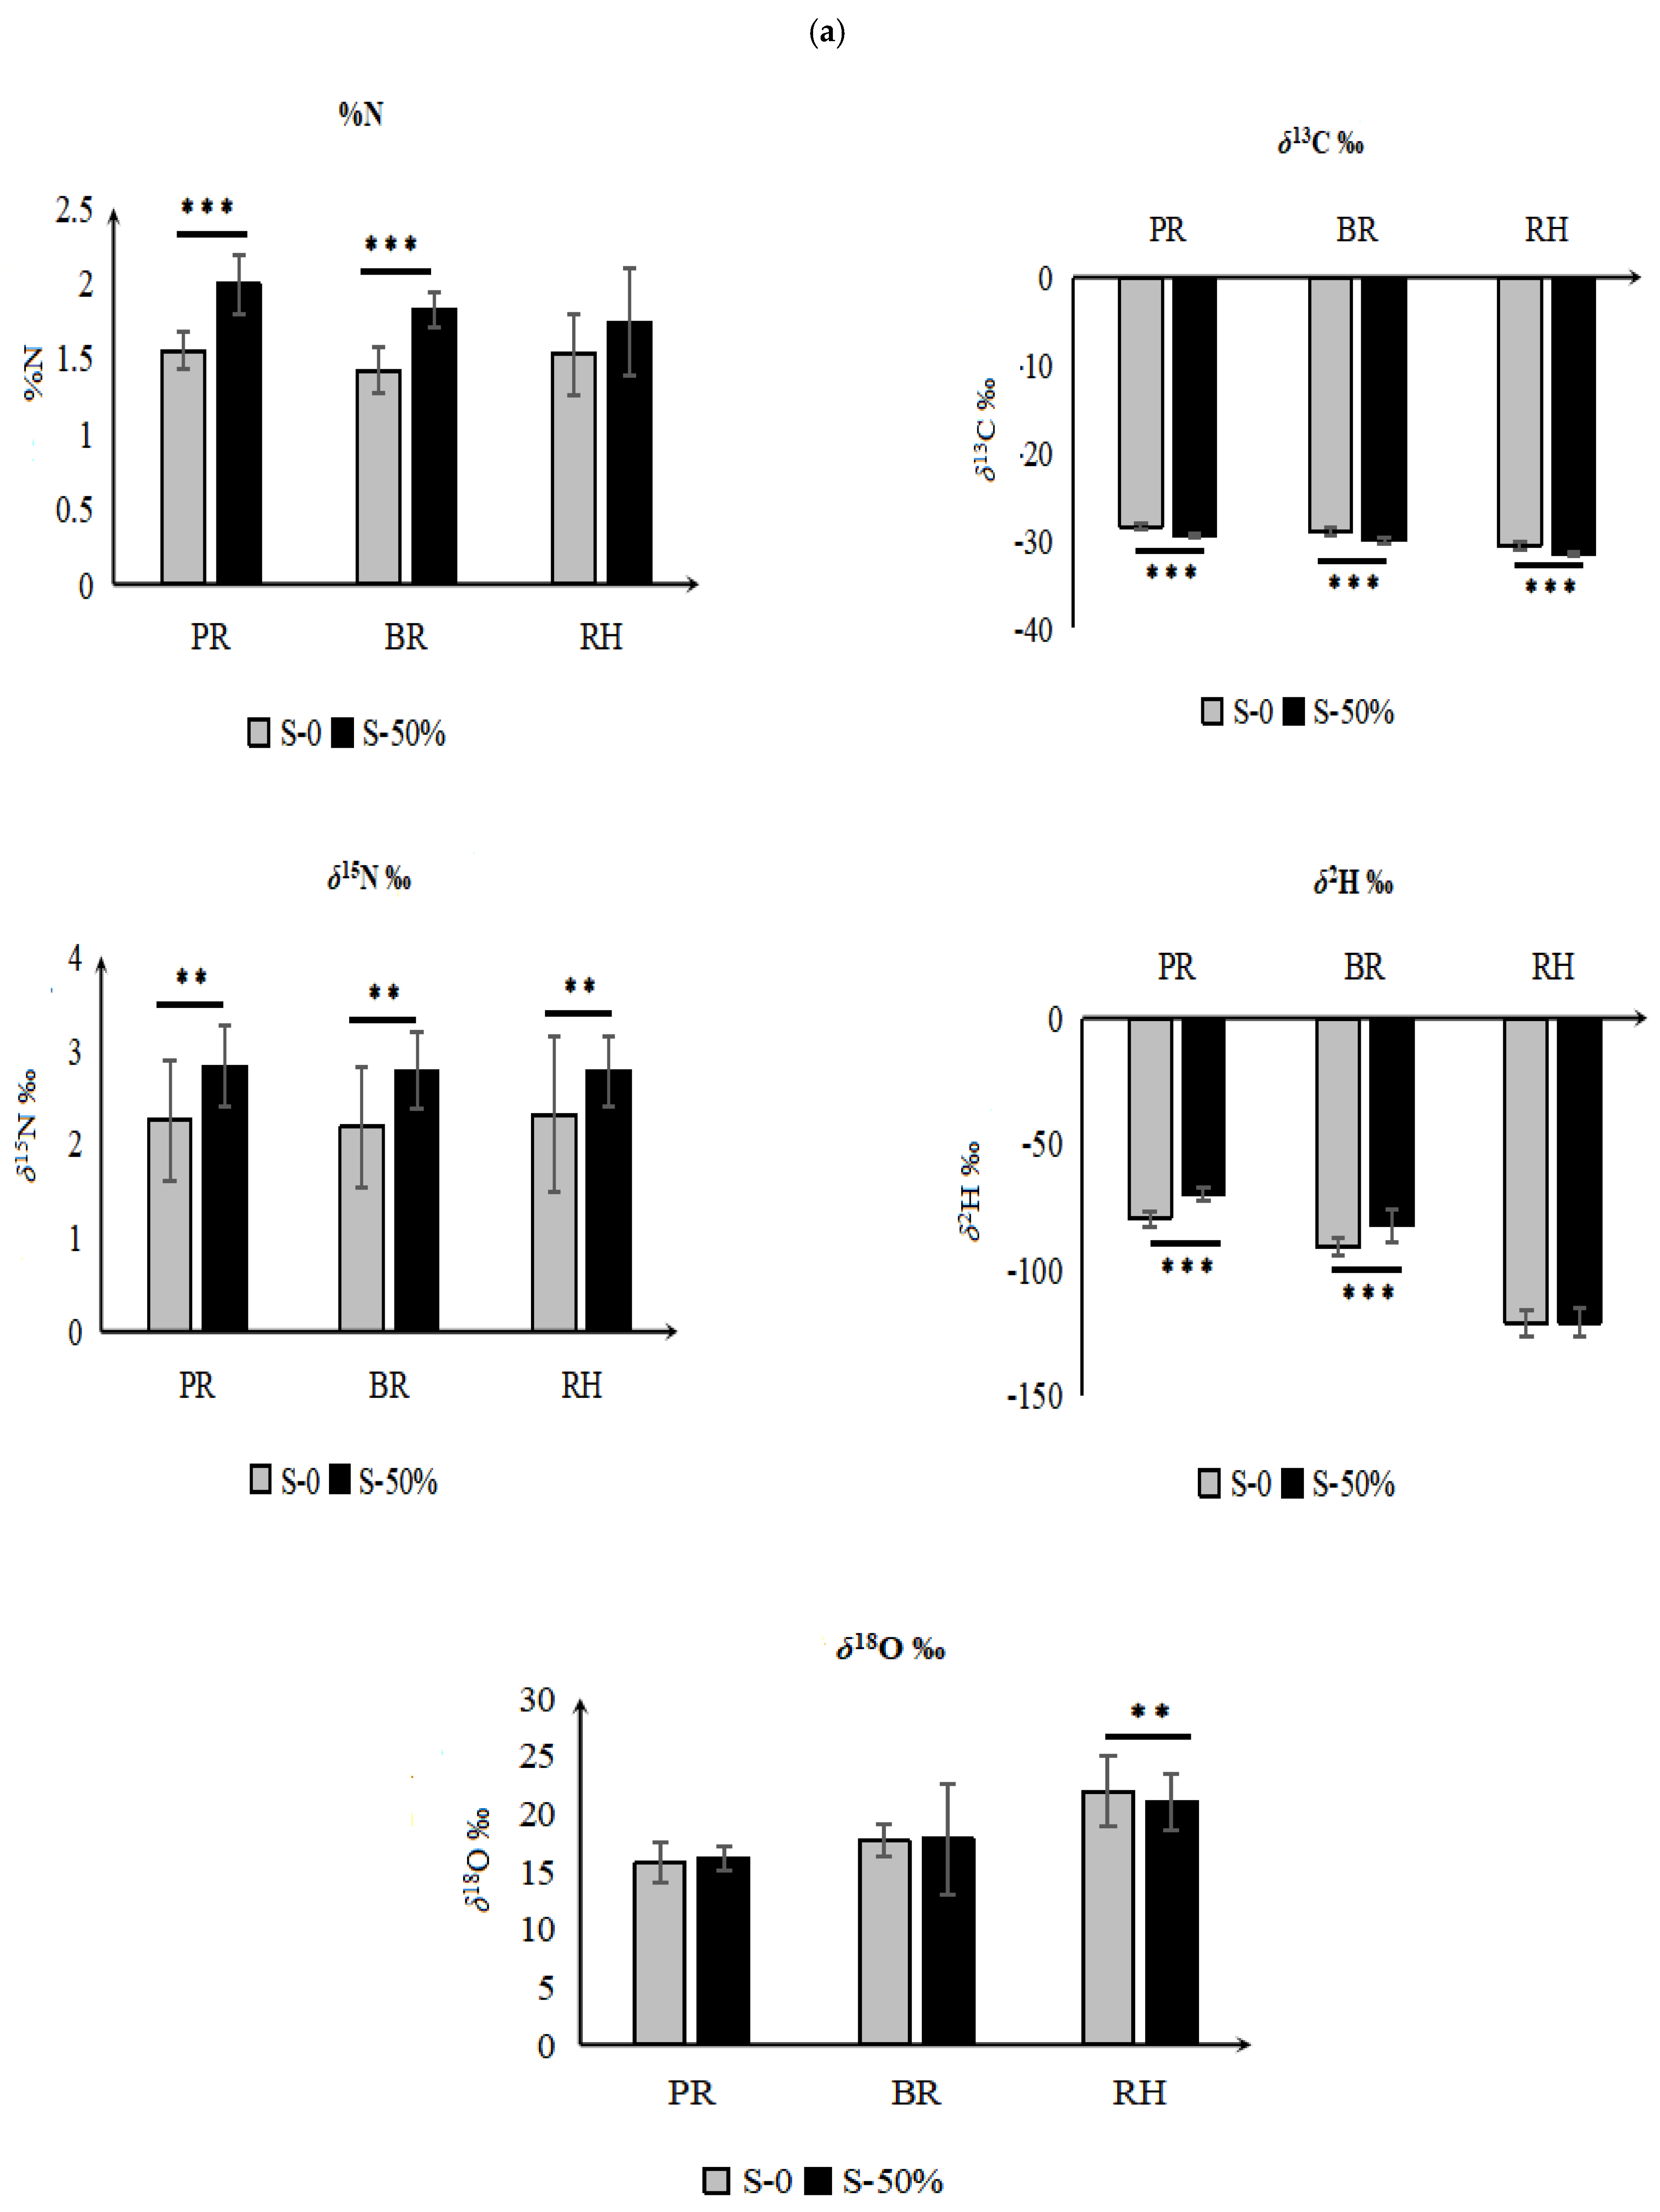
Different shading treatments including LS-0, LS-50, and LS-75 were applied and the effect was observed on the %N, %C, δ13C, δ15N, δ2H, and δ18O values of different rice fractions. The experiment was performed using two shading treatments (LS-0 and LS-50) for rice plants grown with fertilizer treatment N0 and N6, respectively (Figure 4a), and three shading treatments (LS-0, LS-50, and LS-75) for rice plants cultivated using N12 fertilizer treatment (Figure 4b). The shading effect on the %N, %C, δ13C, δ15N, δ2H, and δ18O values of rice grown under different fertilizer treatments followed the same pattern. The light shading treatment showed a significant effect on the %N, δ15N, δ13C, and δ2H values in different rice fractions. The values of %N were significantly lower at LS-0 than that of LS-50 and LS-75 in all three rice grain fractions. In the case of PR, the highest %N value was observed LS-75 (2.3 ± 0.2%) followed by LS-50 (2.0 ± 0.2%) and the lowest was observed in LS-0 (1.6 ± 0.1%), respectively. The δ15N values followed a unique pattern. It can be seen in Figure 4b that the δ15N signature among different rice fractions was significantly higher in LS-50 compared to LS-0 (non-shaded), but it decreased in LS-75. No significant difference was found in the δ15N values for LS-0 and LS-75. Further investigation is required to explore this mechanism since no literature was found that explained this phenomenon in rice. However, previous research has shown that the effect of maize kernel shading (40%) on %N at different stages showed a decrease in the %N content (up to 60%) compared to the control (ambient sunlight), which is not consistent with our study [27]. This crop difference suggests that plant physiological characteristics can impart significant crop variation for N uptake, retention, utilization, and isotopic fractionation.
The δ13C values among different rice fractions also showed significant variations for different shading treatments. The %C values of LS-0 in different rice fractions including PR (−28.3‰), BR (−28.8‰), and RH (−30.5‰) were significantly higher than those of LS-50 (29.5‰, −30.0‰, −31.6‰), and LS-75 (−29.7‰, −30.1‰, −31.5‰), respectively, indicating that at greater light intensity, the 13C isotopic fractionation is higher. In previous studies, a similar trend in δ13C values for citrus, grapefruit, and banana plants were reported under different shading treatments [10,28,29]. The δ13C values are positively correlated with irradiance and a similar trend of increasing δ13C values with increasing irradiance has been found in banana plants [28]. The δ13C values have been shown to be negatively correlated to internal CO2 concentration in plants during carbon uptake, so a decrease in δ13C values under shaded treatments indicates increased conductance during the time that the CO2 was fixed and/or a decreased photosynthetic rate [10]. Another study argued that lower δ13C values in shaded treatments clearly indicated that shading disrupted the photosynthate metabolism, reducing the photosynthate accumulation in grains [30].
The δ2H values also showed significant variations for PR and BR. In PR, the highest δ2H value (−65.3‰) was found in LS-75 followed by LS-50 (−69.3‰), and the lowest was observed in LS-0 (−77.0‰), respectively. The same trend was observed for BR and there were significant differences between LS 50/75 and LS-0. Soil water (from groundwater, irrigation water, or precipitation) is the main source of δ2H in plants, and the present results indicate that different light intensities affect the δ2H values of soil water, causing the δ2H signature of rice grains to vary through transpiration. No significant difference was observed for the δ18O values among the different rice fractions at different light intensities.

4. Conclusions

In this study, the effect of cultivar type, fertilizer supply, and light intensity on the distribution of elemental contents and light stable isotopes (C, N, H, and O) in different rice fractions were investigated. Significant variations were observed for δ13C, δ15N, δ2H, and δ18O values of different rice fractions among different cultivars. Fertilizer application rates showed a strong association with %N, δ15N, δ2H, and δ18O values, although there was no significant variation in the %C and δ13C values. The light intensity levels also showed a significant influence on isotopic contents among different rice fractions. The δ13C values showed a positive correlation with irradiance. The δ2H and δ15N values decreased with an increase in the irradiance. It is concluded that all factors mentioned above significantly influence isotopic values and should be considered when addressing the authenticity of rice. Furthermore, care should be taken when selecting the rice fraction for future studies as isotopic signatures vary considerably among different rice fractions. The findings from this study will have a significant impact on understanding different climatic trends (seasonal and annual) and fertilizer effects on rice and allow better understanding of isotopic variability for different geographical regions, farming practices, and environmental conditions.

Author Contributions

Y.Y. and W.Z. conceived the idea. S.A.W. and Y.J. drafted the manuscript, J.N., C.L. and Y.Z. analyzed data. K.M.R. and H.L. edited the manuscript. All authors have read and agreed to the published version of the manuscript.

Funding

This work was supported by Zhejiang Provincial Public Welfare Technology Research Program [Grant No. LGJ20C200003], the Self-design Project from State Key Laboratory for Managing Biotic and Chemical Threats to the Quality and Safety of Agro-products [Grant No. 2010DS700124-ZZ1803]; Crop Varietal Improvement and Insect Pests Control by Nuclear Radiation Project, China; IAEA Coordinated Research Project [Grant No. D52042]; and Special Fund of Discipline Construction for Traceability of Agricultural Product (2022-ZAAS).

Data Availability Statement

The data presented in this study are available on request from the corresponding author.

Acknowledgments

The authors gratefully acknowledge Weigui Zhang, from China National Rice Research Institute, for participating in this field-experimental design and execution, and providing information of materials and methods section.

Conflicts of Interest

The authors declare no conflict of interest.

References

  1. Wadood, S.A.; Nie, J.; Li, C.; Rogers, K.M.; Khan, A.; Khan, W.A.; Qamar, A.; Zhang, Y.; Yuwei, Y. Rice Authentication: An Overview of Different Analytical Techniques Combined with Multivariate Analysis. J. Food Compos. Anal. 2022, 112, 104677. [Google Scholar] [CrossRef]
  2. Maione, C.; Batista, B.L.; Campiglia, A.D.; Barbosa, F.; Barbosa, R.M. Classification of Geographic Origin of Rice by Data Mining and Inductively Coupled Plasma Mass Spectrometry. Comput. Electron. Agric. 2016, 121, 101–107. [Google Scholar] [CrossRef]
  3. Teye, E.; Amuah, C.L.Y.; McGrath, T.; Elliott, C. Innovative and Rapid Analysis for Rice Authenticity Using Hand-Held NIR Spectrometry and Chemometrics. Spectrochim. Acta Part A Mol. Biomol. Spectrosc. 2019, 217, 147–154. [Google Scholar] [CrossRef]
  4. Long, N.P.; Lim, D.K.; Mo, C.; Kim, G.; Kwon, S.W. Development and Assessment of a Lysophospholipid-Based Deep Learning Model to Discriminate Geographical Origins of White Rice. Sci. Rep. 2017, 7, 8552. [Google Scholar] [CrossRef] [PubMed]
  5. Park, J.R.; Yang, W.T.; Kwon, Y.S.; Kim, H.N.; Kim, K.M.; Kim, D.H. Assessment of the Genetic Diversity of Rice Germplasms Characterized by Black-Purple and Red Pericarp Color Using Simple Sequence Repeat Markers. Plants 2019, 8, 471. [Google Scholar] [CrossRef] [Green Version]
  6. Chung, I.M.; Kim, Y.J.; Moon, H.S.; Chi, H.Y.; Kim, S.H. Long-Term Isotopic Model Study for Ecofriendly Rice (Oryza sativa L.) Authentication: Updating a Case Study in South Korea. Food Chem. 2021, 362, 130215. [Google Scholar] [CrossRef]
  7. Li, C.; Nie, J.; Zhang, Y.; Shao, S.; Liu, Z.; Rogers, K.M.; Zhang, W.; Yuan, Y. Geographical Origin Modeling of Chinese Rice Using Stable Isotopes and Trace Elements. Food Control 2022, 138, 108997. [Google Scholar] [CrossRef]
  8. Wadood, S.A.; Guo, B.; Liu, H.; Wei, S.; Bao, X.; Wei, Y. Study on the Variation of Stable Isotopic Fingerprints of Wheat Kernel along with Milling Processing. Food Control 2018, 91, 427–433. [Google Scholar] [CrossRef]
  9. Akamatsu, F.; Okuda, M.; Fujii, T. Long-Term Responses to Climate Change of the Carbon and Oxygen Stable Isotopic Compositions and Gelatinization Temperature of Rice. Food Chem. 2020, 315, 126239. [Google Scholar] [CrossRef] [PubMed]
  10. Raveh, E.; Cohen, S.; Raz, T.; Yakir, D.; Grava, A.; Goldschmidt, E.E. Increased Growth of Young Citrus Trees under Reduced Radiation Load in a Semi-Arid Climate1. J. Exp. Bot. 2003, 54, 365–373. [Google Scholar] [CrossRef] [PubMed]
  11. Greer, D.H.; Weedon, M.M. Modelling Photosynthetic Responses to Temperature of Grapevine (Vitis vinifera Cv. Semillon) Leaves on Vines Grown in a Hot Climate. Plant. Cell Environ. 2012, 35, 1050–1064. [Google Scholar] [CrossRef] [PubMed]
  12. Xia, W.; Li, C.; Nie, J.; Shao, S.; Rogers, K.M.; Zhang, Y.; Li, Z.; Yuan, Y. Stable Isotope and Photosynthetic Response of Tea Grown under Different Temperature and Light Conditions. Food Chem. 2022, 368, 130771. [Google Scholar] [CrossRef] [PubMed]
  13. Rashmi, D.; Shree, P.; Singh, D.K. Stable Isotope Ratio Analysis in Determining the Geographical Traceability of Indian Wheat. Food Control 2017, 79, 169–176. [Google Scholar] [CrossRef]
  14. Xu, Y.; This, D.; Pausch, R.C.; Vonhof, W.M.; Coburn, J.R.; Comstock, J.P.; McCouch, S.R. Leaf-Level Water Use Efficiency Determined by Carbon Isotope Discrimination in Rice Seedlings: Genetic Variation Associated with Population Structure and QTL Mapping. Theor. Appl. Genet. 2009, 118, 1065–1081. [Google Scholar] [CrossRef] [PubMed]
  15. Chung, I.M.; Kim, J.K.; Prabakaran, M.; Yang, J.H.; Kim, S.H. Authenticity of Rice (Oryza sativa L.) Geographical Origin Based on Analysis of C, N, O and S Stable Isotope Ratios: A Preliminary Case Report in Korea, China and Philippine. J. Sci. Food Agric. 2016, 96, 2433–2439. [Google Scholar] [CrossRef]
  16. Gómez-Alonso, S.; García-Romero, E. Effect of Irrigation and Variety on Oxygen (Δ18O) and Carbon (Δ13C) Stable Isotope Composition of Grapes Cultivated in a Warm Climate. Aust. J. Grape Wine Res. 2010, 16, 283–289. [Google Scholar] [CrossRef]
  17. Yuan, Y.; Zhang, W.; Zhang, Y.; Liu, Z.; Shao, S.; Zhou, L.; Rogers, K.M. Differentiating Organically Farmed Rice from Conventional and Green Rice Harvested from an Experimental Field Trial Using Stable Isotopes and Multi-Element Chemometrics. J. Agric. Food Chem. 2018, 66, 2607–2615. [Google Scholar] [CrossRef]
  18. Wang, J.; Chen, T.; Zhang, W.; Zhao, Y.; Yang, S.; Chen, A. Tracing the Geographical Origin of Rice by Stable Isotopic Analyses Combined with Chemometrics. Food Chem. 2020, 313, 126093. [Google Scholar] [CrossRef]
  19. Li, C.; Wang, Q.; Shao, S.; Chen, Z.; Nie, J.; Liu, Z.; Rogers, K.M.; Yuan, Y. Stable Isotope Effects of Biogas Slurry Applied as an Organic Fertilizer to Rice, Straw, and Soil. J. Agric. Food Chem. 2021, 69, 8090–8097. [Google Scholar] [CrossRef] [PubMed]
  20. Fuertes-Mendizábal, T.; Estavillo, J.M.; Duñabeitia, M.K.; Huérfano, X.; Castellón, A.; González-Murua, C.; Aizpurua, A.; González-Moro, M.B. 15N Natural Abundance Evidences a Better Use of N Sources by Late Nitrogen Application in Bread Wheat. Front. Plant Sci. 2018, 9, 853. [Google Scholar] [CrossRef] [Green Version]
  21. Robinson, D. Δ15N as an Integrator of the Nitrogen Cycle. Trends Ecol. Evol. 2001, 16, 153–162. [Google Scholar] [CrossRef] [PubMed]
  22. Kalcsits, L.A.; Buschhaus, H.A.; Guy, R.D. Nitrogen Isotope Discrimination as an Integrated Measure of Nitrogen Fluxes, Assimilation and Allocation in Plants. Physiol. Plant. 2014, 151, 293–304. [Google Scholar] [CrossRef] [PubMed]
  23. Nehe, A.S.; Misra, S.; Murchie, E.H.; Chinnathambi, K.; Singh Tyagi, B.; Foulkes, M.J. Nitrogen Partitioning and Remobilization in Relation to Leaf Senescence, Grain Yield and Protein Concentration in Indian Wheat Cultivars. Field Crop. Res. 2020, 251, 107778. [Google Scholar] [CrossRef] [PubMed]
  24. Serret, M.; Ortiz-Monasterio, I.; Pardo, A.; Araus, J. The Effects of Urea Fertilisation and Genotype on Yield, Nitrogen Use Efficiency, δ 15 N and δ 13 C in Wheat. Ann. Appl. Biol. 2008, 153, 080617165316730. [Google Scholar] [CrossRef]
  25. Liu, H.T.; Gong, X.Y.; Schäufele, R.; Yang, F.; Hirl, R.T.; Schmidt, A.; Schnyder, H. Nitrogen Fertilization and δ 18 O of CO 2 Have No Effect on 18 O-Enrichment of Leaf Water and Cellulose in Cleistogenes Squarrosa (C 4)—Is VPD the Sole Control? Plant. Cell Environ. 2016, 39, 2701–2712. [Google Scholar] [CrossRef]
  26. Cernusak, L.A.; Barbour, M.M.; Arndt, S.K.; Cheesman, A.W.; English, N.B.; Feild, T.S.; Helliker, B.R.; Holloway-Phillips, M.M.; Holtum, J.A.M.; Kahmen, A.; et al. Stable Isotopes in Leaf Water of Terrestrial Plants. Plant. Cell Environ. 2016, 39, 1087–1102. [Google Scholar] [CrossRef] [Green Version]
  27. Gao, J. Effects of Different Light Conditions on Grain Yield and Physiological Characteristics of Summer Maize and Their Regulatory Mechanisation; Shandong Agricultural University: Taian, China, 2018. [Google Scholar]
  28. Israeli, Y.; Schwartz, A.; Plaut, Z.; Yakir, D. Effects of Light Regime on Delta13C, Photosynthesis and Yield of Field-Grown Banana (Musa sp., Musaceae). Plant Cell Environ. 1996, 19, 225–230. [Google Scholar] [CrossRef]
  29. Cohen, S.; Raveh, E.; Li, Y.; Grava, A.; Goldschmidt, E.E. Physiological Responses of Leaves, Tree Growth and Fruit Yield of Grapefruit Trees under Reflective Shade Screens. Sci. Hortic. 2005, 107, 25–35. [Google Scholar] [CrossRef]
  30. Gao, J.; Zhao, B.; Dong, S.; Liu, P.; Ren, B.; Zhang, J. Response of Summer Maize Photosynthate Accumulation and Distribution to Shading Stress Assessed by Using 13CO2 Stable Isotope Tracer in the Field. Front. Plant Sci. 2017, 8, 1821. [Google Scholar] [CrossRef] [Green Version]
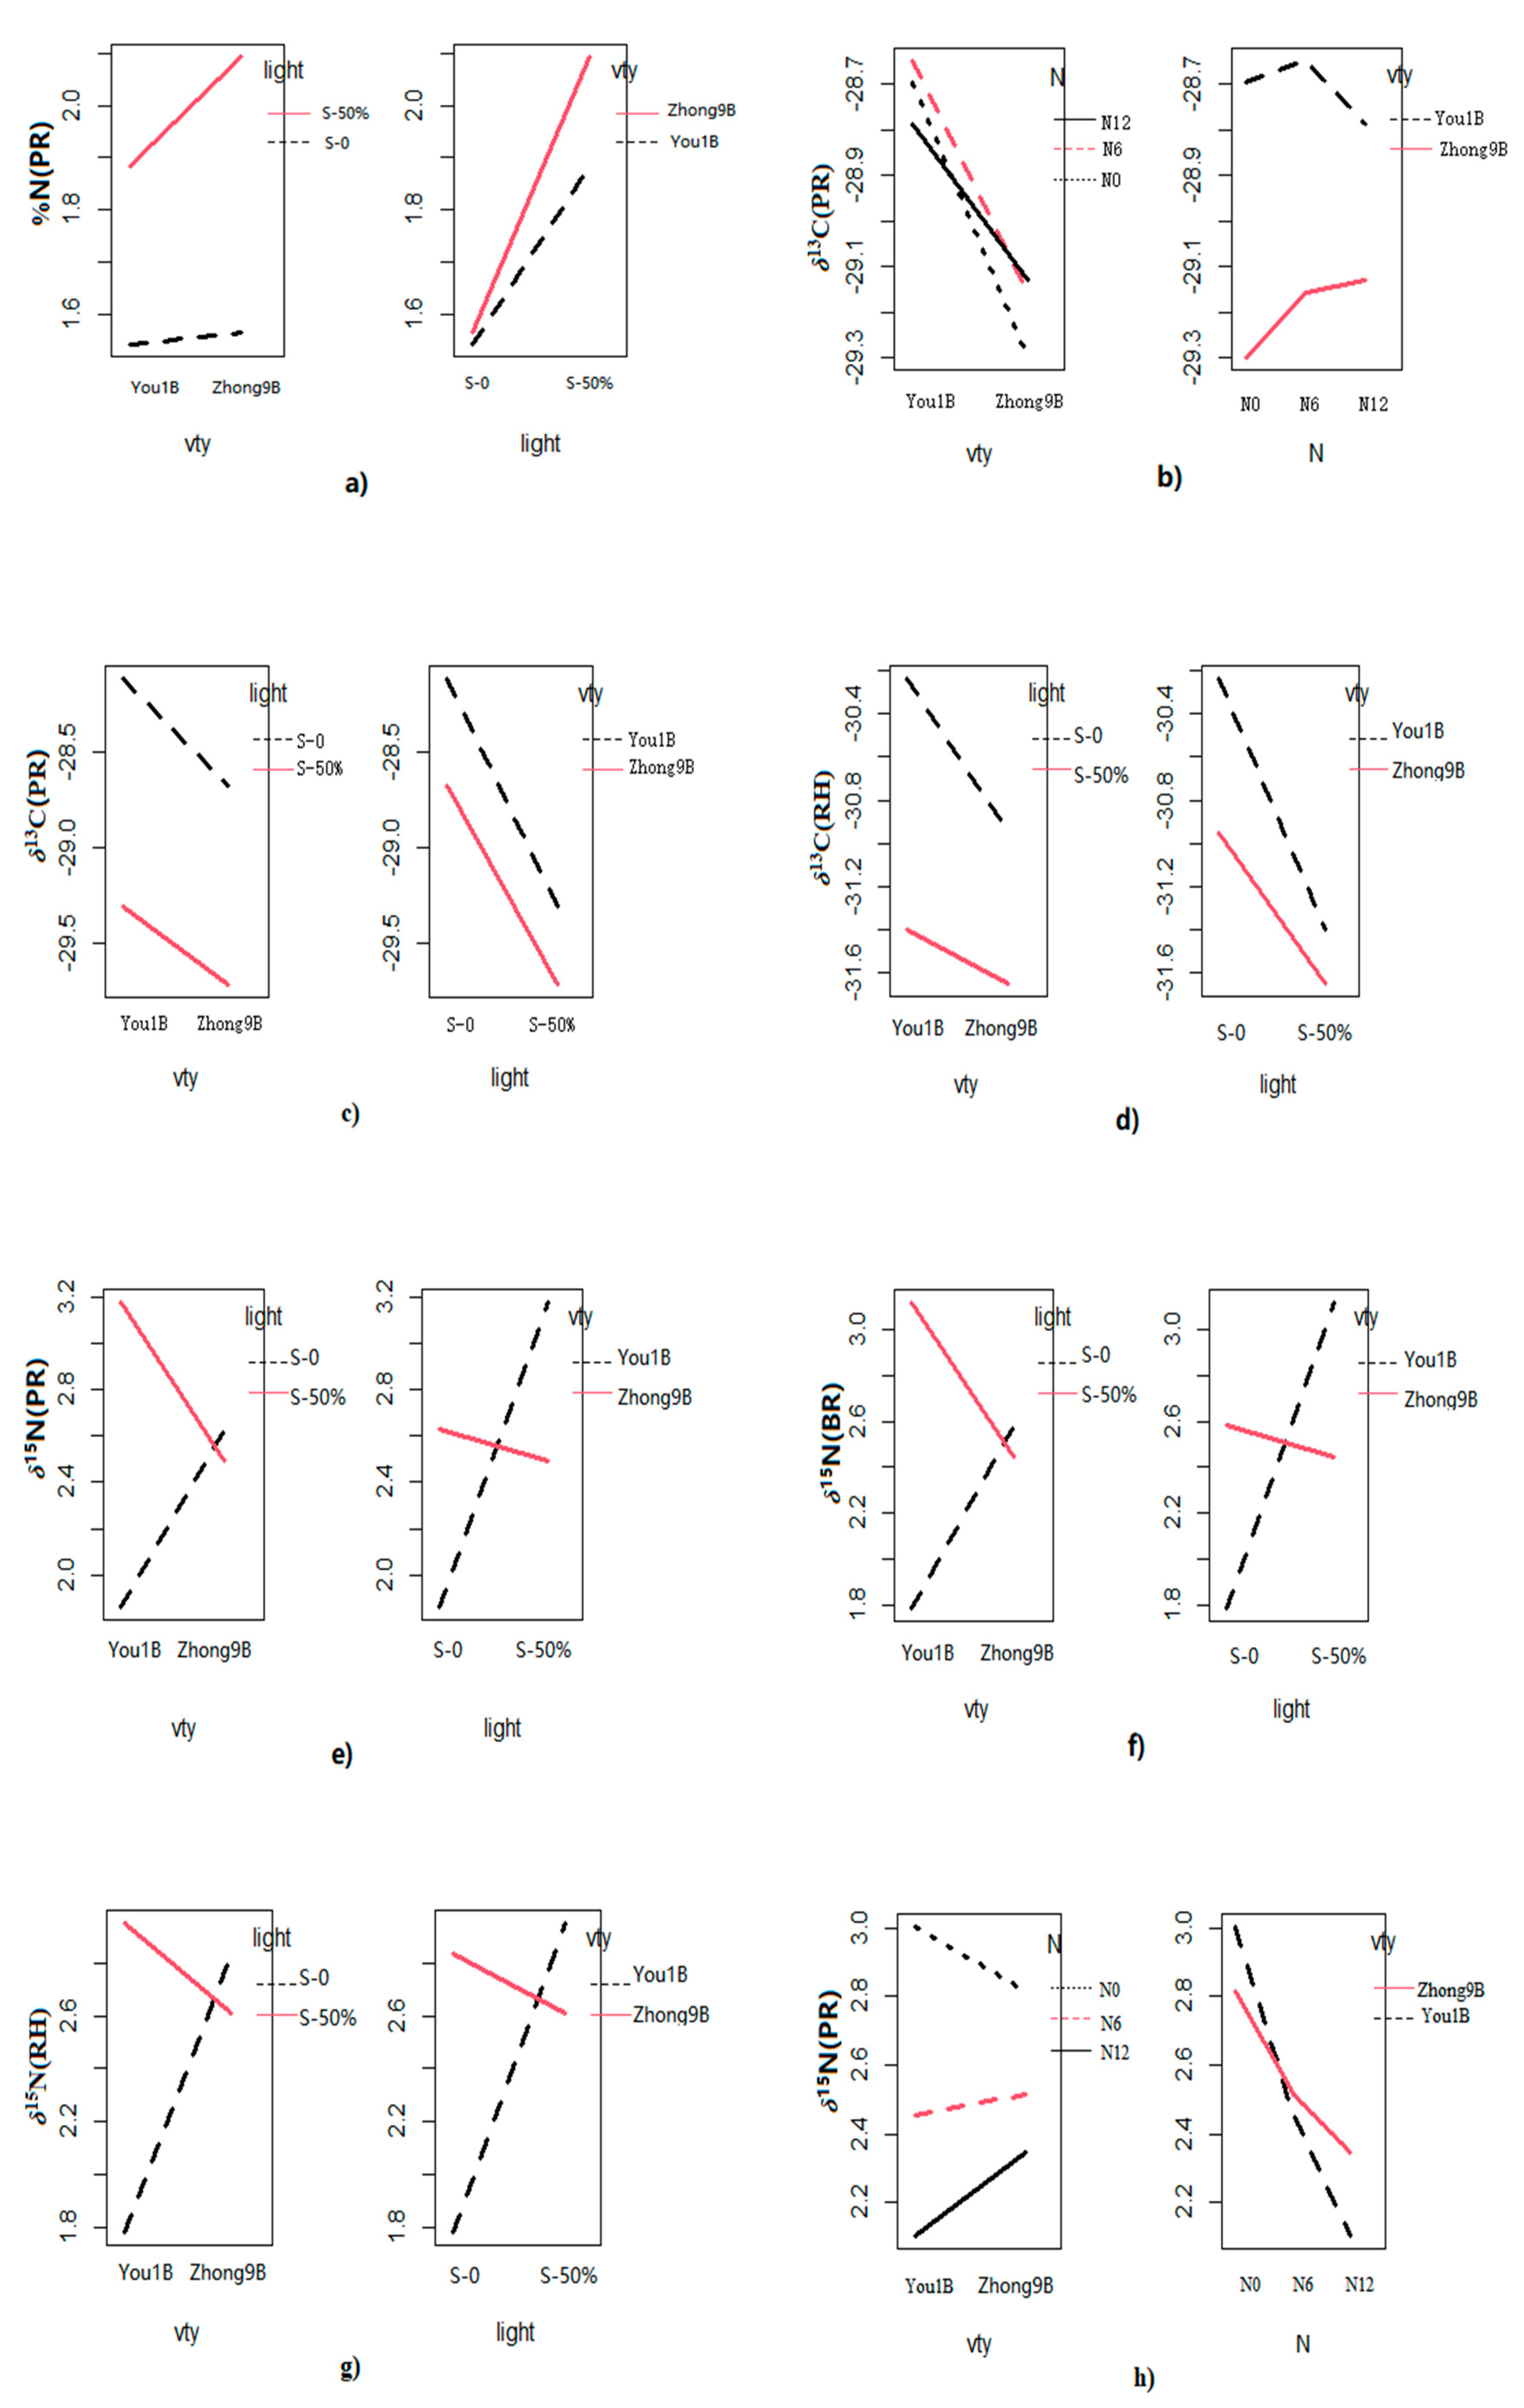
Figure 1. Interaction effects for the δ13C, δ15N, δ2H, and δ18O values among rice varieties (vty), fertilizer concentration (N), and light intensity of different rice fractions. (a) vty × light (PR, %N); (b) vty × N (PR, δ13C); (c) vty × light (PR, δ13C); (d) vty × light (RH, δ13C); (e) vty × light (PR, δ15N); (f) vty × light (BR, δ15N); (g) vty × light (RH, δ15N); (h) vty × N (PR, δ15N); (i) N × light (RH, δ15N); (j) vty × N (PR, δ2H); (k) vty × light (PR, δ2H); (l) vty × N (RH, δ18O); (m) vty × light (RH, δ18O).
Foods 12 01832 g001aFoods 12 01832 g001b
Figure 2. Variation of %N, δ13C, δ15N, δ2H, and δ18O values in the polished rice (PR), brown rice (BR), and rice husk (RH) between two rice varieties. *** Indicates high significance at p < 0.001, ** p < 0.01, and * p < 0.05 (Duncan’s test).
Foods 12 01832 g002aFoods 12 01832 g002b
Figure 3. The value of %N, δ15N, δ2H, and δ18O stable isotopes in rice husk (RH), polished (PR), and brown rice (BR) under different nitrogen fertilization levels. *** Indicates high significance at p < 0.001, ** p < 0.01, and * p < 0.05 (Duncan’s test).
Foods 12 01832 g003
Figure 4. The %N, δ13C, δ15N, δ2H, and δ18O values in rice husk (RH), polished (PR), and brown rice (BR) under (a) two different light shading levels and (b) three different light shading levels. *** Indicates high significance at p < 0.001, ** p < 0.01, and * p < 0.05 Duncan’s test).
Foods 12 01832 g004aFoods 12 01832 g004b
Table 1. A combined analysis of variance for different influencing factors on the stable carbon (δ13C), nitrogen (δ15N), oxygen (δ18O), and hydrogen (δ2H) values among different rice fractions.
Pr (>F)
Factor%C%Nδ13C (‰)δ15N (‰)δ2H (‰)δ18O (‰)
Polished RiceFertilizer (N)0.3000.1680.2410.007 **0.003 **0.903
Light shading (LS)0.6240.000 ***0.000 ***0.001 **0.000 ***0.408
Variety (vty)0.9600.011 *0.000 ***0.5410.2220.004 **
N × LS0.9450.5280.2910.0610.1900.893
Vty × N0.2890.0720.007 **0.043 *0.028 *0.367
Vty × LS 0.8890.033 *0.016 *0.000 ***0.030 *0.456
Brown RiceFertilizer (N)0.0610.007 **0.7750.014 *0.005 **0.848
Light shading (LS)0.2080.000 ***0.000 ***0.001 **0.000 ***0.920
Variety (vty)0.3980.3390.000 ***0.3380.029 *0.683
N × LS0.4320.6300.0870.0730.2730.954
Vty × N0.6620.3540.4390.5830.1870.287
Vty × LS0.8760.6020.2580.000 ***0.1140.403
Rice HuskFertilizer (N)0.3260.1650.3440.002 *0.9740.000 ***
Light shading (LS)0.0810.0530.000 ***0.002 **0.8290.008 **
Variety (vty)0.8330.000 ***0.000 ***0.004 **0.000 ***0.000 ***
N × LS0.2080.5810.1530.015 *0.5410.283
Vty × N0.4760.2170.2790.6950.2530.000 ***
Vty × LS0.5860.3630.025 *0.000 ***0.7080.000 ***
Note: *** Indicates highly significant at p < 0.001, ** p < 0.01, and * p < 0.05.
Disclaimer/Publisher’s Note: The statements, opinions and data contained in all publications are solely those of the individual author(s) and contributor(s) and not of MDPI and/or the editor(s). MDPI and/or the editor(s) disclaim responsibility for any injury to people or property resulting from any ideas, methods, instructions or products referred to in the content.