Article

Study on Quality Change and Processing Suitability Evaluation of the Low-Temperature Vacuum Frying of Bananas

1
Guangxi Key Laboratory of Fruits and Vegetables Storage-Processing Technology, Guangxi Academy of Agricultural Sciences, Nanning 530007, China
2
Guangxi South Subtropical Agricultural Science Research Institute, Guangxi Academy of Agricultural Sciences, Longzhou 532415, China
3
Agro-Food Science and Technology Research Institute, Guangxi Academy of Agricultural Sciences, Nanning 530007, China
*
Authors to whom correspondence should be addressed.
Foods 2023, 12(9), 1822; https://doi.org/10.3390/foods12091822
Submission received: 29 March 2023 / Revised: 20 April 2023 / Accepted: 26 April 2023 / Published: 27 April 2023
(This article belongs to the Section Food Engineering and Technology)

Abstract

:
The banana quality evaluation system is not sufficiently mature in China and cannot meet the demand of producing high-quality processed banana products. In order to screen banana varieties suitable for low-temperature vacuum frying and extend the banana deep processing industry chain, banana slices from 15 varieties planted in China were prepared by low-temperature vacuum-frying (VF) technology in the present study. After factor analysis on 20 indicators of sensory, flavor, nutritional and processing quality from different varieties of banana slices, comprehensive quality evaluation models were constructed for banana slices. It was concluded that Meishijiao No. 1 had the highest overall score among the 15 banana varieties; hence, it was deemed suitable for processing. Meanwhile, in order to investigate the difference between flavor substances in banana slices before and after processing, a flavor histology study was conducted with solid-phase microextraction (SPME) and comprehensive two-dimensional gas chromatography coupled to time-of flight mass spectrometry (GC×GC-TOFMS). It was found that the content differences of 2,3-pentanedione, hexanal and pentanal may cause the weakened fruitiness and the increased oil flavor of banana taste.

1. Introduction

Banana is one of the main crops in the tropical and subtropical regions [1]. Currently, more than 90% of bananas are eaten as fresh fruits. The average processing ratio of bananas is less than 5%, and the decay ratio is 25% [2]. Therefore, improving its processing ratio would be a critical means to developing the banana industry. Banana slices have been one of most popular processed foods worldwide because of their crispy taste, convenient transport and long storage period. Banana slices in the market are mainly from the Philippines, Vietnam and Thailand, and these banana slices are usually processed by high-temperature frying technology [3,4]. Banana slices processed by low-temperature vacuum frying (VF) technology can retain their original color, flavor and taste of fresh banana, and also have high nutritional and health value, by virtue of their low oil content, low acrylamide content, high anthocyanin content and high total carotenoids content [5,6,7]. However, there are only a few articles on vacuum-fried banana slice technology, and the research shows that the frying temperatures were above 100 °C [3,8]. The selection of suitable processing varieties for banana slices was also basically not involved. The above problems of banana slices have limited the development of the whole banana processing industry [2].
The quality of fruit slices is directly influenced by the variety of raw materials, maturity and processing technology [8,9]. Therefore, banana slices with unfavorable flavor quality are frequently found in the market. According to various research purposes, researchers have selected different indicators to evaluate the quality of banana slices. Thus far, the majority of studies have been conducted to establish evaluation models for banana drying [10,11]; for instance, mathematical models on the variation in the density and shrinkage of bananas during drying have been proposed [12]. Additionally, the effects of drying temperature, maturity and harvest time on the drying kinetics of banana products were also examined [13]. However, there are few studies that have comprehensively evaluate the quality of banana slices to select suitable varieties for banana slice processing.
The flavor of a banana slice is an indicator for evaluating the quality of banana slices. Generally, during the frying process of food, the formation mechanism and types of volatile metabolites are very complex and are related to the decomposition and interaction of substances inside the food, as well as the frying medium [14]. Bananas can release numerous aromatic components during ripening and greatly change in flavor after processing. It has been reported that different banana varieties have different aroma components, and these aroma components could be significantly changed during the postripening stage of fresh bananas [15,16,17]. Additionally, butyl acetate, butyl butyrate, hexyl acetate and amyl butyrate were identified as the main aroma components for the distinctive “fresh banana fruity” flavor, and these characteristic aroma components could be greatly changed by different processing methods [18]. In one study, 16 volatile components in banana slices dried by air-drying and vacuum microwave-drying methods were reduced and compared with those in fresh banana [19]. The changes in volatile components during the banana ripening and drying processes were analyzed in these studies. However, there are few reports on the change of aromatic components in banana slices induced by low-temperature vacuum frying.
Therefore, the objective of this study was to comprehensively screen suitable banana varieties for slice processing through building a quality evaluation model, as well as to identify flavor components of banana slices after low-temperature vacuum frying using the SPME and GC×GC-TOFMS method. The research findings can offer useful references in the development of the banana processing industry.

2. Materials and Methods

2.1. Materials

The sample information regarding the names and origins of the banana varieties are listed in Table 1. The fresh banana samples were free from diseases, insects and mechanical damage, and were soaked in ethephon solution for 3 min at a volume ratio of 400:1 (w/v), drained and ripened at 20 °C to the ripening stage 5 (the skin color of the bananas was yellow with a trace of green) [20].

2.2. Chemicals and Reagents

Chromatographic 2-octanol was obtained from Shanghai Yuanye Biotechnology Co., Ltd. (Shanghai, China), and 4,7-diphenyl-1,10-phenanthroline was obtained from Shanghai Yuanye Biotechnology Co., Ltd. (Shanghai, China). Folin phenol and a starch content detection kit were obtained from Beijing Solebar Technology Co., Ltd. (Beijing, China). Carbazole was obtained from Shanghai Maclean Biochemical Technology Co., Ltd. (Shanghai, China). Potassium hydrogen phthalate, trichloroacetic acid, phosphoric acid, ethanol, ferric chloride, ascorbic acid, sodium carbonate, gallic acid, phenol, concentrated sulfuric acid, sucrose, potassium sulfate, copper sulfate pentahydrate, boric acid, hydrochloric acid and galacturonic acid were obtained from Chengdu Kelong Chemical Co., Ltd. (Chengdu, China). All reagents were analytical reagents.

2.3. Sample Preparation

2.3.1. Preparation of Fresh Banana Samples

Bananas at ripening stage 5 were washed, peeled and then cut into small pieces. Fresh banana pieces were put into liquid nitrogen for quick freezing, crushed into fresh banana powder at high speed, and then lyophilized (Pilot10-15 M, Biocool, Beijing, China) for 48 h to obtain dried fresh banana powder. The powder was stored at −20 °C.

2.3.2. Preparation of Banana Slices by Low-Temperature Vacuum Frying

Bananas at the ripening stage 5 were washed, peeled, sliced (the thickness was 4 mm) and subjected to color protection with hardening for 5 min. Banana slices were obtained by low-temperature vacuum frying with a vacuum fryer (ZK-500, Xuzhong Machinery, Guangzhou, China). The vacuum degree was 0 MPa, and the frying temperature was 85 °C. The frying time and the centrifuge time were 50 min and 7 min, respectively. The banana slices were crushed in a high-speed mill (WND-500, Fei Libo, Shanghai, China), sieved by a 60-mesh sieve and vacuum-packed and frozen at −20 °C. All banana samples were processed in the same way. However, the samples for the determination of sensory quality index were banana slices, and they were not crushed.

2.4. Determination of the Sensory Quality Index

The color was measured with a spectrophotometer (CM-3600A, Konica minolta, Tokyo, Japan), and the results showed L*, a* and b* values, with L* representing lightness (L* = 0 denotes black, and L* = 100 denotes white), a* representing red (+) or green (−), and b* representing yellow (+) or blue (−). The L*, a* and b* parameters were can be read directly from the device [21]. Hardness and brittleness were measured with a texture tester (CT3, Brookfield, Middleboro, MA, USA), and the parameters are shown in Table 2 [22,23].

2.5. Determination of the Flavor Quality Index

Total soluble solid (TSS) was determined with a refractometer (PAL-1, Atago, Guangzhou, China) [24]. Soluble sugar (SS) content was determined via the phenol-sulfuric acid method, and titratable acid (TA) content was determined via acid–base indicator titration [25,26]. The contents were all demonstrated as %. The sugar–acid ratio was calculated as the ratio of the soluble sugar content to the titratable acid content for each sample.

2.6. Determination of the Nutritional Quality Index

Protein content was determined using the Kjeldahl method, and a digestion furnace (KDN-08C, Tuopuyunnong, Hangzhou, China) and Kjeldahl azotometer (KDN, Tuopu, Hangzhou, China) were used, with the results presented as % [27]. Starch content was determined using visible spectrophotometry (BioTek, Winooski, VT, USA) with a Solarbio starch content detection kit (Solarbio, Beijing, China), and the testing method was carried out according to the instructions of this kit. The content is expressed as mg/g. The crude fiber content was washed and dried with fiber tester (F800, Haineng, Dezhou, China) and a box resistance furnace (SX2-8-10A, Jiecheng, Shanghai, China) according to a previously described method [28], with the results presented as %. Pectin content was determined using the spectrometric detection method with a microplate reader (BioTek, Winooski, VT, USA) [29], with the content express as g/kg. Fat content was determined using the soxhlet extraction method [9,30], with the content expressed as %. Total phenolic content was determined with folin–phenol colorimetry [31], with the content expressed as mg/g. Vitamin C (Vc) content was determined using spectrophotometry (BioTek, Winooski, VT, USA) according to a previously described method [29], with the content expressed as mg/100 g.

2.7. Determination of the Processing Quality Index

The degree of expansion was the ratio of banana slice thickness after frying to that before frying, with 10 replicates for each banana sample. The output ratio was the ratio of the quality of banana slices after frying to that before frying (after slicing and before pretreatment). The calculation method of rehydration was the ratio of the weight of banana slices after (they were drained for 5 min after soaking for 30 min) to before soaking. Moisture content was determined with a halogen moisture meter (XFSFY-50A, Xiongfa, Xiamen, China).

2.8. Determination of Differential Flavor Substances in Bananas before and after Low-Temperature Vacuum Frying

The SPME—GC×GC-TOFMS method was used to determine flavor substances in the banana [32,33,34]. A 1 g sample was put into a 20 mL headspace bottle. Then, 10 μL of 40 μg/mL 2-octanol was added into the bottle as an internal standard, placed at 60 °C for 10 min and then extracted for 40 min. The 2 cm DVB/CAR/PDMS extraction fiber (Supelco, Bellefonte, PA, USA) was inserted into the headspace of the bottle to adsorb for 5 min.
GC×GC-TOFMS was performed using a comprehensive two-dimensional gas chromatography (7890A, Agilent, Santa Clara, CA, USA) coupled to a time-of-flight mass spectrometer (Pegasus 4D, LECO, St. Joseph, MI, USA) with a TG-WAXMS column (30 m × 250 μm × 0.25 μm, Agilent, Santa Clara, CA, USA) and a DB-17MS column (2 m × 100 μm × 0.10 μm, Agilent, Santa Clara, CA, USA) used as the second column. Helium (purity > 99.9999%) was used as the carrier gas at a flow rate of 1.0 mL/min, and the injector split ratio of the split/splitless injector was set to 1:5. The injection temperature was 250 °C. The initial oven temperature was 40 °C, and this temperature was held for 5 min, then raised to 70 °C at 2 °C/min, raised to 250 °C at 8 °C/min and then held for 7.5 min. The second oven was always 15 °C hotter than the first oven. The modulation period was 4.0 s, and a modulator temperature offset of 15 °C above the second oven was applied. The injector port was heated to 270 °C, and the ion source was maintained at 230 °C. The mass range was 20–450 m/z, and ionization energy was 70 eV. The voltage for the detector was 1680 V. The acquisition rate was 50 spectra/s. Mass spectra were probability matched to the NIST (National Institute of Standards and Technology) 2014 Mass Spectral Library (Gaithersburg, Maryland, MD, USA).

2.9. Statistical Analysis

The factor analysis method was used to analyze the quality indexes of banana slices. All the experiment were repeated at least three times, and the results are expressed as means with standard deviations. SPSS (IBM Co. Chicago, IL, USA, version 25.0) software and R (Lucent Technologies, Paris, France, version 3.3.2) software were used for data analysis.

3. Results and discussion

3.1. Analysis on the Comprehensive Quality of Banana Slices

3.1.1. Analysis on Sensory Quality of Banana Slices

The evaluation of the sensory quality of the banana slices is shown in Table 3. Only the coefficient of variation of the L* value was less than 10%, indicating that there was little difference in the brightness index of color among the different banana slices. The coefficients of variation of the other four sensory quality indicators were all over 20%, indicating that there was large difference in these data among the different varieties of banana slices. Crispness had the highest coefficient of variation, followed by hardness and color a* and b*. These four indexes had great influence on the sensory quality of banana slices and were representative of the sensory evaluation of banana slices. The indicators that had significant impact on quality were selected for subsequent analysis. Therefore, hardness, brittleness, and the color a* and b* were selected for the subsequent development and analysis of a quality evaluation model.

3.1.2. Analysis of the Flavor Quality of Banana Slices

The horizontal analysis of the flavor quality of the banana slices is shown in Table 4. The coefficients of variation for SS content, TA content and sugar–acid ratios were all greater than 10%, while that of TSS content was not. These indicators had a deeper impact on flavor quality because they had a significant degree of data dispersion. The sugar–acid ratio was positively and negatively correlated with SS content and TA content, respectively. Generally, fruit flavor was closely related to its sugar and acid levels. Therefore, the sugar–acid ratio was chosen for the subsequent analysis.

3.1.3. Analysis on the Nutritional Quality of Banana Slices

The horizontal analysis of the nutritional quality of the banana slices is shown in Table 5. The coefficients of variation of nutritional indicators other than fat content were greater than 10%, indicating that these data were highly dispersed. Of these, starch content had the largest coefficient of variation, followed by crude fiber, phenolics, pectin, protein and Vc contents. This indicated that variability of varietal and origin had a considerable influence on the nutritional quality in banana slices. Therefore, these indicators were selected for the subsequent analysis.

3.1.4. Analysis on Processing the Quality of Banana Slices

As shown in Table 6, the horizontal analysis of banana slice processing quality indicators showed that the coefficient of variation of the rehydration ratio was the smallest among them. The degree of expansion and moisture content were all above 10%, with a high degree of data dispersion, and the moisture content changed most significantly among all indicators. This indicated that there were major differences in the processing indicators of different banana slices. Therefore, the degree of expansion, output ratio and moisture were selected for the development and analysis of a quality evaluation model.

3.2. Screening of Core the Indexes of Banana Slices

The complexity of the indicators of banana slices makes analysis difficult. Factor analysis was applied to obtain a few common factors, to explain the variables from the multiple indicators of banana slices in this paper and finally to achieve the idea of dimensionality reduction. Factor analysis was carried out on 14 selected banana slices indicators using SPSS software. The results were shown in Table 7. The analysis revealed that there were 5 common factors with eigenvalues greater than 1; the cumulative percent of variance was 84.322%, and they could reflect most of the indicators well. The correlation analysis of the different banana slice quality indicators is shown in Table 8. The percent of variance for common factor 1 was 26.827%, with a focus on brittleness, hardness, degree of expansion, protein, starch and output ratio information in order of factor loadings. Hardness, degree of expansion, protein and brittleness were highly significantly correlated (R values, 0.873 **, 0.800 **, −0.658 **). Starch was significantly related to brittleness (R = 0.584 *), and brittleness had the highest factor loadings among them, while the output ratio was important in practical production. Therefore, the brittleness and output ratio were determined to be the representative indicators for the common factor 1.
The percent of variance for common factor 2 was 18.748%. It gathered information on pectin and b* and a* values indicating color, output ratio, and polyphenols. Polyphenols were significantly correlated with the output ratio (R = −0.547 *), overlapping with common factor 1. The a* value was significantly correlated with b* values (R = 0.524 *), and the b* value had the largest factor loadings. The b* value has practical significance because it can indicate the degree of blue–yellow in banana slices. Therefore, b* values and pectin were chosen as the representative indicators for common factor 2.
In common factor 3, the percent of variance was 14.015% and mainly included information on sugar–acid ratio and starch content. The contribution of the sugar–acid ratio was much greater than that of starch, which overlapped with the information on factor 1. Therefore, the sugar–acid ratio was chosen as a representative indicator for the common factor 3.
The percent of variance for common factor 4 was 13.232% and was mainly related to Vc and crude fiber contents. Despite the component information Vc factor loadings reaching as high as 0.929, the Vc to output ratio was highly significantly correlated (R = −0.691 **), and the output ratio indicator in the common factor 1 was duplicated. Therefore, crude fiber content was the representative indicator for common factor 4.
The percent of variance for common factor 5 was 11.500% and consisted mainly of moisture information with factor loadings up to 0.922. Therefore, moisture was a representative indicator of common factor 5. In summary, b* value, brittleness, sugar–acid ratio, crude fiber, pectin, output ratio and moisture were finally selected as the core indicators for the comprehensive quality evaluation of banana slices, which basically cover the sensory, flavor, nutrition and processing quality of banana slices.

3.3. Development of a Comprehensive Quality Evaluation Model for Banana Slices

With the sensory, flavor, nutritional and processing quality index matrix of banana slices taken as variables, the eigenvalues of common factor, percent of variance and factor loadings of each variable in the corresponding common factor were obtained using factor analysis. Based on the research methods of Jing et al. [35], the weight value of each index was obtained with Formula 1, and then the seven core indicators for evaluating banana slices were normalized to obtain their corresponding weight values, as listed in Table 9. Therefore, the evaluation model of comprehensive quality was as follows: Fcomprehensive score = b* value × 0.1742 + brittleness × 0.2201 + sugar-acid ratio × 0.2724 + crude fiber × 0.2093 − pectin × 0.1668 + output ratio×0.1220 + moisture × 0.1689.
Q n = j = 1 m Z j n λ j × E j
where: Qn is the weight value of each index calculated by factor analysis, Zjn is the factor loadings of the j-th common factor of the nth index, λj is the eigenvalue of the j-th common factor, Ej is the ratio of the percent of variance to the cumulative percent of variance for the jth common factor, and m is the number of common factors with eigenvalues greater than 1, with a fixed value 5.
To avoid the impact of the different measurement units and data scales for the core indexes of banana slices, the above indexes were converted for data normalization. Among them, the brittleness and moisture of banana slices were negative indicators, with a lower value indicating the better quality of banana slices. The other indexes were positive indicators because a greater proportion of them had better quality. The data of each index were converted according to Formulas (2) and (3). The standardized data of the core indicators of banana slices are shown in Table 10.
negative   indicator = m a x F x y F x y m a x F x y m i n F x y
positive   indicator = F x y m i n F x y m a x F x y m i n F x y
where Fxy is the original measured value of the y-th index for the x-th banana slices.
The standardized data on the core indexes were substituted into the evaluation model of comprehensive quality to obtain comprehensive scores of all banana slices. Qualitative analysis was then carried out by means of systematic cluster analysis. The suitability of banana slices for processing was divided into five categories, as detailed in Table 11: class I (very suitable), class II (more suitable), class III (basically suitable), class IV (less suitable) and class V (very unsuitable). Table 11 shows that the quality of banana slices varied considerably between varieties, with the range of variation being 0.2966–0.7550. Among them, Meishijiao No. 1 had the highest overall score and ranked first, followed by Guijiao No. 6 and Guijiao No. 2, which were very suitable for processing banana slices. Therefore, Meishijiao No. 1 was used for the following analysis of differential flavor substances.
A variety of domestically grown bananas were selected, dimensionality reduction analysis was performed on 14 quality indicators through factor analysis, 7 core indicators were obtained, and these covered the quality of banana slices such as color and taste. These indicators can comprehensively reflect the comprehensive quality of slices and can predict the processing suitability of unknown banana varieties. Thus far, little research has been conducted on the suitability of banana processing; rather, experts from China and other countries have conducted suitability studies on other crops, such as pear [36], peach [37], citrus [38], sweet pepper [39], apple and [40] potato [41]. The quality of different fruits and vegetables was analyzed in these studies, and only those varieties mentioned in these texts were comprehensively evaluated, but not the unknown samples.

3.4. Qualitative Analysis of Differential Flavor Substances in Banana before and after Low-Temperature Vacuum Frying

The formation of banana aroma substances is closely related to its variety, cultivation environment, maturity and storage method [16,42,43]. There was a great difference in volatile components of bananas before and after maturity. The aroma and taste of bananas before and after low-temperature vacuum frying were also different, with the banana fruit flavor decreasing and fat flavor increasing. To determine the key substances causing this difference, 79 different flavor substances were found through chromatographic analysis, as shown in Table 12, including 29 aldehydes, 15 ketones, 12 alcohols, 7 esters, 4 acids, 3 furans, 2 ethers and 1 phenol. Aldehydes and alcohols are the main volatile substances in the banana growing stage, while esters and alcohols are the main aroma components [15,44].

3.5. OPLS-DA of Differential Flavor Substances in Banana

Orthogonal projections to latent structures discriminant analysis (OPLS-DA) was carried out based on the obtained data to reveal the distribution of the samples, the score of which plots are shown in Figure 1. The first principal component (PC1) and the second principal component (PC2) accounted for 76.1% and 9.8% of the variance, respectively, explaining 85.9% of the variance. The samples were clearly separated in the OPLS-DA score plots. The score of the VF group was in the negative area of PC1, while the score of the fresh fruit (XG) group before VF was in the positive area of PC1. This showed that there was a significant difference in the distribution of banana flavor substances before and after VF. The results showed that the changes of metabolic pathway of banana after VF resulted in the difference of volatile metabolites.
In OPLS-DA, the R2X was 0.929, the R2Y was 0.999, and the Q2 was 0.932. The predictability of the model and the interpretability of independent variable and dependent variable were higher than 0.900. This indicated that the model was stable and the data were reliable. OPLS-DA could reduce the complexity and improve the interpretation ability of the model, and it maximized the differences between data groups. However, it could lead to the overfitting problem of the OPLS-DA model. Therefore, the data needed to be replaced to evaluate the current model fitting phenomenon, with the specific replacement inspection diagram being seen in Figure 2, where the R2 intercept value is (0.0, 0.91) and Q2 intercept value is (0.0, 0.25). All the blue points on the left are lower than the original blue points on the far right of Q2, indicating that OPLS-DA model had no overfitting and was an effective model, which could be used to screen different flavor substances in this study.

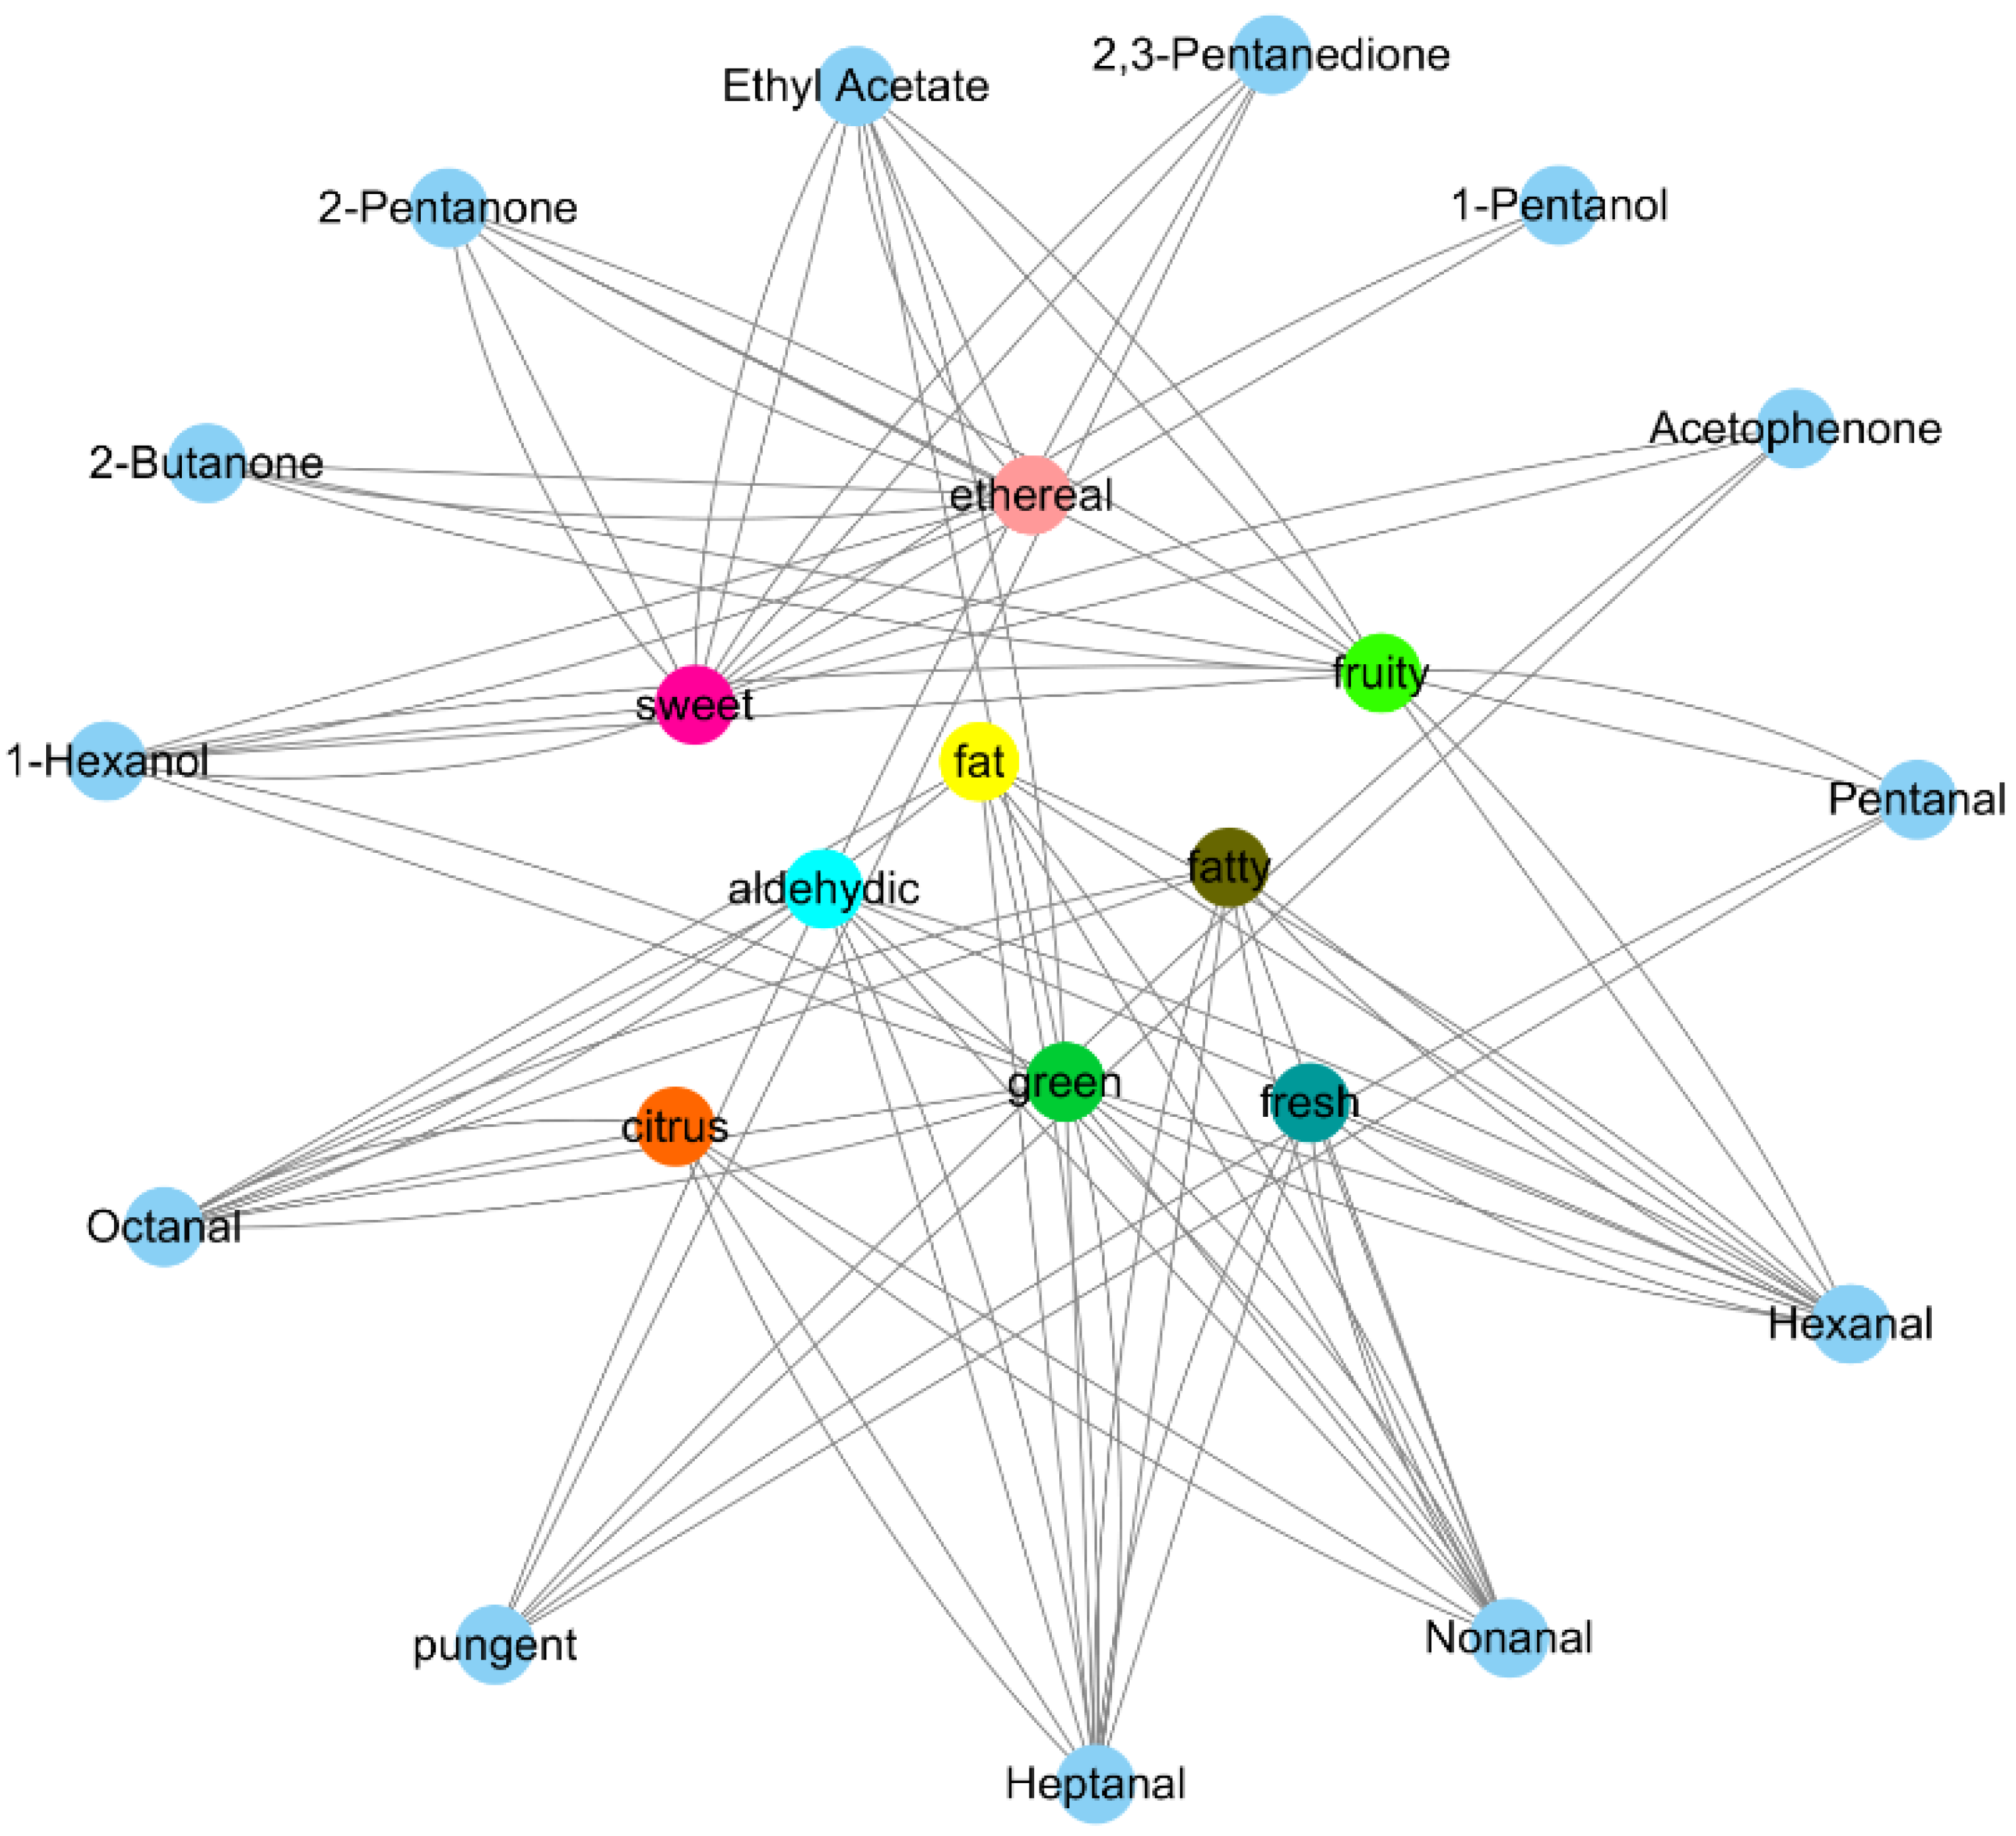
3.6. Identification of Key Differential Flavor Substances in Bananas

Generally, VIP could be used to measure the influence of the expression pattern of each metabolite on the classification and discrimination of each group of samples and the explanatory power. According to the VIP size, the variable (characteristic peak) could explain the importance of the X dataset and the associated Y dataset. The variable with VIP > 1 was used as one of the screening conditions for potential biomarkers. As shown in Figure 3, 16 substances with VIP > 1 were identified, including 1 ether, 1 acid, 3 alcohols, 4 ketones and 7 aldehydes. The content changes of 10 substances before and after VF were significantly different (p < 0.01), the change range of VIP was 1.03~5.31, which indicated that the substances changed significantly before and after VF of banana, and had an important impact on the flavor change of bananas before and after processing.
The heatmap and cluster analysis of key different flavor substances in bananas before and after VF are shown in Figure 4. It can be seen that 16 substances were divided into two categories, only 2-Hexenal was reduced in relative content after VF and was thus separated into a large category. The relative content of other metabolites increased, and the combination was another major category.

3.7. Identification of the Substances Affecting the Sensory Flavor in Bananas before and after Low-Temperature Vacuum Frying

By comparing the 79 obtained compounds described in Section 3.4 with Flavor DB, we found that 12 metabolites play a major role in representing 10 different sensory flavors, such as sweetness, citrus, fruitiness and pungent smell. These compounds included 1 ester, 2 alcohols, 4 ketones and 5 aldehydes, as shown in Figure 5. Then, the sensory flavor of bananas before and after VF was compared and analyzed, and the details are provided in Figure 6. Before and after VF, the flavor of fat and fruit in the bananas mostly changed, which was followed by a pungent, fatty, aldehydic, fresh, ethereal, sweet, green and citrus flavor according to the analysis of the different flavor substances before and after the VF described in Section 3.6. Among the 12 substances that affect the sensory flavor, 2,3-pentanedione, hexanal and pentanal had significant differences before and after VF. It could be inferred that the contents of these three substances changed significantly before and after VF in bananas, which led to a greater flavor change before and after VF, such as the flavor of fattiness and fruitiness. Among them, 2,3-pentanedione, as a food additive, had a sweet taste like butter and honey, which was consistent with the sensory flavor associated with that in this paper. Meanwhile, hexanal was involved in a variety of sensory flavors, such as fruity, fatty and green flavors. Pentanal was associate with a fruity and pungent flavor. The significant difference in the content of these substances may be the main reason for the significant change of banana flavor before and after VF.
Many studies have been conducted on the changes in volatile components during banana ripening and on the volatile components in banana powder [45,46], banana wine [47] and banana vinegar [48]. However, few studies have sought to identify the volatile components before and after frying banana slices. This study lays a foundation for improving the quality of the banana slices.

4. Conclusions

In this study, the comprehensive quality of banana slices was evaluated using factor analysis, and the evaluation model for the comprehensive quality of banana slices was established. The most suitable banana variety for processing was Meishijiao No. 1, followed by Guijiao No. 6 and Guijiao No. 2. Through the GC×GC-TOFMS method, the change of banana flavor composition before and after VF was explored, and it was found that the key substances affecting the sensory flavor of VF bananas might be 2,3-pentanedione, hexanal and pentanal. This study offers a theoretical foundation for the adjustment of banana sensory flavor and the optimization of VF process conditions. Further studies on the mechanism of flavor change of banana before and after frying should be pursued.

Author Contributions

Writing—original draft preparation, X.C.; software, Y.T. and Z.W.; writing—review and editing, X.H.; funding acquisition, J.S.; methodology, Z.D., Z.L. and L.L.; resources, X.H. and Z.L. All authors have read and agreed to the published version of the manuscript.

Funding

This research was funded by the earmarked fund for CARS (grant number CARS-31), the National Natural Science Foundation of Guangxi (grant number 2021GXNSFAA075035), and the Foundation of Fundamental Research Project from Guangxi Academy of Agricultural Sciences (grant number 2021YT116).

Data Availability Statement

The data presented in this study are available on request from the corresponding author.

Acknowledgments

The authors appreciate the support of the Guangxi Key Laboratory of Fruits and Vegetables Storage-Processing Technology and the College of Life Science, Southwest Forestry University.

Conflicts of Interest

The authors declare no conflict of interest.

References

  1. Dale, J.; Paul, J.-Y.; Dugdale, B.; Harding, R. Modifying bananas: From transgenics to organics? Sustainability 2017, 9, 333. [Google Scholar] [CrossRef]
  2. Sun, J.; He, X.; Tang, Y.; Tang, J.; Li, Z. Research progress of banana processing. Chin. J. Trop. Crops 2020, 41, 2022–2033. [Google Scholar]
  3. Udomkun, P.; Innawong, B.; Njukwe, E. Effect of vacuum frying conditions on physico-chemical properties of banana chips. Sci. Eng. Health Stud. 2018, 12, 169–178. [Google Scholar] [CrossRef]
  4. Wani, S.A.; Sharma, V.; Kumar, P. Effect of processing parameters on quality attributes of fried banana chips. Int. Food Res. J. 2017, 24, 1407–1413. [Google Scholar]
  5. Da Silva, P.F.; Moreira, R.G. Vacuum frying of high-quality fruit and vegetable-based snacks. LWT—Food Sci. Technol. 2008, 41, 1758–1767. [Google Scholar] [CrossRef]
  6. Andrés-Bello, A.; García-Segovia, P.; Martínez-Monzó, J. Vacuum frying: An alternative to obtain high-quality dried products. Food Eng. Rev. 2011, 3, 63–78. [Google Scholar] [CrossRef]
  7. Shabbir, M.A.; Ahmed, W.; Latif, S.; Inam-Ur-Raheem, M.; Manzoor, M.F.; Khan, M.R.; Bilal, R.M.; Aadil, R.M. The quality behavior of ultrasound extracted sunflower oil and structural computation of potato strips appertaining to deep-frying with thermic variations. J. Food Process. Preserv. 2020, 44, e14809. [Google Scholar] [CrossRef]
  8. Yamsaengsung, R.; Ariyapuchai, T.; Prasertsit, K. Effects of vacuum frying on structural changes of bananas. J. Food Eng. 2011, 106, 298–305. [Google Scholar] [CrossRef]
  9. Sothornvit, R. Edible coating and post-frying centrifuge step effect on quality of vacuum-fried banana chips. J. Food Eng. 2011, 107, 319–325. [Google Scholar] [CrossRef]
  10. Takougnadi, E.; Boroze, T.-E.T.; Azouma, O.Y. Effects of drying conditions on energy consumption and the nutritional and organoleptic quality of dried bananas. J. Food Eng. 2020, 268, 109747. [Google Scholar] [CrossRef]
  11. Swasdisevi, T.; Devahastin, S.; Sa-Adchom, P.; Soponronnarit, S. Mathematical modeling of combined far-infrared and vacuum drying banana slice. J. Food Eng. 2009, 92, 100–106. [Google Scholar] [CrossRef]
  12. Talla, A.; Puiggali, J.-R.; Jomaa, W.; Jannot, Y. Shrinkage and density evolution during drying of tropical fruits: Application to banana. J. Food Eng. 2004, 64, 103–109. [Google Scholar] [CrossRef]
  13. Nguyen, M.-H.; Price, W.E. Air-drying of banana: Influence of experimental parameters, slab thickness, banana maturity and harvesting season. J. Food Eng. 2007, 79, 200–207. [Google Scholar] [CrossRef]
  14. Wroniak, M.; Raczyk, M.; Kruszewski, B.; Symoniuk, E.; Dach, D. Effect of deep frying of potatoes and tofu on thermo-oxidative changes of cold pressed rapeseed oil, cold pressed high oleic rapeseed oil and palm olein. Antioxidants 2021, 10, 1637. [Google Scholar] [CrossRef] [PubMed]
  15. Zhu, H.; Li, X.P.; Yuan, R.C.; Chen, Y.F.; Chen, W.X. Changes in volatile compounds and associated relationships with other ripening events in banana fruit. J. Hortic. Sci. Biotechnol. 2015, 85, 283–288. [Google Scholar] [CrossRef]
  16. Shiota, H. New esteric components in the volatiles of banana fruit (Musa sapientum L.). J. Agric. Food Chem. 1993, 41, 2056–2062. [Google Scholar] [CrossRef]
  17. Zhu, X.; Li, Q.; Li, J.; Luo, J.; Chen, W.; Li, X. Comparative study of volatile compounds in the fruit of two banana cultivars at different ripening stages. Molecules 2018, 23, 2456. [Google Scholar] [CrossRef]
  18. Mccarthy, A.I.; Palmer, J.K.; Shaw, C.P.; Anderson, E.E. Correlation of gas chromatographic data with flavor profiles of fresh banana fruit. J. Food Sci. 1963, 28, 379–384. [Google Scholar] [CrossRef]
  19. Mui, W.W.Y.; Durance, T.D.; Scaman, C.H. Flavor and texture of banana chips dried by combinations of hot air, vacuum, and microwave processing. J. Agric. Food Chem. 2002, 50, 1883–1889. [Google Scholar] [CrossRef]
  20. Soltani, M.; Alimardani, R.; Omid, M. Evaluating banana ripening status from measuring dielectric properties. J. Food Eng. 2011, 105, 625–631. [Google Scholar] [CrossRef]
  21. Onsekizoglu, P.; Bahceci, K.S.; Acar, M.J. Clarification and the concentration of apple juice using membrane processes: A comparative quality assessment. J. Membr. Sci. 2010, 352, 160–165. [Google Scholar] [CrossRef]
  22. Yi, J.; Zhou, L.; Bi, J.; Wang, P.; Liu, X.; Wu, X. Influence of number of puffing times on physicochemical, color, texture, and microstructure of explosion puffing dried apple chips. Dry. Technol. 2015, 34, 773–782. [Google Scholar] [CrossRef]
  23. Pan, Z.; Shih, C.; McHugh, T.H.; Hirschberg, E. Study of banana dehydration using sequential infrared radiation heating and freeze-drying. LWT—Food Sci. Technol. 2008, 41, 1944–1951. [Google Scholar] [CrossRef]
  24. Dong, T.; Chen, X.J.; Wang, M.; Huang, Y.H.; Yi, G.J. Comparison of volatile aroma compounds in dwarf cavendish banana (Musa spp. AAA) grown under organic or traditional cultivation. J. Hortic. Sci. Biotechnol. 2014, 89, 441–447. [Google Scholar] [CrossRef]
  25. Drogoudi, P.D.; Michailidis, Z.; Pantelidis, G. Peel and flesh antioxidant content and harvest quality characteristics of seven apple cultivars. Sci. Hortic. 2008, 115, 149–153. [Google Scholar] [CrossRef]
  26. GB12456; Determination of Total Acid in Foods. Standards Press of China: Beijing, China, 2021.
  27. GB5009.5; Determination of Protein in Foods. Standards Press of China: Beijing, China, 2016.
  28. GB/T5009.10; Determination of Crude Fiber in Vegetable Foods. Standards Press of China: Beijing, China, 2003.
  29. Cao, J.; Jiang, W.; Zhao, Y. Experiment Guidance of Postharvest Physiology and Biochemistry of Fruits and Vegetables; China Light Industry Press: Beijing, China, 2007; pp. 39, 84–87. [Google Scholar]
  30. GB5009.6; Determination of Fat in Foods. Standards Press of China: Beijing, China, 2016.
  31. González, F.; Quintero, J.; Río, R.D.; Mahn, A. Optimization of an extraction process to obtain a food-grade sulforaphane-rich extract from broccoli (Brassica oleracea var. italica). Molecules 2021, 26, 4042. [Google Scholar] [CrossRef]
  32. Wang, C.; Zhang, W.; Li, H.; Mao, J.; Guo, C.; Ding, R.; Wang, Y.; Fang, L.; Chen, Z.; Yang, G. Analysis of volatile compounds in pears by HS-SPME-GC×GX-TOFMS. Molecules 2019, 24, 1795. [Google Scholar] [CrossRef] [PubMed]
  33. Wei, S.; Tao, S.; Qin, G.; Wang, S.; Tao, J.; Wu, J.; Wu, J.; Zhang, S. Transcriptome profiling reveals the candidate genes associated with aroma metabolites and emission of pear (Pyrus ussuriensis cv.). Sci. Hortic. 2016, 206, 33–42. [Google Scholar] [CrossRef]
  34. San, A.T.; Joyce, D.C.; Hofman, P.J.; Macnish, A.J.; Webb, R.I.; Matovic, N.J.; Williams, C.M.; De Voss, J.J.; Wong, S.H.; Smyth, H.E. Stable isotope dilution assay (SIDA) and HS-SPME-GCME quantification of key aroma volatiles for fruit and sap of australian mango cultivars. Food Chem. 2017, 221, 613–619. [Google Scholar] [CrossRef] [PubMed]
  35. Jing, R.; Wei, J.; Wang, L.; Song, W.; Zheng, G.; Guo, Y. Comprehensive quality evaluation of different rice varieties based on principal component analysis. Food Sci. 2020, 41, 179–184. [Google Scholar] [CrossRef]
  36. Fujiwara, T.; Kubo, T. Suitability of unripe japanese pear for semi-dried fruit processing. Nippon. Shokuhin Kagaku Kogaku Kaishi 2017, 64, 533–541. [Google Scholar] [CrossRef]
  37. Lamureanu, G.; Alexe, C.; Vintila, M. Suitability for processing as puree of some fruit varieties of peach group. J. Hortic. For. Biotechnol. 2014, 18, 51–57. [Google Scholar]
  38. Ağçam, E.; Akyıldız, A. A study on the quality criteria of some mandarin varieties and their suitability for juice processing. J. Food Process. 2014, 2014, 982721. [Google Scholar] [CrossRef]
  39. Li, H.; Mao, S.; Hu, H.; Zhang, B.; Zhang, X. Evaluation of fresh-cut processing suitability of different sweet pepper cultivars. Food Sci. 2012, 33, 136–139. [Google Scholar]
  40. Yan, P.; Han, L.; Diao, Y.; Xv, Z.; Mei, C.; Wang, J. Suitability evaluation of juice—Processing for Malus sieversii. Xinjiang Agric. Sci. 2016, 53, 135–141. [Google Scholar]
  41. Yang, B.; Zhang, X.; Zhao, F.; Liu, W.; Yang, Y.; Shujun, L.I. Characteristic analysis and processing suitability clustering of common potato cultivars. J. Food Sci. Technol. 2016, 34, 28–36. [Google Scholar] [CrossRef]
  42. Nogueira, J.M.F.; Fernandes, P.J.P.; Nascimento, A.M.D. Composition of volatiles of banana cultivars from madeira island. Phytochem. Anal. 2003, 14, 87–90. [Google Scholar] [CrossRef] [PubMed]
  43. Selli, S.; Gubbuk, H.; Kafkas, E.; Gunes, E. Comparison of aroma compounds in dwarf cavendish banana (Musa spp. AAA) grown from open-field and protected cultivation area. Sci. Hortic. 2012, 141, 76–82. [Google Scholar] [CrossRef]
  44. Liu, T.T.; Yang, T.S. Optimization of solid-phase microextraction analysis for studying change of headspace flavor compounds of banana during ripening. J. Agric. Food Chem. 2002, 50, 653–657. [Google Scholar] [CrossRef]
  45. Chen, M.; Zhong, X.; Kong, L.; Chen, Y.; Ye, Y. Tudy on the quality and volatile components of fresh bananas and vacuum freeze- dried bananas powder. Food Ferment. Ind. 2022, 48, 161–168. [Google Scholar]
  46. Wang, J.; Yuan, Z.L.; Ren, R.C.; Jin, Y.B.; Gong, M.Y. Comparison of volatiles of banana powder dehydrated by vacuum belt drying, freeze-drying and air-drying. Food Chem. 2007, 104, 1516–1521. [Google Scholar] [CrossRef]
  47. Wei, L.; Yang, C.; Sun, Q.; Huang, J.; Chen, Z.; Tang, T. Changes of volatile flavor substances in fermentation process of banana wine produced by low temperature fermentation. Sci. Technol. Food Ind. 2020, 41, 231–238. [Google Scholar] [CrossRef]
  48. Wei, L.; Sun, Q.; Yang, C.; Du, L.; Huang, J.; Ling, M. The change of volatile flavor substances in the processing of continuous immobilization of banana vinegar. Food Mach. 2021, 37, 22–28+35. [Google Scholar] [CrossRef]
Figure 1. Analysis of the flavor substances of the OPLS-DA of banana before and after VF.
Foods 12 01822 g001
Figure 2. OPLS-DA test chart for banana flavor before and after VF.
Foods 12 01822 g002
Figure 3. Comparison of VIP values of key flavor substances in bananas before and after VF. (a) The key flavor substances in bananas before and after VF (p < 0.01). (b) The key flavor substances in bananas before and after VF (p < 0.05).
Foods 12 01822 g003
Figure 4. Heatmap and cluster analysis of the key flavor substances in bananas before and after VF.
Foods 12 01822 g004
Figure 5. Correlation network between banana flavor substances and sensory flavor before and after VF.
Foods 12 01822 g005
Figure 6. Radar chart of correlation between banana flavor substances and sensory flavor before and after VF.
Foods 12 01822 g006
Table 1. Name and origin of the banana raw materials.
No.NameOrigin
1Guijiao No. 1Longan, Guangxi
2Guijiao No. 2Honghe, Yunnan
3Guijiao No. 6Honghe, Yunnan
4Guizao Honghe, Yunnan
5Zhongjiao No. 9Honghe, Yunnan
6Reke No. 1Haikou, Hainan
7Reke No. 2Haikou, Hainan
8Reke No. 4Haikou, Hainan
9BaodaoHonghe, Yunnan
10BaxiHonghe, Yunnan
11Jinfen No. 1Honghe, Yunnan
12FenjiaoLongan, Guangxi
13Meishijiao No. 1Zhanjiang, Guangdong
14151Zhanjiang, Guangdong
15CB5Zhanjiang, Guangdong
Note: Bananas with the codes “151” and “CB5” were germplasm and kept in the Resource Garden of the Institute of Fruit Tree Research, Guangdong Academy of Agricultural Sciences.
Table 2. Setting parameters of the hardness and brittleness.
ParametersHardnessBrittleness
Type of the probeTA 44TA 7
Trigger force (g)55
Test distance (mm)2.57
Test speed (mm/s)21.5
Table 3. Horizontal analysis on sensory quality indexes of banana slices.
IndexAmplitudeMean
Value
Standard DeviationCoefficient of Variation (%)
L* value62.35–76.4969.993.965.66
a* value2.89–8.674.761.5532.50
b* value23.33–48.7229.936.0320.16
hardness (g)1397.00–4421.702414.04921.5738.17
brittleness (g)941.50–4115.331943.93885.4145.55
Note: The coefficient of variation was the ratio of standard deviation to mean value, as below. L*, a* and b* values represent color, refer to Section 2.4. for details, * has no special meaning among them, as below.
Table 4. Horizontal analysis on flavor quality indexes of banana slices.
IndexAmplitudeMean
Value
Standard DeviationCoefficient of Variation (%)
TSS (%)5.60–7.806.890.669.55
SS (%)32.27–66.2349.659.2218.58
TA (%)1.15–2.161.490.2517.04
sugar-acid ratio17.70–45.6734.087.4821.94
Note: TSS—total soluble solid; SS—soluble sugar; TA—titratable acid.
Table 5. Horizontal analysis on the nutritional quality indexes of banana slices.
IndexAmplitudeMean
Value
Standard DeviationCoefficient of Variation (%)
Protein (%)2.52–5.843.880.9925.63
Starch (mg/g)59.44–392.48203.16104.8951.63
Crude fiber (%)0.96–3.331.840.6736.70
Pectin (g/kg)10.85–28.4719.105.8530.66
Fat (%)15.84–24.6720.482.039.92
Phenolics (mg/g)0.76–4.112.660.9435.21
Vitamin C (mg/100 g)25.40–52.5338.179.4724.80
Table 6. Horizontal analysis on the processing quality indexes of banana slices.
IndexAmplitudeMean
Value
Standard
Deviation
Coefficient of Variation (%)
Degree of expansion 0.87–1.421.120.1614.53
Output ratio (%)22.34–39.9529.065.1817.83
Rehydration ratio1.53–2.161.800.189.90
Moisture (%)1.68–4.033.070.7724.96
Table 7. Rotated component matrix for the quality index of banana slices.
IndexCommon Factor
12345
a* value0.0440.7610.419−0.0670.120
b* value0.0960.795−0.030−0.3230.166
Hardness 0.8790.1670.010−0.058−0.134
Brittleness0.955−0.110−0.025−0.0680.020
Sugar–acid ratio0.0380.0880.9260.2230.049
Protein−0.757−0.2540.315−0.1920.390
Starch0.6000.039−0.736−0.005−0.007
Crude fiber0.0820.0470.4480.653−0.240
Pectin0.069−0.8050.026−0.2310.233
Phenolics−0.079−0.5520.2090.1620.595
Vc−0.188−0.1510.0230.9290.206
Degree of expansion0.884−0.0460.027−0.1680.150
Output ratio0.5380.557−0.193−0.501−0.119
Moisture−0.0540.096−0.0510.0110.922
Eigenvalues (λ)3.7562.6251.9621.8531.610
Percent of variance (%)26.82718.74814.01513.23211.500
Cumulative percent of
Variance (%)
26.82745.57559.59072.82284.322
Table 8. Correlation analysis on the quality indexes of banana slices.
Indexa* Valueb* ValueHardnessBrittlenessSugar-Acid RatioProteinStarchCrude
Fiber
PectinPolyphenolsVcDegree of ExpansionOutput RatioMoisture
a* value1
b* value0.524 *1
Hardness 0.2490.0571
Brittleness0.021−0.0060.873 **1
Sugar–acid ratio0.473−0.0740.094−0.0381
Protein−0.027−0.192−0.712 **−0.658 **0.2031
Starch−0.1760.0720.550 *0.584 *−0.599 *−0.681 **1
Crude fiber0.019−0.091−0.113−0.0180.477−0.132−0.3081
Pectin−0.441−0.521 *−0.1530.184−0.0750.2810.061−0.1421
Phenolics−0.370−0.256−0.304−0.0840.1670.419−0.290−0.0080.3921
Vc−0.099−0.409−0.248−0.2040.2200.087−0.1370.494−0.0260.3751
Degree of expansion−0.1130.2640.628 *0.800 **−0.031−0.579 *0.4450.0780.0970.148−0.3271
Output ratio0.3080.682 **0.531 *0.456−0.254−0.561 *0.461−0.187−0.296−0.547 *−0.691 **0.574 *1
Moisture0.1630.111−0.123−0.0810.0320.3800.015−0.1910.1820.3270.1710.036−0.0541
Note: * after the number indicates significant correlation, p < 0.05; ** indicates extremely significant correlation, p < 0.01.
Table 9. Weight values on core indexes of banana slices.
b* ValueBrittlenessSugar–Acid RatioCrude
Fiber
PectinOutput
Ratio
Moisture
Weight value0.17420.22010.27240.2093−0.16680.12200.1689
Table 10. Data after standardized treatment on the core indexes of banana slices.
No.Nameb* ValueBrittlenessSugar–Acid RatioCrude FiberPectinOutput RatioMoisture
1Guijiao No. 10.190.770.930.170.230.190.53
2Guijiao No. 20.181.000.660.760.120.120.65
3Guijiao No. 60.280.860.860.670.340.070.94
4Guizao 0.170.450.970.610.680.601.00
5Zhongjiao No. 90.080.730.520.000.810.450.73
6Reke No. 10.180.950.950.050.810.300.00
7Reke No. 20.300.900.890.530.030.230.05
8Reke No. 40.270.930.710.290.320.340.49
9Baodao0.190.880.850.240.750.000.05
10Baxi0.220.730.890.251.000.240.03
11Jinfen No. 10.010.000.960.210.710.280.43
12Fenjiao0.000.530.921.000.780.290.17
13Meishijiao No. 11.000.560.880.380.181.000.28
141510.400.680.680.130.000.780.48
15CB50.430.280.780.300.270.830.26
Note: All standardized data were obtained from the average value (repeated 3 times of) through standardization, as below.
Table 11. Comprehensive quality order, comprehensive score and class of banana slices.
NameOriginOrderScoreClass
Meishijiao No. 1Zhanjiang, Guangdong10.75501
Guijiao No. 6Honghe, Yunnan20.72431
Guijiao No. 2Honghe, Yunnan30.69481
Guizao Honghe, Yunnan40.64812
Reke No. 2Haikou, Hainan50.63612
151Zhanjiang, Guangdong60.60882
Reke No. 4Haikou, Hainan70.57703
Guijiao No. 1Longan, Guangxi80.56413
CB5Zhanjiang, Guangdong90.51203
FenjiaoLongan, Guangxi100.50903
Reke No. 1Haikou, Hainan110.40894
BaodaoHonghe, Yunnan120.39204
BaxiHonghe, Yunnan130.36254
Zhongjiao No. 9Honghe, Yunnan140.36034
Jinfen No. 1Honghe, Yunnan150.29665
Table 12. Data after standardized treatment on core indexes of banana slices.
No.CompoundCASRTVIPFold Changep Value
11-Butanol71-36-314.870.1836.080.02
21-Hexanol111-27-325.200.150.470.60
31-Pentanol71-41-021.130.7213.090.06
41-Penten-3-ol616-25-115.671.375.510.00
51-Penten-3-one1629-58-99.071.4315.000.00
61-Propanol71-23-89.730.130.590.26
72-Butanone78-93-35.600.7611.390.00
82-Butenal, (E)-123-73-911.130.1849.030.15
92-Cyclohexen-1-one, 3,4,4-trimethyl-17299-41-127.670.020.600.19
102-Heptenal, (Z)-57266-86-124.670.8533.830.02
112-Hexenal505-57-719.675.310.040.01
122-Nonenal, (E)-18829-56-629.870.041.160.32
132-Octenal, (E)-2548-87-027.670.373.520.00
142-Octenal, 2-butyl-13019-16-432.000.800.040.03
152-Pentanone107-87-97.4672.279.520.12
162-Penten-1-ol, (Z)-1576-95-024.000.251.980.38
172-Pentenal, (E)-1576-87-014.331.0427.910.00
182-Propenal107-02-84.800.3211.780.03
192(5H)-Furanone, 5-ethyl-2407-43-430.600.640.260.01
202,2-Dimethylocta-3,4-dienal590-71-631.330.020.640.59
212,3-Butanedione431-03-87.531.1314.740.01
222,3-Pentanedione600-14-610.671.1329.150.00
232,4-Decadienal2363-88-434.130.3650.570.00
242,4-Heptadienal, (E,E)-4313-03-528.331.12109.140.01
252,4-Hexadienal, (E,E)-142-83-626.930.620.180.01
262,7-Nonadien-5-one, 4,6-dimethyl-74630-80-122.930.110.180.02
273-Octen-2-one, (E)-18402-82-926.930.2832.40.13
283,3,5,5-Tetramethylcyclopentene38667-10-636.130.060.650.05
293,5-Octadien-2-one, (E,E)-30086-02-329.471.0318.980.04
304-Heptenal62238-34-036.400.2620.530.14
314,5-Heptadien-2-one, 3,3,6-trimethyl-81250-41-134.270.130.190.46
326-Oxabicyclo [3.1.0]hexan-2-one6705-52-818.270.041.910.42
33a-Ionone127-41-334.530.180.170.10
34Acetaldehyde75-07-03.530.060.960.92
35Acetic acid64-19-727.331.776.740.00
36Acetic acid, hexyl ester142-92-722.870.210.060.00
37Acetic acid, methyl ester79-20-94.470.290.330.02
38Acetoin513-86-022.400.9931.080.13
39Acetone67-64-14.331.0220.210.20
40Acetophenone98-86-231.600.2011.150.03
41Benzaldehyde100-52-729.270.796.340.01
42Benzaldehyde, 3-ethyl-34246-54-332.530.090.110.00
43Benzene, 1,4-dichloro-106-46-728.470.067.730.01
44Benzeneacetaldehyde122-78-131.270.543.580.00
45Butanal123-72-85.130.406.970.00
46Butanal, 3-methyl-590-86-35.871.1318.020.05
47Butanoic acid, 3-methyl-503-74-231.270.651.50.22
48Cyclohexanol, 2,4-dimethyl-69542-91-233.470.084.010.01
49Dimethyl sulfide75-18-33.801.7130.910.00
50Ethanol64-17-56.270.540.550.30
51Ethyl Acetate141-78-65.270.131.860.63
52Furan, 2-ethyl-3208-16-06.670.663.570.00
53Furan, 2-pentyl-3777-69-319.930.896.60.00
54Furan, 2,3-dihydro-5-methyl-1487-15-65.600.076.880.15
55Furfural98-01-127.931.90141.810.00
56Heptanal111-71-717.330.48198.230.00
57Hexanal66-25-111.602.522.340.02
58Methacrolein78-85-310.200.020.790.85
59Methanethiol74-93-13.4670.2013.240.00
60Methional3268-49-327.670.2811.080.00
61Methyl Alcohol67-56-15.402.482.520.00
62Methyl formate107-31-33.870.126.090.18
63n-Caproic acid vinyl ester3050-69-931.200.152.220.02
64Nonanal124-19-626.670.475.70.05
65Octanal124-13-023.470.3616.70.00
66Octanoic acid, ethyl ester106-32-128.000.064.210.23
67Pentanal110-62-37.531.48177.490.03
68Pentanoic acid109-52-433.800.281.850.54
69Phenol, 4-(1-methylpropyl)-99-71-834.470.140.050.00
70Propanal123-38-64.071.5344.720.00
71Propanal, 2-methyl-78-84-24.270.7628.80.01
72Propanoic acid79-09-429.130.6530.30.00
73trans-a-Ionone79-77-635.730.200.130.01
741,4-Pentadiene591-93-53.470.063.440.01
752-Butenal4170-30-310.200.738.850.02
762-Penten-1-ol, (E)-1576-96-123.730.2322.720.34
77Acetonitrile75-05-88.400.114.120.01
78Butyrolactone96-48-031.070.8518370.00
79Ethyl ether60-29-73.330.1651.70.00
Note: RT—retention time; VIP—variable importance for the projection.
Disclaimer/Publisher’s Note: The statements, opinions and data contained in all publications are solely those of the individual author(s) and contributor(s) and not of MDPI and/or the editor(s). MDPI and/or the editor(s) disclaim responsibility for any injury to people or property resulting from any ideas, methods, instructions or products referred to in the content.

