

Antialcohol and Hepatoprotective Effects of Tamarind Shell Extract on Ethanol-Induced Damage to HepG2 Cells and Animal Models

 and
and
Abstract
1. Introduction
2. Materials and Methods
2.1. Chemicals and Reagents
2.2. Preparation of Tamarind Shell Extract (TSE)
2.3. Zebrafish Maintenance and Exposure
2.3.1. Toxicity
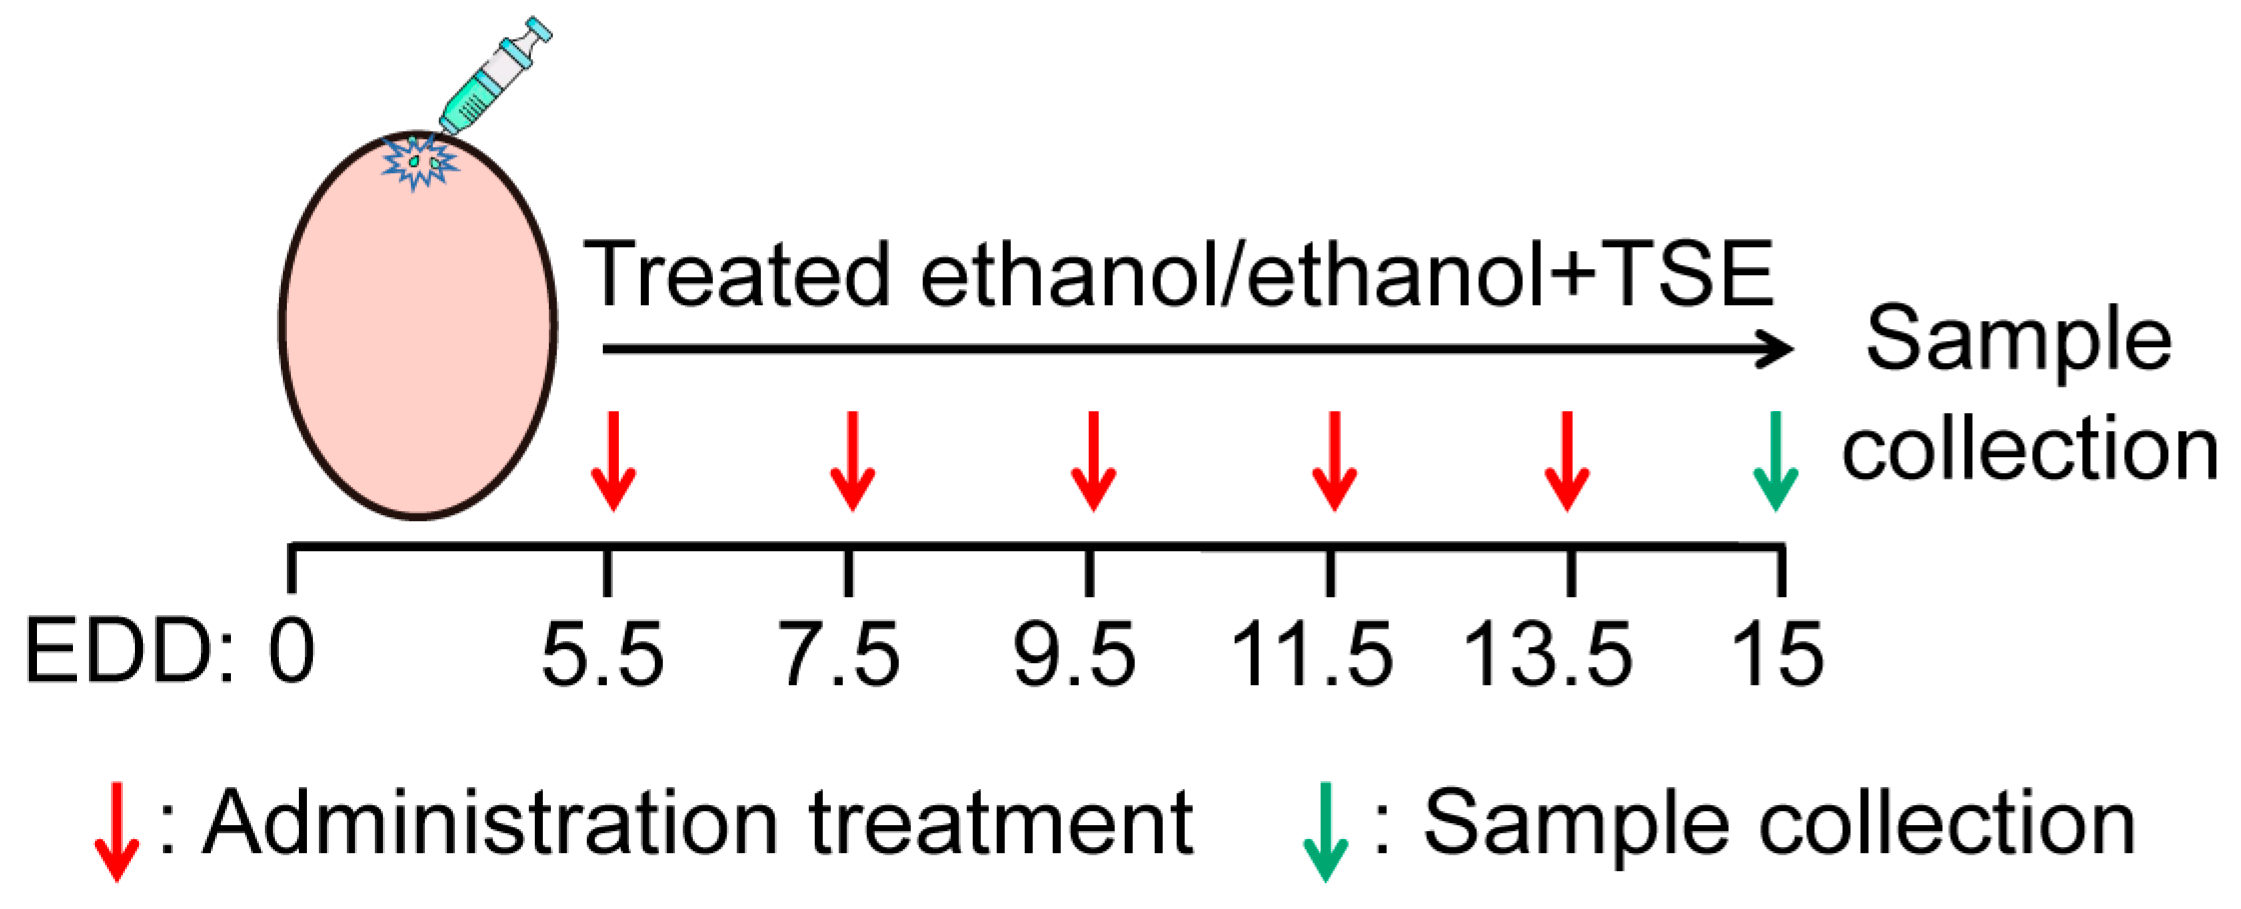
2.3.2. Exposure
2.4. Chicken Embryos and Treatment
2.5. Cell Culture
2.6. Cell Toxicity and Cell Experiment
2.7. Zebrafish Behavioral Test and Evaluation of ROS Level in Zebrafish
2.8. Histological Analysis
2.9. Biochemical Analysis
2.10. Western Blot Analysis
2.11. qRT-PCR
2.12. Statistical Analysis
3. Results
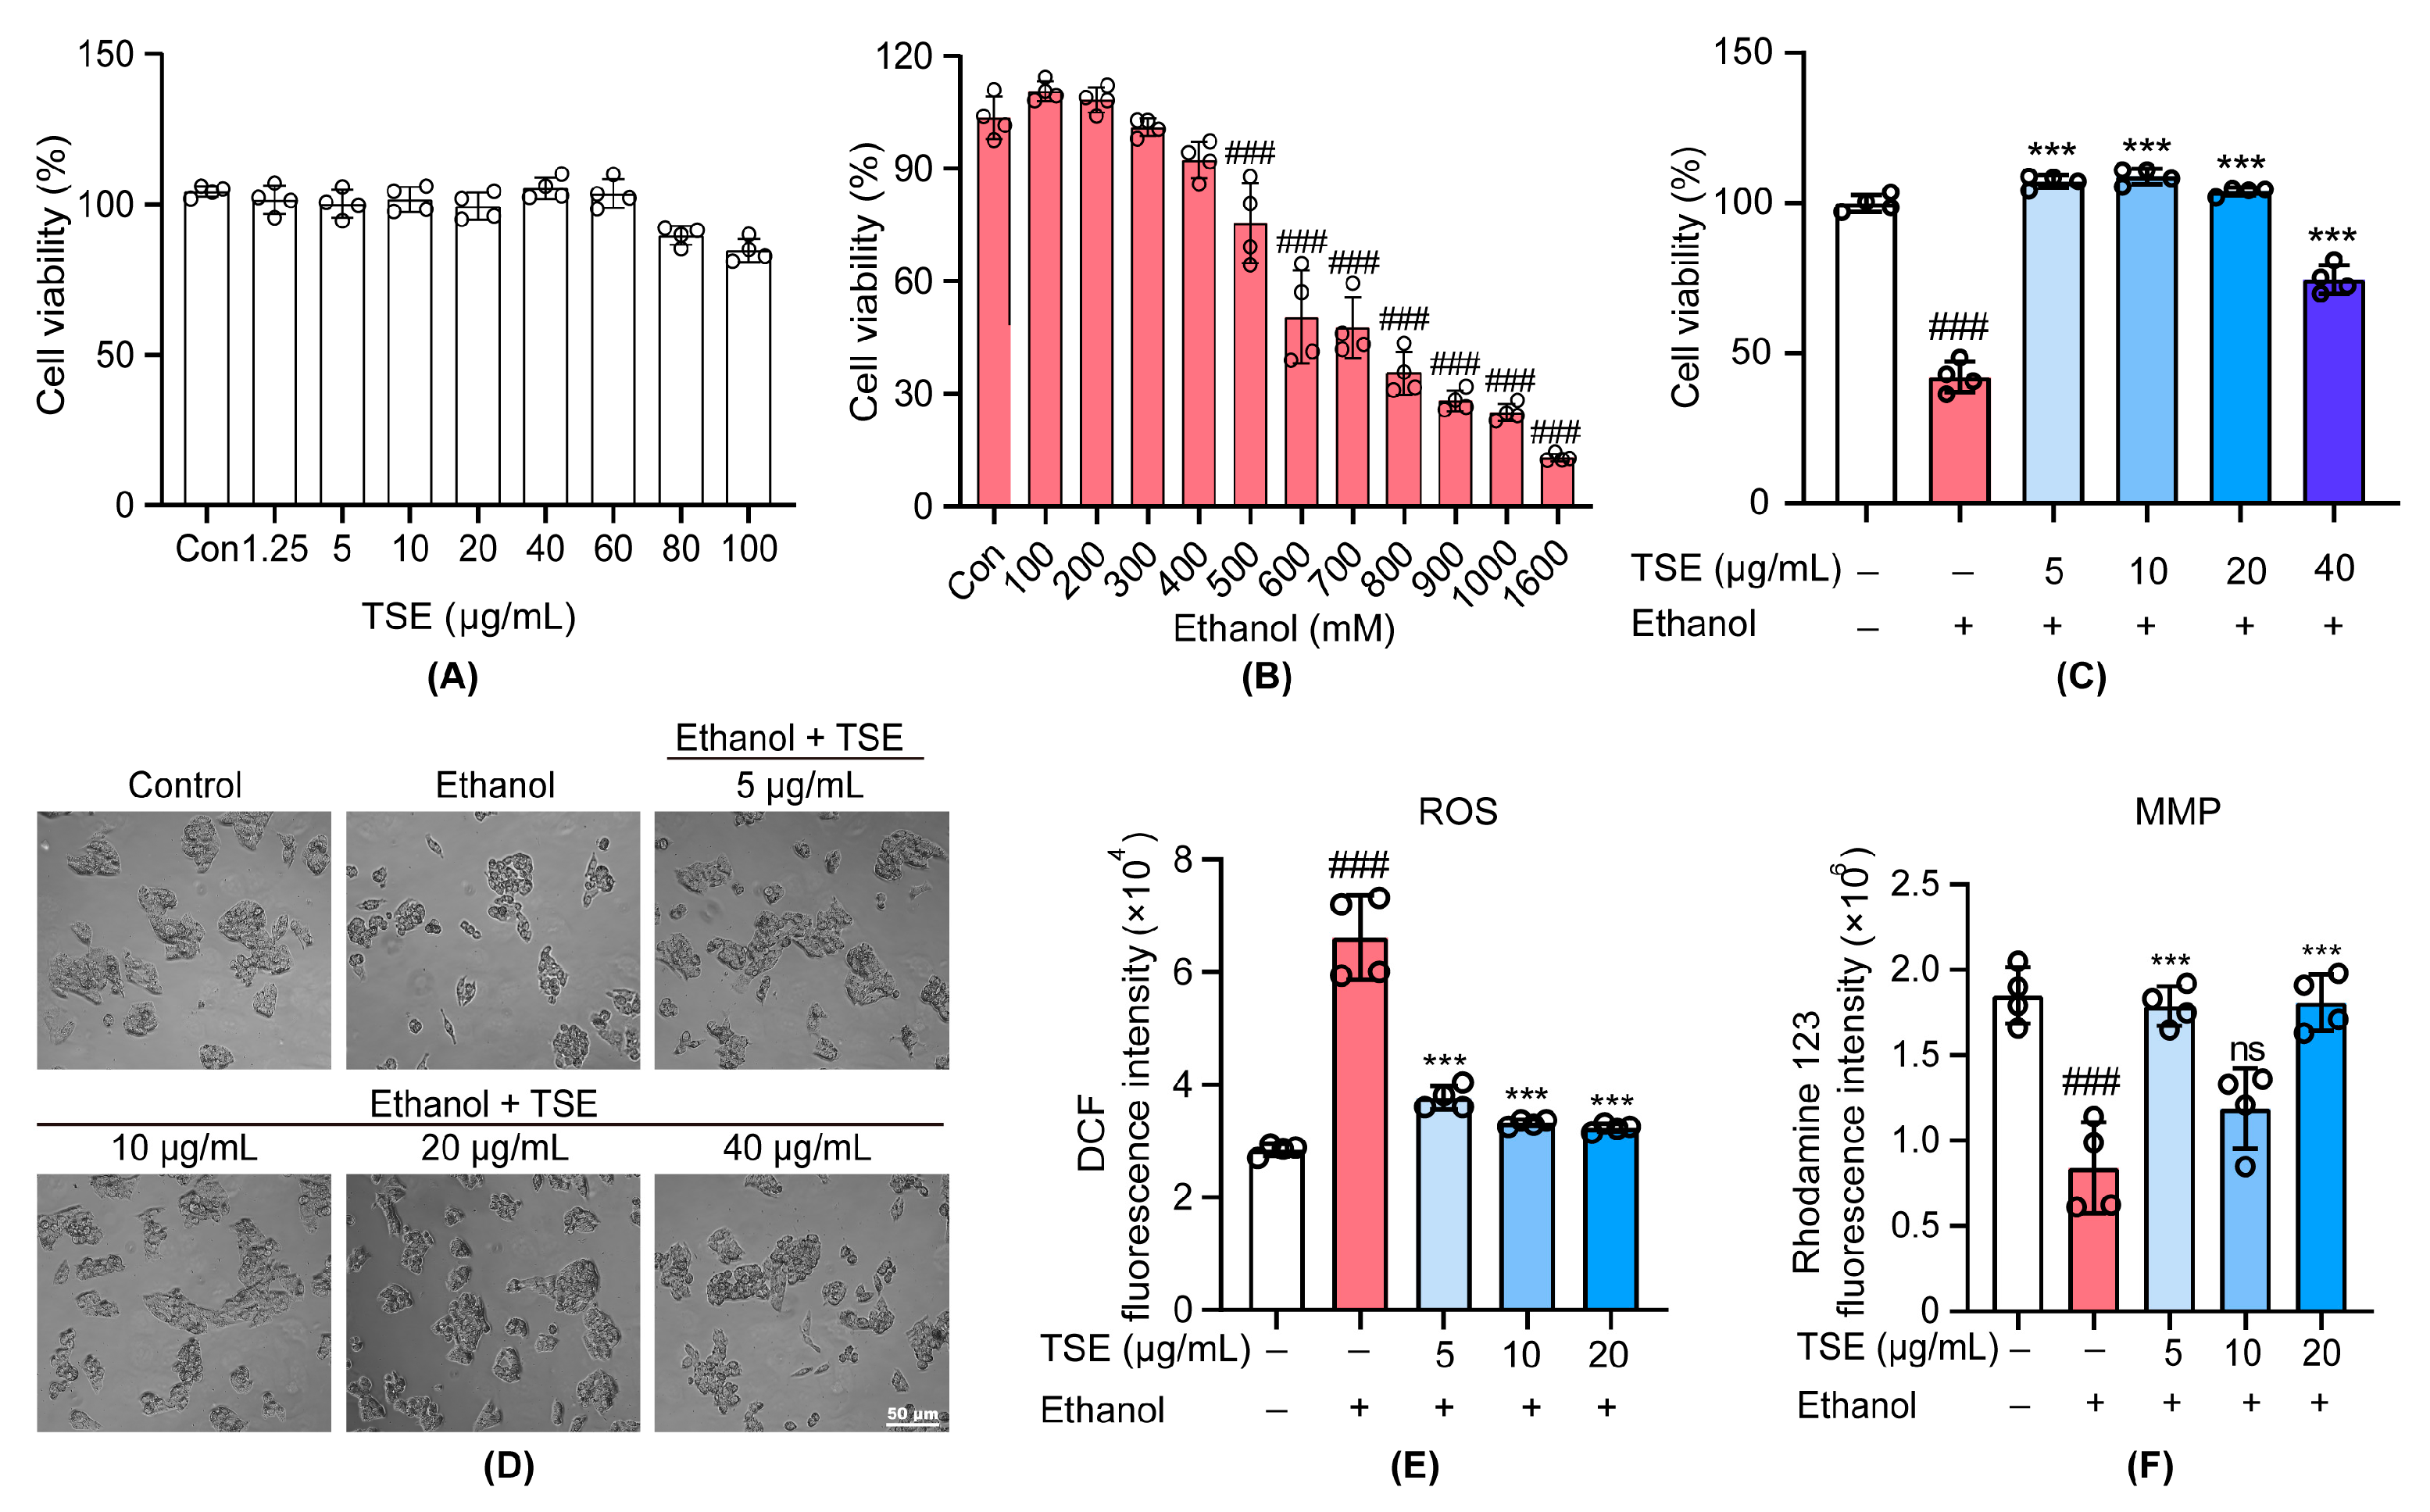
3.1. TSE Protected Ethanol-Induced Damage in HepG2 Cells
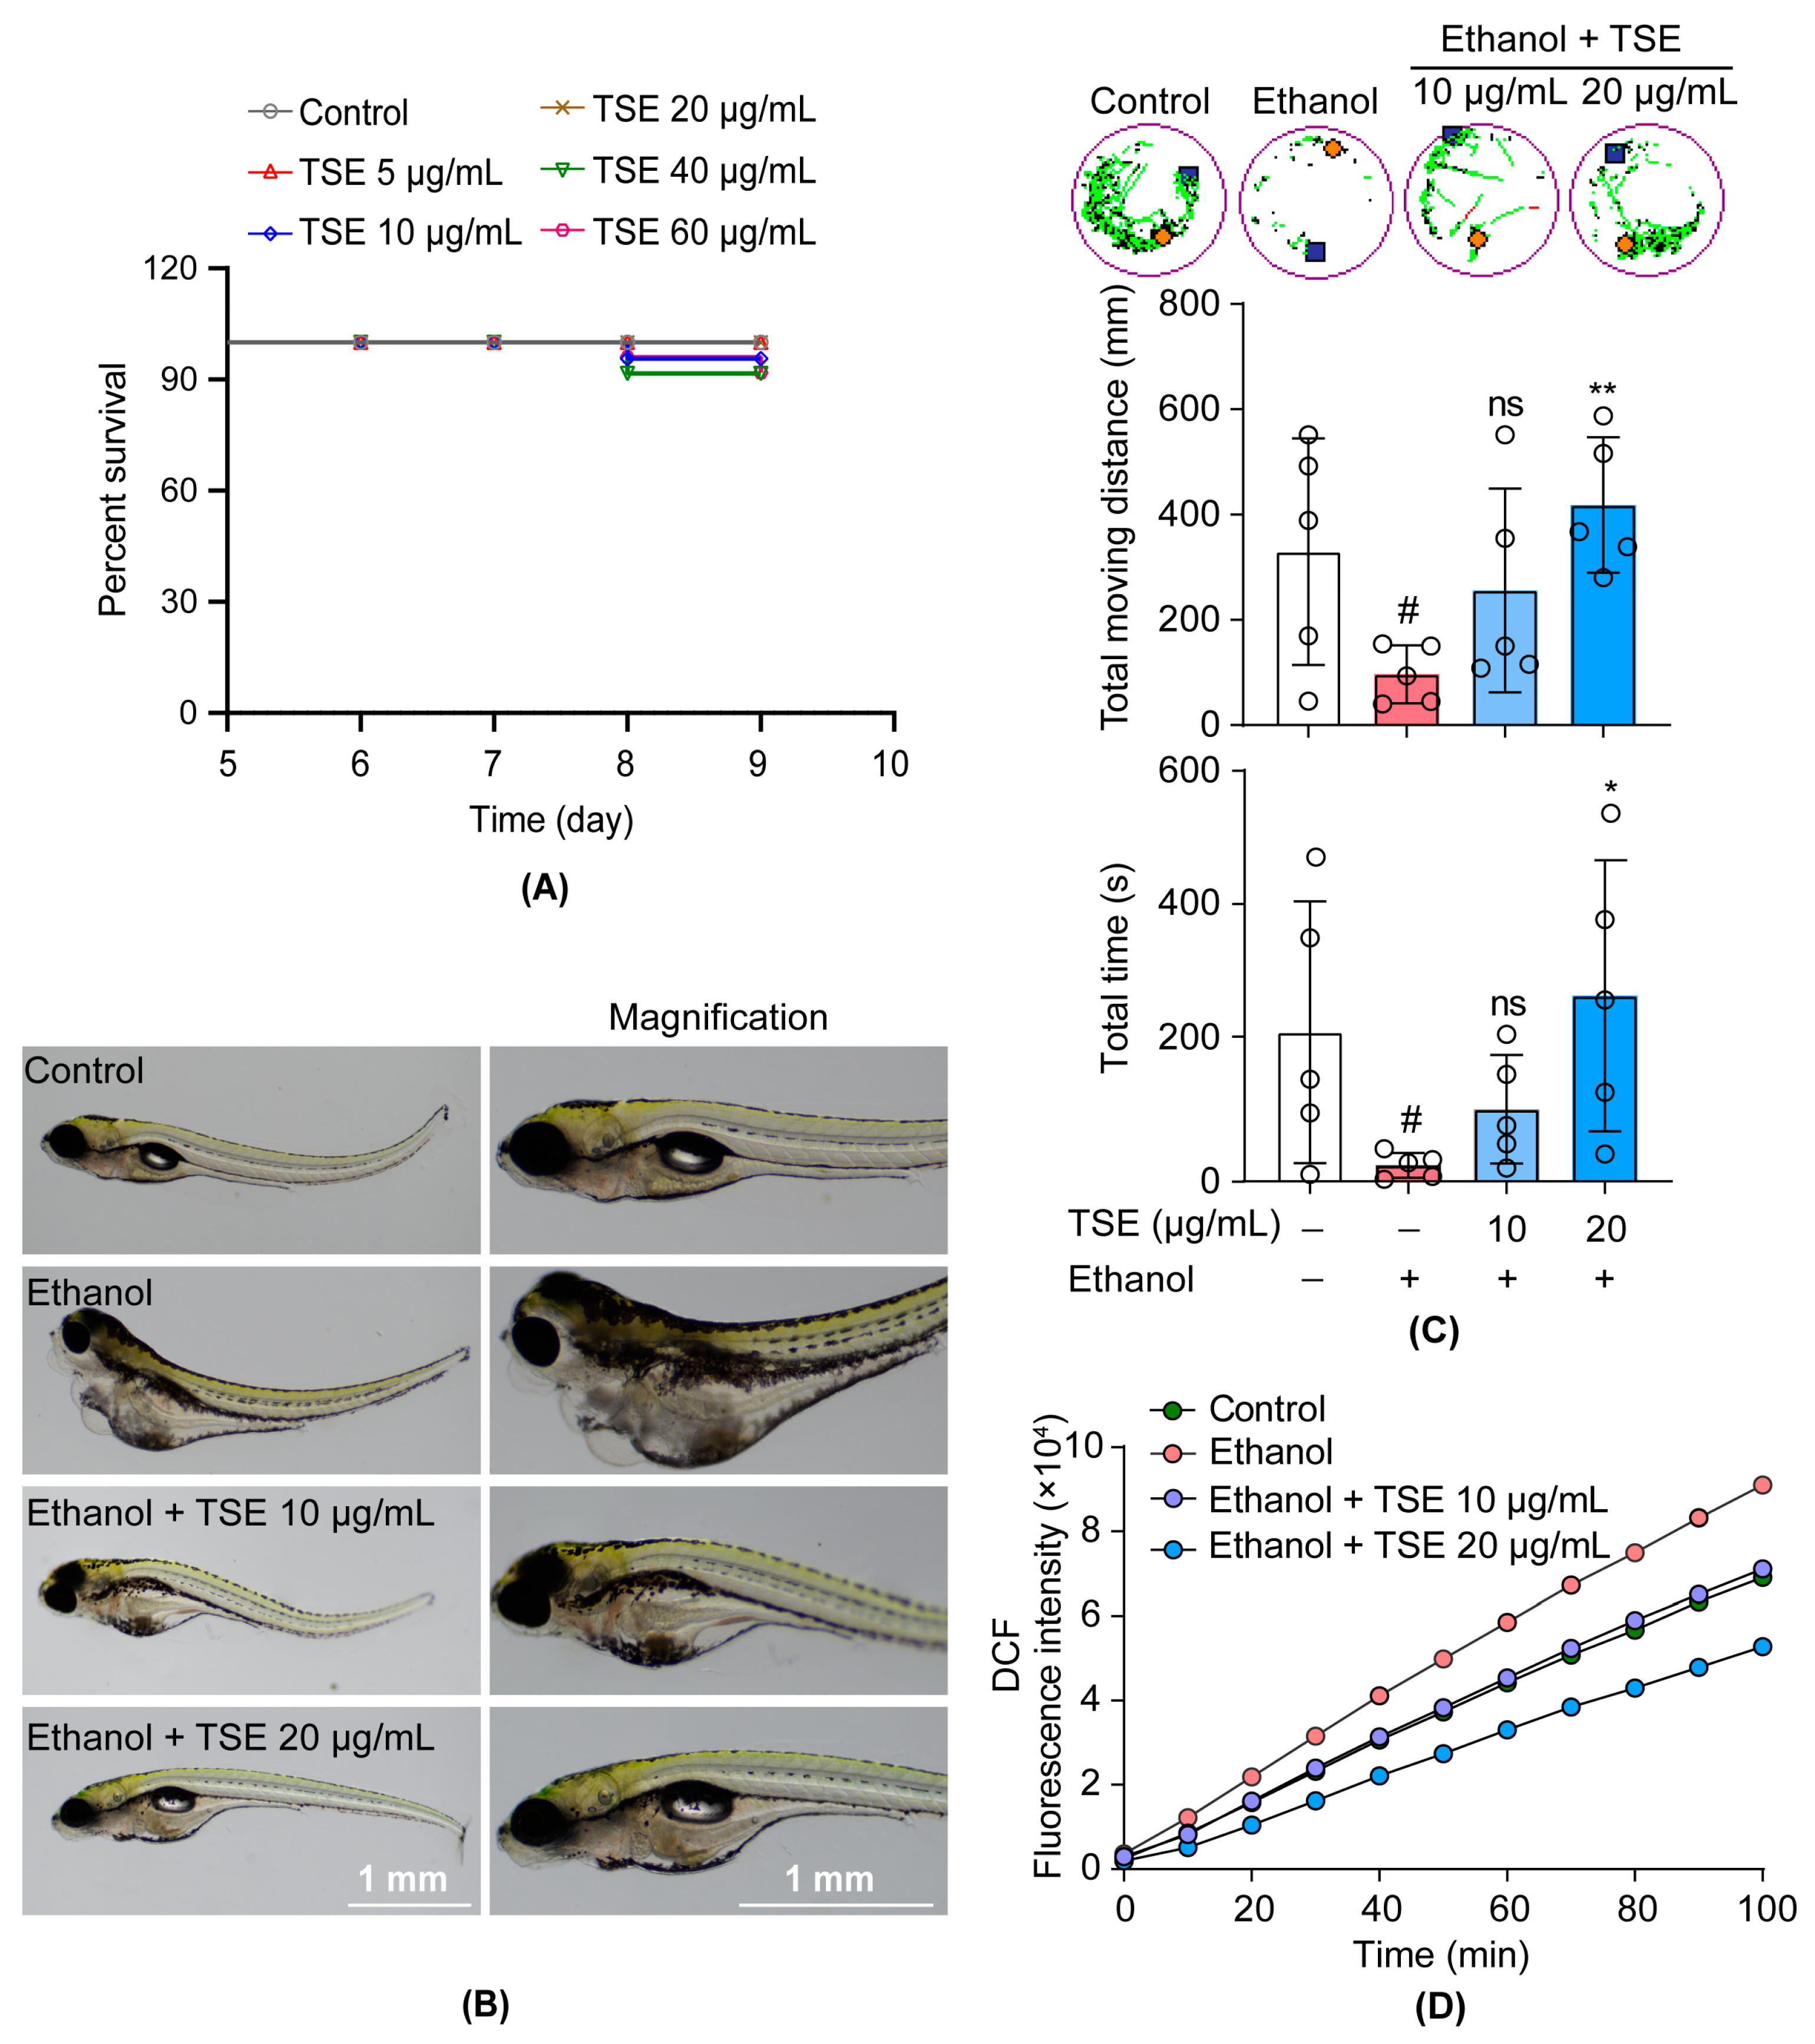
3.2. TSE Ameliorated Ethanol-Induced Behavior Changes and Oxidative Stress in Zebrafish
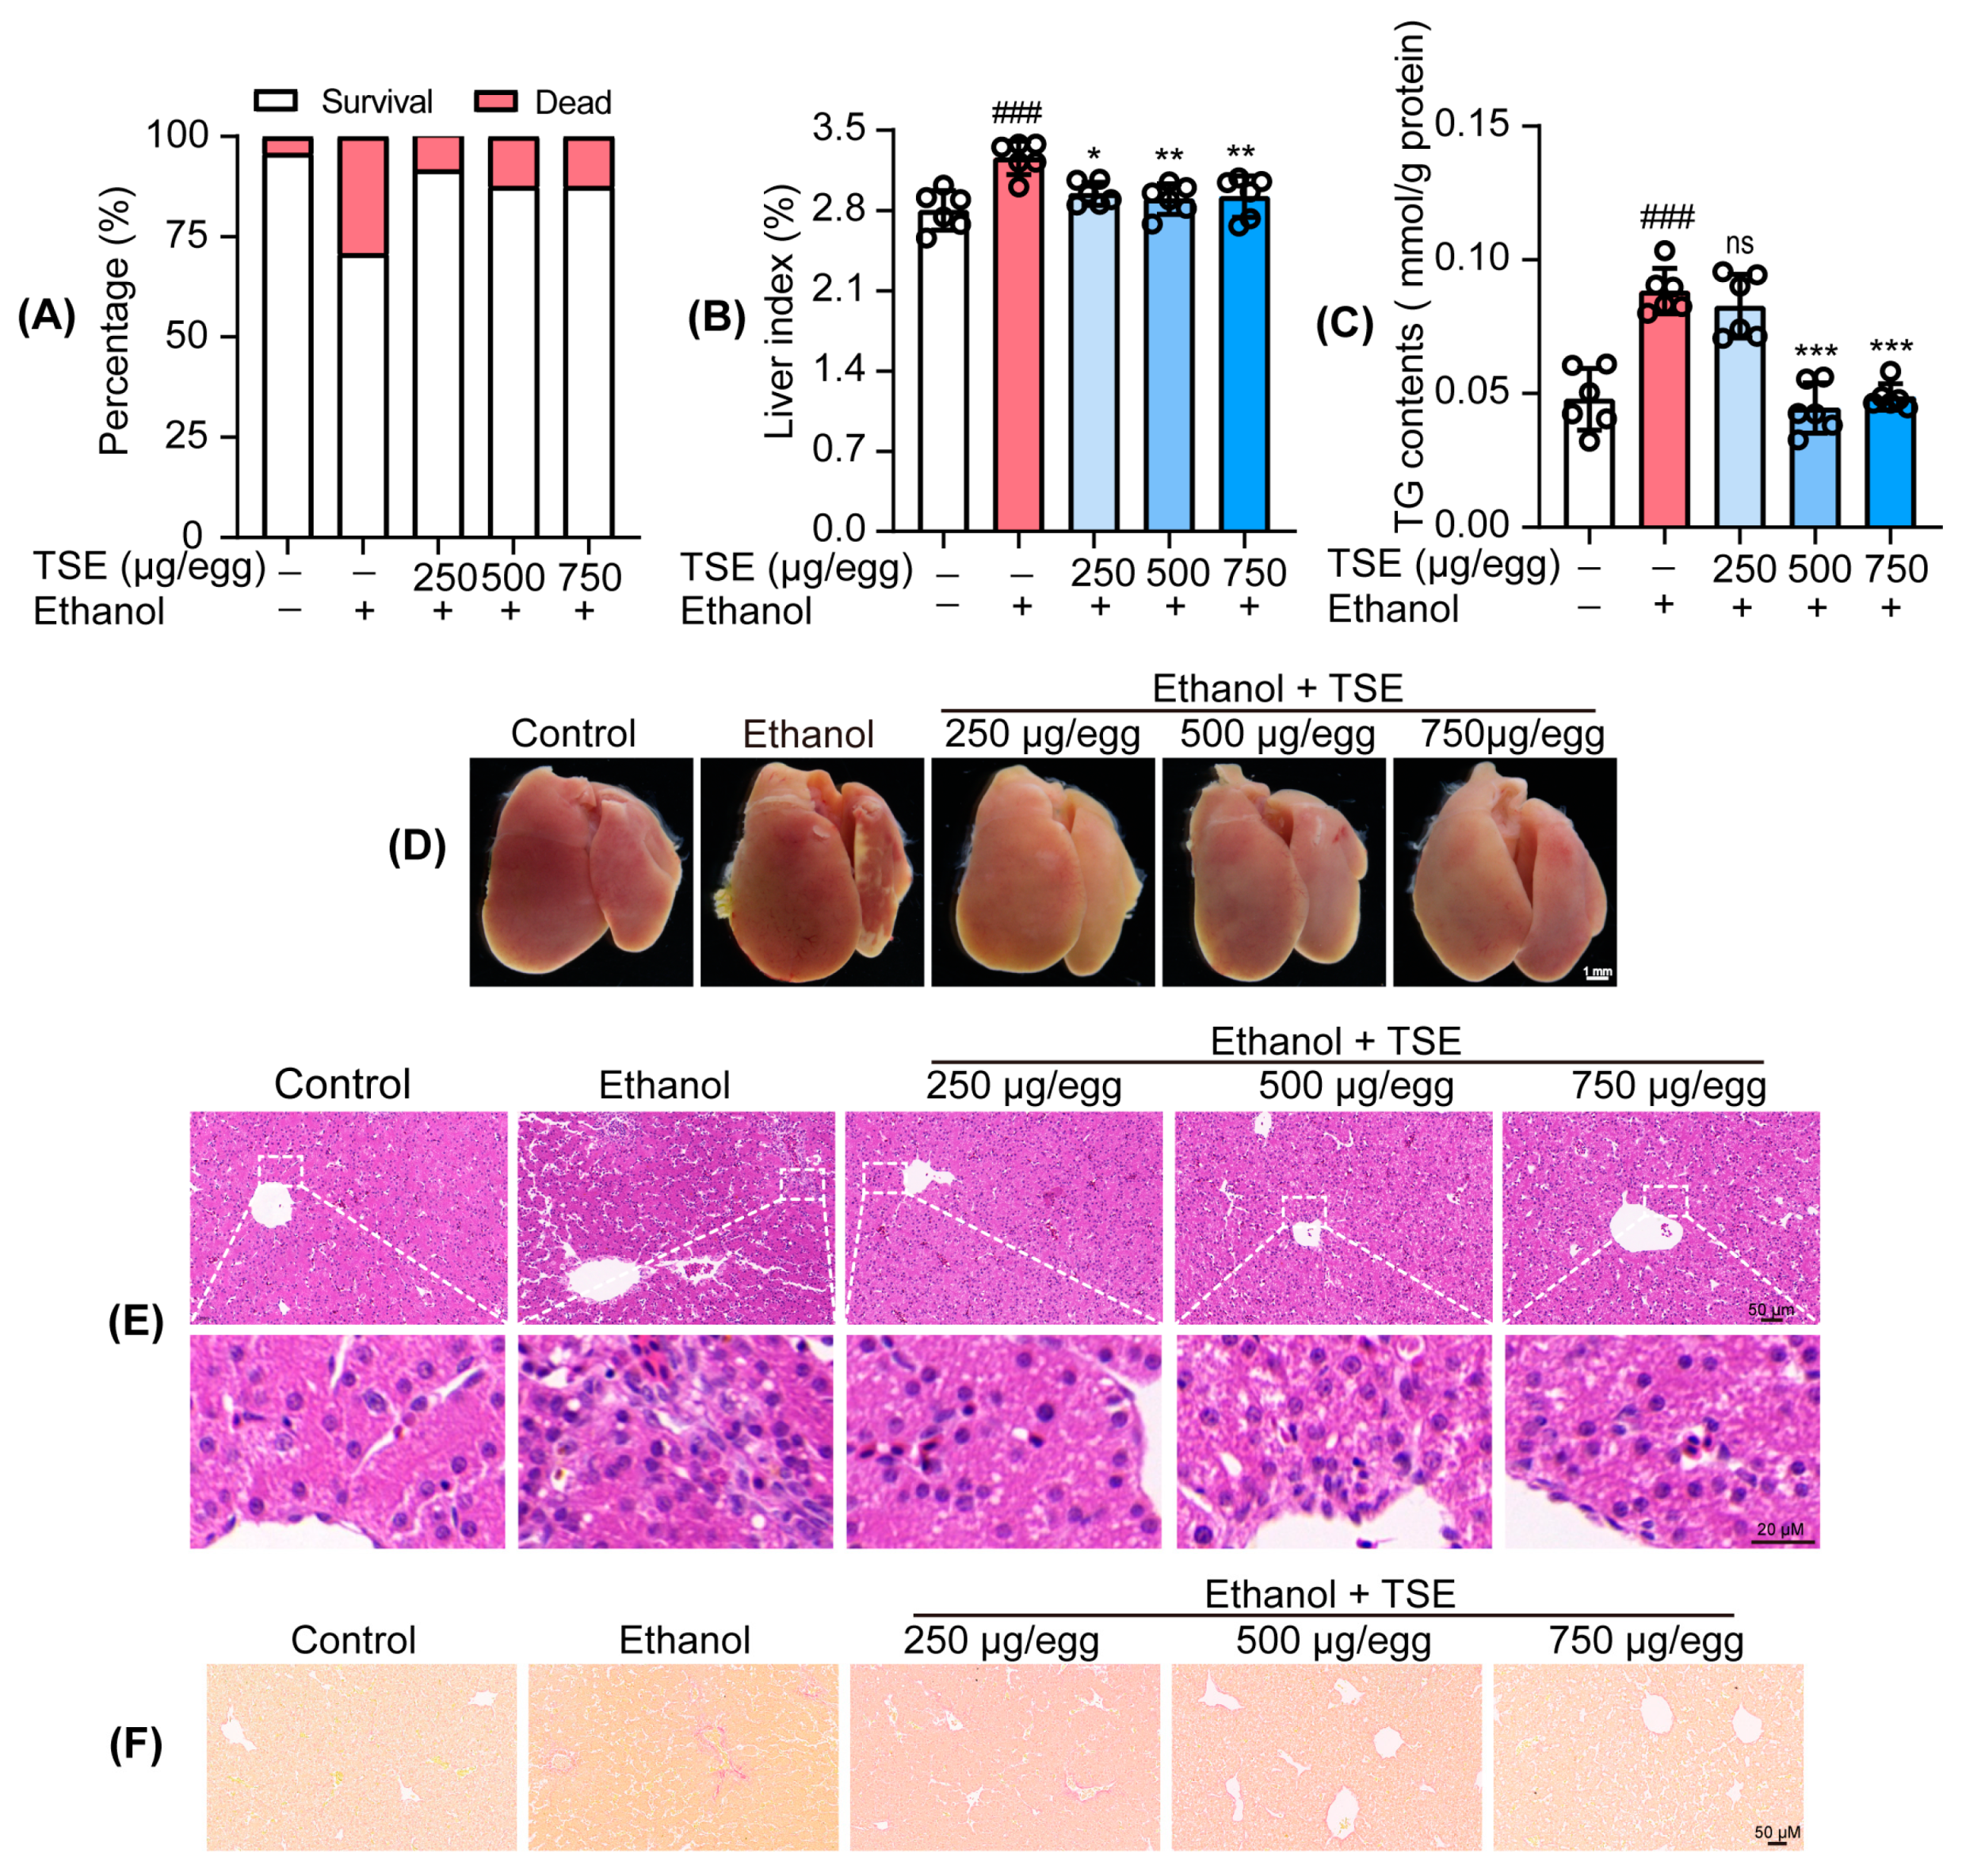
3.3. TSE Ameliorated Ethanol-Provoked Liver Dysfunction and Alleviated Liver Injury in Chicken Embryos
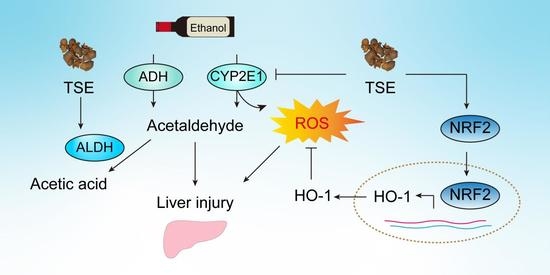
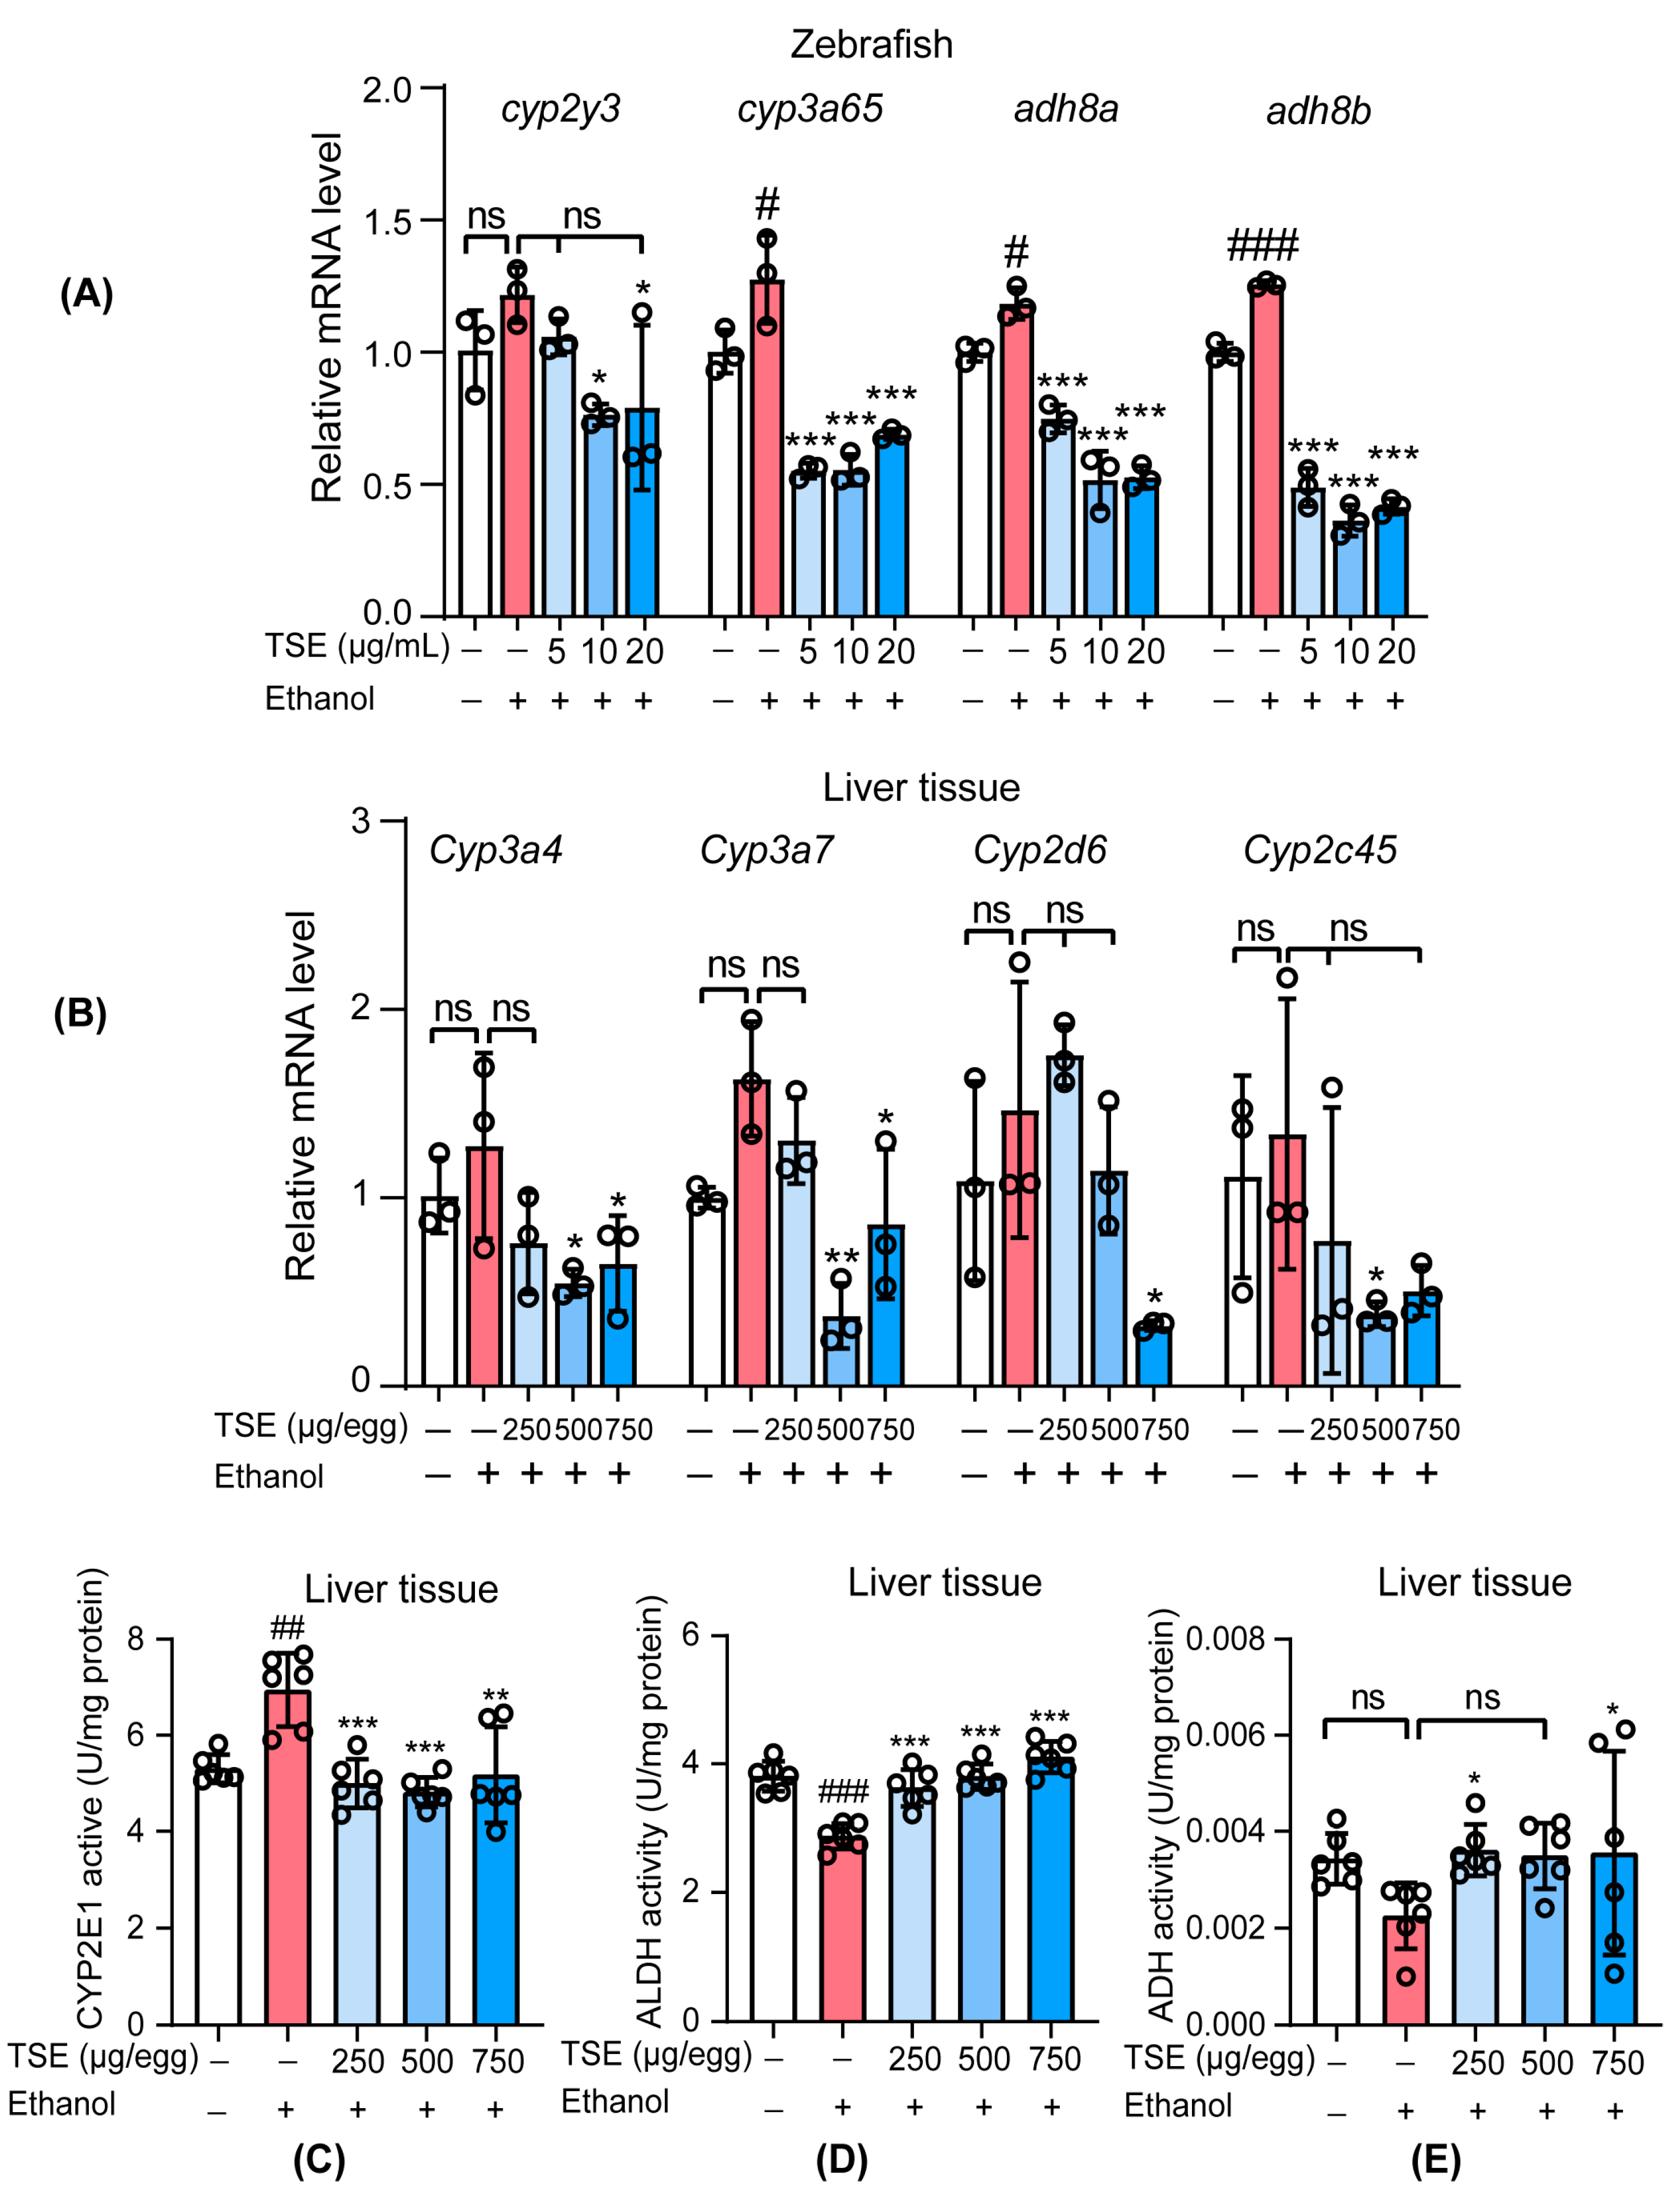
3.4. TSE Corrected the Disorder of Ethanol-Metabolic Enzymes In Vivo
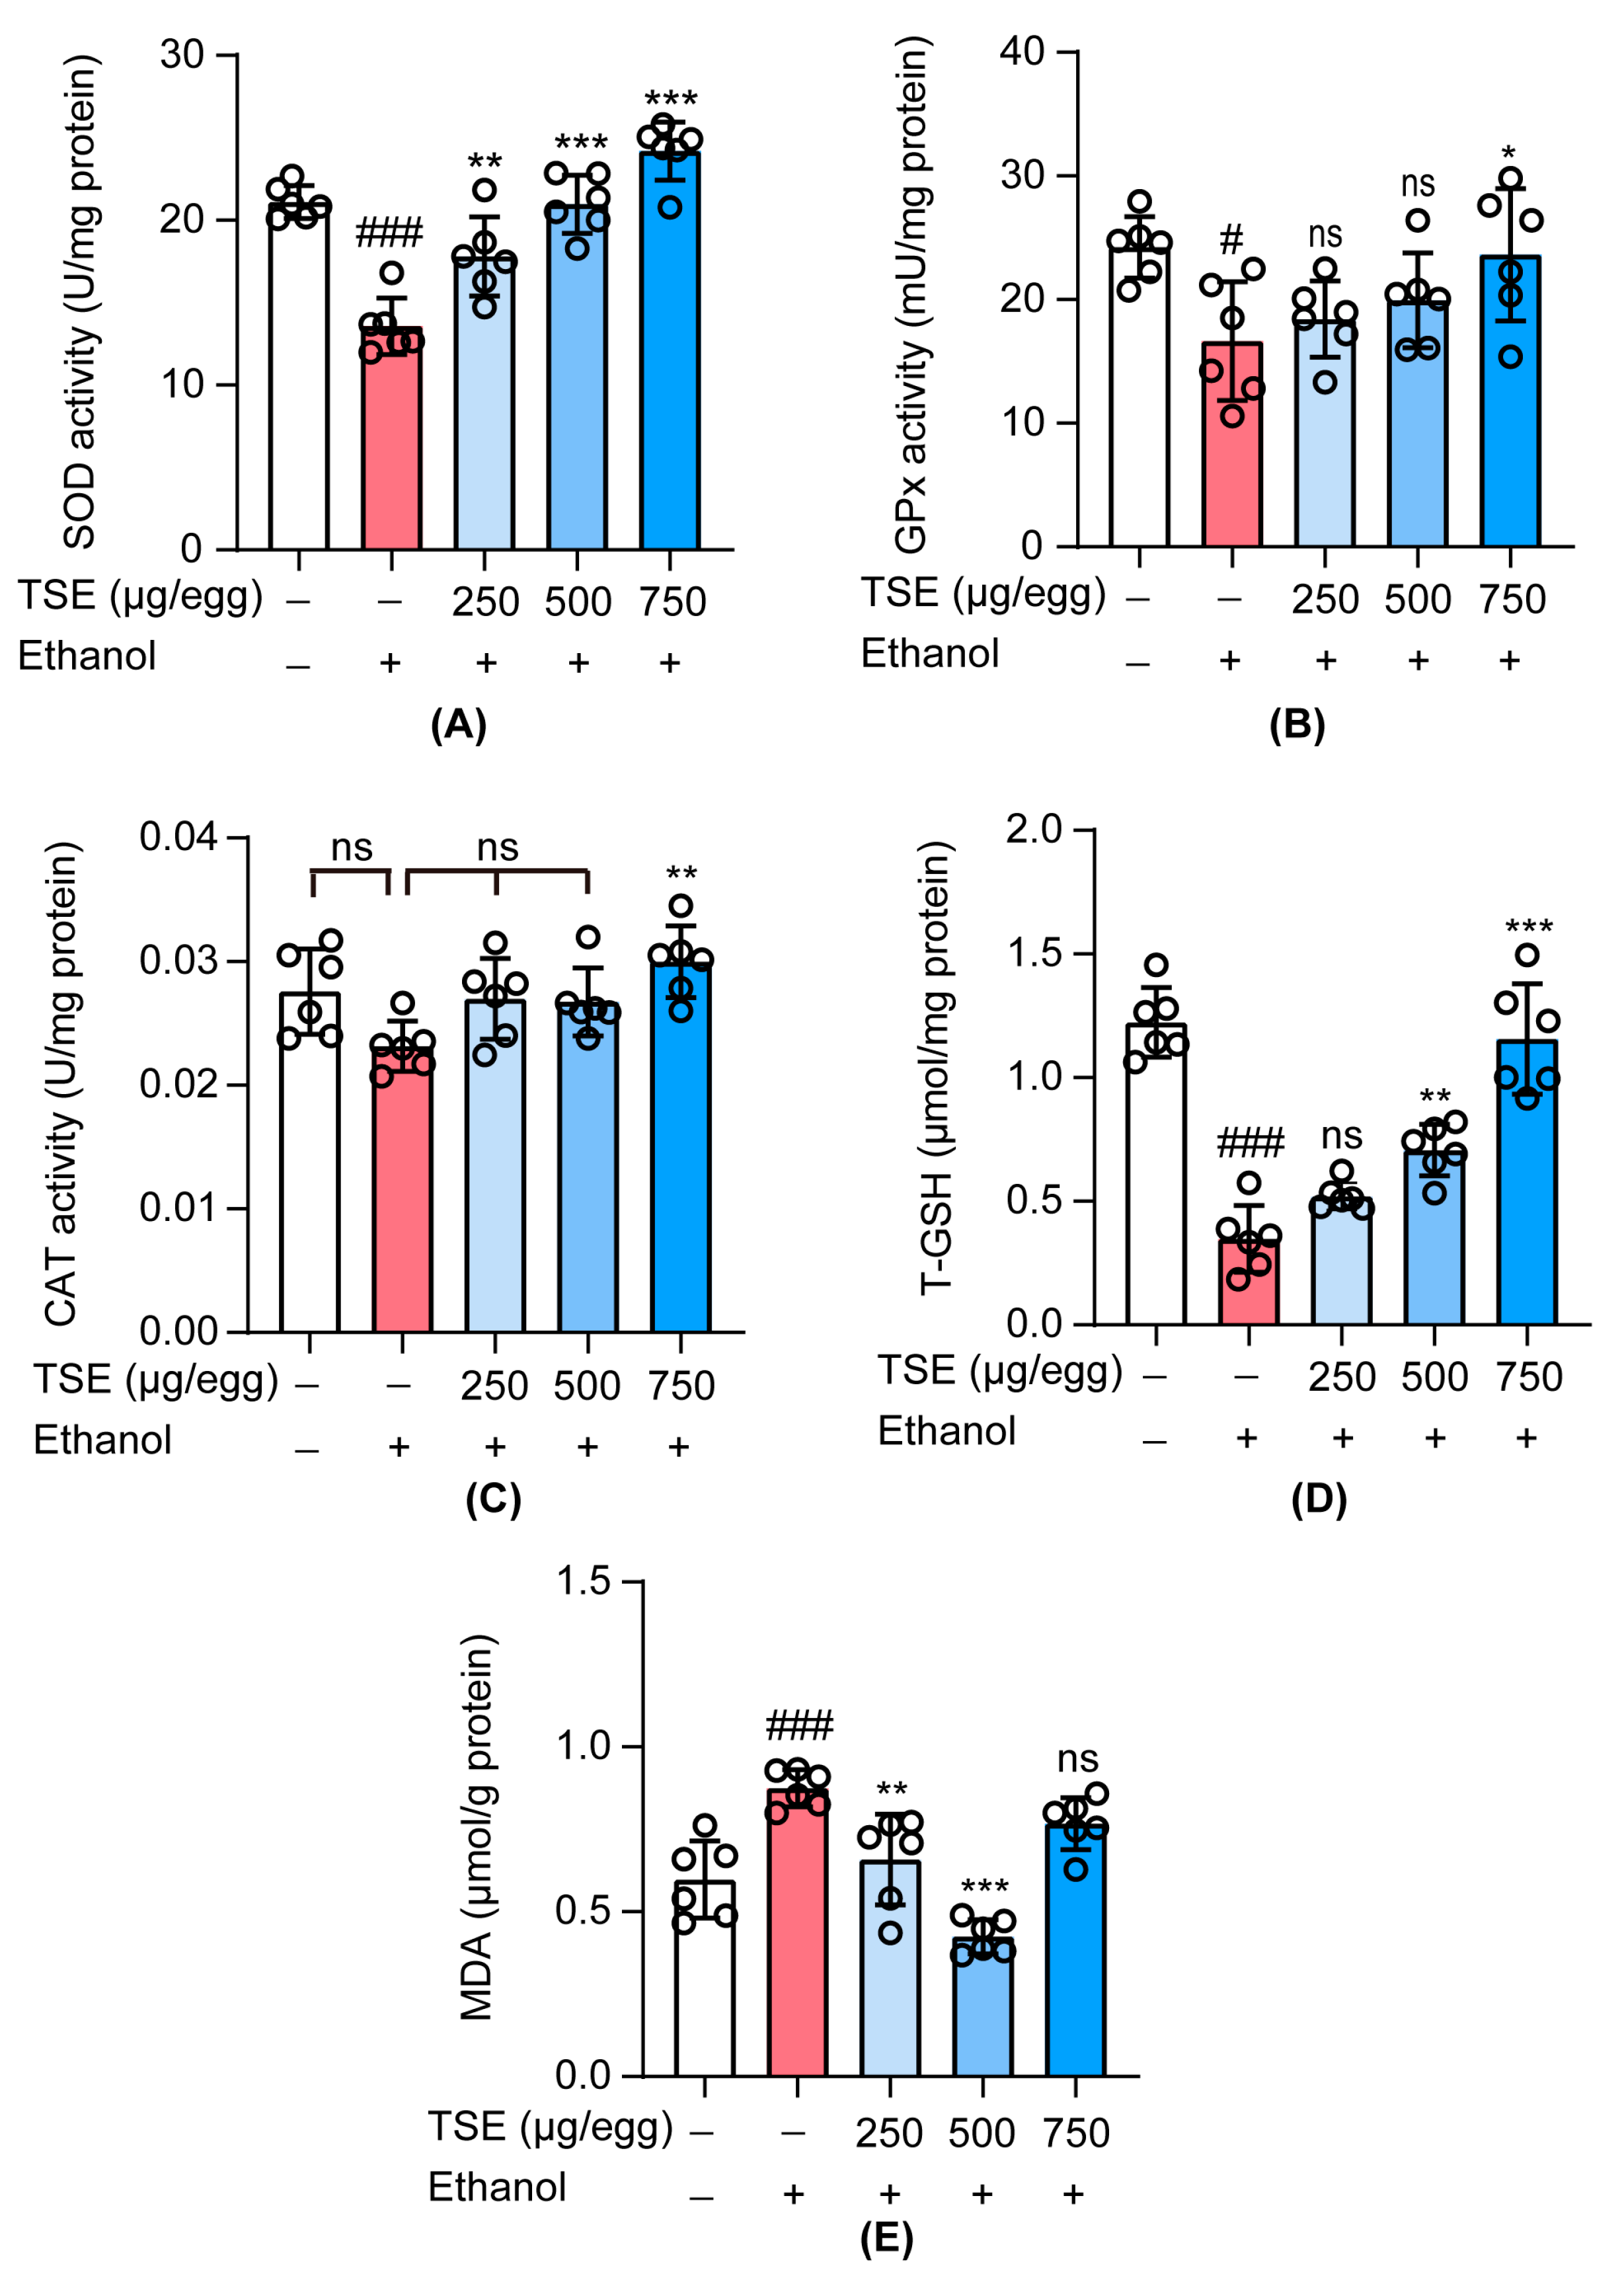
3.5. TSE Attenuated Oxidative Stress in Ethanol-Induced Chick Embryo Livers
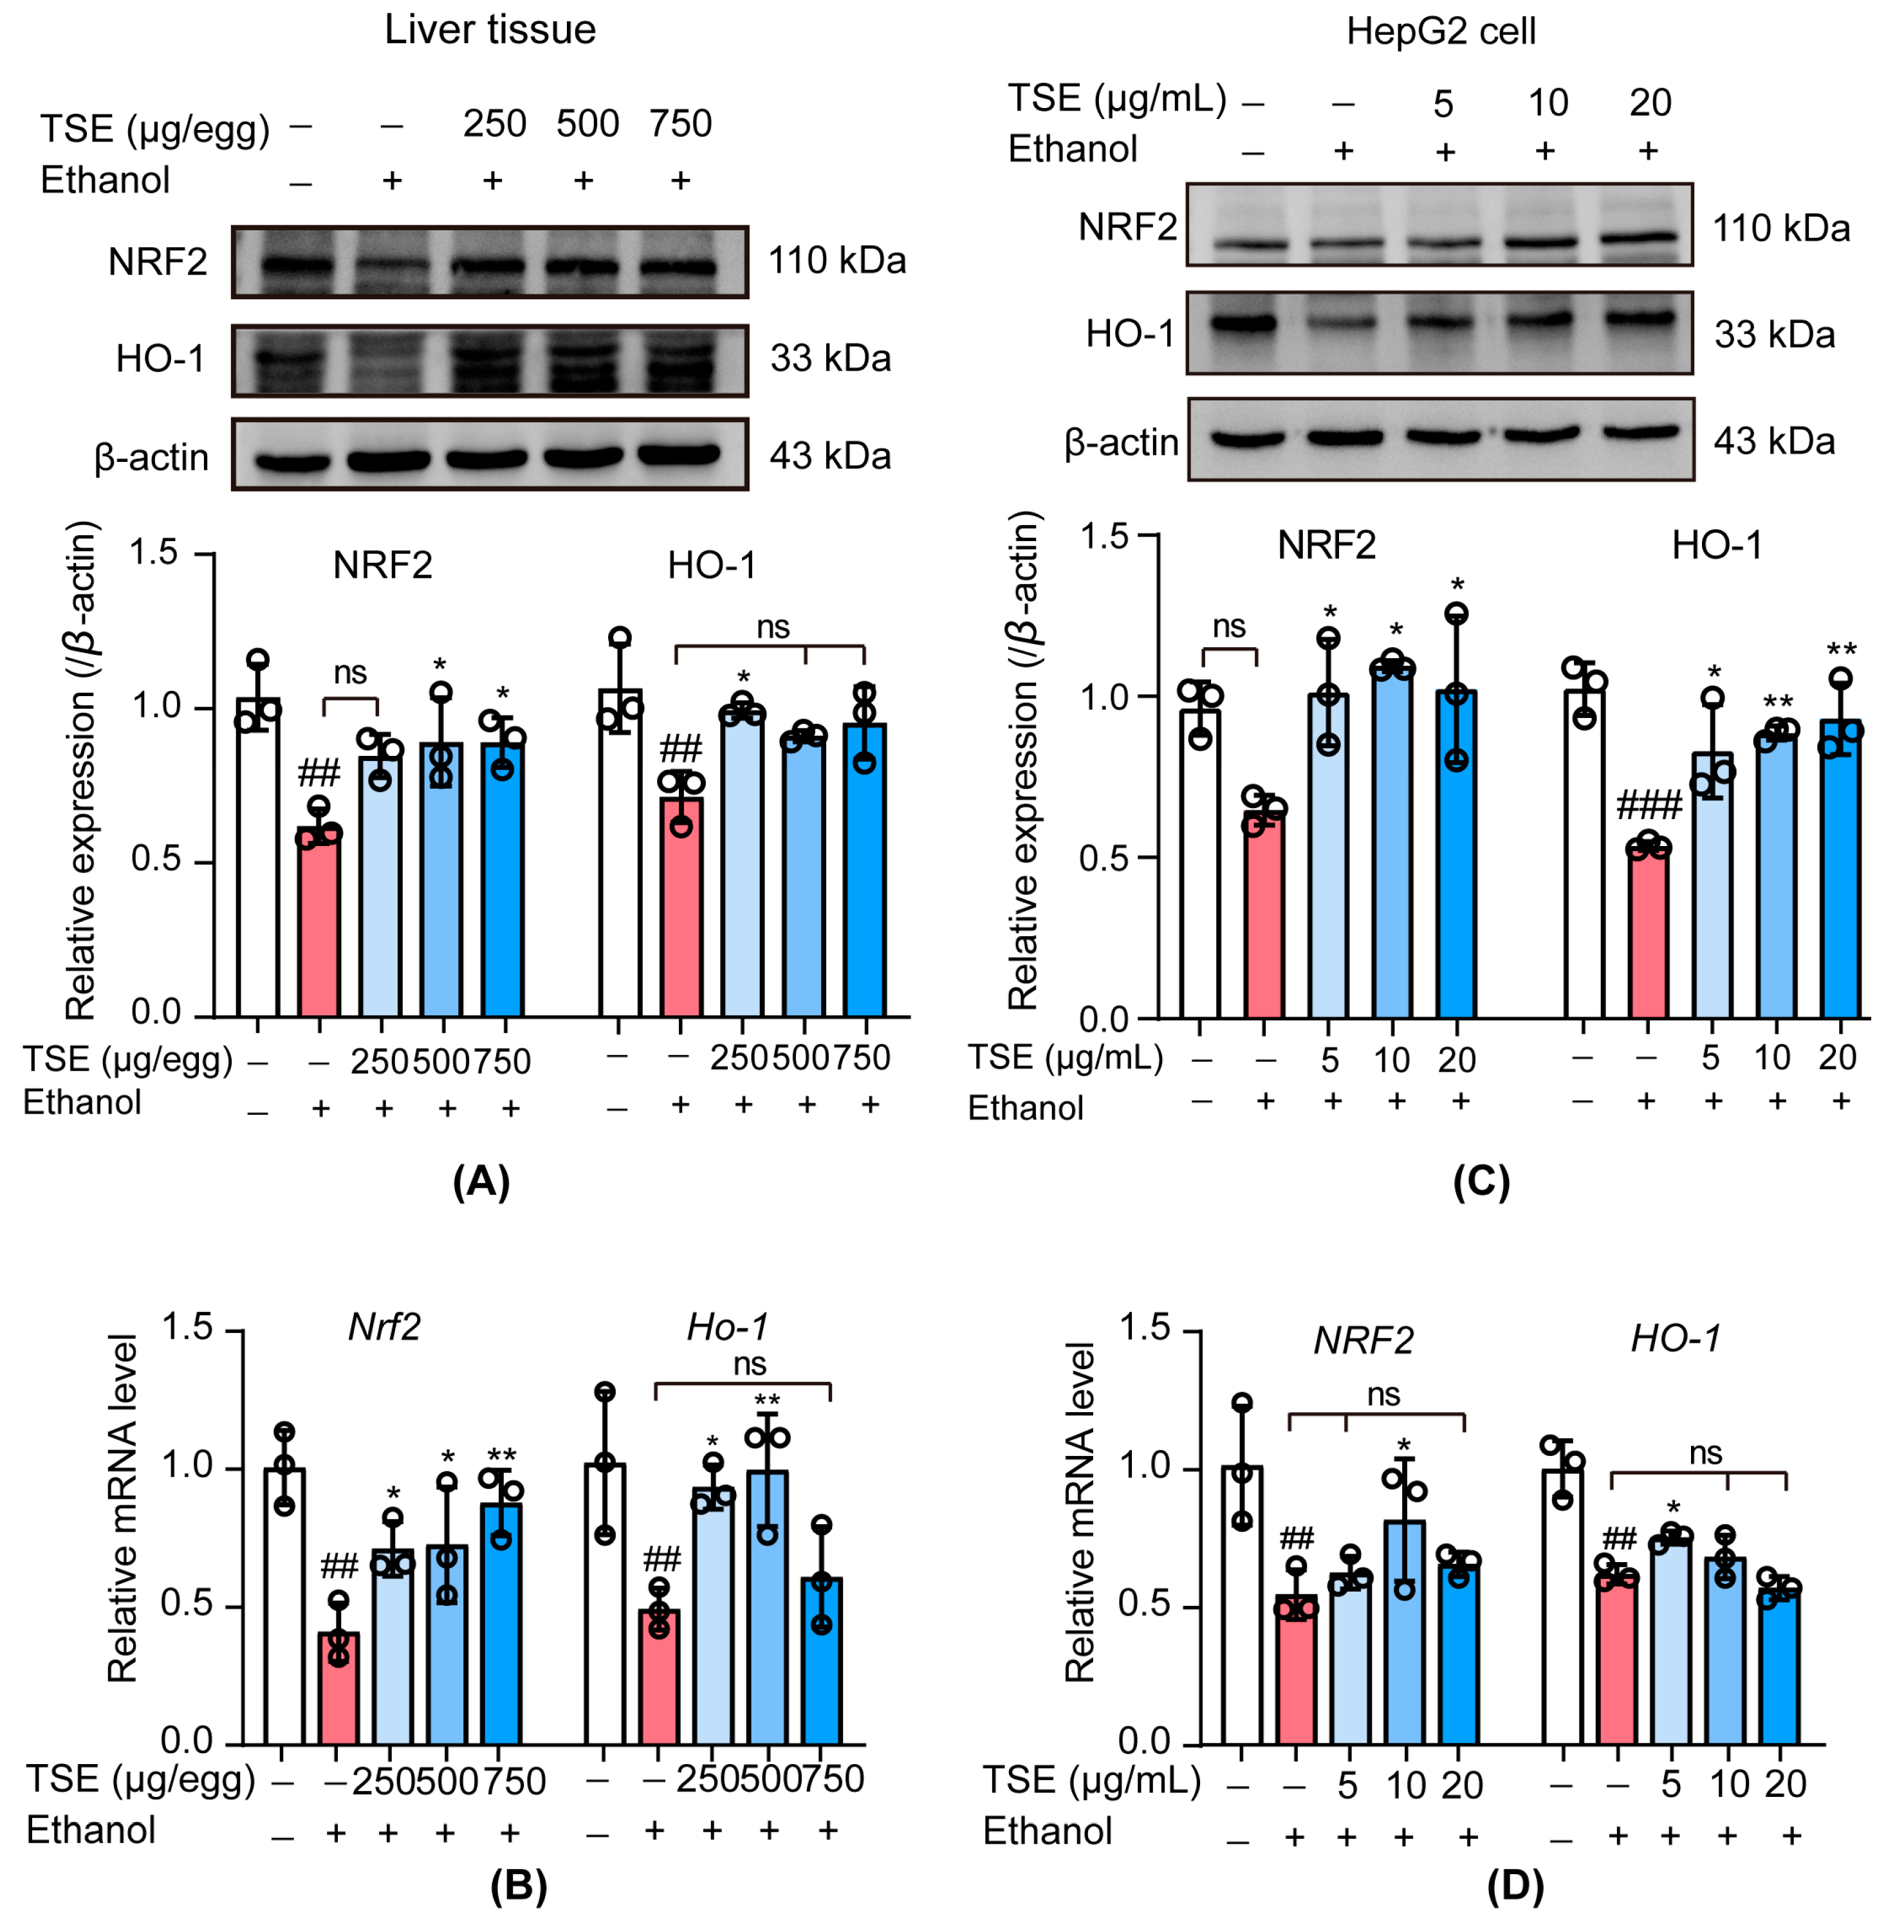
3.6. TSE Activated the Nuclear Factor Erythrocyte-2-Related Factor 2 (NRF2)-Mediated Antioxidant Response
4. Discussion
5. Conclusions
Author Contributions
Funding
Institutional Review Board Statement
Informed Consent Statement
Data Availability Statement
Acknowledgments
Conflicts of Interest
References
- Penning, R.; McKinney, A.; Verster, J.C. Alcohol hangover symptoms and their contribution to the overall hangover severity. Alcohol. Alcohol. 2012, 47, 248–252. [Google Scholar] [CrossRef] [PubMed]
- Madushani Herath, K.; Bing, S.J.; Cho, J.; Kim, A.; Kim, G.; Kim, J.S.; Kim, J.B.; Doh, Y.H.; Jee, Y. Sasa quelpaertensis leaves ameliorate alcohol-induced liver injury by attenuating oxidative stress in HepG2 cells and mice. Acta Histochem. 2018, 120, 477–489. [Google Scholar] [CrossRef]
- Niemelä, O.; Parkkila, S.; Juvonen, R.O.; Viitala, K.; Gelboin, H.V.; Pasanen, M. Cytochromes P450 2A6, 2E1, and 3A and production of protein-aldehyde adducts in the liver of patients with alcoholic and non-alcoholic liver diseases. J. Hepatol. 2000, 33, 893–901. [Google Scholar] [CrossRef] [PubMed]
- Cardoso, J.L.; Lanchote, V.L.; Pereira, M.P.; Capela, J.M.; de Moraes, N.V.; Lepera, J.S. Impact of inhalational exposure to ethanol fuel on the pharmacokinetics of verapamil, ibuprofen and fluoxetine as in vivo probe drugs for CYP3A, CYP2C and CYP2D in rats. Food Chem. Toxicol. 2015, 84, 99–105. [Google Scholar] [CrossRef] [PubMed]
- Teschke, R. Alcoholic Liver Disease: Alcohol Metabolism, Cascade of Molecular Mechanisms, Cellular Targets, and Clinical Aspects. Biomedicines 2018, 6, 106. [Google Scholar] [CrossRef]
- Teschke, R.; Neuman, M.G.; Liangpunsakul, S.; Seitz, H.-K. Alcoholic Liver Disease and the co-triggering Role of MEOS with Its CYP 2E1 Catalytic Cycle and ROS. Arch. Gastroenterol. Res. 2021, 2, 9–25. [Google Scholar]
- Yahia, E.M.; Salih, N.K.E. Tamarind (Tamarindus indica L.). In Postharvest Biology and Technology of Tropical and Subtropical Fruits; Yahia, E.M., Ed.; Woodhead Publishing: Cambridge, UK, 2011; pp. 442–458e. [Google Scholar]
- Chimsah, F.A.; Nyarko, G.; Abubakari, A.H. A review of explored uses and study of nutritional potential of tamarind (Tamarindus indica L.) in Northern Ghana. Afr. J. Food Sci. 2020, 14, 285–294. [Google Scholar] [CrossRef]
- Liman, M.; Atawodi, S. Hepatoprotective and Nephroprotective Effects of Methanolic Extract of Different Parts of Tamarindus Indica Linn in Rats Following Acute and Chronic Carbon Tetrachloride Intoxication. Annu. Res. Rev. Biol. 2015, 5, 109–123. [Google Scholar] [CrossRef]
- Li, W.; Huang, R.; Han, S.; Li, X.; Gong, H.; Zhang, Q.; Yan, C.; Li, Y.; He, R. Potential of Tamarind Shell Extract against Oxidative Stress In Vivo and In Vitro. Molecules 2023, 28, 1885. [Google Scholar] [CrossRef]
- Westerfield, M. The Zebrafish Book: A Guide for the Laboratory Use of Zebrafish; Inst of Neuro Science: Eugene, OR, USA, 2000; Available online: http://zfin.org/zf_info/zfbook/zfbk.html (accessed on 5 May 2022).
- Liu, Y.S.; Yuan, M.H.; Zhang, C.Y.; Liu, H.M.; Liu, J.R.; Wei, A.L.; Ye, Q.; Zeng, B.; Li, M.F.; Guo, Y.P.; et al. Puerariae Lobatae radix flavonoids and puerarin alleviate alcoholic liver injury in zebrafish by regulating alcohol and lipid metabolism. Biomed. Pharm. 2021, 134, 111121. [Google Scholar] [CrossRef]
- Zhang, Q.Y.; Han, S.C.; Huang, R.P.; Jiang, M.Y.; Yan, C.Y.; Li, X.Y.; Zhan, Y.J.; Li, X.M.; Li, Y.F.; Kurihara, H.; et al. Cyclo(-Phe-Phe) alleviates chick embryo liver injury via activating the Nrf2 pathway. Food Funct. 2022, 13, 6962–6974. [Google Scholar] [CrossRef] [PubMed]
- Wang, M.; Ruan, Y.; Chen, Q.; Li, S.; Wang, Q.; Cai, J. Curcumin induced HepG2 cell apoptosis-associated mitochondrial membrane potential and intracellular free Ca2+ concentration. Eur. J. Pharmacol. 2011, 650, 41–47. [Google Scholar] [CrossRef] [PubMed]
- Kluver, N.; Ortmann, J.; Paschke, H.; Renner, P.; Ritter, A.P.; Scholz, S. Transient overexpression of adh8a increases allyl alcohol toxicity in zebrafish embryos. PLoS ONE 2014, 9, e90619. [Google Scholar] [CrossRef] [PubMed]
- Guo, K.; Ge, J.; Zhang, C.; Lv, M.W.; Zhang, Q.; Talukder, M.; Li, J.L. Cadmium induced cardiac inflammation in chicken (Gallus gallus) via modulating cytochrome P450 systems and Nrf2 mediated antioxidant defense. Chemosphere 2020, 249, 125858. [Google Scholar] [CrossRef]
- Koch, O.R.; Pani, G.; Borrello, S.; Colavitti, R.; Cravero, A.; Farre, S.; Galeotti, T. Oxidative stress and antioxidant defenses in ethanol-induced cell injury. Mol. Aspects Med. 2004, 25, 191–198. [Google Scholar] [CrossRef]
- Zheng, J.; Tian, X.; Zhang, W.; Zheng, P.; Huang, F.; Ding, G.; Yang, Z. Protective Effects of Fucoxanthin against Alcoholic Liver Injury by Activation of Nrf2-Mediated Antioxidant Defense and Inhibition of TLR4-Mediated Inflammation. Mar. Drugs 2019, 17, 552. [Google Scholar] [CrossRef]
- Zhao, H.; Zhang, J.; Liu, X.; Yang, Q.; Dong, Y.; Jia, L. The antioxidant activities of alkalic-extractable polysaccharides from Coprinus comatus on alcohol-induced liver injury in mice. Sci. Rep. 2018, 8, 11695. [Google Scholar] [CrossRef] [PubMed]
- Shu, G.; Qiu, Y.; Hao, J.; Fu, Q.; Deng, X. Nuciferine alleviates acute alcohol-induced liver injury in mice: Roles of suppressing hepatic oxidative stress and inflammation via modulating miR-144/Nrf2/HO-1 cascade. J. Funct. Foods 2019, 58, 105–113. [Google Scholar] [CrossRef]
- Zhou, Y.; Tan, F.; Li, C.; Li, W.; Liao, W.; Li, Q.; Qin, G.; Liu, W.; Zhao, X. White Peony (Fermented Camellia sinensis) Polyphenols Help Prevent Alcoholic Liver Injury via Antioxidation. Antioxidants 2019, 8, 524. [Google Scholar] [CrossRef]
- Lai, Y.; Zhou, C.; Huang, P.; Dong, Z.; Mo, C.; Xie, L.; Lin, H.; Zhou, Z.; Deng, G.; Liu, Y.; et al. Polydatin alleviated alcoholic liver injury in zebrafish larvae through ameliorating lipid metabolism and oxidative stress. J. Pharmacol. Sci. 2018, 138, 46–53. [Google Scholar] [CrossRef]
- Kubiak-Tomaszewska, G.; Tomaszewski, P.; Pachecka, J.; Struga, M.; Olejarz, W.; Mielczarek-Puta, M.; Nowicka, G. Molecular mechanisms of ethanol biotransformation: Enzymes of oxidative and nonoxidative metabolic pathways in human. Xenobiotica 2020, 50, 1180–1201. [Google Scholar] [CrossRef] [PubMed]
- Chen, Y.; Akhtar, M.; Ma, Z.; Hu, T.; Liu, Q.; Pan, H.; Zhang, X.; Nafady, A.A.; Ansari, A.R.; Abdel-Kafy, E.-S.M.; et al. Chicken cecal microbiota reduces abdominal fat deposition by regulating fat metabolism. Res. Sq. 2022. [Google Scholar] [CrossRef]
- Nagappan, A.; Jung, D.Y.; Kim, J.H.; Lee, H.; Jung, M.H. Gomisin N Alleviates Ethanol-Induced Liver Injury through Ameliorating Lipid Metabolism and Oxidative Stress. Int. J. Mol. Sci. 2018, 19, 2601. [Google Scholar] [CrossRef] [PubMed]
- Wang, X.; Liu, M.; Zhang, C.; Li, S.; Yang, Q.; Zhang, J.; Gong, Z.; Han, J.; Jia, L. Antioxidant Activity and Protective Effects of Enzyme-Extracted Oudemansiella radiata Polysaccharides on Alcohol-Induced Liver Injury. Molecules 2018, 23, 481. [Google Scholar] [CrossRef]
- Nagappan, A.; Kim, J.H.; Jung, D.Y.; Jung, M.H. Cryptotanshinone from the Salvia miltiorrhiza Bunge Attenuates Ethanol-Induced Liver Injury by Activation of AMPK/SIRT1 and Nrf2 Signaling Pathways. Int. J. Mol. Sci. 2019, 21, 265. [Google Scholar] [CrossRef]
- Hou, R.; Liu, X.; Yan, J.; Xiang, K.; Wu, X.; Lin, W.; Chen, G.; Zheng, M.; Fu, J. Characterization of natural melanin from Auricularia auricula and its hepatoprotective effect on acute alcohol liver injury in mice. Food Funct. 2019, 10, 1017–1027. [Google Scholar] [CrossRef]
- Jiang, X.; Zhou, Y.; Zhang, Y.; Tian, D.; Jiang, S.; Tang, Y. Hepatoprotective effect of pyrroloquinoline quinone against alcoholic liver injury through activating Nrf2-mediated antioxidant and inhibiting TLR4-mediated inflammation responses. Process. Biochem. 2020, 92, 303–312. [Google Scholar] [CrossRef]
- Wong, G.K.; Cavey, M.J. Development of the liver in the chicken embryo. I. Hepatic cords and sinusoids. Anat. Rec. 1992, 234, 555–567. [Google Scholar] [CrossRef]
- Yokouchi, Y. Establishment of a chick embryo model for analyzing liver development and a search for candidate genes. Dev. Growth Differ. 2005, 47, 357–366. [Google Scholar] [CrossRef]
- Lin, L.P.S. Observation of HistologicaI Development Process of Didestive Organs in Chicken Embryo. Feed Rev. 2015, 6–10. [Google Scholar] [CrossRef]
- Martínez-Jiménez, C.P.; Jover, R.; Teresa Donato, M.; Castell, J.V.; Jose Gomez-Lechon, M. Transcriptional regulation and expression of CYP3A4 in hepatocytes. Curr. Drug Metab. 2007, 8, 185–194. [Google Scholar] [CrossRef] [PubMed]
- Hu, K.; Xiao, L.; Li, L.; Shen, Y.; Yang, Y.; Huang, J.; Wang, Y.; Zhang, L.; Wen, S.; Tang, L. The mitochondria-targeting antioxidant MitoQ alleviated lipopolysaccharide/ d-galactosamine-induced acute liver injury in mice. Immunol. Lett. 2021, 240, 24–30. [Google Scholar] [CrossRef]
- Peter Guengerich, F.; Avadhani, N.G. Roles of Cytochrome P450 in Metabolism of Ethanol and Carcinogens. Adv. Exp. Med. Biol. 2018, 1032, 15–35. [Google Scholar] [CrossRef]
- Rajput, S.A.; Shaukat, A.; Wu, K.; Rajput, I.R.; Baloch, D.M.; Akhtar, R.W.; Raza, M.A.; Najda, A.; Rafal, P.; Albrakati, A.; et al. Luteolin Alleviates AflatoxinB(1)-Induced Apoptosis and Oxidative Stress in the Liver of Mice through Activation of Nrf2 Signaling Pathway. Antioxidants 2021, 10, 1268. [Google Scholar] [CrossRef] [PubMed]
- Ramezani, A.; Nahad, M.P.; Faghihloo, E. The role of Nrf2 transcription factor in viral infection. J. Cell Biochem. 2018, 119, 6366–6382. [Google Scholar] [CrossRef] [PubMed]


| Species | Gene | Forward Primer (5′–3′) | Reverse Primer (5′–3′) |
|---|---|---|---|
| Zebrafish | cyp2y3 | TATTCCCATGCTGCACTCTG | AGGAGCGTTTACCTGCAGAA |
| Zebrafish | cyp3a65 | AAACCCTGATGAGCATGGAC | CAAGTCTTTGGGGATGAGGA |
| Zebrafish | adh8a | CGAGTACACCGTCATCAAC | AGCACCGAGTCCGAATAC |
| Zebrafish | adh8b | ATTGATGATGATGCTCCTCTG | TAGACCAACCGCACCAAG |
| Zebrafish | gapdh | TGGTGCTGGTATTGCT | TTGCTGTAACCGAACTCA |
| Chicken | Cyp3a4 | TCATAGTGTTGTTCCCCTT | GGTATCCTTCTTCCCGTTC |
| Chicken | Cyp3a7 | GACTCCATGAACAACCCCAA | AAATCTACTCTGCCCGTGTG |
| Chicken | Cyp2d6 | GAACCCTGCTTACATCCGAGA | CATGAACAGGAACGCCCAT |
| Chicken | Cyp2c45 | CGGAGACAACAAGCACCACCA | TTCGTGATCGTCCTACTACCC |
| Chicken | Nrf2 | CATAGAGCAAGTTTGGGAAGAG | GTTTCAGGGCTCGTGATTGT |
| Chicken | Ho-1 | AACGCCACCAAGTTCAGTCTCC | AGCTTCTGCAGCGCCTCAA |
| Chicken | Gapdh | AGAACATCATCCCAGCGT | AGCCTTCACTACCCTCTTG |
| Human | NRF2 | CCTCAACTATAGCGATGCTGAATCT | AGGAGTTGGGCATGAGTGAGTAG |
| Human | HO-1 | CCAGTGCCACCAAGTTCAAG | CAGCTCCTGCAACTCCTCAA |
| Human | GAPDH | GCCTCAAGATCATCAGCAATGC | CCTTCCACGATACCAAAGTTGTCAT |
Disclaimer/Publisher’s Note: The statements, opinions and data contained in all publications are solely those of the individual author(s) and contributor(s) and not of MDPI and/or the editor(s). MDPI and/or the editor(s) disclaim responsibility for any injury to people or property resulting from any ideas, methods, instructions or products referred to in the content. |
© 2023 by the authors. Licensee MDPI, Basel, Switzerland. This article is an open access article distributed under the terms and conditions of the Creative Commons Attribution (CC BY) license (https://creativecommons.org/licenses/by/4.0/).
Share and Cite
Han, S.-C.; Huang, R.-P.; Zhang, Q.-Y.; Yan, C.-Y.; Li, X.-Y.; Li, Y.-F.; He, R.-R.; Li, W.-X. Antialcohol and Hepatoprotective Effects of Tamarind Shell Extract on Ethanol-Induced Damage to HepG2 Cells and Animal Models. Foods 2023, 12, 1078. https://doi.org/10.3390/foods12051078
Han S-C, Huang R-P, Zhang Q-Y, Yan C-Y, Li X-Y, Li Y-F, He R-R, Li W-X. Antialcohol and Hepatoprotective Effects of Tamarind Shell Extract on Ethanol-Induced Damage to HepG2 Cells and Animal Models. Foods. 2023; 12(5):1078. https://doi.org/10.3390/foods12051078
Chicago/Turabian StyleHan, Shao-Cong, Rong-Ping Huang, Qiong-Yi Zhang, Chang-Yu Yan, Xi-You Li, Yi-Fang Li, Rong-Rong He, and Wei-Xi Li. 2023. "Antialcohol and Hepatoprotective Effects of Tamarind Shell Extract on Ethanol-Induced Damage to HepG2 Cells and Animal Models" Foods 12, no. 5: 1078. https://doi.org/10.3390/foods12051078
APA StyleHan, S.-C., Huang, R.-P., Zhang, Q.-Y., Yan, C.-Y., Li, X.-Y., Li, Y.-F., He, R.-R., & Li, W.-X. (2023). Antialcohol and Hepatoprotective Effects of Tamarind Shell Extract on Ethanol-Induced Damage to HepG2 Cells and Animal Models. Foods, 12(5), 1078. https://doi.org/10.3390/foods12051078