
Emotions and Food Consumption: Emotional Eating Behavior in a European Population

 ,
,  , , , ,
  , ,
, ,  ,
,  ,
,  , ,
, , 
 and
and 
Abstract
1. Introduction
2. Materials and Methods
2.1. Participants
2.2. Questionnaire
2.3. Statistical Methods
3. Results
3.1. Demographic Characteristics of the Study Groups
3.2. Lifestyle Habits and Health Motivation Eating Behavior
3.3. Emotional Conditions of Food Consumption
3.4. Consuming Food as a Way of Coping with Stress and Depression
3.5. Finding Emotional Consolation in Food Consumption
3.6. Improving Physical and Psychological Conditions through Food Consumption
4. Discussion
Limitations
5. Conclusions
Supplementary Materials
Author Contributions
Funding
Data Availability Statement
Acknowledgments
Conflicts of Interest
References
- Adolphs, R.; Mlodinow, L.; Barrett, L.F. What Is an Emotion? Curr. Biol. 2019, 29, R1060. [Google Scholar] [CrossRef] [PubMed]
- Šimić, G.; Tkalčić, M.; Vukić, V.; Mulc, D.; Španić, E.; Šagud, M.; Olucha-Bordonau, F.E.; Vukšić, M.; Hof, P.R. Understanding Emotions: Origins and Roles of the Amygdala. Biomolecules 2021, 11, 823. [Google Scholar] [CrossRef] [PubMed]
- Izard, C.E. Emotion Theory and Research: Highlights, Unanswered Questions, and Emerging Issues. Annu. Rev. Psychol. 2009, 60, 1. [Google Scholar] [CrossRef] [PubMed]
- Fuente González, C.E.; Chávez-Servín, J.L.; De La Torre-Carbot, K.; Ronquillo González, D.; Aguilera Barreiro, M.D.L.Á.; Ojeda Navarro, L.R. Relationship between Emotional Eating, Consumption of Hyperpalatable Energy-Dense Foods, and Indicators of Nutritional Status: A Systematic Review. J. Obes. 2022, 2022. [Google Scholar] [CrossRef]
- Devonport, T.J.; Nicholls, W.; Fullerton, C. A Systematic Review of the Association between Emotions and Eating Behaviour in Normal and Overweight Adult Populations. J. Health Psychol. 2019, 24, 3–24. [Google Scholar] [CrossRef]
- Samuel, L.; Cohen, M. Expressive Suppression and Emotional Eating in Older and Younger Adults: An Exploratory Study. Arch. Gerontol. Geriatr. 2018, 78, 127–131. [Google Scholar] [CrossRef]
- Webb, H.J.; Kerin, J.L.; Zimmer-Gembeck, M.J. Increases in Emotional Eating During Early Adolescence and Associations With Appearance Teasing by Parents and Peers, Rejection, Victimization, Depression, and Social Anxiety. J. Early Adolesc. 2020, 41, 754–777. [Google Scholar] [CrossRef]
- Shriver, L.H.; Dollar, J.M.; Calkins, S.D.; Keane, S.P.; Shanahan, L.; Wideman, L. Emotional Eating in Adolescence: Effects of Emotion Regulation, Weight Status and Negative Body Image. Nutrients 2021, 13, 79. [Google Scholar] [CrossRef]
- Su, X.; Liang, H.; Yuan, W.; Olsen, J.; Cnattingius, S.; Li, J. Prenatal and Early Life Stress and Risk of Eating Disorders in Adolescent Girls and Young Women. Eur. Child Adolesc. Psychiatry 2016, 25, 1245–1253. [Google Scholar] [CrossRef]
- Modrzejewska, A.; Czepczor-Bernat, K.; Modrzejewska, J.; Roszkowska, A.; Zembura, M.; Matusik, P. #childhoodobesity—A Brief Literature Review of the Role of Social Media in Body Image Shaping and Eating Patterns among Children and Adolescents. Front. Pediatr. 2022, 10, 1497. [Google Scholar] [CrossRef]
- Lopez-Cepero, A.; Frisard, C.F.; Lemon, S.C.; Rosal, M.C. Association of Dysfunctional Eating Patterns and Metabolic Risk Factors for Cardiovascular Disease among Latinos. J. Acad. Nutr. Diet. 2018, 118, 849–856. [Google Scholar] [CrossRef] [PubMed]
- Konttinen, H.; Van Strien, T.; Männistö, S.; Jousilahti, P.; Haukkala, A. Depression, Emotional Eating and Long-Term Weight Changes: A Population-Based Prospective Study. Int. J. Behav. Nutr. Phys. Act. 2019, 16. [Google Scholar] [CrossRef] [PubMed]
- Morera, L.P.; Marchiori, G.N.; Medrano, L.A.; Defagó, M.D. Stress, Dietary Patterns and Cardiovascular Disease: A Mini-Review. Front. Neurosci. 2019, 13. [Google Scholar] [CrossRef] [PubMed]
- Park, J.H.; Kim, J.Y.; Kim, S.H.; Kim, J.H.; Park, Y.M.; Yeom, H.S. A Latent Class Analysis of Dietary Behaviours Associated with Metabolic Syndrome: A Retrospective Observational Cross-Sectional Study. Nutr. J. 2020, 19. [Google Scholar] [CrossRef]
- Konttinen, H. Emotional Eating and Obesity in Adults: The Role of Depression, Sleep and Genes. Proc. Nutr. Soc. 2020, 79, 283–289. [Google Scholar] [CrossRef]
- Oliver, G.; Wardle, J.; Gibson, E.L. Stress and Food Choice: A Laboratory Study. Psychosom. Med. 2000, 62, 853–865. [Google Scholar] [CrossRef]
- Reichenberger, J.; Schnepper, R.; Arend, A.K.; Blechert, J. Emotional Eating in Healthy Individuals and Patients with an Eating Disorder: Evidence from Psychometric, Experimental and Naturalistic Studies. Proc. Nutr. Soc. 2020, 79, 290. [Google Scholar] [CrossRef]
- Can, Y.S.; Arnrich, B.; Ersoy, C. Stress Detection in Daily Life Scenarios Using Smart Phones and Wearable Sensors: A Survey. J. Biomed. Inform. 2019, 92. [Google Scholar] [CrossRef]
- Malcolm, M.; Frost, H.; Cowie, J. Loneliness and Social Isolation Causal Association with Health-Related Lifestyle Risk in Older Adults: A Systematic Review and Meta-Analysis Protocol. Syst. Rev. 2019, 8. [Google Scholar] [CrossRef]
- Campagne, D.M. Stress and Perceived Social Isolation (Loneliness). Arch. Gerontol. Geriatr. 2019, 82, 192–199. [Google Scholar] [CrossRef]
- McKay, N.; Przybysz, J.; Cavanaugh, A.; Horvatits, E.; Giorgianni, N.; Czajka, K. The Effect of Unhealthy Food and Liking on Stress Reactivity. Physiol. Behav. 2021, 229. [Google Scholar] [CrossRef]
- Macht, M. How Emotions Affect Eating: A Five-Way Model. Appetite 2008, 50, 1–11. [Google Scholar] [CrossRef] [PubMed]
- Torres, S.J.; Nowson, C.A. Relationship between Stress, Eating Behavior, and Obesity. Nutrition 2007, 23, 887–894. [Google Scholar] [CrossRef] [PubMed]
- Williams, D.M. Psychological Hedonism, Hedonic Motivation, and Health Behavior. In Affective Determinants of Health Behavior; Williams, D.M., Rhodes, R.E., Conner, M.T., Eds.; Oxford University Press: Oxford, UK, 2018; pp. 204–234. [Google Scholar]
- Betancourt-Núñez, A.; Torres-Castillo, N.; Martínez-López, E.; De Loera-Rodríguez, C.O.; Durán-Barajas, E.; Márquez-Sandoval, F.; Bernal-Orozco, M.F.; Garaulet, M.; Vizmanos, B. Emotional Eating and Dietary Patterns: Reflecting Food Choices in People with and without Abdominal Obesity. Nutrients 2022, 14, 1371. [Google Scholar] [CrossRef] [PubMed]
- Paans, N.P.G.; Bot, M.; Brouwer, I.A.; Visser, M.; Roca, M.; Kohls, E.; Watkins, E.; Penninx, B.W.J.H. The Association between Depression and Eating Styles in Four European Countries: The MooDFOOD Prevention Study. J. Psychosom. Res. 2018, 108, 85–92. [Google Scholar] [CrossRef] [PubMed]
- Bui, C.; Lin, L.Y.; Wu, C.Y.; Chiu, Y.W.; Chiou, H.Y. Association between Emotional Eating and Frequency of Unhealthy Food Consumption among Taiwanese Adolescents. Nutrients 2021, 13, 2739. [Google Scholar] [CrossRef] [PubMed]
- Finch, L.E.; Cummings, J.R.; Tomiyama, A.J. Cookie or Clementine? Psychophysiological Stress Reactivity and Recovery after Eating Healthy and Unhealthy Comfort Foods. Psychoneuroendocrinology 2019, 107, 26–36. [Google Scholar] [CrossRef]
- Yeung, A.Y.; Tadi, P. Physiology, Obesity Neurohormonal Appetite And Satiety Control. In StatPearls; StatPearls Publishing: Treasure Island, FL, USA, 2022. [Google Scholar]
- Lutter, M.; Nestler, E.J. Homeostatic and Hedonic Signals Interact in the Regulation of Food Intake. J. Nutr. 2009, 139, 629. [Google Scholar] [CrossRef]
- Godet, A.; Fortier, A.; Bannier, E.; Coquery, N.; Val-Laillet, D. Interactions between Emotions and Eating Behaviors: Main Issues, Neuroimaging Contributions, and Innovative Preventive or Corrective Strategies. Rev. Endocr. Metab. Disord. 2022, 23, 807–831. [Google Scholar] [CrossRef]
- Rutters, F.; Nieuwenhuizen, A.G.; Lemmens, S.G.T.; Born, J.M.; Westerterp-Plantenga, M.S. Acute Stress-Related Changes in Eating in the Absence of Hunger. Obesity 2009, 17, 72–77. [Google Scholar] [CrossRef]
- Timmerman, G.M.; Acton, G.J. The Relationship between Basic Need Satisfaction and Emotional Eating. Issues Ment. Health Nurs. 2001, 22, 691–701. [Google Scholar] [CrossRef] [PubMed]
- van Strien, T.; Gibson, E.L.; Baños, R.; Cebolla, A.; Winkens, L.H.H. Is Comfort Food Actually Comforting for Emotional Eaters? A (Moderated) Mediation Analysis. Physiol. Behav. 2019, 211. [Google Scholar] [CrossRef] [PubMed]
- Standen, E.C.; Finch, L.E.; Tiongco-Hofschneider, L.; Schopp, E.; Lee, K.M.; Parker, J.E.; Bamishigbin, O.N.; Tomiyama, A.J. Healthy versus Unhealthy Comfort Eating for Psychophysiological Stress Recovery in Low-Income Black and Latinx Adults. Appetite 2022, 176. [Google Scholar] [CrossRef] [PubMed]
- Centers for Disease Control and Prevention About Chronic Diseases | CDC. Available online: https://www.cdc.gov/chronicdisease/about/index.htm (accessed on 9 September 2022).
- Ferrão, A.C.; Guiné, R.P.F.; Correia, P.; Ferreira, M.; Duarte, J.; Lima, J. Development of a Questionnaire to Assess People’s Food Choices Determinants. Curr. Nutr. Food Sci. 2019, 15, 281–295. [Google Scholar] [CrossRef]
- Guine, R.P.F.; Bartkiene, E.; Ucs, V.S.; Tarcea, M.; Ljubičić, M.; Ernelič-Bizjak, M.C.; Isoldi, K.; El-Kenawy, A.; Ferreira, V.; Straumite, E.; et al. Study about Food Choice Determinants According to Six Types of Conditioning Motivations in a Sample of 11,960 Participants. Foods 2020, 9, 888. [Google Scholar] [CrossRef]
- Guiné Raquel, P.F.; Duarte, J.; Ferrão, A.C.; Ferreira, M.; Correia, P.; Cardoso, A.P.; Bartkiene, E.; Szucs, V.; Nemes, L.; Ljubičić, M.; et al. The Eating Motivations Scale (EATMOT): Development and Validation by Means of Confirmatory Factor Analysis (CFA) and Structural Equation Modelling (SEM). Slov. J. Public Heal. 2021, 60, 4. [Google Scholar] [CrossRef]
- McEwen, B.S.; Bowles, N.P.; Gray, J.D.; Hill, M.N.; Hunter, R.G.; Karatsoreos, I.N.; Nasca, C. Mechanisms of Stress in the Brain. Nat. Neurosci. 2015, 18, 1353. [Google Scholar] [CrossRef]
- Proto, E.; Rustichini, A. A Reassessment of the Relationship between GDP and Life Satisfaction. PLoS One 2013, 8, e79358. [Google Scholar] [CrossRef]
- Jarden, R.J.; Joshanloo, M.; Weijers, D.; Sandham, M.H.; Jarden, A.J. Predictors of Life Satisfaction in New Zealand: Analysis of a National Dataset. Int. J. Environ. Res. Public Health 2022, 19, 5612. [Google Scholar] [CrossRef]
- Tasiemski, T.; Kujawa, J.; Tederko, P.; Rubinelli, S.; Middleton, J.W.; Craig, A.; Post, M.W.M. Comparison of Life Satisfaction in Persons With Spinal Cord Injury Living in 22 Countries With Different Economic Status. Arch. Phys. Med. Rehabil. 2022, 103, 1285–1293. [Google Scholar] [CrossRef]
- Tryon, M.S.; Stanhope, K.L.; Epel, E.S.; Mason, A.E.; Brown, R.; Medici, V.; Havel, P.J.; Laugero, K.D. Excessive Sugar Consumption May Be a Difficult Habit to Break: A View From the Brain and Body. J. Clin. Endocrinol. Metab. 2015, 100, 2239–2247. [Google Scholar] [CrossRef] [PubMed]
- Klatzkin, R.R.; Nolan, L.J.; Kissileff, H.R. Self-Reported Emotional Eaters Consume More Food under Stress If They Experience Heightened Stress Reactivity and Emotional Relief from Stress upon Eating. Physiol. Behav. 2022, 243, 113638. [Google Scholar] [CrossRef] [PubMed]
- Foster, M.T.; Warne, J.P.; Ginsberg, A.B.; Horneman, H.F.; Pecoraro, N.C.; Akana, S.F.; Dallman, M.F. Palatable Foods, Stress, and Energy Stores Sculpt Corticotropin-Releasing Factor, Adrenocorticotropin, and Corticosterone Concentrations after Restraint. Endocrinology 2009, 150, 2325–2333. [Google Scholar] [CrossRef] [PubMed]
- Spiers, J.G.; Chen, H.J.C.; Sernia, C.; Lavidis, N.A. Activation of the Hypothalamic-Pituitary-Adrenal Stress Axis Induces Cellular Oxidative Stress. Front. Neurosci. 2015, 8. [Google Scholar] [CrossRef] [PubMed]
- Chiriac, V.F.; Baban, A.; Dumitrascu, D.L. Psychological Stress and Breast Cancer Incidence: A Systematic Review. Clujul Med. 2018, 91, 18–26. [Google Scholar] [CrossRef]
- Ljubicic, M.; Saric, M.M.; Rumbak, I.; Baric, I.C.; Komes, D.; Satalic, Z.; Guiné, R.P.F. Knowledge about Dietary Fibre and Its Health Benefits: A Cross-Sectional Survey of 2536 Residents from across Croatia. Med. Hypotheses 2017, 105, 25–31. [Google Scholar] [CrossRef]
- Ljubičić, M.; Sarić, M.M.; Barić, I.C.; Rumbak, I.; Komes, D.; Šatalić, Z.; Guiné, R.P.F. Consumer Knowledge and Attitudes toward Healthy Eating in Croatia: A Cross-Sectional Study. Arch. Ind. Hyg. Toxicol. 2017, 68, 153–158. [Google Scholar] [CrossRef]
- Reyneke, G.; Hughes, J.; Grafenauer, S. Consumer Understanding of the Australian Dietary Guidelines: Recommendations for Legumes and Whole Grains. Nutrients 2022, 14, 1753. [Google Scholar] [CrossRef]
- Śmiglak-Krajewska, M.; Wojciechowska-Solis, J. Consumption Preferences of Pulses in the Diet of Polish People: Motives and Barriers to Replace Animal Protein with Vegetable Protein. Nutrients 2021, 13, 454. [Google Scholar] [CrossRef]
- Carfora, V.; Catellani, P. Legumes or Meat? The Effectiveness of Recommendation Messages towards a Plant-Based Diet Depends on People’s Identification with Flexitarians. Nutrients 2022, 15, 15. [Google Scholar] [CrossRef]
- Stults-Kolehmainen, M.A.; Sinha, R. The Effects of Stress on Physical Activity and Exercise. Sports Med. 2014, 44, 81. [Google Scholar] [CrossRef] [PubMed]
- Ljubičić, M.; Sarić, M.M.; Klarin, I.; Rumbak, I.; Barić, I.C.; Ranilović, J.; EL-Kenawy, A.; Papageorgiou, M.; Vittadini, E.; Bizjak, M.Č.; et al. Motivation for Health Behaviour: A Predictor of Adherence to Balanced and Healthy Food across Different Coastal Mediterranean Countries. J. Funct. Foods 2022, 91, 105018. [Google Scholar] [CrossRef]
- Chen, Y.; Chai, L. How Far Are We from the Planetary Health Diet? A Threshold Regression Analysis of Global Diets. Foods 2022, 11, 986. [Google Scholar] [CrossRef] [PubMed]
- Mund, M.; Freuding, M.M.; Möbius, K.; Horn, N.; Neyer, F.J. The Stability and Change of Loneliness Across the Life Span: A Meta-Analysis of Longitudinal Studies. Personal. Soc. Psychol. Rev. 2020, 24, 24. [Google Scholar] [CrossRef] [PubMed]
- Tibiriçá, L.; Jester, D.J.; Jeste, D.V. A Systematic Review of Loneliness and Social Isolation among Hispanic/Latinx Older Adults in the United States. Psychiatry Res. 2022, 313. [Google Scholar] [CrossRef]
- Levine, M.P. Loneliness and Eating Disorders. J. Psychol. 2012, 146, 243–257. [Google Scholar] [CrossRef]
- Howren, M.B.; Higginbotham, J.C. Rural Health in Behavioral Medicine: Introduction to the Special Series. J. Behav. Med. 2021, 44, 437. [Google Scholar] [CrossRef]
- Srinivasan, M.; Reddy, M.M.; Sarkar, S.; Menon, V. Depression, Anxiety, and Stress among Rural South Indian Women-Prevalence and Correlates: A Community-Based Study. J. Neurosci. Rural Pract. 2020, 11, 78–83. [Google Scholar] [CrossRef]
- St John, P.D.; Menec, V.; Tate, R.; Newall, N.E.; Cloutier, D.; O’Connell, M. Depressive Symptoms in Adults in Rural and Urban Regions of Canada: A Cross-Sectional Analysis of the Canadian Longitudinal Study on Aging. BMJ Open 2021, 11. [Google Scholar] [CrossRef]
- Cannon, C.E.B.; Ferreira, R.; Buttell, F.; Anderson, C. Sociodemographic Predictors of Depression in US Rural Communities During COVID-19: Implications for Improving Mental Healthcare Access to Increase Disaster Preparedness. Disaster Med. Public Health Prep. 2022, 17, E208. [Google Scholar] [CrossRef]
- Shufelt, C.; Merz, C.N.B.; Yang, Y.; Kirschner, J.; Polk, D.; Stanczyk, F.; Paul-Labrador, M.; Braunstein, G.D. Red Versus White Wine as a Nutritional Aromatase Inhibitor in Premenopausal Women: A Pilot Study. J. Women’s Heal. 2012, 21, 281. [Google Scholar] [CrossRef] [PubMed]
- Boban, M.; Stockley, C.; Teissedre, P.L.; Restani, P.; Fradera, U.; Stein-Hammer, C.; Ruf, J.C. Drinking Pattern of Wine and Effects on Human Health: Why Should We Drink Moderately and with Meals? Food Funct. 2016, 7, 2937–2942. [Google Scholar] [CrossRef] [PubMed]
- Silva, A.P.; Jager, G.; Van Zyl, H.; Voss, H.P.; Pintado, M.; Hogg, T.; De Graaf, C. Cheers, Proost, Saúde: Cultural, Contextual and Psychological Factors of Wine and Beer Consumption in Portugal and in the Netherlands. Crit. Rev. Food Sci. Nutr. 2017, 57, 1340–1349. [Google Scholar] [CrossRef] [PubMed]
- Marendić, M.; Polić, N.; Matek, H.; Oršulić, L.; Polašek, O.; Kolčić, I. Mediterranean Diet Assessment Challenges: Validation of the Croatian Version of the 14-Item Mediterranean Diet Serving Score (MDSS) Questionnaire. PLoS One 2021, 16, e0247269. [Google Scholar] [CrossRef] [PubMed]
- Ljubičić, M.; Baković, L.; Ćoza, M.; Pribisalić, A.; Kolčić, I. Awakening Cortisol Indicators, Advanced Glycation End Products, Stress Perception, Depression and Anxiety in Parents of Children with Chronic Conditions. Psychoneuroendocrinology 2020, 117, 104709. [Google Scholar] [CrossRef]
- Giesinger, K.; Hamilton, D.F.; Erschbamer, M.; Jost, B.; Giesinger, J.M. Black Medicine: An Observational Study of Doctors’ Coffee Purchasing Patterns at Work. BMJ 2015, 351. [Google Scholar] [CrossRef]
- Phillips, K.E.; Kang, Y.; Kang, S.J.; Girotto, C.; Fitzpatrick, J.J. Caffeine and High Energy Drink Use and Knowledge by Nurses in Three Countries. Appl. Nurs. Res. 2021, 58. [Google Scholar] [CrossRef]


| Croatia (N = 1538) | Greece (N = 498) | Hungary (N = 500) | Italy (N = 541) | Latvia (N = 636) | Lithuania (N = 507) | The Netherlands (N = 521) | Poland (N = 586) | Portugal (N = 1314) | Romania (N = 821) | Serbia (N = 498) | Slovenia (N = 1093) | Overall p | ||
|---|---|---|---|---|---|---|---|---|---|---|---|---|---|---|
| Age (years), Mdn (IQR) | 32.0 (25.0) | 23.0 (22.0) | 43.0 (18.0) | 40.0 (19.0) | 36.0 (19.0) | 25.0 (24.0) | 29.0 (25.0) | 30.0 (18.0) | 37.0 (26.0) | 38.0 (24.0) | 23.0 (7.0) | 30.0 (17.0) | <0.001 * | |
| Gender, N (%) | Female | 1052 (68.4) | 317 (63.7) | 253 (50.6) | 354 (65.4) | 518 (81.4) | 382 (75.3) | 451 (86.6) | 447 (76.3) | 881 (67.0) | 566 (68.9) | 323 (64.9) | 955 (87.5) | <0.001 † |
| Male | 486 (31.6) | 181 (36.3) | 247 (49.4) | 187 (34.6) | 118 (18.6) | 125 (24.7) | 70 (13.4) | 139 (23.7) | 433 (33.0) | 255 (31.1) | 175 (35.1) | 137 (12.5) | ||
| Education, N (%) | Primary and high school | 716 (46.6) | 67 (13.5) | 339 (67.8) | 271 (50.1) | 146 (23.0) | 229 (45.2) | 113 (21.7) | 111 (18.9) | 570 (43.4) | 182 (22.2) | 151 (30.3) | 535 (49.0) | <0.001 † |
| University | 822 (53.4) | 431 (86.5) | 161 (32.2) | 270 (49.9) | 490 (77.0) | 278 (54.8) | 408 (78.3) | 475 (81.1) | 744 (56.6) | 639 (77.8) | 347 (69.7) | 557 (51.0) | ||
| Residential environment, N (%) | Urban | 1318 (85.7) | 474 (95.2) | 358 (71.6) | 481 (88.9) | 544 (85.5) | 457 (90.1) | 497 (95.4) | 516 (88.1) | 1099 (83.6) | 707 (86.1) | 466 (93.6) | 747 (68.4) | <0.001 † |
| Rural | 220 (14.3) | 24 (4.8) | 142 (28.4) | 60 (11.1) | 92 (14.5) | 50 (9.9) | 24 (4.6) | 70 (11.9) | 215 (16.4) | 114 (13.9) | 32 (6.4) | 345 (31.6) | ||
| Marital status, N (%) | Married | 724 (47.1) | 154 (30.9) | 324 (64.8) | 357 (66.0) | 361 (56.8) | 242 (47.7) | 257 (49.3) | 386 (65.9) | 654 (49.8) | 524 (63.8) | 108 (21.7) | 689 (63.1) | <0.001 † |
| Single/divorced/widowed | 814 (52.9) | 344 (69.1) | 176 (35.2) | 184 (34.0) | 275 (43.2) | 265 (52.3) | 264 (50.7) | 200 (34.1) | 660 (50.2) | 297 (36.2) | 390 (78.3) | 403 (36.9) | ||
| Employment status, N (%) | Employed | 998 (64.9) | 214 (43) | 388 (77.6) | 425 (78.6) | 538 (84.6) | 248 (48.9) | 287 (55.1) | 440 (75.1) | 860 (65.4) | 591 (72) | 147 (29.5) | 778 (71.2) | <0.001 † |
| Unemployed/retired/student | 540 (35.1) | 284 (57) | 112 (22.4) | 116 (21.4) | 98 (15.4) | 259 (51.1) | 234 (44.9) | 146 (24.9) | 454 (34.6) | 230 (28) | 351 (70.5) | 314 (28.8) | ||
| Profession, N (%) | Nutrition | 74 (4.8) | 29 (5.8) | 7 (1.4) | 26 (4.8) | 14 (2.2) | 33 (6.5) | 58 (11.1) | 69 (11.8) | 36 (2.7) | 108 (13.2) | 30 (6) | 191 (17.5) | <0.001 † |
| Food | 148 (9.6) | 106 (21.3) | 38 (7.6) | 58 (10.7) | 182 (28.6) | 161 (31.8) | 65 (12.5) | 141 (24.1) | 90 (6.8) | 29 (3.5) | 58 (11.6) | 34 (3.1) | ||
| Agriculture | 67 (4.4) | 22 (4.4) | 16 (3.2) | 14 (2.6) | 37 (5.8) | 17 (3.4) | 33 (6.3) | 51 (8.7) | 42 (3.2) | 12 (1.5) | 50 (10) | 10 (0.9) | ||
| Sport | 33 (2.1) | 8 (1.6) | 14 (2.8) | 21 (3.9) | 22 (3.5) | 17 (3.4) | 3 (0.6) | 26 (4.4) | 54 (4.1) | 21 (2.6) | 8 (1.6) | 57 (5.2) | ||
| Psychology | 31 (2.0) | 4 (0.8) | 17 (3.4) | 18 (3.3) | 19 (3.0) | 9 (1.8) | 38 (7.3) | 15 (2.6) | 29 (2.2) | 30 (3.7) | 19 (3.8) | 31 (2.8) | ||
| Health | 350 (22.8) | 47 (9.4) | 34 (6.8) | 55 (10.2) | 192 (30.2) | 82 (16.2) | 81 (15.5) | 6 (1.0) | 187 (14.2) | 322 (39.2) | 59 (11.8) | 152 (13.9) | ||
| Other | 835 (54.3) | 282 (56.6) | 374 (74.8) | 349 (64.5) | 170 (26.7) | 188 (37.1) | 243 (46.6) | 278 (47.4) | 876 (66.7) | 299 (36.4) | 274 (55) | 617 (56.5) | ||
| Following a healthy diet, Mdn (IQR) | 3.0 (1.0) | 4.0 (1.0) | 3.0 (1.0) | 4.0 (1.0) | 3.0 (1.0) | 3.0 (1.0) | 4.0 (1.0) | 3.0 (1.0) | 3.0 (1.0) | 3.0 (1.0) | 3.0 (1.0) | 4.0 (0.0) | <0.001 * | |
| Body mass index, Mdn (IQR) | 23.5 (5.4) | 22.9 (4.7) | 25.9 (7.1) | 23.1 (5.0) | 24.3 (5.3) | 23.5 (6.1) | 23.3 (5.3) | 23.1 (5.3) | 21.5 (3.2) | 24.2 (5.6) | 22.3 (4.7) | 23.6 (5.3) | <0.001 * | |
| Category of body mass index, N (%) | Underweight (≤18.5) | 52 (3.4) | 14 (2.8) | 13 (2.6) | 32 (5.9) | 15 (2.4) | 27 (5.3) | 19 (3.6) | 26 (4.5) | 72 (5.5) | 42 (5.1) | 36 (7.2) | 40 (3.7) | <0.001 † |
| Normal (18.5–24.9) | 922 (59.9) | 340 (68.3) | 201 (40.2) | 342 (63.2) | 354 (55.8) | 285 (56.2) | 325 (62.4) | 371 (63.6) | 1042 (79.9) | 442 (53.8) | 344 (69.1) | 659 (60.4) | ||
| Overweight (25.0–29.9) | 463 (30.1) | 117 (23.5) | 166 (33.2) | 130 (24) | 176 (27.8) | 144 (28.4) | 113 (21.7) | 133 (22.8) | 148 (11.3) | 242 (29.5) | 96 (19.3) | 270 (24.7) | ||
| Obesity (≥30.0) | 101 (6.6) | 27 (5.4) | 120 (24.0) | 37 (6.8) | 89 (14.0) | 51 (10.1) | 64 (12.3) | 53 (9.1) | 42 (3.2) | 95 (11.6) | 22 (4.4) | 122 (11.2) | ||
| Exercise activity, N (%) | No | 598 (38.9) | 176 (35.3) | 263 (52.6) | 221 (40.9) | 201 (31.6) | 286 (56.4) | 177 (34) | 217 (37) | 297 (22.6) | 324 (39.5) | 167 (33.5) | 198 (18.1) | <0.001 † |
| Yes | 940 (61.1) | 322 (64.7) | 237 (47.4) | 320 (59.1) | 435 (68.4) | 221 (43.6) | 344 (66) | 369 (63) | 1017 (77.4) | 497 (60.5) | 331 (66.5) | 894 (81.9) | ||
| Television or computer (hours/day), Mdn (IQR) | 3.0 (4.0) | 3.0 (3.0) | 3.0 (3.0) | 4.0 (6.0) | 6.0 (5.0) | 3.0 (3.0) | 4.0 (3.3) | 4.0 (6.0) | 6.0 (5.0) | 4.0 (5.0) | 3.0 (3.0) | 2.0 (3.0) | <0.001 * | |
| Motivation for health behavior, Mdn (IQR) | 34.0 (7.0) | 34.0 (8.0) | 31.0 (7.0) | 34.0 (6.0) | 34.0 (6.8) | 36.0 (7.0) | 30.0 (7.0) | 35.0 (6.0) | 38.0 (7.0) | 30.0 (8.0) | 33.0 (7.0) | 35.0 (6.0) | <0.001 * | |
| Croatia (N = 1538) | Greece (N = 498) | Hungary (N = 500) | Italy (N = 541) | Latvia (N = 636) | Lithuania (N = 507) | The Netherlands (N = 521) | Poland (N = 586) | Portugal (N = 1314) | Romania (N = 821) | Serbia (N = 498) | Slovenia (N = 1093) | Overall p * | ||
|---|---|---|---|---|---|---|---|---|---|---|---|---|---|---|
| Coping with stress | Mdn (IQR) | 3.0 (2.0) | 3.0 (2.0) | 2.0 (2.0) | 3.0 (2.0) | 3.0 (2.0) | 3.0 (2.0) | 3.0 (2.0) | 3.0 (2.0) | 3.0 (2.0) | 3.0 (2.0) | 3.0 (2.0) | 3.0 (2.0) | <0.001 |
| Mean Rank | 4266.4 | 4792.9 | 3324.5 | 4924.7 | 5042.0 | 5399.1 | 4741.8 | 4747.8 | 3935.6 | 4688.1 | 4318.3 | 4883.0 | ||
| Eating sweets when depressed | Mdn (IQR) | 3.0 (2.0) | 3.0 (2.0) | 3.0 (3.0) | 3.0 (2.0) | 3.0 (2.0) | 3.0 (2.0) | 3.0 (2.0) | 3.0 (2.0) | 2.0 (1.0) | 3.0 (2.0) | 2.0 (3.0) | 3.0 (2.0) | <0.001 |
| Mean Rank | 4356.3 | 4756.1 | 4169.1 | 4915.2 | 4847.6 | 5308.9 | 4824.6 | 4686.7 | 3781.2 | 4742.6 | 3966.4 | 4844.9 | ||
| Consolation via eating when lonely | Mdn (IQR) | 2.0 (2.0) | 2.0 (1.0) | 2.0 (2.0) | 2.0 (1.0) | 3.0 (1.0) | 3.0 (2.0) | 3.0 (2.0) | 2.0 (1.0) | 2.0 (0.0) | 2.0 (3.0) | 2.0 (2.0) | 2.0 (2.0) | <0.001 |
| Mean Rank | 4105.3 | 4800.5 | 3729.1 | 4820.0 | 5424.2 | 5779.5 | 5106.7 | 4498.6 | 4042.6 | 4783.6 | 3857.3 | 4543.3 | ||
| Boredom eating | Mdn (IQR) | 3.0 (2.0) | 3.0 (2.0) | 2.0 (2.0) | 3.0 (2.0) | 3.0 (2.0) | 4.0 (1.0) | 4.0 (2.0) | 4.0 (2.0) | 2.0 (2.0) | 3.0 (2.0) | 3.0 (2.0) | 3.0 (2.0) | <0.001 |
| Mean Rank | 4368.8 | 4891.9 | 3459.4 | 4940.5 | 5340.2 | 5523.5 | 5298.2 | 4923.9 | 3687.2 | 4511.2 | 4375.4 | 4438.5 | ||
| Emotional consolation | Mdn (IQR) | 3.0 (1.0) | 2.0 (1.0) | 2.0 (2.0) | 2.0 (1.0) | 3.0 (2.0) | 3.0 (2.0) | 3.0 (1.0) | 2.0 (2.0) | 2.0 (1.0) | 2.0 (2.0) | 2.0 (1.0) | 2.0 (2.0) | <0.001 |
| Mean Rank | 4756.4 | 4541.5 | 3936.1 | 4683.7 | 5631.0 | 5916.6 | 4789.1 | 4691.1 | 4011.9 | 4212.5 | 3373.8 | 4268.1 | ||
| Helping to control weight | Mdn (IQR) | 3.0 (2.0) | 3.0 (2.0) | 2.0 (2.0) | 3.0 (2.0) | 3.0 (2.0) | 3.0 (2.0) | 3.0 (2.0) | 3.0 (4.0) | 4.0 (1.0) | 3.0 (1.0) | 2.0 (2.0) | 4.0 (1.0) | <0.001 |
| Mean Rank | 4378.6 | 4327.8 | 3680.4 | 4179.1 | 4062.6 | 4031.5 | 3597.8 | 4847.2 | 5714.0 | 4898.7 | 3278.6 | 5017.2 | ||
| Keeping awake and alert | Mdn (IQR) | 3.0 (2.0) | 2.0 (3.0) | 3.0 (2.0) | 2.0 (2.0) | 3.0 (1.0) | 3.0 (2.0) | 2.0 (2.0) | 3.0 (2.0) | 2.0 (2.0) | 3.0 (2.0) | 3.0 (2.0) | 2.0 (3.0) | <0.001 |
| Mean Rank | 4595.8 | 4230.0 | 5144.8 | 4443.9 | 5520.0 | 5148.1 | 4065.1 | 4547.4 | 3362.0 | 5416.5 | 5040.4 | 4162.4 | ||
| Helping to relax | Mdn (IQR) | 3.0 (2.0) | 3.0 (2.0) | 3.0 (1.0) | 3.0 (2.0) | 3.0 (2.0) | 3.0 (2.0) | 2.0 (2.0) | 3.0 (1.0) | 4.0 (1.0) | 3.0 (1.0) | 3.0 (2.0) | 3.0 (2.0) | <0.001 |
| Mean Rank | 4213.3 | 4523.5 | 3619.6 | 4476.2 | 4776.2 | 4838.8 | 3599.8 | 5040.6 | 5684.3 | 4613.7 | 4681.0 | 3756.9 | ||
| Making oneself feel good | Mdn (IQR) | 4.0 (1.0) | 4.0 (2.0) | 4.0 (1.0) | 3.0 (2.0) | 4.0 (2.0) | 4.0 (0.0) | 4.0 (1.0) | 4.0 (1.0) | 4.0 (0.0) | 4.0 (1.0) | 4.0 (2.0) | 4.0 (1.0) | <0.001 |
| Mean Rank | 4374.2 | 4879.4 | 3831.4 | 4885.2 | 5575.1 | 5158.0 | 4324.6 | 4625.0 | 4913.1 | 4012.2 | 3780.2 | 4122.9 | ||
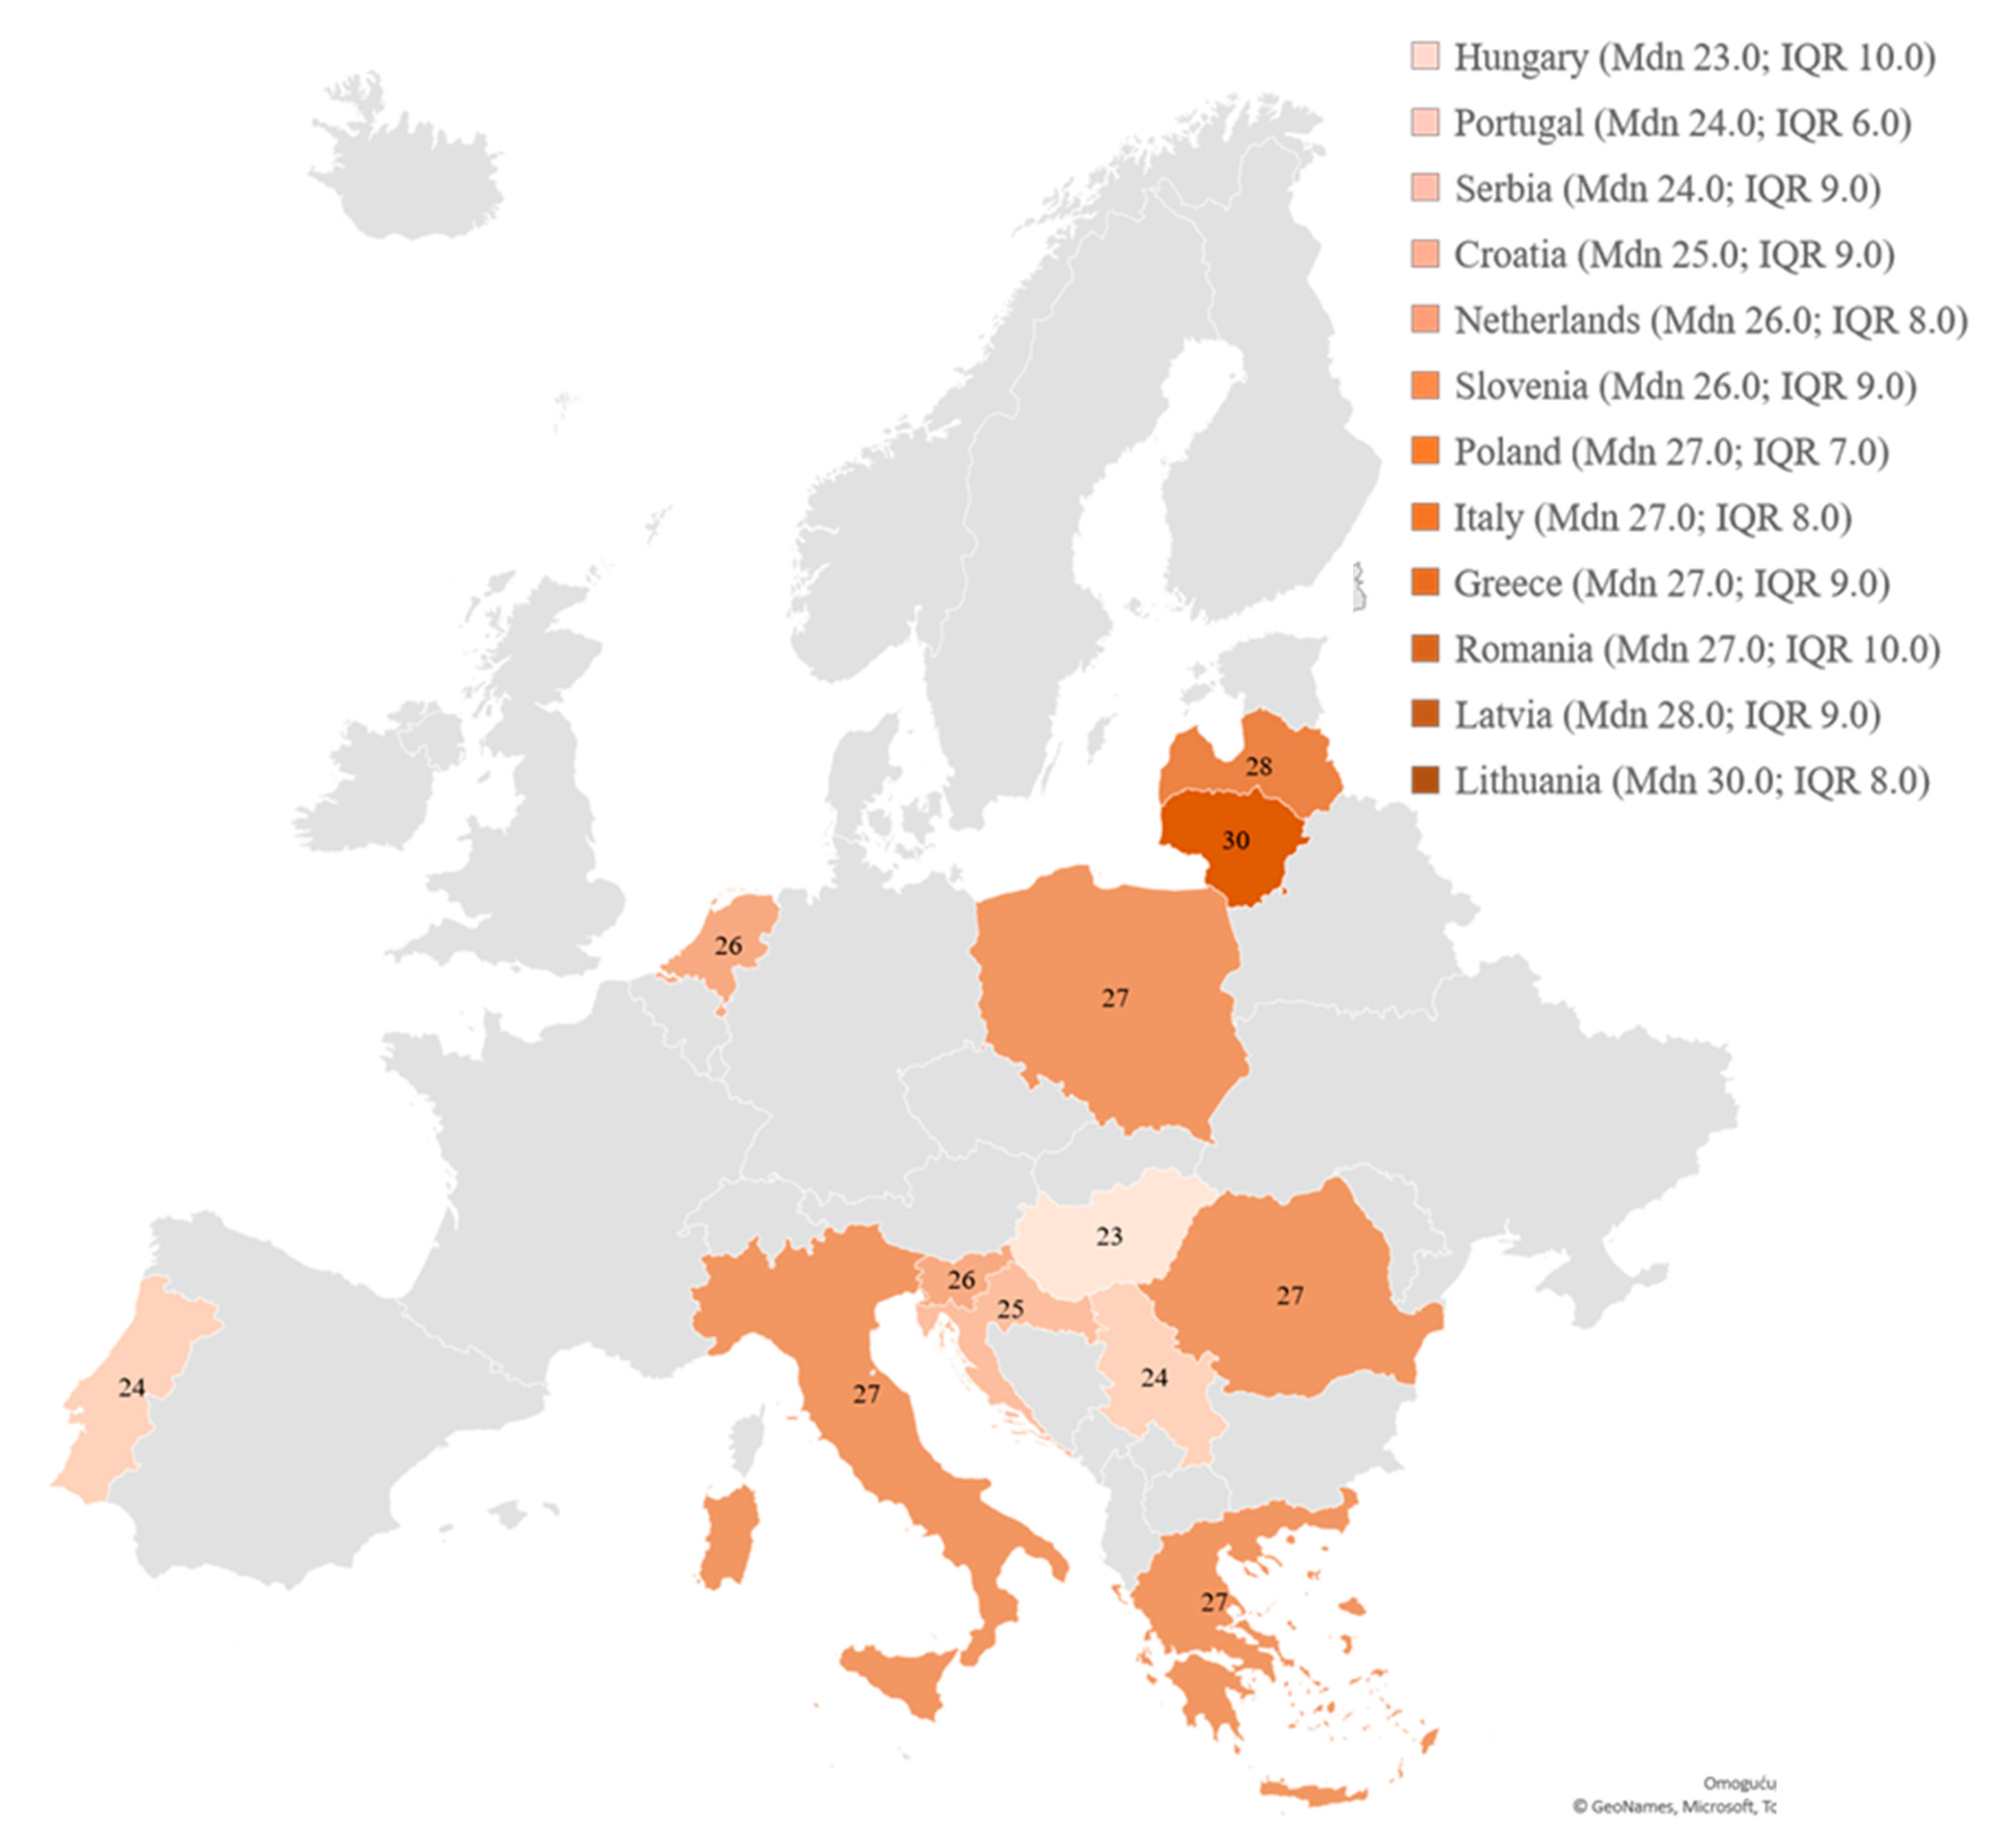
| Emotional eating behavior (overall) | Mdn (IQR) | 25.0 (9.0) | 27.0 (9.0) | 23.0 (10.0) | 27.0 (8.0) | 28.0 (9.0) | 30.0 (8.0) | 26.0 (8.0) | 27.0 (7.0) | 24.0 (6.0) | 27.0 (10.0) | 24.0 (9.0) | 26.0 (9.0) | <0.001 |
| Mean Rank | 4301.70 | 4744.37 | 3453.4 | 4835.13 | 5549.24 | 5800.0 | 4503.88 | 4915.59 | 4062.89 | 4789.99 | 3757.53 | 4407.69 |
| Coping with Stress | Eating Sweets when Depressed | Consolation via Eating when Lonely | Boredom Eating | Emotional Consolation | |
|---|---|---|---|---|---|
| OR * (95% CI †); p ‡ | OR * (95% CI †); p ‡ | OR * (95% CI †); p ‡ | OR * (95% CI †); p ‡ | OR * (95% CI †); p ‡ | |
| Country of residence (reference = Croatia) | |||||
| Greece | 1.30 (1.07–1.60); 0.010 | 1.28 (1.05–1.57); 0.015 | 1.90 (1.53–2.35); <0.001 | 1.35 (1.10–1.65); 0.004 | 0.55 (0.44–0.68); <0.001 |
| Hungary | 0.56 (0.45–0.69); <0.001 | 1.64 (1.34–2.02); <0.001 | 1.02 (0.81–1.28); 0.879 | 0.61 (0.50–0.75); <0.001 | 0.63 (0.51–0.79); <0.001 |
| Italy | 1.40 (1.15–1.69); 0.001 | 1.27 (1.05–1.54); 0.015 | 1.42 (1.15–1.74); 0.001 | 1.50 (1.24–1.82); <0.001 | 0.55 (0.45–0.68); <0.001 |
| Latvia | 0.83 (0.69–1.00); 0.049 | 0.56 (0.46–0.67); <0.001 | 1.40 (1.15–1.70); 0.001 | 1.38 (1.14–1.66); 0.001 | 0.68 (0.56–0.82); <0.001 |
| Lithuania | 1.10 (0.90–1.35); 0.347 | 0.87 (0.71–1.07); 0.183 | 2.33 (1.88–2.88); <0.001 | 1.33 (1.09–1.62); 0.006 | 0.98 (0.79–1.20); 0.819 |
| Netherlands | 1.41 (1.15–1.72); 0.001 | 1.14 (0.94–1.39); 0.187 | 2.74 (2.22–3.38); <0.001 | 2.02 (1.66–2.46); <0.001 | 0.70 (0.57–0.86); 0.001 |
| Poland | 1.10 (0.91–1.33); 0.330 | 0.88 (0.73–1.06); 0.180 | 1.16 (0.94–1.42); 0.161 | 1.31 (1.09–1.59); 0.005 | 0.57 (0.47–0.69); <0.001 |
| Portugal | 1.08 (0.93–1.25); 0.329 | 0.77 (0.67–0.90); 0.001 | 1.66 (1.42–1.96); <0.001 | 0.81 (0.70–0.94); 0.006 | 0.63 (0.54–0.73); <0.001 |
| Romania | 1.08 (0.91–1.28); 0.369 | 1.02 (0.86–1.20); 0.856 | 1.68 (1.40–2.02); <0.001 | 0.93 (0.79–1.10); 0.406 | 0.28 (0.23–0.33); <0.001 |
| Serbia | 1.62 (1.32–1.98); <0.001 | 1.01 (0.82–1.23); 0.947 | 1.36 (1.09–1.70); 0.006 | 1.26 (1.03–1.54); 0.022 | 0.28 (0.22–0.34); <0.001 |
| Slovenia | 1.90 (1.62–2.23); <0.001 | 1.45 (1.24–1.70); <0.001 | 1.94 (1.64–2.30); <0.001 | 1.03 (0.88–1.20); 0.750 | 0.56 (0.47–0.66); <0.001 |
| Age (years; reference = elderly (≥66 years)) | |||||
| Young adults (18–30 years) | 1.02 (0.78–1.34); 0.882 | 0.74 (0.57–0.97) 0.030 | 0.49 (0.36–0.65); <0.001 | 2.11 (1.61–2.77); <0.001 | 0.62 (0.47–0.82); 0.001 |
| Middle-aged adults (31–50 years) | 1.11 (0.84–1.46); 0.461 | 0.89 (0.68–1.18) 0.425 | 0.72 (0.54–0.96); 0.026 | 1.66 (1.26–2.18); <0.001 | 0.81 (0.61–1.07); 0.136 |
| Senior adults (51–65 years) | 1.16 (0.88–1.53); 0.304 | 0.93 (0.70–1.22) 0.591 | 0.86 (0.64–1.16); 0.321 | 1.54 (1.16–2.04); 0.002 | 0.95 (0.71–1.28); 0.755 |
| Gender (reference = male) | |||||
| Female | 1.04 (0.94–1.15); 0.417 | 2.08 (1.89–2.30); <0.001 | 1.14 (1.03–1.26); 0.014 | 1.19 (1.08–1.31); <0.001 | 1.22 (1.11–1.35) <0.001 |
| Education (reference = university) | |||||
| No university | 0.99 (0.90–1.09); 0.843 | 0.90 (0.82–0.99); 0.035 | 1.13 (1.02–1.24); 0.019 | 1.02 (0.93–1.12); 0.720 | 0.89 (0.81–0.99); 0.024 |
| Residential environment (reference = urban) | |||||
| Rural | 1.09 (0.97–1.23); 0.138 | 1.19 (1.06–1.34); 0.003 | 0.96 (0.85–1.08); 0.490 | 1.17 (1.04–1.32); 0.008 | 0.96 (0.85–1.08); 0.469 |
| Marital status (reference = married) | |||||
| Single, divorced, and widowed | 1.06 (0.97–1.17); 0.216 | 1.08 (0.98–1.19); 0.106 | 1.14 (1.02–1.26); 0.015 | 0.98 (0.89–1.08); 0.638 | 0.95 (0.86–1.05); 0.285 |
| Employment (reference = employed) | |||||
| Unemployed | 1.02 (0.92–1.14); 0.656 | 1.03 (0.92–1.14); 0.613 | 1.05 (0.93–1.17) 0.437 | 1.05 (0.95–1.17); 0.356 | 1.14 (1.02–1.27); 0.025 |
| Profession (reference = other profession §) | |||||
| Nutrition | 1.07 (0.91–1.26); 0.406 | 1.06(0.90–1.25); 0.477 | 0.82 (0.69–0.98); 0.026 | 0.92 (0.78–1.08); 0.295 | 1.01 (0.85–1.20); 0.891 |
| Food | 1.10 (0.96–1.25); 0.180 | 1.06 (0.93–1.21); 0.384 | 0.88 (0.77–1.02); 0.088 | 0.82 (0.72–0.94); 0.004 | 1.18 (1.03–1.36); 0.019 |
| Agriculture | 1.30 (1.06–1.61); 0.013 | 0.98 (0.80–1.21); 0.879 | 0.80 (0.64–1.00); 0.049 | 0.83 (0.67–1.02); 0.071 | 0.79 (0.63–0.98); 0.036 |
| Sport | 1.13 (0.90–1.44); 0.296 | 1.14 (0.90–1.45); 0.263 | 0.91 (0.71–1.17); 0.470 | 0.86 (0.68–1.08); 0.191 | 1.07 (0.84–1.37); 0.590 |
| Psychology | 1.26 (0.98–1.61); 0.069 | 1.14 (0.90–1.46); 0.283 | 0.94 (0.72–1.22); 0.627 | 0.87 (0.68–1.11); 0.273 | 0.87 (0.67–1.12); 0.270 |
| Health | 1.15 (1.02–1.29); 0.020 | 0.95 (0.85–1.07); 0.423 | 0.94 (0.83–1.07); 0.339 | 0.92 (0.82–1.03); 0.144 | 1.35 (1.20–1.53) <0.001 |
| Following a healthy diet (reference = yes) | |||||
| Never or rarely follow | 1.22 (1.08–1.38); 0.001 | 1.12 (0.99–1.27); 0.064 | 1.16 (1.02–1.32); 0.022 | 0.93 (0.82–1.05); 0.247 | 0.99 (0.87–1.12); 0.817 |
| Body mass index (reference = obesity (BMI ║ ≥ 30.0)) | |||||
| Underweight (BMI < 18.5) | 0.65 (0.50–0.83); 0.001 | 0.90 (0.71–1.16); 0.426 | 0.56 (0.43–0.74); <0.001 | 0.64 (0.50–0.82); <0.001 | 0.60 (0.46–0.77); <0.001 |
| Normal weight (18.5 ≤ BMI ≤ 24.9) | 0.97 (0.96–0.98); <0.001 | 0.96 (0.83–1.12); 0.635 | 0.57 (0.48–0.67); <0.001 | 0.82 (0.70–0.95); 0.009 | 0.61 (0.52–0.71); <0.001 |
| Overweight (25.0 ≤ BMI ≤ 29.9) | 1.42 (1.41–1.44); <0.001 | 1.01 (0.87–1.18); 0.881 | 0.71 (0.61–0.84); <0.001 | 0.88 (0.75–1.02); 0.097 | 0.73 (0.62–0.86); <0.001 |
| Physical exercise (reference = weekly) | |||||
| Never exercise | 0.96 (0.87–1.05); 0.331 | 1.07 (0.98–1.17); 0.122 | 1.15 (1.04–1.27); 0.004 | 1.25 (1.14–1.37); <0.001 | 1.15 (1.05–1.26); 0.004 |
| Sitting in front of a television or computer (hours per day) | 0.99 (0.98–1.01); 0.195 | 0.98 (0.96–0.99); 0.004 | 0.99 (0.97–1.00); 0.158 | 0.99 (0.97–1.00); 0.077 | 0.99 (0.98–1.01); 0.239 |
| Motivation for health behavior (overall sum) | 1.08 (0.93–1.25); 0.329 | 0.97 (0.96–0.98); <0.001 | 0.94 (0.93–0.95); <0.001 | 0.94 (0.93–0.95); <0.001 | 0.95 (0.94–0.95); <0.001 |
| Emotional eating behavior (overall sum) | 1.30 (1.07–1.60); 0.010 | 1.41 (1.40–1.43); <0.001 | 1.60 (1.58–1.62); <0.001 | 1.37 (1.36–1.39); <0.001 | 1.55 (1.54–1.57); <0.001 |
| Helping to Control Weight | Keeping Awake and Alert | Relaxation | Making Oneself Feel Good | |
|---|---|---|---|---|
| OR * (95% CI †); p ‡ | OR * (95% CI †); p ‡ | OR * (95% CI †); p ‡ | OR * (95% CI †); p ‡ | |
| Country of residence (reference = Croatia) | ||||
| Greece | 0.87 (0.71–1.06); 0.159 | 0.62 (0.51–0.75); <0.001 | 1.04 (0.86–1.26); 0.664 | 1.21 (0.99–1.49); 0.060 |
| Hungary | 1.12 (0.92–1.36); 0.279 | 1.84 (1.52–2.23); <0.001 | 0.99 (0.82–1.21); 0.955 | 1.04 (0.85–1.27); 0.689 |
| Italy | 0.71 (0.59–0.86); <0.001 | 0.72 (0.60–0.87); <0.001 | 0.98 (0.82–1.18); 0.866 | 1.23 (1.01–1.49); 0.039 |
| Latvia | 0.65 (0.54–0.78); <0.001 | 1.21 (1.01–1.44); 0.037 | 1.15 (0.96–1.37); 0.133 | 1.95 (1.61–2.36); <0.001 |
| Lithuania | 0.35 (0.29–0.43); <0.001 | 1.00 (0.83–1.21); 0.991 | 0.96 (0.79–1.16); 0.673 | 0.89 (0.73–1.09); 0.280 |
| Netherlands | 0.79 (0.65–0.96); 0.015 | 0.59 (0.49–0.71); <0.001 | 0.65 (0.54–0.79); <0.001 | 0.98 (0.80–1.19); 0.830 |
| Poland | 1.15 (0.95–1.39); 0.140 | 0.83 (0.69–0.99); 0.044 | 1.47 (1.22–1.76); <0.001 | 0.80 (0.66–0.97); 0.020 |
| Portugal | 1.53 (1.32–1.78); <0.001 | 0.43 (0.38–0.50); <0.001 | 2.86 (2.47–3.30); <0.001 | 1.36 (1.17–1.58); <0.001 |
| Romania | 0.99 (0.84–1.17); 0.916 | 1.96 (1.67–2.30); <0.001 | 1.11 (0.95–1.31); 0.192 | 0.51 (0.43–0.61); <0.001 |
| Slovenia | 1.29 (1.10–1.50); 0.001 | 0.80 (0.69–0.93); 0.004 | 0.65 (0.56–0.76); <0.001 | 0.70 (0.60–0.82); <0.001 |
| Serbia | 0.49 (0.40–0.60); <0.001 | 1.73 (1.43–2.09); <0.001 | 1.58 (1.31–1.92); <0.001 | 0.64 (0.52–0.77); <0.001 |
| Age (years; reference = elderly (≥66 years)) | ||||
| Young adults (18–30 years) | 0.81 (0.62–1.05); 0.110 | 1.69 (1.30–2.20); <0.001 | 0.89 (0.69–1.15); 0.368 | 0.91 (0.70–1.20); 0.508 |
| Middle-aged adults (31–50 years) | 0.87 (0.66–1.13); 0.294 | 1.69 (1.30–2.21); <0.001 | 0.72 (0.56–0.94); 0.015 | 0.71 (0.54–0.94); 0.015 |
| Senior adults (51–65 years) | 0.84 (0.64–1.11); 0.222 | 1.30 (0.99–1.71); 0.055 | 0.78 (0.60–1.02); 0.073 | 0.78 (0.59–1.03); 0.084 |
| Gender (reference = male) | ||||
| Female | 1.03 (0.94–1.14); 0.491 | 0.63 (0.57–0.69); <0.001 | 0.81 (0.74–0.89); <0.001 | 0.70 (0.63–0.77); <0.001 |
| Education (reference = university) | ||||
| No university | 0.93 (0.85–1.01); 0.099 | 1.09 (1.00–1.19); 0.055 | 1.04 (0.96–1.14); 0.332 | 0.94 (0.86–1.04); 0.226 |
| Residential environment (reference = urban) | ||||
| Rural | 0.88 (0.79–0.99); 0.027 | 0.97 (0.87–1.08); 0.563 | 0.85 (0.76–0.95); 0.005 | 0.91 (0.81–1.02); 0.109 |
| Marital status (reference = married) | ||||
| Single, divorced, and widowed | 0.90 (0.82–0.99); 0.029 | 0.93 (0.85–1.02); 0.119 | 1.07 (0.98–1.17); 0.152 | 0.90 (0.82–0.99); 0.025 |
| Employment (reference = employed) | ||||
| Unemployed | 1.10 (0.99–1.22); 0.065 | 0.94 (0.85–1.04); 0.198 | 0.89 (0.81–0.99); 0.025 | 0.92 (0.83–1.02); 0.125 |
| Profession (reference = other profession §) | ||||
| Nutrition | 0.94 (0.80–1.10); 0.431 | 1.00 (0.85–1.17); 0.983 | 0.94 (0.80–1.10); 0.431 | 1.25 (1.06–1.47); 0.008 |
| Food | 0.97 (0.86–1.11); 0.688 | 0.99 (0.87–1.12); 0.875 | 0.86 (0.76–0.98); 0.024 | 1.24 (1.08–1.42); 0.002 |
| Agriculture | 0.94 (0.76–1.15); 0.517 | 1.15 (0.95–1.41); 0.153 | 1.04 (0.85–1.27); 0.695 | 1.11 (0.90–1.37); 0.327 |
| Sport | 1.17 (0.92–1.47); 0.197 | 0.93 (0.74–1.16); 0.517 | 0.71 (0.57–0.89); 0.003 | 1.11 (0.88–1.41); 0.379 |
| Psychology | 1.06 (0.84–1.35); 0.628 | 1.13 (0.90–1.43); 0.288 | 0.89 (0.71–1.13); 0.337 | 0.94 (0.73–1.19); 0.589 |
| Health | 0.93 (0.83–1.04); 0.210 | 1.28 (1.15–1.43); <0.001 | 0.74 (0.67–0.83); <0.001 | 0.87 (0.77–0.98); 0.019 |
| Following a healthy diet (reference = yes) | ||||
| Never or rarely follow | 0.70 (0.62–0.79); <0.001 | 1.11 (0.99–1.24); 0.082 | 0.99 (0.89–1.12); 0.916 | 0.98 (0.87–1.11); 0.806 |
| Body mass index (reference = obesity (BMI ║≥ 30.0) | ||||
| Underweight (BMI < 18.5) | 0.77 (0.60–0.97); 0.030 | 1.59 (1.26–2.01); <0.001 | 2.19(1.73–2.77); <0.001 | 1.47 (1.15–1.87); 0.002 |
| Normal weight (18.5 ≤ BMI ≤ 24.9) | 1.34 (1.15–1.55); <0.001 | 1.30 (1.13–1.50); <0.001 | 1.55 (1.34–1.78); <0.001 | 1.24 (1.07–1.45); 0.005 |
| Overweight (25.0 ≤ BMI ≤ 29.9) | 1.26 (1.08–1.46); 0.003 | 1.17 (1.01–1.36); 0.034 | 1.13 (0.97–1.31); 0.105 | 0.94 (0.81–1.10); 0.457 |
| Physical exercise (reference = weekly) | ||||
| Never exercise | 0.64 (0.58–0.69); <0.001 | 1.30 (1.19–1.41); <0.001 | 0.80 (0.74–0.87); <0.001 | 0.88 (0.81–0.97); 0.007 |
| Sitting in front of a television or computer (hours per day) | 0.99 (0.98–1.01); 0.368 | 1.02 (1.00–1.03); 0.014 | 1.02 (1.00–1.03); 0.016 | 1.02 (1.00–1.03); 0.013 |
| Motivation for health behavior (overall sum) | 1.19 (1.18–1.21); <0.001 | 0.95 (0.94–0.96); <0.001 | 1.04 (0.86–1.26); 0.664 | 1.04 (1.04–1.05); <0.001 |
| Emotional eating behavior (overall sum) | 1.11 (1.10–1.12); <0.001 | 1.19 (1.19–1.20); <0.001 | 0.99 (0.82–1.21); 0.955 | 1.22 (1.21–1.22); <0.001 |
Disclaimer/Publisher’s Note: The statements, opinions and data contained in all publications are solely those of the individual author(s) and contributor(s) and not of MDPI and/or the editor(s). MDPI and/or the editor(s) disclaim responsibility for any injury to people or property resulting from any ideas, methods, instructions or products referred to in the content. |
© 2023 by the authors. Licensee MDPI, Basel, Switzerland. This article is an open access article distributed under the terms and conditions of the Creative Commons Attribution (CC BY) license (https://creativecommons.org/licenses/by/4.0/).
Share and Cite
Ljubičić, M.; Matek Sarić, M.; Klarin, I.; Rumbak, I.; Colić Barić, I.; Ranilović, J.; Dželalija, B.; Sarić, A.; Nakić, D.; Djekic, I.; et al. Emotions and Food Consumption: Emotional Eating Behavior in a European Population. Foods 2023, 12, 872. https://doi.org/10.3390/foods12040872
Ljubičić M, Matek Sarić M, Klarin I, Rumbak I, Colić Barić I, Ranilović J, Dželalija B, Sarić A, Nakić D, Djekic I, et al. Emotions and Food Consumption: Emotional Eating Behavior in a European Population. Foods. 2023; 12(4):872. https://doi.org/10.3390/foods12040872
Chicago/Turabian StyleLjubičić, Marija, Marijana Matek Sarić, Ivo Klarin, Ivana Rumbak, Irena Colić Barić, Jasmina Ranilović, Boris Dželalija, Ana Sarić, Dario Nakić, Ilija Djekic, and et al. 2023. "Emotions and Food Consumption: Emotional Eating Behavior in a European Population" Foods 12, no. 4: 872. https://doi.org/10.3390/foods12040872
APA StyleLjubičić, M., Matek Sarić, M., Klarin, I., Rumbak, I., Colić Barić, I., Ranilović, J., Dželalija, B., Sarić, A., Nakić, D., Djekic, I., Korzeniowska, M., Bartkiene, E., Papageorgiou, M., Tarcea, M., Černelič-Bizjak, M., Klava, D., Szűcs, V., Vittadini, E., Bolhuis, D., & Guiné, R. P. F. (2023). Emotions and Food Consumption: Emotional Eating Behavior in a European Population. Foods, 12(4), 872. https://doi.org/10.3390/foods12040872