
Estimation of Impacts of Global Factors on World Food Prices: A Comparison of Machine Learning Algorithms and Time Series Econometric Models

 , and
, and
Abstract
1. Introduction
2. Literature Review
3. Methods
3.1. Research Objectives
3.2. Data
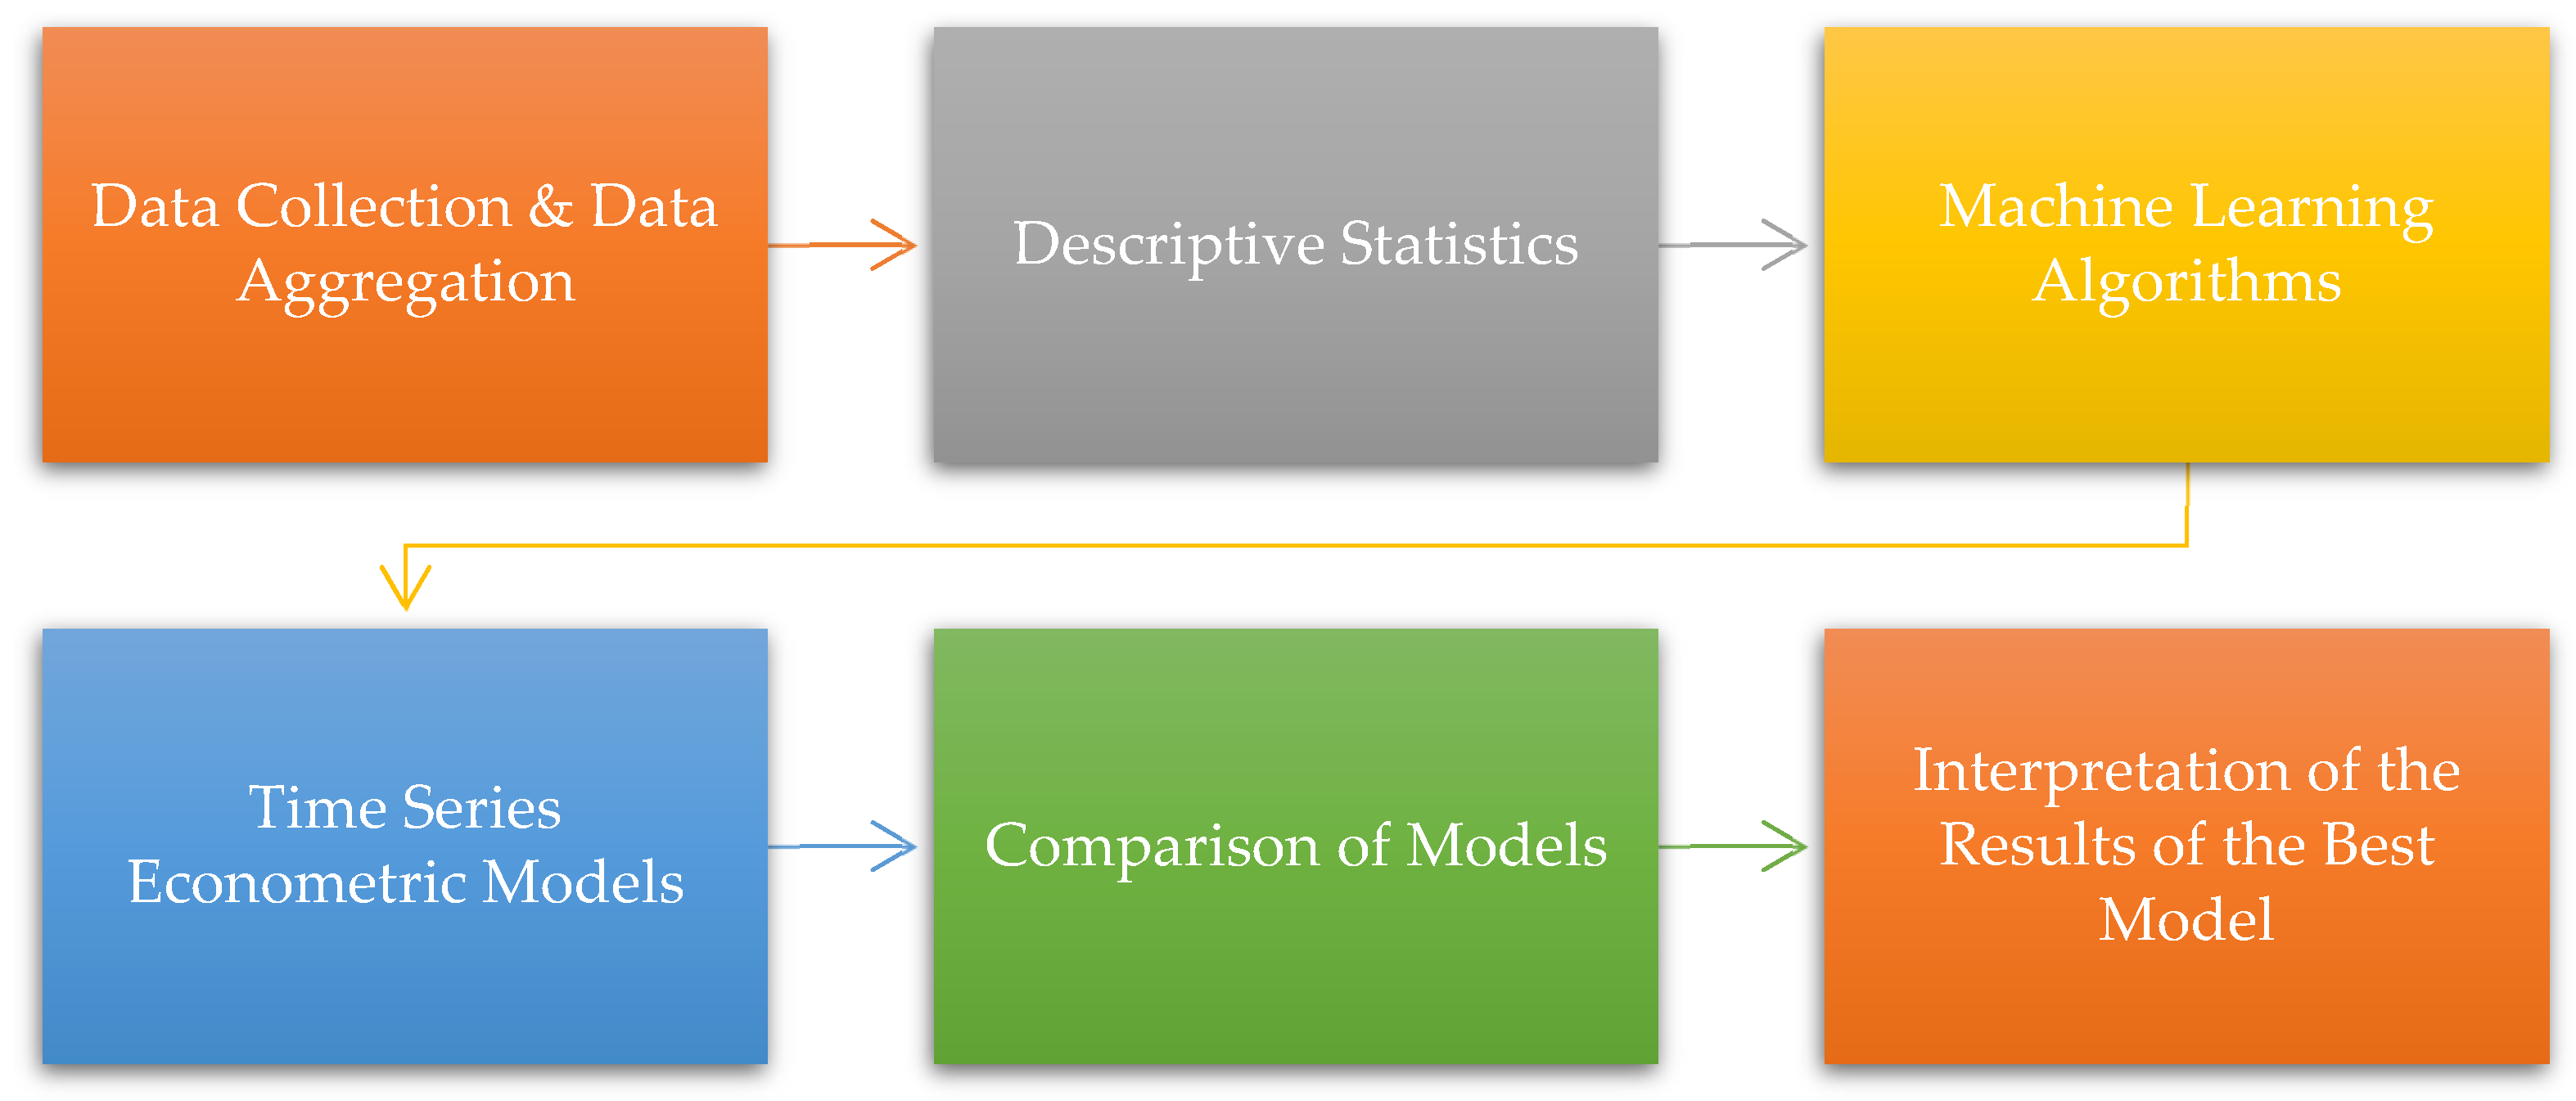
3.3. Methodology
- ▪
- Step 1: The large period is selected for data collection. Monthly data covering January 1991–May 2021 period, which has 365 observations, are used.
- ▪
- Step 2: The descriptive statistics for each variable such as mean, standard deviation, coefficient of variation, minimum, maximum, etc. are calculated.
- ▪
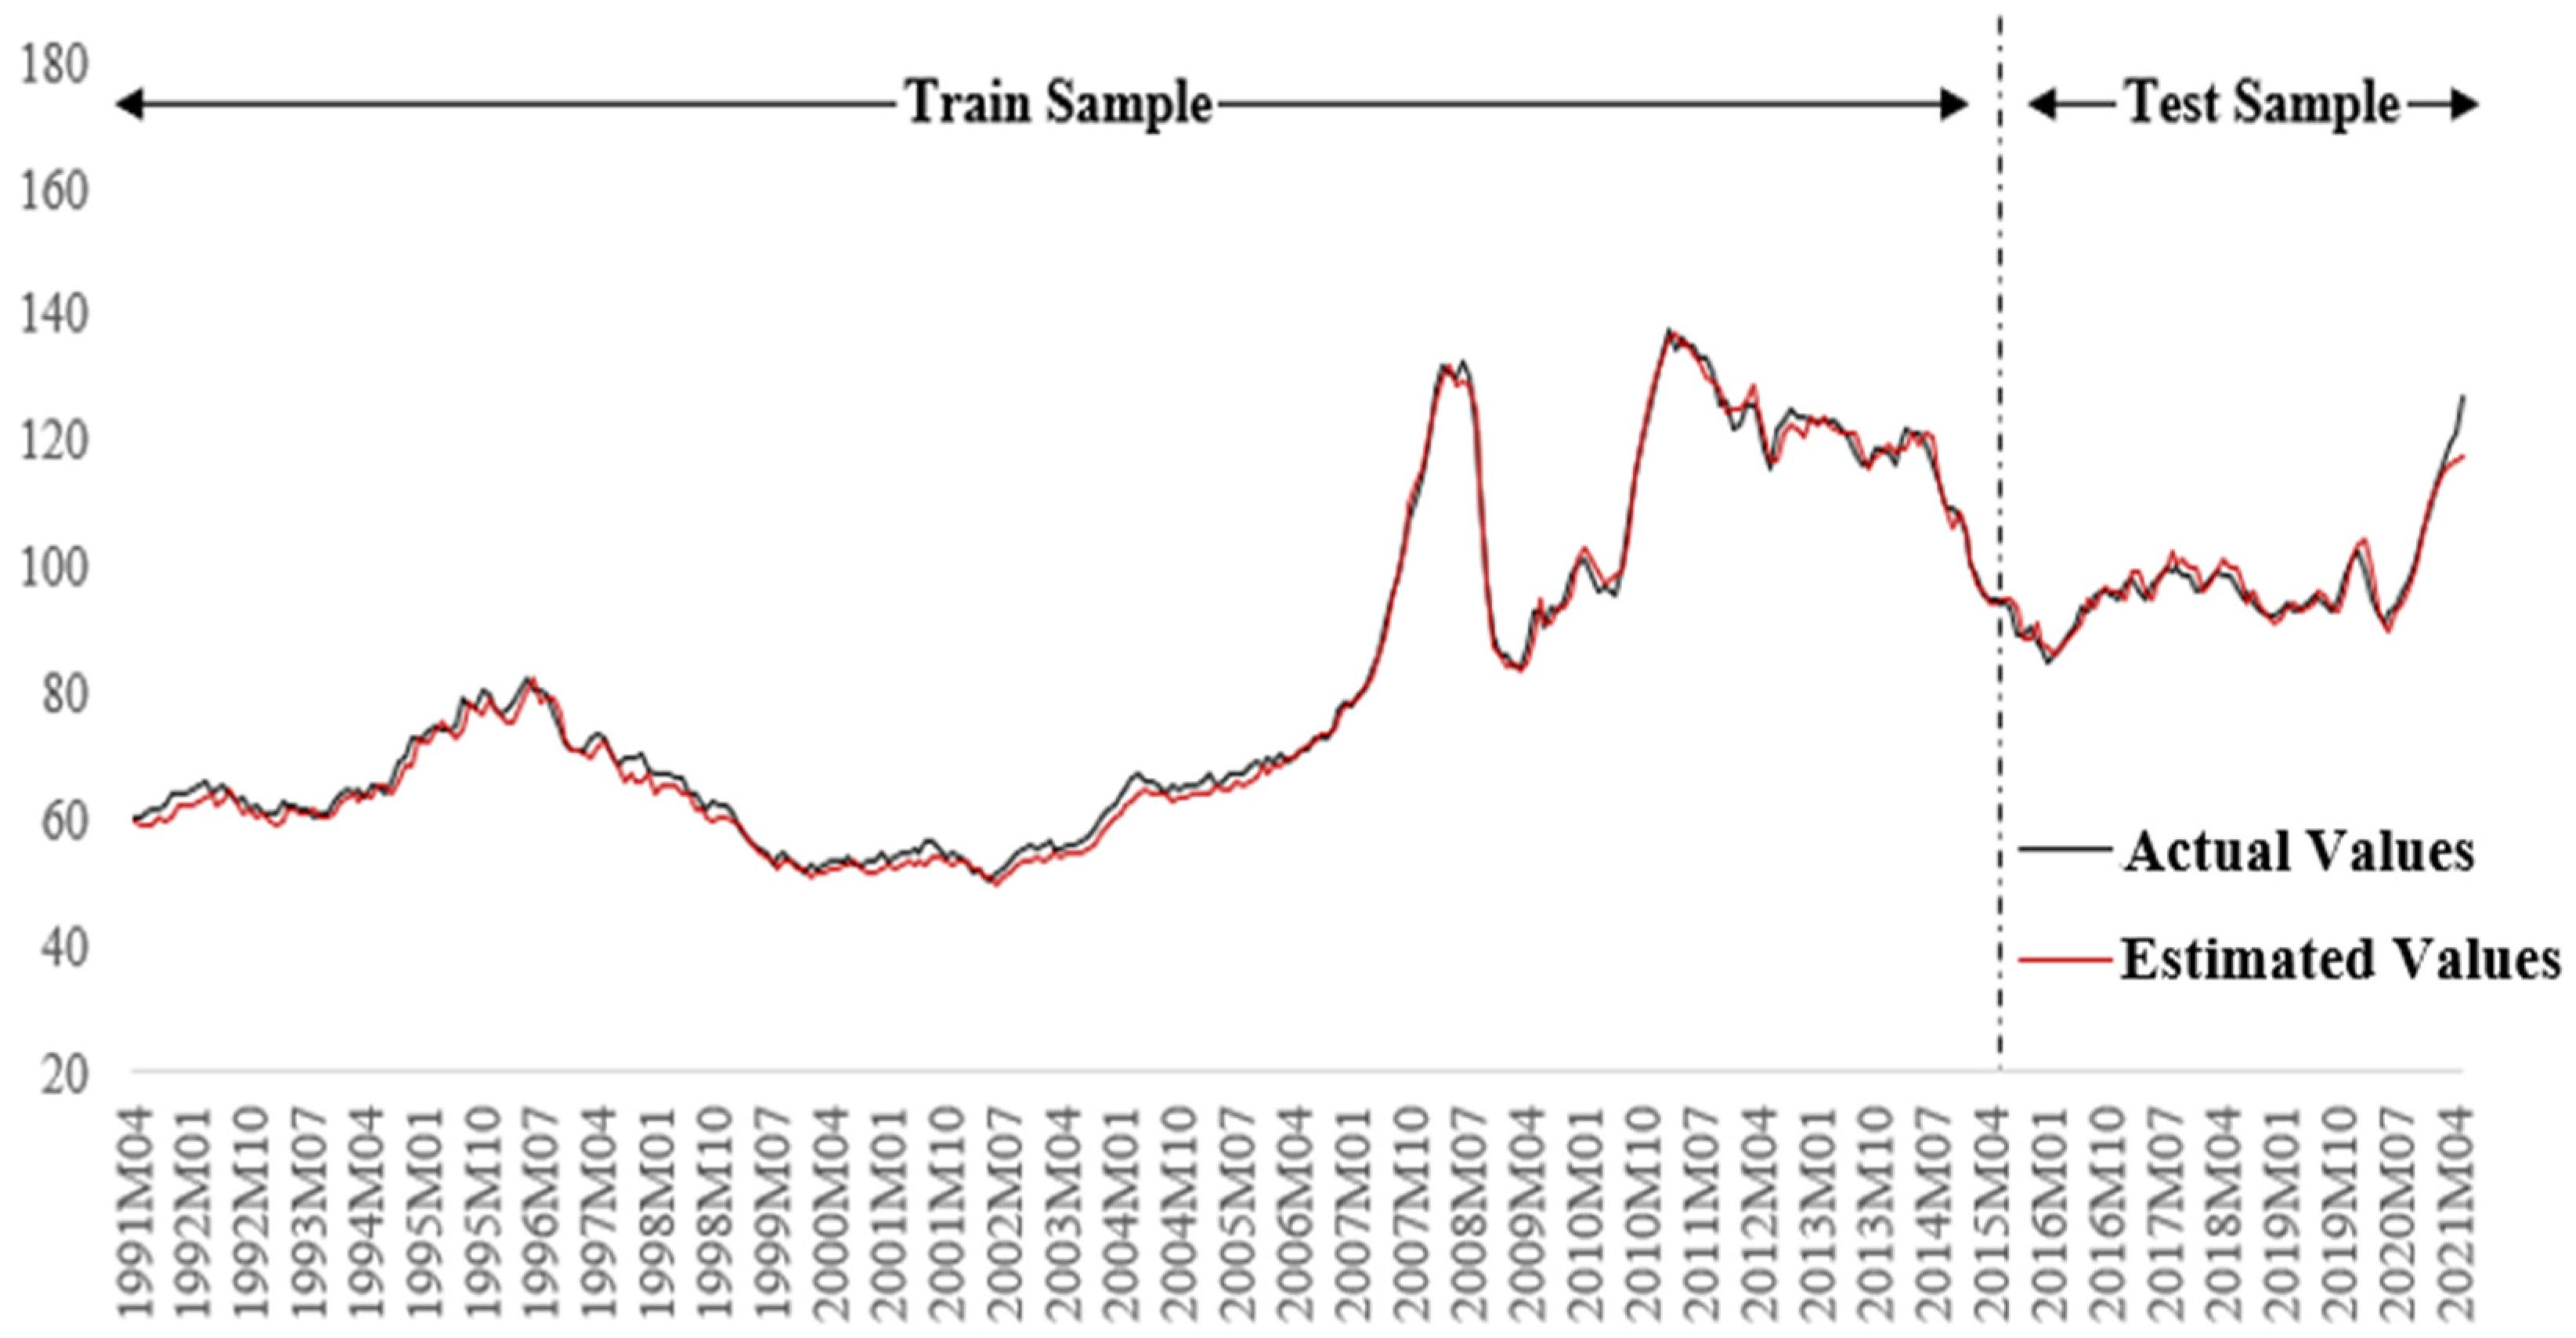
- Step 3: The dataset that includes 365 monthly observations is divided into two sub-periods: (i) the training (first 80% observations) and (ii) the testing dataset (last 20% observations), firstly. Hence, the training dataset consists of 292 observations from January 1991 to April 2015, the testing dataset contains 73 observations from May 2015 to May 2021. The training period is known as the model construction period and the testing period is known as the model validation period. After this, selected machine learning algorithms are performed. In this context, Multi-layer Perceptron (MLP), Multivariate Adaptive Regression Splines (MARS), Support Vector machines (SVM), Random Forest (RF), Extreme Gradient Boosting (XGB), and k-Nearest Neighbors (kNN) algorithms are included.
- ▪
- Step 4: Selected time series econometrics models are applied. In line with this, Threshold regression, Markov Switching Regression, OLS, Dynamic OLS (DOLS), and Fully Modified OLS (FMOLS) are covered.
- ▪
- Step 5: The results of the machine learning algorithms and time series econometric models are compared according to the goodness of fit criteria. In this context, Root Mean Squared Error (RMSE), Mean Absolute Error (MAE), and R2 are considered.
- ▪
- Step 6: The best model is selected from alternative models according to the goodness of fit criteria and its results are interpreted.

4. Empirical Analysis
4.1. Descriptive Statistics
4.2. Machine Learning Algorithms versus Time Series Econometric Models
4.3. Discussion and Policy Implications
5. Conclusions
Author Contributions
Funding
Data Availability Statement
Conflicts of Interest
References
- Kartal, M.T.; Kirikkaleli, D.; Ayhan, F. Nexus between Non-Performing Loans and Economic Growth in Emerging Markets: Evidence from Turkey with Wavelet Coherence Approach. Int. J. Financ. Econ. 2021. [Google Scholar] [CrossRef]
- Aydoğmuş, M.; Gülay, G.; Ergun, K. Impact of ESG Performance on Firm Value and Profitability. Borsa Istanb. Rev. 2022, 22. [Google Scholar] [CrossRef]
- Depren, Ö.; Kartal, M.T.; Kılıç Depren, S. Macroeconomic Determinants of Interest Rates in BRICST, MINT, and Fragile Five Countries: Evidence from Quantile Regression Analysis. Stud. Bus. Econ. 2021, 16, 51–67. [Google Scholar] [CrossRef]
- Rahman, S.M.K.; Chowdhury, M.A.F.; Tania, T.C. Nexus among Bank Competition, Efficiency and Financial Stability: A Comprehensive Study in Bangladesh. J. Asian Financ. Econ. Bus. 2021, 8, 317–328. [Google Scholar]
- Warr, P. Food Insecurity and Its Determinants. Aust. J. Agric. Resour. Econ. 2014, 58, 519–537. [Google Scholar] [CrossRef]
- Timmer, C.P. Behavioral Dimensions of Food Security. Proc. Natl. Acad. Sci. USA 2012, 109, 12315–12320. [Google Scholar] [CrossRef]
- Abbott, P.C.; Hurt, C.; Tyner, W.E. What’s Driving Food Prices? Farm Foundation Issue Report, No. 741-2016-51225; Farm Foundation: Oak Brook, IL, USA, 2011. [Google Scholar]
- Turkish Statistical Institute. 2021 September CPI. 2021. Available online: https://data.tuik.gov.tr/Bulten/Index?p=T%C3%BCketici-Fiyat-Endeksi-Eyl%C3%BCl-2021-37387&dil=1 (accessed on 17 October 2021).
- FAOSTAT. Food and Agriculture Data. 2022. Available online: https://www.fao.org/faostat/en/#home (accessed on 7 June 2021).
- İslam, M.S.; Wong, A.T. Climate Change and Food In/Security: A Critical Nexus. Environments 2017, 4, 38. [Google Scholar] [CrossRef]
- Kartal, M.T.; Ali, U.; Nurgazina, Z. Asymmetric Effect of Electricity Consumption on CO2 Emissions in the USA: Analysis of End-User Electricity Consumption by Nonlinear Quantile Approaches. Environ. Sci. Pollut. Res. 2022, 29, 83824–83838. [Google Scholar] [CrossRef]
- Xiao, X.; Tian, Q.; Hou, S.; Li, C. Economic Policy Uncertainty and Grain Futures Price Volatility: Evidence from China. China Agric. Econ. Rev. 2019, 11, 642–654. [Google Scholar] [CrossRef]
- Wen, J.; Khalid, S.; Mahmood, H.; Zakaria, M. Symmetric and Asymmetric Impact of Economic Policy Uncertainty on Food Prices in China: A New Evidence. Resour. Policy 2021, 74, 102247. [Google Scholar] [CrossRef]
- Baek, J.; Koo, W.W. Analyzing Factors Affecting US Food Price Inflation. Can. J. Agric. Econ. 2010, 58, 303–320. [Google Scholar]
- Nazlıoğlu, S.; Soytaş, U. World Oil Prices and Agricultural Commodity Prices: Evidence from An Emerging Market. Energy Econ. 2011, 33, 488–496. [Google Scholar] [CrossRef]
- Zhang, C.; Qu, X. The Effect of Global Oil Price Shocks on China’s Agricultural Commodities. Energy Econ. 2015, 51, 354–364. [Google Scholar] [CrossRef]
- Salisu, A.A.; Isah, K.O.; Oyewole, O.J.; Akanni, L.O. Modelling Oil Price-Inflation Nexus: The Role of Asymmetries. Energy 2017, 125, 97–106. [Google Scholar] [CrossRef]
- Pal, D.; Mitra, S.K. Correlation Dynamics of Crude Oil with Agricultural Commodities: A Comparison between Energy and Food Crops. Econ. Model. 2019, 82, 453–466. [Google Scholar] [CrossRef]
- Taghizadeh-Hesary, F.; Rasoulinezhad, E.; Yoshino, N. Energy and Food Security: Linkages through Price Volatility. Energy Policy 2019, 128, 796–806. [Google Scholar] [CrossRef]
- Kirikkaleli, D.; Darbaz, I. The Causal Linkage between Energy Price and Food Price. Energies 2021, 14, 4182. [Google Scholar] [CrossRef]
- Abbott, P.C.; Hurt, C.; Tyner, W.E. What’s Driving Food Prices? Farm Foundation Issue Report, No. 741-2016-51224; Farm Foundation: Oak Brook, IL, USA, 2008. [Google Scholar]
- Baltzer, K.; Hansen, H.; Lind, K.M. A Note on the Causes and Consequences of the Rapidly Increasing International Food Prices; University of Copenhagen, Institute of Food and Resource Economics: Copenhagen, Denmark, 2008; pp. 56–78. [Google Scholar]
- Mitchell, D. A Note on Rising Food Prices; World Bank Policy Research Working Paper, No. 4682; World Bank-Development Economics Group: Washington, DC, USA, 2008. [Google Scholar]
- Ott, H. Fertilizer Markets and Their Interplay with Commodity and Food Prices; Report for the European Commission Join Research Centre, Brussels; European Commision: Brussels, Belgium, 2012. [Google Scholar]
- Tadasse, G.; Algieri, B.; Kalkuhl, M.; Von Braun, J. Drivers and Triggers of International Food Price Spikes and Volatility. Food Policy 2014, 47, 117–128. [Google Scholar] [CrossRef]
- Dercon, S. Growth and Shocks: Evidence from Rural Ethiopia. J. Dev. Econ. 2004, 74, 309–329. [Google Scholar] [CrossRef]
- Schlenker, W.; Roberts, M.J. Nonlinear Effects of Weather on Corn Yields. Rev. Agric. Econ. 2006, 28, 391–398. [Google Scholar] [CrossRef]
- Schnepf, R. High Agricultural Commodity Prices: What Are the Issues? Library of Congress, Congressional Research Service: Washington, DC, USA, 2008. [Google Scholar]
- D’Agostino, A.L.; Schlenker, W. Recent Weather Fluctuations and Agricultural Yields: Implications for Climate Change. Agric. Econ. 2016, 47, 159–171. [Google Scholar] [CrossRef]
- Hirvonen, K. Temperature Changes, Household Consumption, and Internal Migration: Evidence from Tanzania. Am. J. Agric. Econ. 2016, 98, 1230–1249. [Google Scholar] [CrossRef]
- Letta, M.; Montalbano, P.; Pierre, G. Weather Shocks, Traders’ Expectations, and Food Prices. Am. J. Agric. Econ. 2021, 104, 1100–1119. [Google Scholar] [CrossRef]
- Headey, D.; Fan, S. Anatomy of A Crisis: The Causes and Consequences of Surging Food Prices. Agric. Econ. 2008, 39, 375–391. [Google Scholar] [CrossRef]
- Tiwari, A.K.; Nasreen, S.; Shahbaz, M.; Hammoudeh, S. Time-Frequency Causality and Connectedness between International Prices of Energy, Food, Industry, Agriculture and Metals. Energy Econ. 2020, 85, 104529. [Google Scholar] [CrossRef]
- Ng, S.; Ruge-Murcia, F.J. Explaining the Persistence of Commodity Prices. Comput. Econ. 2000, 16, 149–171. [Google Scholar] [CrossRef]
- Loening, J.L.; Durevall, D.; Birru, Y.A. Inflation Dynamics and Food Prices in An Agricultural Economy: The Case of Ethiopia; World Bank Policy Research Working Paper, No. 4969; The World Bank: Washington, DC, USA, 2009. [Google Scholar]
- Baffes, J.; Kshirsagar, V.; Mitchell, D. What Drives Local Food Prices? Evidence from the Tanzanian Maize Market. World Bank Econ. Rev. 2019, 33, 160–184. [Google Scholar] [CrossRef]
- Abdullah, M.; Kalim, R. Determinants of Food Price Inflation in Pakistan. In Proceedings of the 1st International Conference on Business Management, Lahore, Pakistan, 5–6 January 2011; pp. 69–88. [Google Scholar]
- Durevall, D.; Sjö, B. The Dynamics of Inflation in Ethiopia and Kenya; African Development Bank Group Working Paper, No. 151; The World Bank: Washington, DC, USA, 2012. [Google Scholar]
- Obih, U.; Baiyegunhi, L.S. Willingness to Pay and Preference for Imported Rice Brands in Nigeria: Do Price–Quality Differentials Explain Consumers’ Inertia? S. Afr. J. Econ. Manag. Sci. 2017, 20, 1–11. [Google Scholar] [CrossRef]
- Wu, X.; Xu, J. Drivers of Food Price in China: A Heterogeneous Panel SVAR Approach. Agric. Econ. 2021, 52, 67–79. [Google Scholar] [CrossRef]
- Zhao, X.; Calvin, K.V.; Wise, M.A.; Patel, P.L.; Snyder, A.C.; Waldhoff, S.T.; Edmonds, J.A. Global Agricultural Responses to Interannual Climate and Biophysical Variability. Environ. Res. Lett. 2021, 16, 104037. [Google Scholar] [CrossRef]
- World Bank. Commodity Prices. 2021. Available online: https://www.worldbank.org/en/research/commodity-markets (accessed on 7 June 2021).
- Berkeley Earth. Temperature. 2021. Available online: https://berkeleyearth.lbl.gov/auto/Global/Complete_TAVG_daily.txt (accessed on 7 June 2021).
- FAO. Food Outlook-Biannual Report on Global Food Markets: June 2020; FAO: Rome, Italy, 2020. [Google Scholar] [CrossRef]
- Willmott, C.J.; Matsuura, K. Advantages of the mean absolute error (MAE) over the root mean square error (RMSE) in assessing average model performance. Clim. Res. 2005, 30, 79–82. [Google Scholar] [CrossRef]
- Kartal, M.T.; Ertuğrul, H.M.; Ulussever, T. The Impacts of Foreign Portfolio Flows and Monetary Policy Responses on Stock Markets by Considering COVID-19 Pandemic: Evidence from Turkey. Borsa Istanb. Rev. 2021, 22, 12–19. [Google Scholar] [CrossRef]
- Ertuğrul, H.M.; Kartal, M.T.; Depren, S.K.; Soytaş, U. Determinants of Electricity Prices in Turkey: An Application of Machine Learning and Time Series Models. Energies 2022, 15, 7512. [Google Scholar] [CrossRef]
- Kartal, M.T. Production-Based Disaggregated Analysis of Energy Consumption and CO2 Emission Nexus: Evidence from the USA by Novel Dynamic ARDL Simulation Approach. Environ. Sci. Pollut. Res. 2023, 30, 6864–6874. [Google Scholar] [CrossRef] [PubMed]
- Depren, Ö.; Kartal, M.T.; Kılıç Depren, S. Recent Innovation in Benchmark Rates (BMR): Evidence from Influential Factors on Turkish Lira Overnight Reference Interest Rate with Machine Learning Algorithms. Financ. Innov. 2021, 7, 1–20. [Google Scholar] [CrossRef]
- Kartal, M.T.; Depren, Ö.; Depren, S.K. Do Monetary Policy Measures Affect Foreign Exchange Rates during the COVID-19 Pandemic? Evidence from Turkey. J. BRSA Bank. Financ. Mark. 2021, 15, 175–202. [Google Scholar]
- Kılıç Depren, S.; Kartal, M.T.; Ertuğrul, H.M.; Depren, Ö. The Role of Data Frequency and Method Selection in Electricity Price Estimation: Comparative Evidence from Turkey in Pre-Pandemic and Pandemic Periods. Renew. Energy 2022, 186, 217–225. [Google Scholar] [CrossRef]
- Mutasa, S.; Sun, S.; Ha, R. Understanding artificial intelligence based radiology studies: What is overfitting? Clin. Imaging 2020, 65, 69–99. [Google Scholar] [CrossRef]


| Variables | Symbol | Description | Expected Nexus | Sources |
|---|---|---|---|---|
| Global Food Prices * | FOOD | United Nations Food and Agriculture World Food Price Index | N/A | [9] |
| Lagged Food Prices | FOOD_1 | One-Month Lagged Global Food Prices | + | [9] |
| Economic Policy Uncertainty | UNCERT | US Economic Policy Uncertainty Index | + | [9] |
| Volatility Index | VIX | CBOE Volatility Index | + | [9] |
| Oil Prices | OIL | Brent Crude Oil Price (USD per Barrel) | + | [9] |
| Metals and Mineral | METALS | Metals and Mineral Price Index | + | [42] |
| Raw Material Price | RAW | Raw Material Price Index | + | [42] |
| Fertilizer Price | FERTIL | Fertilizer Price Index | + | [42] |
| Temperature | TEMP | Weather Temperature Changes | + | [43] |
| Groups | Models | Train | Test | ||||
|---|---|---|---|---|---|---|---|
| RMSE | MAE | R2 | RMSE | MAE | R2 | ||
| Time Series Econometric Models | Threshold | 10.519 | 8.921 | 0.933 | 10.506 | 9.146 | 0.958 |
| Markov | 20.956 | 19.694 | 0.887 | 8.782 | 7.072 | 0.945 | |
| DOLS | 15.301 | 13.063 | 0.900 | 9.498 | 7.011 | 0.936 | |
| OLS | 15.041 | 13.358 | 0.856 | 10.516 | 8.157 | 0.924 | |
| FMOLS | 14.684 | 12.544 | 0.851 | 9.988 | 7.516 | 0.923 | |
| Machine Learning Algorithms | MLP | 0.087 | 0.064 | 0.994 | 1.900 | 1.479 | 0.943 |
| MARS | 2.107 | 1.481 | 0.993 | 1.910 | 1.501 | 0.939 | |
| SVM | 2.196 | 1.585 | 0.993 | 1.991 | 1.566 | 0.929 | |
| RF | 2.681 | 1.748 | 0.989 | 2.262 | 1.690 | 0.909 | |
| XGB | 2.826 | 1.945 | 0.988 | 3.305 | 2.501 | 0.846 | |
| kNN | 4.963 | 3.493 | 0.962 | 5.238 | 3.715 | 0.637 | |
Disclaimer/Publisher’s Note: The statements, opinions and data contained in all publications are solely those of the individual author(s) and contributor(s) and not of MDPI and/or the editor(s). MDPI and/or the editor(s) disclaim responsibility for any injury to people or property resulting from any ideas, methods, instructions or products referred to in the content. |
© 2023 by the authors. Licensee MDPI, Basel, Switzerland. This article is an open access article distributed under the terms and conditions of the Creative Commons Attribution (CC BY) license (https://creativecommons.org/licenses/by/4.0/).
Share and Cite
Ulussever, T.; Ertuğrul, H.M.; Kılıç Depren, S.; Kartal, M.T.; Depren, Ö. Estimation of Impacts of Global Factors on World Food Prices: A Comparison of Machine Learning Algorithms and Time Series Econometric Models. Foods 2023, 12, 873. https://doi.org/10.3390/foods12040873
Ulussever T, Ertuğrul HM, Kılıç Depren S, Kartal MT, Depren Ö. Estimation of Impacts of Global Factors on World Food Prices: A Comparison of Machine Learning Algorithms and Time Series Econometric Models. Foods. 2023; 12(4):873. https://doi.org/10.3390/foods12040873
Chicago/Turabian StyleUlussever, Talat, Hasan Murat Ertuğrul, Serpil Kılıç Depren, Mustafa Tevfik Kartal, and Özer Depren. 2023. "Estimation of Impacts of Global Factors on World Food Prices: A Comparison of Machine Learning Algorithms and Time Series Econometric Models" Foods 12, no. 4: 873. https://doi.org/10.3390/foods12040873
APA StyleUlussever, T., Ertuğrul, H. M., Kılıç Depren, S., Kartal, M. T., & Depren, Ö. (2023). Estimation of Impacts of Global Factors on World Food Prices: A Comparison of Machine Learning Algorithms and Time Series Econometric Models. Foods, 12(4), 873. https://doi.org/10.3390/foods12040873