


Comparative Compositions of Grain of Bread Wheat, Emmer and Spelt Grown with Different Levels of Nitrogen Fertilisation

 , ,
, ,  , and
, and
Abstract
1. Introduction
2. Materials and Methods
2.1. Grain Samples
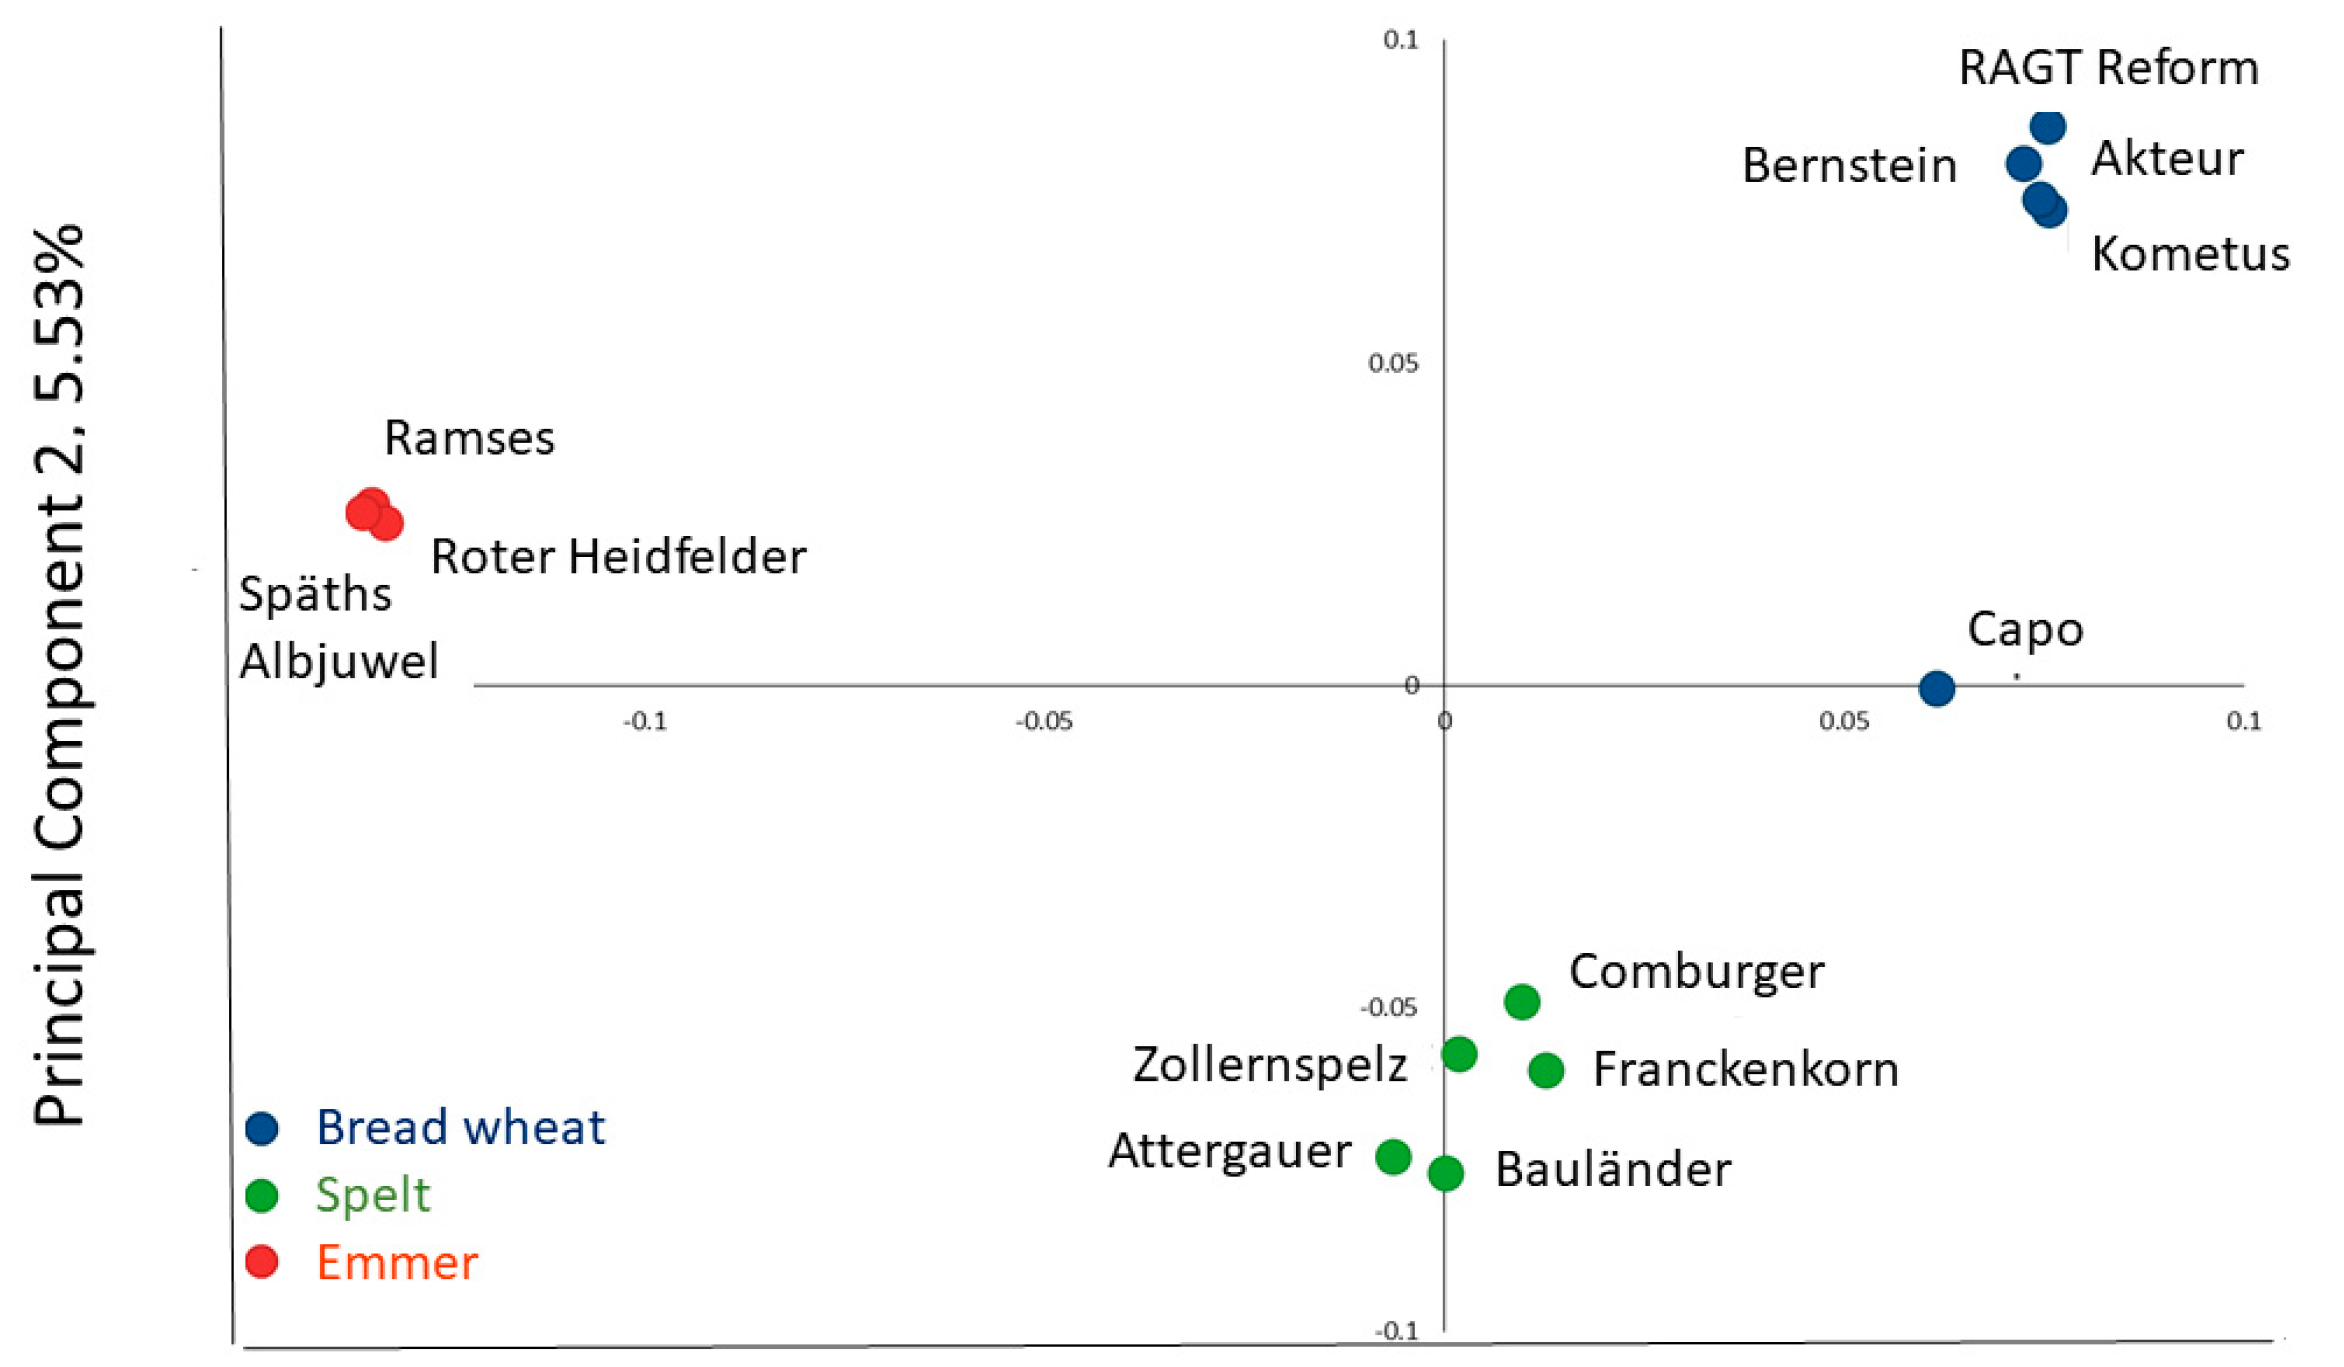
2.2. Genotyping
2.3. Enzyme Fingerprinting of Arabinoxylan and β-Glucan
2.4. NMR Spectroscopy of Polar Metabolites
2.5. Mineral Analysis
2.6. Total Phenolics
2.7. Statistical Analysis
3. Results
3.1. Grain Composition
3.2. Protein and Minerals


| 100 kg N/Ha | 200 kg N/Ha | |||||
|---|---|---|---|---|---|---|
| Bread Wheat | Emmer | Spelt | Bread Wheat | Emmer | Spelt | |
| %N | 1.764 (1.68, 1.847) | 2.095 (2.001, 2.189) | 2.354 (2.27, 2.437) | 2.23 (2.146, 2.313) | 2.636 (2.542, 2.73) | 2.857 (2.773, 2.94) |
| Ca | 311.6 (300.2, 323.5) | 327.7 (312.3, 343.8) | 301.8 (290.7, 313.3) | 341.6 (329.1, 354.6) | 358.5 (341.7, 376.1) | 320.2 (308.5, 332.4) |
| Fe | 35.33 (33.36, 37.42) | 36.65 (34.01, 39.5) | 47.65 (44.98, 50.46) | 40.04 (37.8, 42.4) | 43.22 (40.11, 46.58) | 54.01 (51, 57.21) |
| Mg | 1081 (1054, 1108) | 1341 (1309, 1374) | 1311 (1284, 1338) | 1087 (1060, 1114) | 1278 (1246, 1311) | 1312 (1285, 1339) |
| Zn | 24.41 (22.78, 26.04) | 35.22 (33.34, 37.11) | 34.37 (32.74, 36) | 27.27 (25.64, 28.9) | 38.76 (36.88, 40.65) | 40.78 (39.15, 42.41) |
| total phenolics | 2786 (2732, 2840) | 2742 (2677, 2807) | 2934 (2880, 2987) | 2879 (2826, 2933) | 2830 (2765, 2894) | 2854 (2800, 2908) |
| raffinose | 5.95 (5.819, 6.082) | 7.077 (6.908, 7.245) | 6.916 (6.785, 7.048) | 5.944 (5.813, 6.076) | 6.465 (6.296, 6.633) | 6.743 (6.611, 6.874) |
| asparagine | 0.4907 (0.4681, 0.5144) | 0.6588 (0.6195, 0.7007) | 0.6981 (0.666, 0.7318) | 0.5664 (0.5403, 0.5937) | 0.7803 (0.7337, 0.8298) | 0.8648 (0.825, 0.9065) |
| glycine betaine | 1.311 (1.262, 1.362) | 1.49 (1.432, 1.548) | 1.606 (1.551, 1.662) | 1.307 (1.257, 1.357) | 1.466 (1.41, 1.525) | 1.537 (1.483, 1.591) |
| choline | 0.1748 (0.1711, 0.1785) | 0.2148 (0.2101, 0.2195) | 0.2137 (0.21, 0.2174) | 0.1854 (0.1817, 0.1891) | 0.2207 (0.216, 0.2254) | 0.2229 (0.2192, 0.2266) |
| galactinol | 0.2224 (0.2122, 0.2328) | 0.3976 (0.3795, 0.4161) | 0.2692 (0.2579, 0.2806) | 0.2223 (0.2121, 0.2327) | 0.3657 (0.3484, 0.3834) | 0.2751 (0.2637, 0.2867) |
| inositol | 3.08 (3.024, 3.136) | 3.216 (3.141, 3.292) | 3.421 (3.365, 3.477) | 3.097 (3.041, 3.153) | 3.096 (3.021, 3.171) | 3.25 (3.194, 3.306) |
| total amino acids | 5.753 (5.618, 5.891) | 6.522 (6.331, 6.719) | 6.607 (6.452, 6.766) | 6.084 (5.941, 6.23) | 6.724 (6.528, 6.927) | 6.951 (6.788, 7.118) |
| total organic acids | 2.014 (1.934, 2.093) | 2.247 (2.156, 2.337) | 2.133 (2.053, 2.213) | 2.048 (1.968, 2.128) | 2.321 (2.231, 2.411) | 2.245 (2.166, 2.325) |
| total methyl donors | 1.482 (1.436, 1.529) | 1.702 (1.644, 1.761) | 1.814 (1.758, 1.871) | 1.486 (1.44, 1.533) | 1.685 (1.628, 1.744) | 1.758 (1.703, 1.813) |
| total sugars | 29.47 (28.78, 30.18) | 35.79 (34.71, 36.9) | 29.88 (29.18, 30.6) | 28.75 (28.07, 29.44) | 33.62 (32.61, 34.67) | 28.8 (28.13, 29.5) |
3.3. Total Phenolics
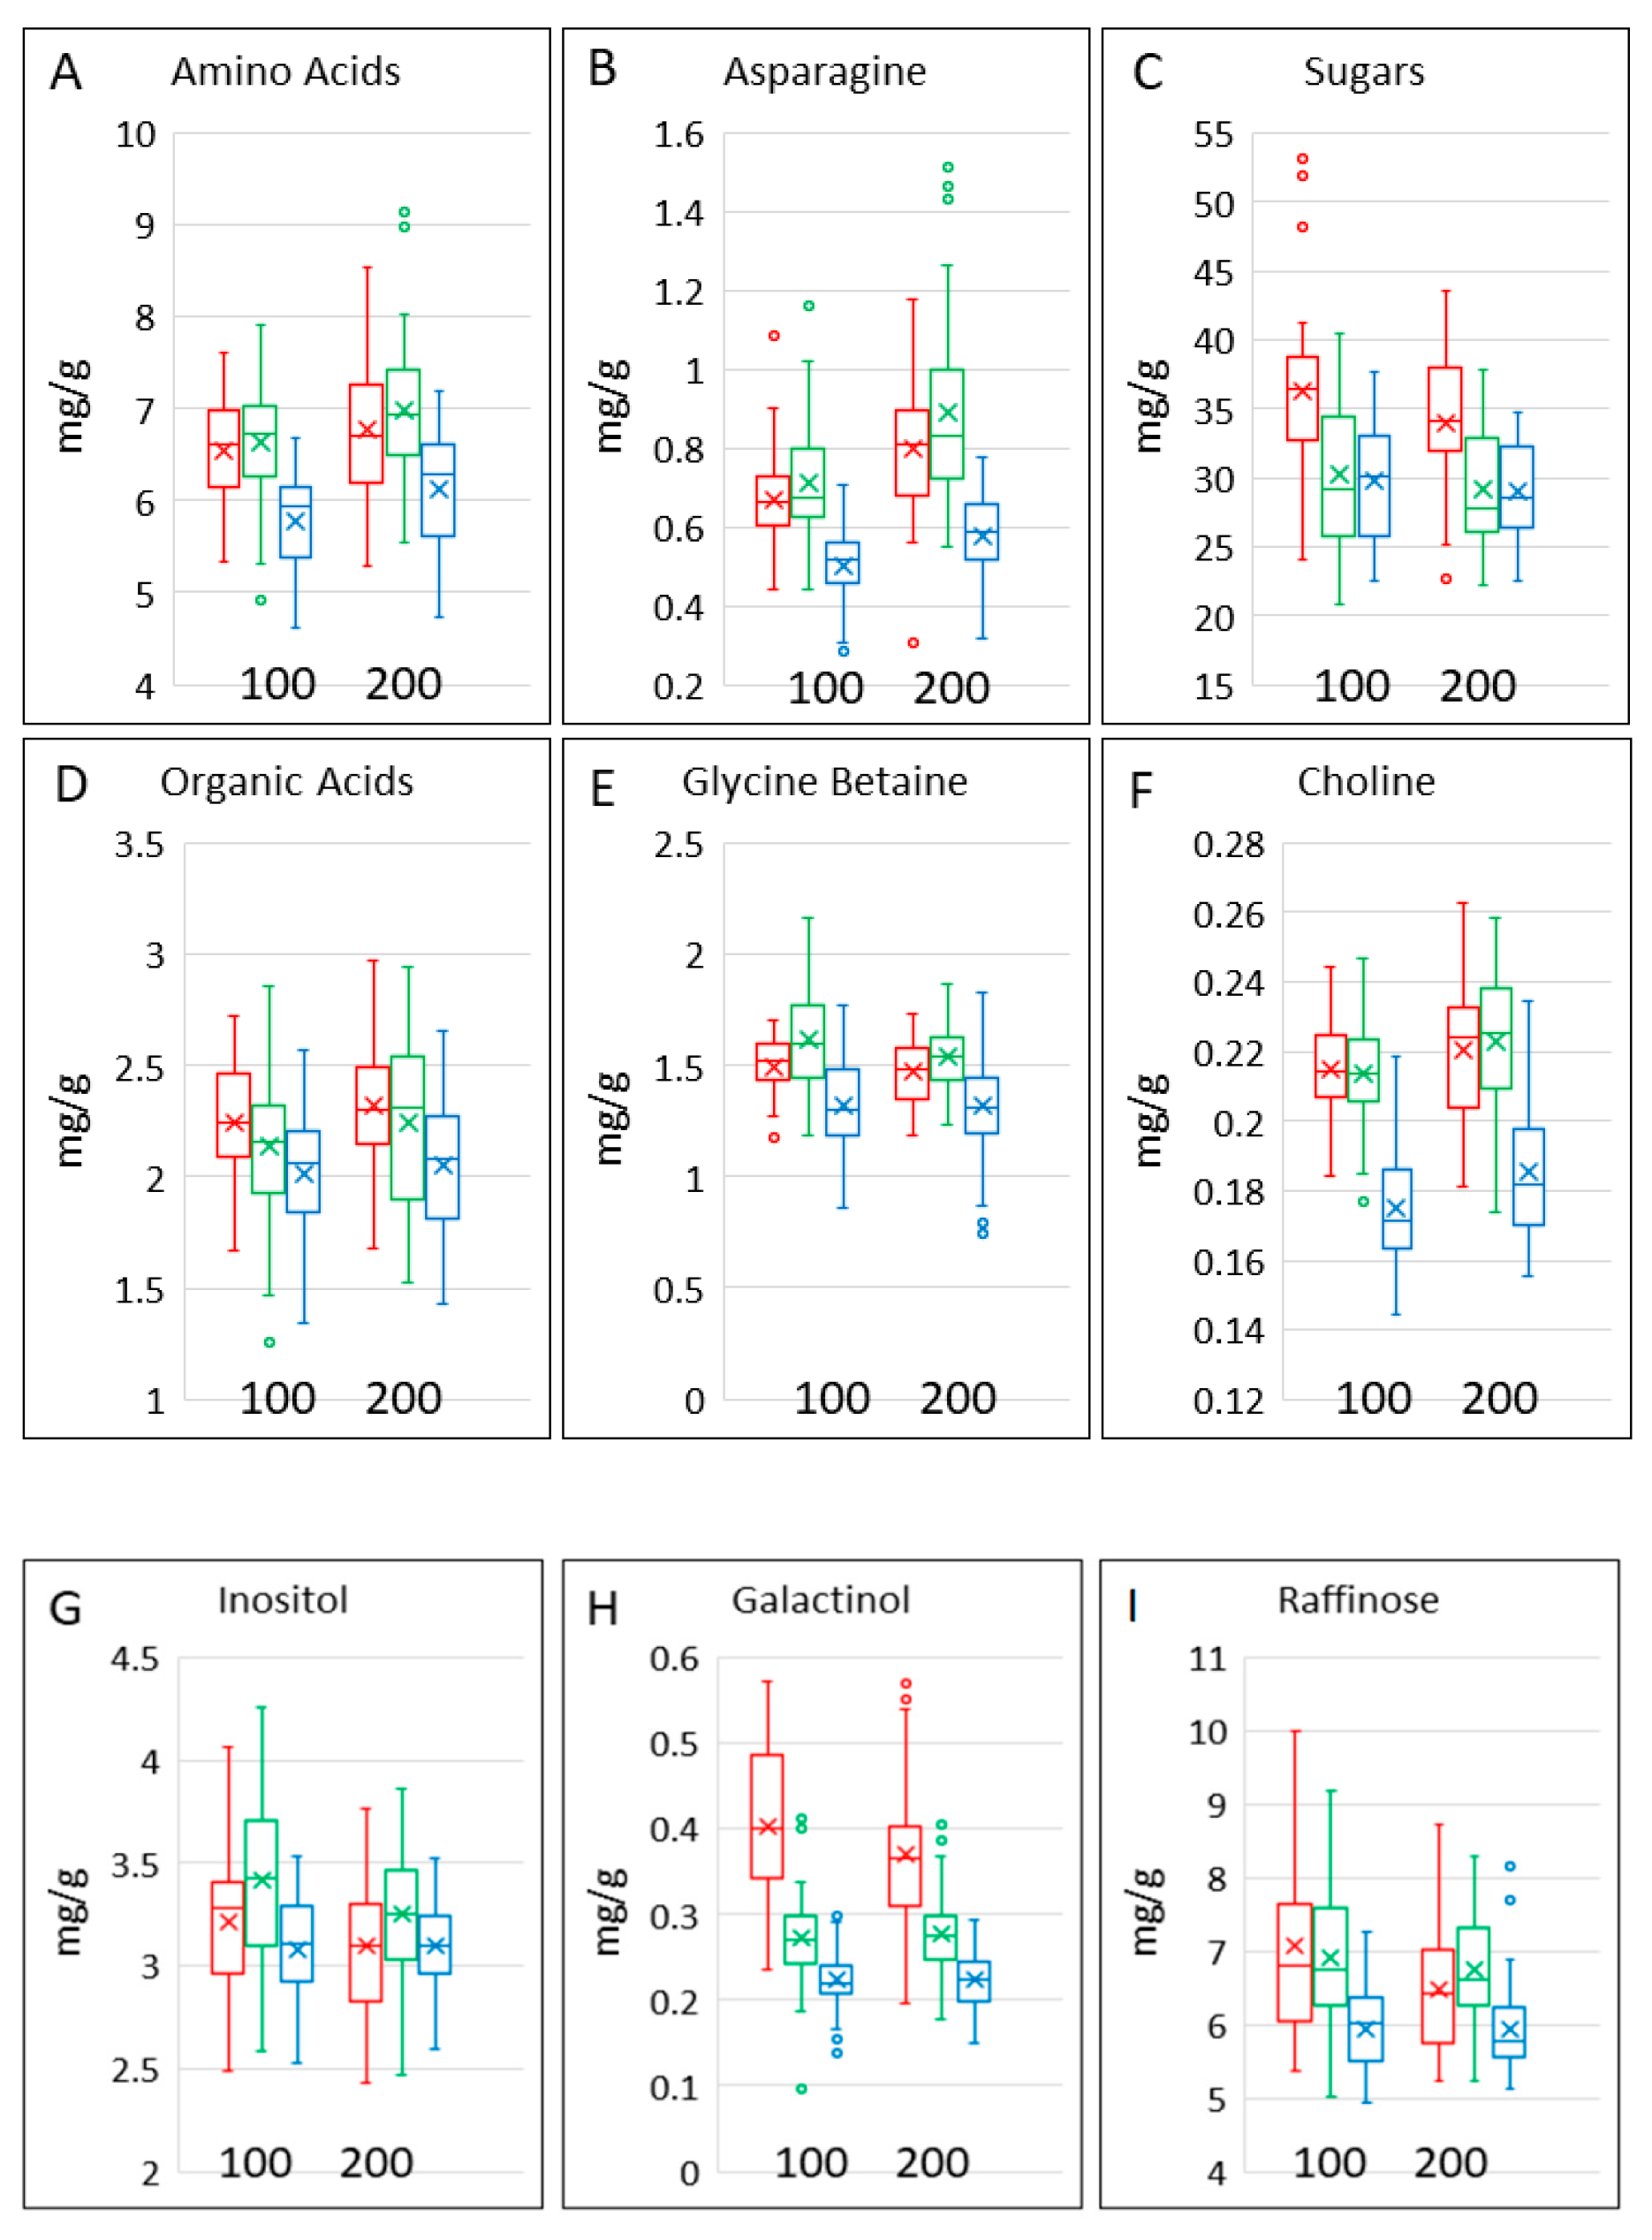
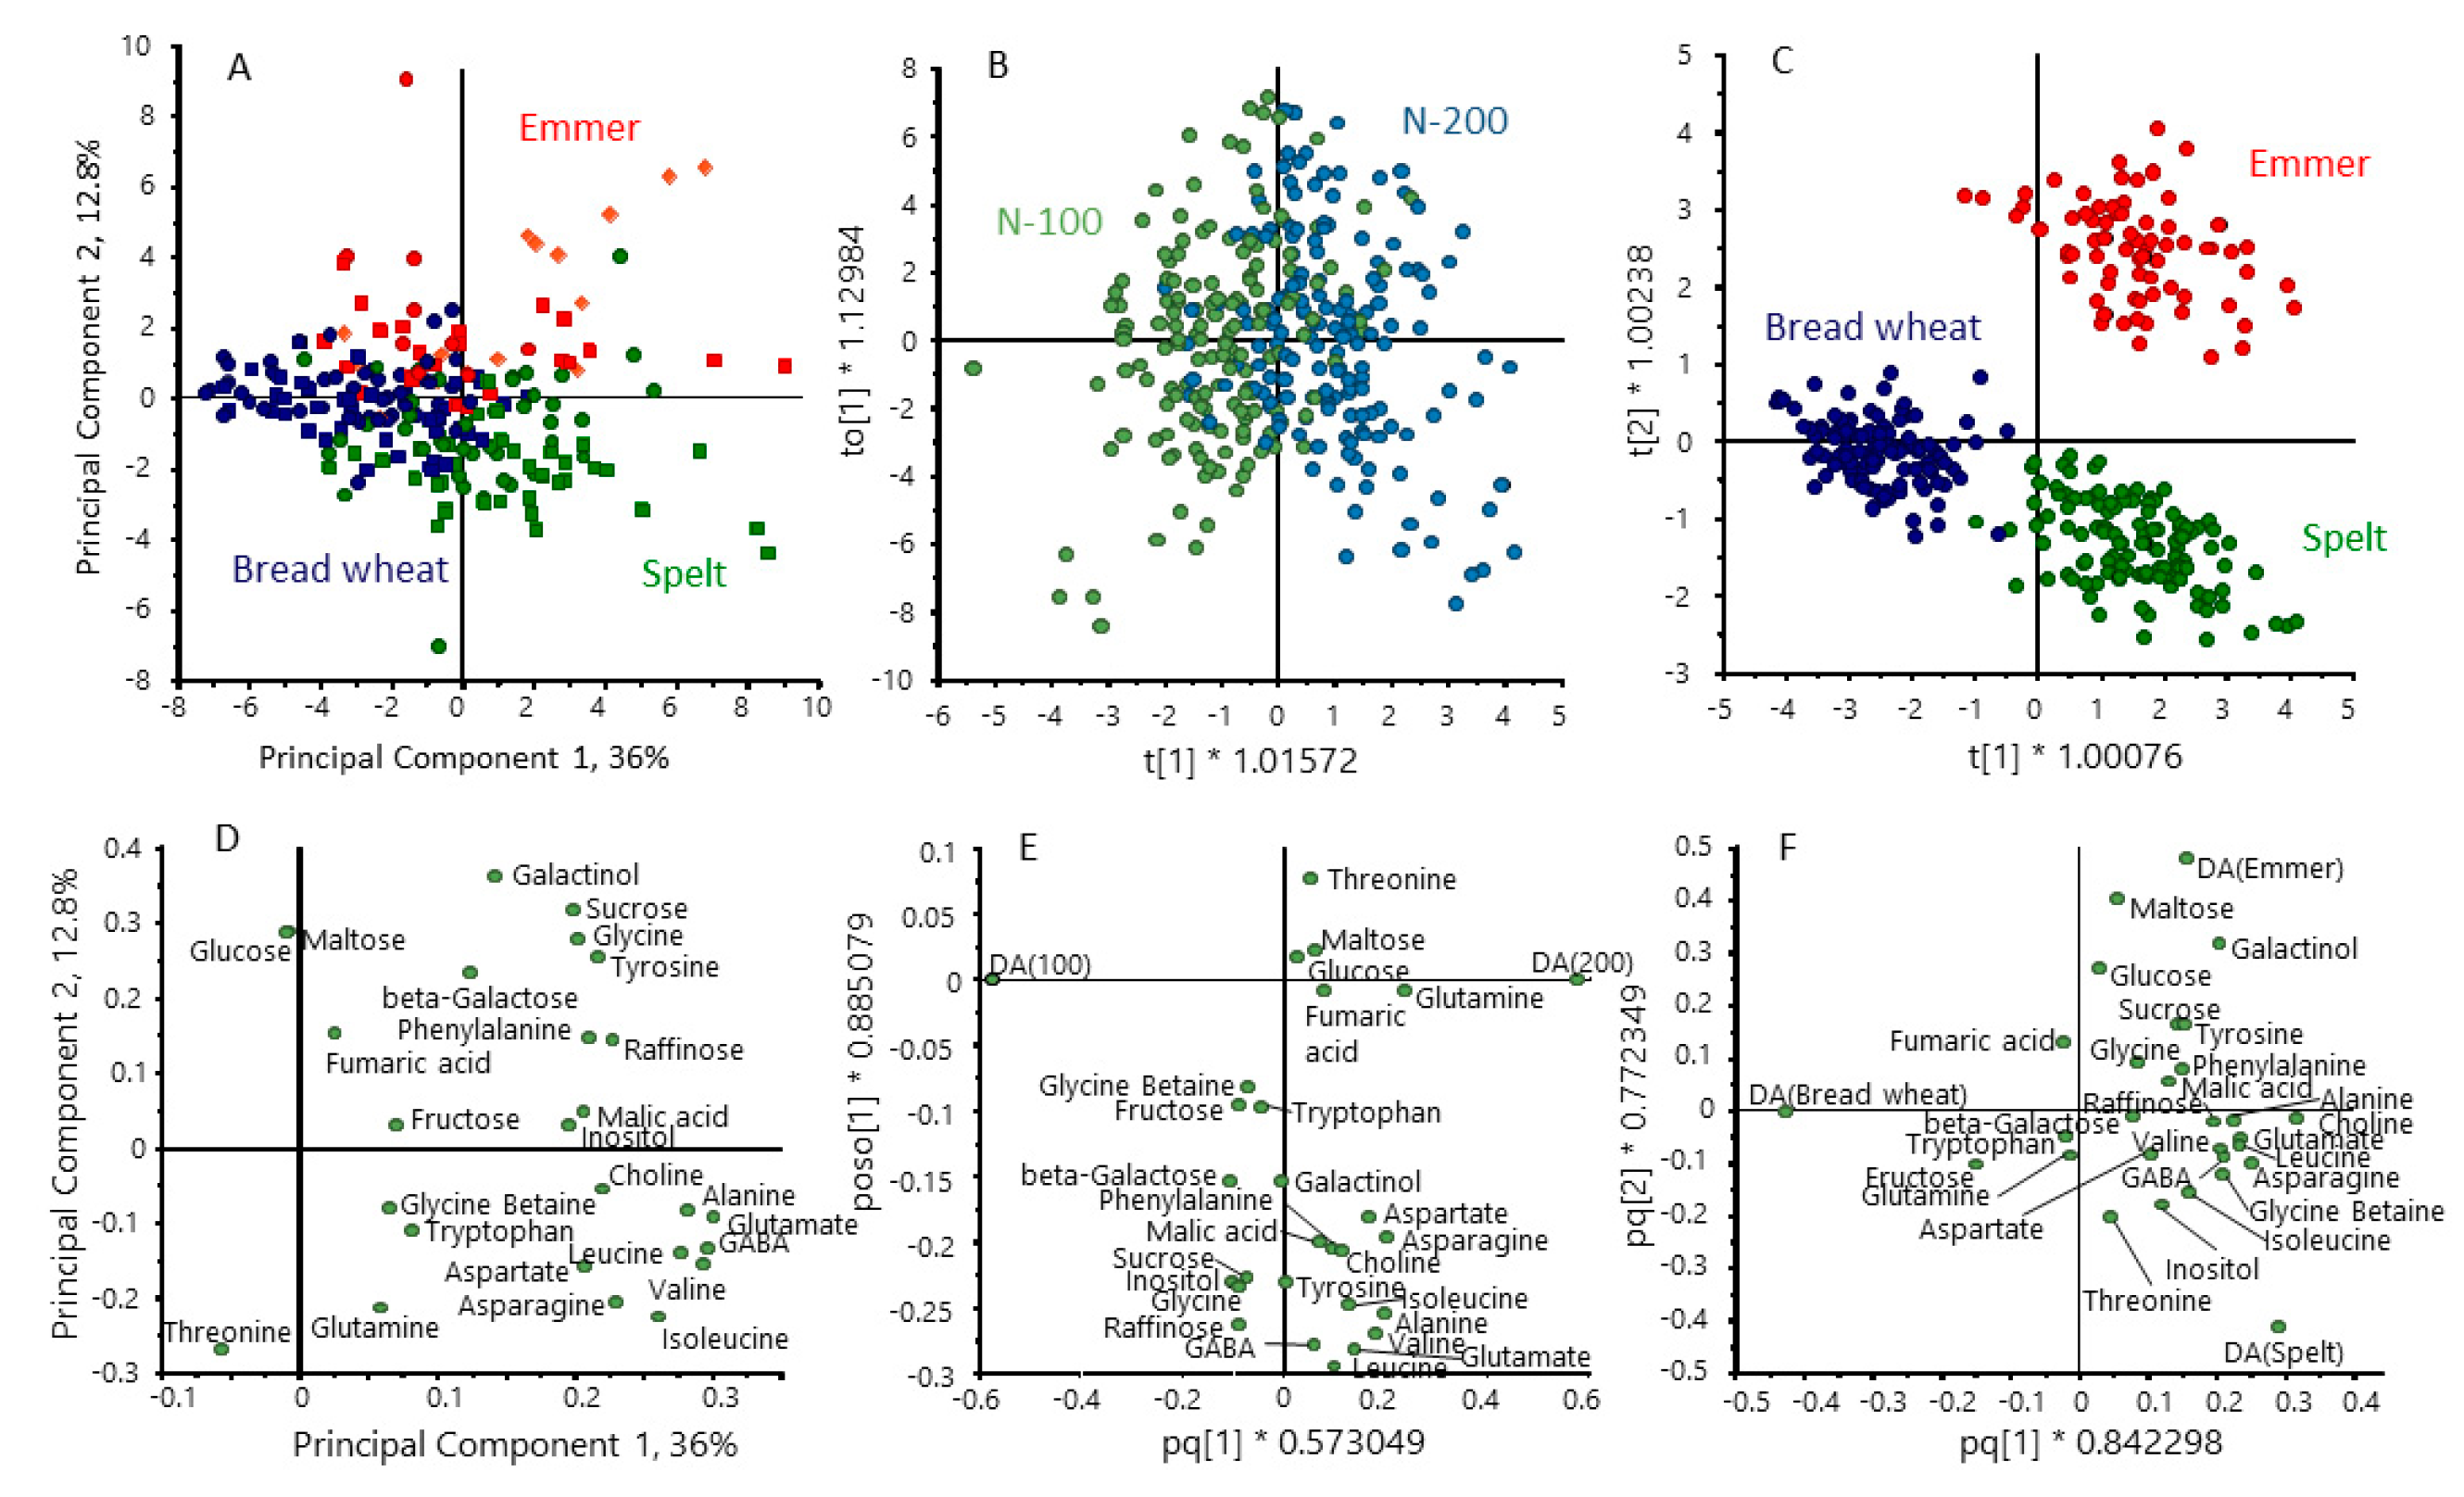
3.4. Polar Metabolites
| NLevel | Grain | Nlevel. Grain | Grain. Cultivar. Bread Wheat | Grain. Cultivar. Emmer | Grain. Cultivar. Spelt | Nlevel. Grain. Cultivar Bread Wheat | Nlevel. Grain. Cultivar Emmer | Nlevel. Grain. Cultivar Spelt | |
|---|---|---|---|---|---|---|---|---|---|
| %N | <0.001 | <0.001 | 0.475 | <0.001 | 0.098 | <0.001 | 0.704 | 0.212 | 0.642 |
| log(Ca) | <0.001 | <0.001 | 0.639 | <0.001 | <0.001 | <0.001 | 0.672 | 0.195 | 0.495 |
| log(Fe) | <0.001 | <0.001 | 0.815 | 0.566 | 0.957 | 0.064 | 0.375 | 0.936 | 0.023 |
| Mg | 0.46 | <0.001 | 0.016 | <0.001 | 0.03 | <0.001 | 0.228 | 0.351 | 0.749 |
| Zn | <0.001 | <0.001 | 0.008 | 0.012 | <0.001 | 0.556 | 0.409 | 0.834 | 0.994 |
| Total phenolics | 0.407 | <0.001 | <0.001 | 0.002 | <0.001 | <0.001 | 0.253 | 0.516 | 0.153 |
| raffinose | 0.005 | <0.001 | <0.001 | <0.001 | <0.001 | 0.001 | 0.988 | 0.271 | 0.709 |
| Log(asparagine) | <0.001 | <0.001 | 0.352 | <0.001 | 0.022 | <0.001 | 0.624 | 0.34 | 0.78 |
| Sqrt (glycine betaine) | 0.358 | <0.001 | 0.087 | <0.001 | <0.001 | <0.001 | 0.014 | 0.951 | 0.305 |
| choline | <0.001 | <0.001 | 0.535 | <0.001 | 0.005 | <0.001 | 0.852 | 0.109 | 1 |
| Sqrt (galactinol) | 0.399 | <0.001 | 0.061 | <0.001 | <0.001 | 0.605 | 0.935 | 0.146 | 0.951 |
| inositol | 0.002 | <0.001 | 0.009 | <0.001 | <0.001 | <0.001 | 0.883 | 0.06 | 0.678 |
| loge(total amino acids) | 0.002 | <0.001 | 0.598 | 0.099 | <0.001 | 0.001 | 0.095 | 0.672 | 0.464 |
| total organic acids | 0.163 | <0.001 | 0.338 | <0.001 | <0.001 | <0.001 | 0.159 | 0.771 | 0.551 |
| loge (total methyl donors) | 0.529 | <0.001 | 0.141 | <0.001 | <0.001 | <0.001 | 0.011 | 0.905 | 0.395 |
| loge(total sugars) | 0.005 | <0.001 | 0.397 | <0.001 | <0.001 | <0.001 | 0.726 | 0.23 | 0.726 |


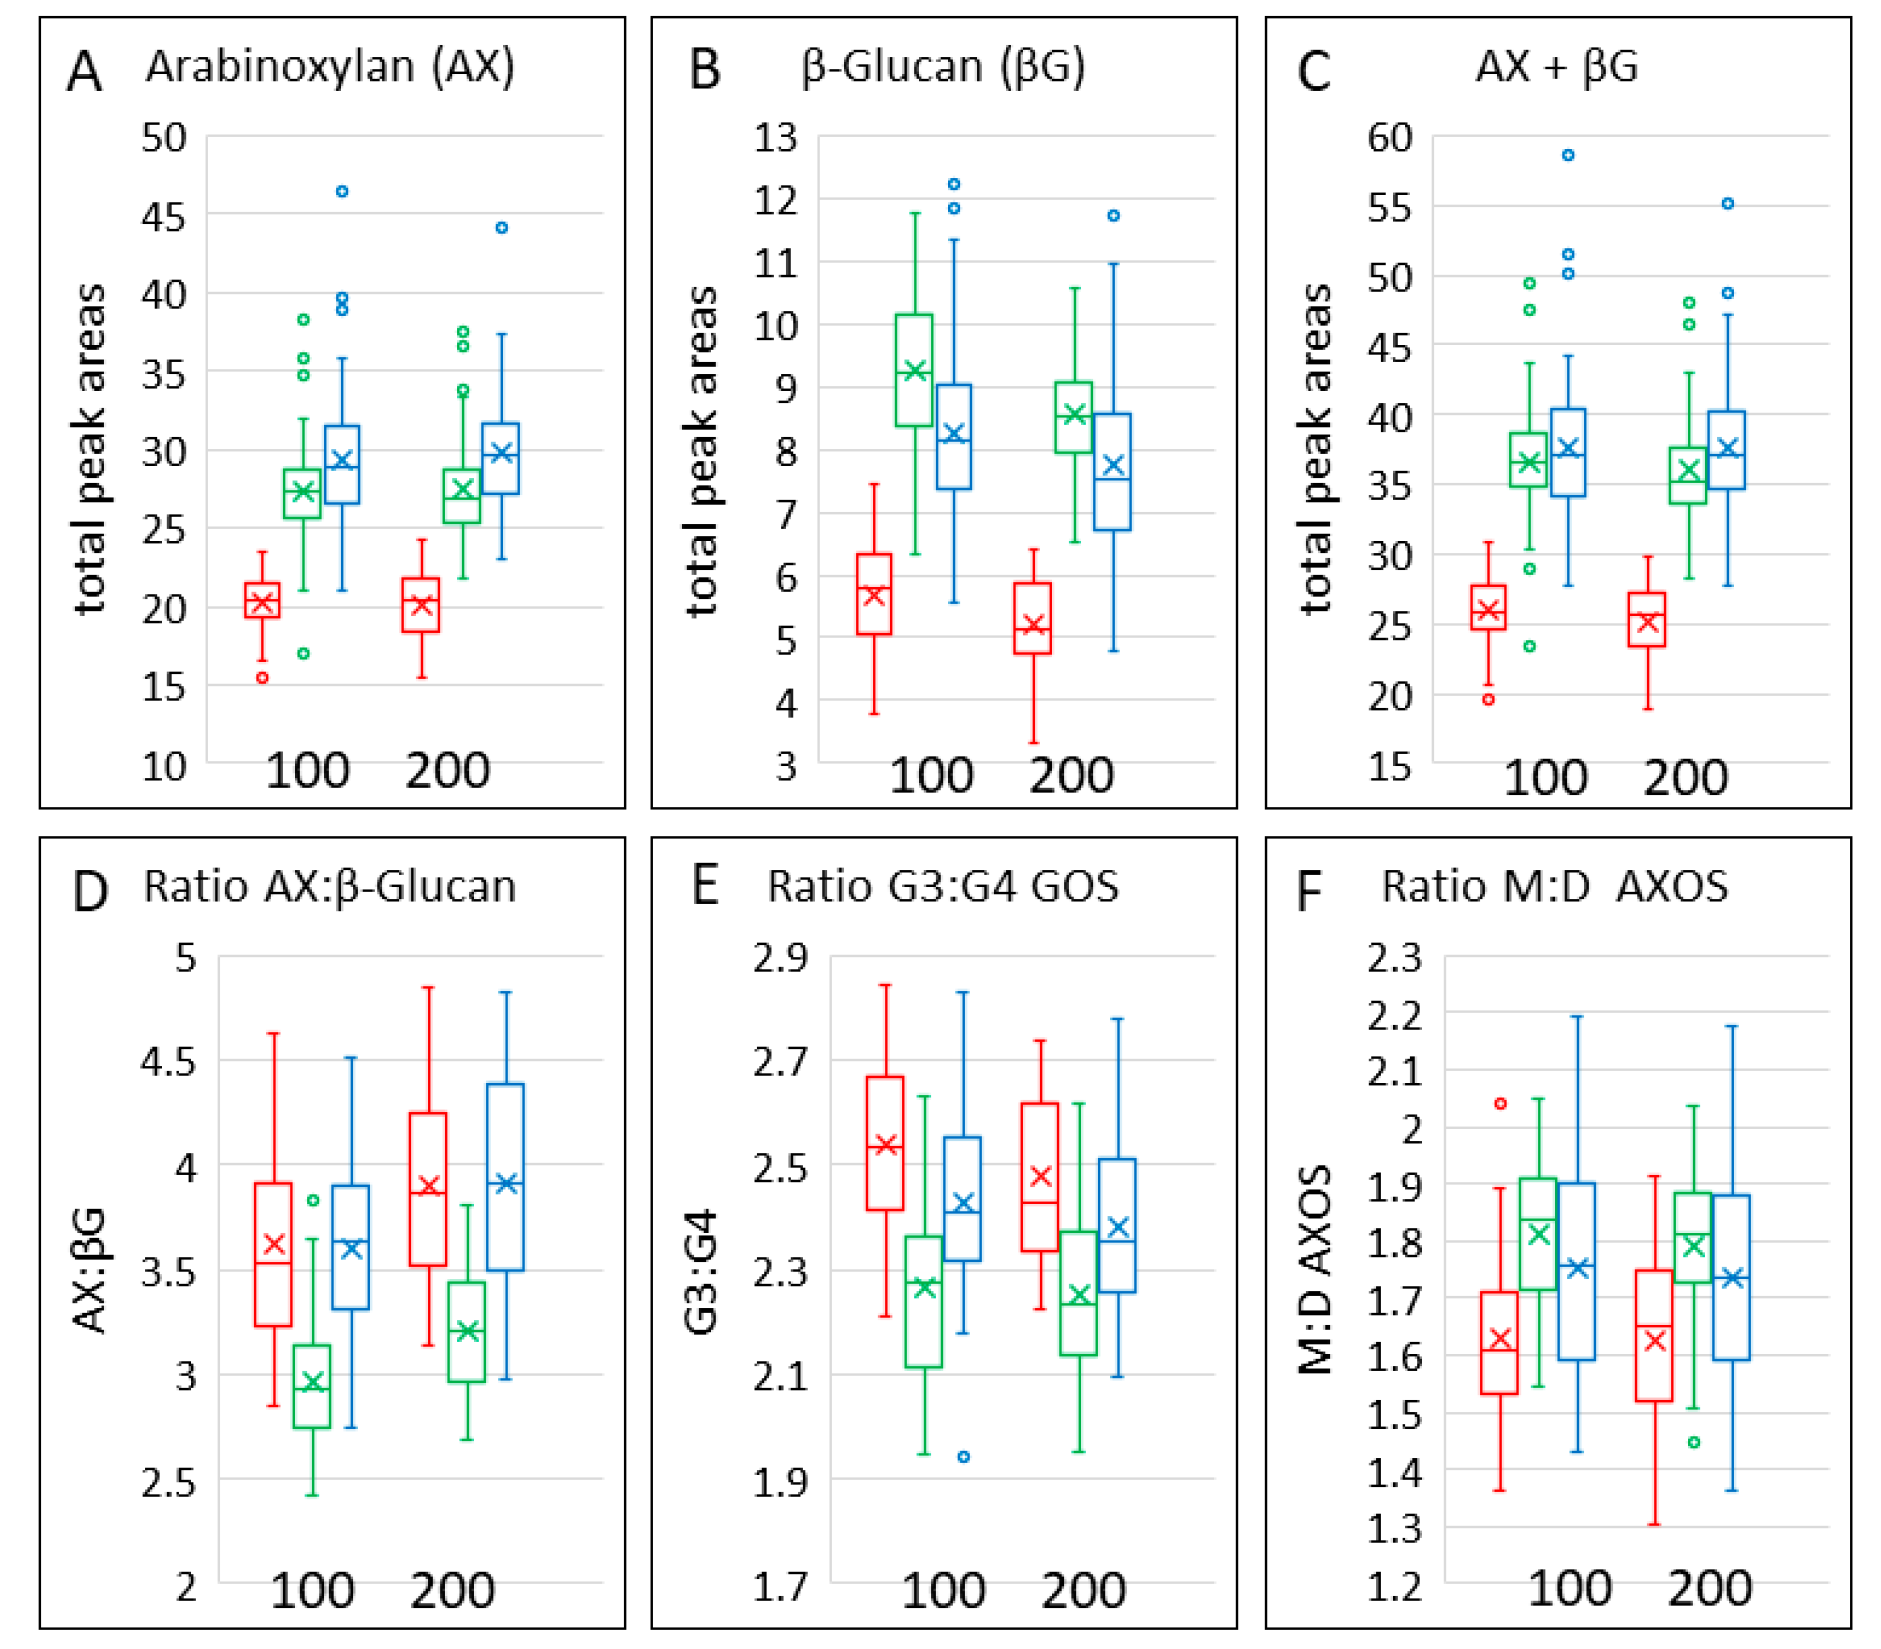
3.5. Dietary Fibre
| 100 kg N/Ha | 200 kg N/Ha | |||||
|---|---|---|---|---|---|---|
| Bread | Emmer | Spelt | Bread | Emmer | Spelt | |
| TOT-AX | 29.06 (28.18, 29.96) | 20.17 (19.43, 20.93) | 27.33 (26.51, 28.18) | 29.61 (28.72, 30.53) | 19.88 (19.16, 20.64) | 27.26 (26.44, 28.11) |
| TOT-BG | 8.146 (7.869, 8.432) | 5.617 (5.386, 5.859) | 9.256 (8.942, 9.581) | 7.63 (7.371, 7.898) | 5.142 (4.93, 5.363) | 8.521 (8.232, 8.82) |
| ratio G3:G4 GOS | 2.429 (2.395, 2.463) | 2.54 (2.497, 2.583) | 2.268 (2.234, 2.302) | 2.381 (2.347, 2.415) | 2.477 (2.434, 2.52) | 2.252 (2.218, 2.286) |
| ratio TOT-AXOS: TOT-BG | 3.596 (3.516, 3.677) | 3.619 (3.516, 3.723) | 2.968 (2.887, 3.048) | 3.915 (3.834, 3.996) | 3.895 (3.792, 3.999) | 3.212 (3.131, 3.293) |
| ratio M:D AXOS | 2.061 (2.035, 2.088) | 1.865 (1.834, 1.897) | 2.095 (2.068, 2.122) | 2.032 (2.005, 2.058) | 1.85 (1.818, 1.881) | 2.071 (2.044, 2.097) |

| Nlevel | Grain | Nlevel. Grain | Grain. Cultivar. Bread wheat | Grain. Cultivar. Emmer | Grain. Cultivar. Spelt | Nlevel. Grain. Cultivar. Bread wheat | Nlevel. Grain. Cultivar. Emmer | Nlevel. Grain. Cultivar. Spelt | |
|---|---|---|---|---|---|---|---|---|---|
| loge (TOT-AXOS) | 0.855 | <0.001 | 0.514 | <0.001 | <0.001 | <0.001 | 0.42 | 0.848 | 0.926 |
| loge (TOT-BG) | 0.002 | <0.001 | 0.758 | <0.001 | <0.001 | 0.085 | 0.659 | 0.501 | 0.76 |
| ratio G3:G4 GOS | 0.032 | <0.001 | 0.427 | 0.509 | 0.197 | <0.001 | 0.711 | 0.513 | 0.423 |
| ratio TOT -AXOS: TOT-BG | <0.001 | <0.001 | 0.655 | <0.001 | 0.121 | <0.001 | 0.715 | 0.218 | 0.564 |
| Sqrt (ratio M:D AXOS) | 0.093 | <0.001 | 0.899 | <0.001 | <0.001 | <0.001 | 0.249 | 0.775 | 0.902 |

4. Discussion
Supplementary Materials
Author Contributions
Funding
Data Availability Statement
Acknowledgments
Conflicts of Interest
References
- Pont, C.; Leroy, T.; Seidel, M.; Tondelli, A.; Duchemin, W.; Armisen, D.; Lang, D.; Bustos-Korts, D.; Goué, N.; Balfourier, F. Tracing the ancestry of modern bread wheats. Nat. Genet. 2019, 51, 905–911. [Google Scholar] [CrossRef] [PubMed]
- Gilissen, L.J.W.J.; Smulders, M.J.M. Gluten Quality and Quantity in Wheat and in Wheat-Derived Products. In Biotechnological Strategies for the Treatment of Gluten Intolerances; Rossi, M., Ed.; Academic Press-Elsevier: London, UK, 2021; pp. 79–129. [Google Scholar]
- Shewry, P.R. What is gluten—Why is it special. Front. Nutr. 2019, 6, 101. [Google Scholar] [CrossRef] [PubMed]
- Morris, C.E.; Sands, D.C. The breeder’s dilemma–yield or nutrition? Nat. Biotechnol. 2003, 24, 1078–1080. [Google Scholar] [CrossRef] [PubMed]
- Sands, D.C.; Morris, C.E.; Dratz, E.A.; Pilgeram, A.L. Elevating optimal human nutrition to a central goal of plant breeding and production of plant-based foods. Plant Sci. 2009, 177, 377–389. [Google Scholar] [CrossRef]
- Burridge, A.J.; Winfield, M.O.; Allen, A.M.; Wilkinson, P.A.; Barker, G.L.A.; Coghill, J.; Waterfall, C.; Edwards, K.J. High-density SNP genotyping array for hexaploidy wheat and its relatives. In Wheat Biotechnology: Methods and Protocols; Bhalla, P.L., Singh, M.B., Eds.; Humana Press: New York, NY, USA, 2017; pp. 293–306. [Google Scholar] [CrossRef]
- Zheng, X.; Levine, D.; Shen, J.; Gogarten, S.M.; Laurie, C.; Weir, B.S. A high performance computing toolset for relatedness and principal component analysis of SNP data. Bioinformatics 2012, 28, 3326–3328. [Google Scholar] [CrossRef]
- Lovegrove, A.; Wilkinson, M.D.; Freeman, J.; Pellny, T.; Tosi, P.; Saulnier, L.; Shewry, P.R.; Mitchell, R.A.C. RNA interference suppression of genes in glycosyl transferase families 43 and 47 in wheat starchy endosperm causes large decreases in arabinoxylan content. Plant Physiol. 2013, 163, 95–107. [Google Scholar] [CrossRef]
- Shewry, P.R.; Corol, D.; Jones, H.D.; Beale, M.H.; Ward, J.L. (2017) Defining genetic and chemical diversity in wheat grain by 1H-NMR spectroscopy of polar metabolites. Mol. Nutr. Food Res. 2017, 61, 1600807. [Google Scholar] [CrossRef]
- Gao, L.; Wang, S.; Oomah, B.D.; Mazza, G. Wheat quality: Antioxidant activity of wheat millstreams. In Wheat Quality Elucidation; Ng, P., Wrigley, C.W., Eds.; AACC International: St. Paul, MN, USA, 2002; pp. 219–233. [Google Scholar]
- Ward, J.L.; Poutanen, K.; Gebruers, K.; Piironen, V.; Lampi, A.-M.; Nyström, L.; Andersson, A.A.M.; Åman, P.; Boros, D.; Rakszegi, M.; et al. The HEALTHGRAIN cereal diversity screen: Concept, results and prospects. J. Agric. Food Chem. 2008, 56, 9699–9709. [Google Scholar] [CrossRef]
- Mottram, D.S.; Wedzicha, B.L.; Dodson, A.T. Acrylamide is formed in the Maillard reaction. Nature 2002, 419, 448–449. [Google Scholar] [CrossRef]
- Muttucumaru, N.; Elmore, J.S.; Curtis, T.; Mottram, D.S.; Parry, M.A.J.; Halford, N.G. Reducing acrylamide precursors in raw materials derived from wheat and potato. J. Agric. Food Chem. 2008, 56, 6167–6172. [Google Scholar] [CrossRef]
- Corol, D.I.; Ravel, C.; Raksegi, M.; Bedo, Z.; Charmet, G.; Beale, M.H.; Shewry, P.R.; Ward, J.L. Effects of genotype and environment on the contents of betaine, choline and trigonelline in cereal grains. J. Agric. Food Chem. 2012, 60, 5471–5481. [Google Scholar] [CrossRef] [PubMed]
- Sengupta, S.; Mukherjee, S.; Basak, P.; Majumder, A.L. Significance of galactinol and raffinose family oligosaccharide synthesis in plants. Front. Plant Sci. 2015, 6, 656. [Google Scholar] [CrossRef] [PubMed]
- Shewry, P.R.; America, A.H.P.; Lovegrove, A.; Wood, A.J.; Plummer, A.; Evans, J.; van den Broeck, H.C.; Gilissen, L.; Mumm, R.; Ward, J.L.; et al. Comparative compositions of metabolites and dietary fibre components in doughs and breads produced from bread wheat, emmer and spelt and using yeast and sourdough processes. Food Chem. 2022, 374, 131710. [Google Scholar] [CrossRef] [PubMed]
- Lovegrove, A.; Pellny, T.K.; Hassall, K.; Plummer, A.; Wood, A.; Bellisai, A.; Przewieslik-Allen, A.; Burridge, A.L.; Ward, J.L.; Shewry, P.R.; et al. Historical changes in the contents and compositions of fibre components and polar metabolites in white flour. Sci. Rep. 2020, 10, 5920. [Google Scholar] [CrossRef] [PubMed]
- Fan, M.; Zhao, F.-J.; Fairweather-Tait, S.J.; Poulton, P.R.; Dunham, S.J.; McGrath, S.P. Evidence of decreasing mineral density in wheat grain over the last 160 years. J. Trace Elem. Med. Biol. 2018, 22, 315–324. [Google Scholar] [CrossRef] [PubMed]
- Shewry, P.R.; Pellny, T.K.; Lovegrove, A. Is modern wheat bad for health? Nat. Plants 2016, 2, 16097. [Google Scholar] [CrossRef] [PubMed]
- Obeid, R. The metabolic burden of methyl donor deficiency with focus on the betaine homocysteine methyltransferase pathway. Nutrients 2013, 5, 3481–3495. [Google Scholar] [CrossRef]
- Zeisel, S.H.; Blusztajn, J.K. Choline and human nutrition. Annu. Rev. Nutr. 1994, 14, 269–296. [Google Scholar] [CrossRef]
- Andersson, A.A.M.; Andersson, R.; Piironen, V.; Lampi, A.-M.; Nyström, L.; Boros, D.; Fraś, A.; Gebruers, K.; Courtin, C.M.; Delcour, J.; et al. Contents of dietary fibre components and their relation to associated bioactive components in whole grain wheat samples from the HEALTHGRAIN diversity screen. Food Chem. 2013, 136, 1243–1248. [Google Scholar] [CrossRef] [PubMed]
- Mares, D.J.; Stone, B.A. Studies on wheat endosperm. I. Chemical composition and ultrastructure of the cell walls. Aus. J. Biol. Sci. 1973, 26, 793–812. [Google Scholar]
- Shewry, P.R.; Hey, S. Do “ancient” wheat species differ from modern bread wheat in their contents of bioactive components? J. Cereal Sci. 2015, 65, 236–243. [Google Scholar] [CrossRef]
- Barrett, J.S.; Gibson, P.R. Fermentable oligosaccharides, disaccharides, monosaccharides and polyols (FODMAPs) and nonallergic food intolerance: FODMAPs or food chemicals. Ther. Adv. Gastroenterol. 2012, 5, 261–268. [Google Scholar] [CrossRef] [PubMed]
- Zebarth, B.J.; Warren, C.J.; Sheard, R.W. Influence of the rate of nitrogen fertilisation on the mineral content of winter wheat in Ontario. J. Agric. Food Chem. 1992, 40, 1526–1530. [Google Scholar] [CrossRef]
- Shewry, P.R. Effects of nitrogen and sulfur nutrition on grain composition and properties of wheat and related cereals. In The Molecular and Physiological Basis of Nutrient Use Efficiency in Crops; Hawkesford, M.J., Barraclough, P., Eds.; Wiley-Blackwell: Chichester, UK, 2011; pp. 103–120. [Google Scholar]
- Oddy, J.; Raffan, S.; Wilkinson, M.D.; Elmore, J.S.; Halford, N.G. Understanding the Relationships between Free Asparagine in Grain and Other Traits to Breed Low-Asparagine Wheat. Plants 2022, 11, 669. [Google Scholar] [CrossRef] [PubMed]
- Longin, C.F.H.; Ziegler, J.U.; Schweiggert, R.M.; Koehler, P.; Carle, R.; Würschum, T. Comparative study of hulled (einkorn, emmer and spelt) and naked wheats (durum and bread wheat): Agronomic performance and quality traits. Crop Sci. 2016, 56, 302–311. [Google Scholar] [CrossRef]
- Ziegler, J.U.; Schweiggert, R.M.; Würschum, T.; Longin, C.F.H.; Carle, R. Lipophilic antioxidants in wheat (Triticum spp.): A target for breeding new varieties for future functional cereal products. J. Funct. Foods 2016, 20, 594–605. [Google Scholar] [CrossRef]
- Ziegler, J.U.; Steiner, D.; Longin, C.F.H.; Würschum, T.; Schweiggert, R.M.; Carle, R. Wheat and the irritable bowel syndrome–FODMAP levels of modern and ancient species and their retention during bread making. J. Funct. Foods 2016, 25, 257–266. [Google Scholar] [CrossRef]
- Masisi, K.; Beta, T.; Moghadasian, M.H. Antioxidant properties of diverse cereal grains: A review on in vitro and in vivo studies. Food Chem. 2016, 196, 90–97. [Google Scholar] [CrossRef]
- Leváková, L.; Lacko-Bartošová, M. Phenolic acids and antioxidant activity of wheat species: A review. Agriculture 2017, 63, 92–101. [Google Scholar] [CrossRef]
- Kwiatkowski, C.A.; Harasim, E.; Feledyn-Szewczyk, B.; Joniec, J. The antioxidant potential of grains in selected cereals grown in an organic and conventional system. Agriculture 2022, 12, 1485. [Google Scholar] [CrossRef]
- Pompella, A.; Sies, H.; Wacker, R.; Brouns, F.; Grune, T.; Biesalski, H.K.; Frank, J. The use of total antioxidant capacity as surrogate marker for food quality and its effect on health is to be discouraged. Nutrition 2014, 30, 791–793. [Google Scholar] [CrossRef] [PubMed]
- Borczak, B.; Marek, M.; Sikora, E.; Dobosz, A.; Kapusta-Duch, J. Glycaemic index of white bread. Starch 2018, 70, 17022. [Google Scholar] [CrossRef]
- Schenk, S.; Davidson, C.J.; Zderic, T.W.; Byerley, L.O.; Coyle, E.F. Different glycemic indexes of breakfast cereals are not due to glucose entry into blood but to glucose removal by tissue. Am. J. Clin. Nutr. 2003, 78, 742–748. [Google Scholar] [CrossRef]
- Eelderink, C.; Moerdijk-Poortvliet, T.C.; Wang, H.; Schepers, M.; Preston, T.; Boer, T.; Vonk, R.J.; Schierbeek, H.; Priebe, M.G. The glycemic response does not reflect the in vivo starch digestibility of fiber-rich wheat products in healthy men. J. Nutr. 2012, 142, 258–263. [Google Scholar] [CrossRef] [PubMed]
- Rojas-Bonzi, P.; Vangsøe, C.T.; Nielsen, K.L.; Lærke, H.N.; Hedemann, M.S.; Knudsen, K.E.B. The relationship between In vitro and In vivo starch digestion kinetics of breads varying in dietary fibre. Foods 2020, 9, 1337. [Google Scholar] [CrossRef]
- Dodd, H.; Williams, S.; Brown, R.; Venn, B. Calculating meal glycemic index by using measured and published food values compared with directly measured meal glycemic index. Am. J. Clin. Nutr. 2011, 94, 992–996. [Google Scholar] [CrossRef]
- Vanhatalo, S.; Dall’Asta, M.; Cossu, M.; Chiavaroli, L.; Francinelli, V.; Pede, G.D.; Dodi, R.; Närväinen, J.; Antonini, M.; Goldoni, M.; et al. Pasta structure affects mastication, bolus properties, and postprandial glucose and insulin metabolism in healthy adults. J. Nutr. 2022, 152, 994–1005. [Google Scholar] [CrossRef]
- Călinoiu, L.F.; Vodnar, D.C. Whole Grains and Phenolic Acids: A Review on Bioactivity, Functionality, Health Benefits and Bioavailability. Nutrients 2018, 10, 1615. [Google Scholar] [CrossRef]
- Serban, L.R.; Paucean, A.; Man, S.M.; Chis, M.S.; Muresan, V. Ancient wheat species: Biochemical profile and impact on sourdough bread characteristics—A review. Processes 2021, 9, 2008. [Google Scholar] [CrossRef]
- Balk, J.; Connorton, J.M.; Wan, Y.; Lovegrove, A.; Moore, K.L.; Uauy, C.; Sharp, P.; Shewry, P.R. Improving wheat as a source of iron and zinc for global nutrition. Nutr. Bull. 2018, 44, 53–59. [Google Scholar] [CrossRef]

Disclaimer/Publisher’s Note: The statements, opinions and data contained in all publications are solely those of the individual author(s) and contributor(s) and not of MDPI and/or the editor(s). MDPI and/or the editor(s) disclaim responsibility for any injury to people or property resulting from any ideas, methods, instructions or products referred to in the content. |
© 2023 by the authors. Licensee MDPI, Basel, Switzerland. This article is an open access article distributed under the terms and conditions of the Creative Commons Attribution (CC BY) license (https://creativecommons.org/licenses/by/4.0/).
Share and Cite
Lovegrove, A.; Dunn, J.; Pellny, T.K.; Hood, J.; Burridge, A.J.; America, A.H.P.; Gilissen, L.; Timmer, R.; Proos-Huijsmans, Z.A.M.; van Straaten, J.P.; et al. Comparative Compositions of Grain of Bread Wheat, Emmer and Spelt Grown with Different Levels of Nitrogen Fertilisation. Foods 2023, 12, 843. https://doi.org/10.3390/foods12040843
Lovegrove A, Dunn J, Pellny TK, Hood J, Burridge AJ, America AHP, Gilissen L, Timmer R, Proos-Huijsmans ZAM, van Straaten JP, et al. Comparative Compositions of Grain of Bread Wheat, Emmer and Spelt Grown with Different Levels of Nitrogen Fertilisation. Foods. 2023; 12(4):843. https://doi.org/10.3390/foods12040843
Chicago/Turabian StyleLovegrove, Alison, Jack Dunn, Till K. Pellny, Jessica Hood, Amanda J. Burridge, Antoine H. P. America, Luud Gilissen, Ruud Timmer, Zsuzsan A. M. Proos-Huijsmans, Jan Philip van Straaten, and et al. 2023. "Comparative Compositions of Grain of Bread Wheat, Emmer and Spelt Grown with Different Levels of Nitrogen Fertilisation" Foods 12, no. 4: 843. https://doi.org/10.3390/foods12040843
APA StyleLovegrove, A., Dunn, J., Pellny, T. K., Hood, J., Burridge, A. J., America, A. H. P., Gilissen, L., Timmer, R., Proos-Huijsmans, Z. A. M., van Straaten, J. P., Jonkers, D., Ward, J. L., Brouns, F., & Shewry, P. R. (2023). Comparative Compositions of Grain of Bread Wheat, Emmer and Spelt Grown with Different Levels of Nitrogen Fertilisation. Foods, 12(4), 843. https://doi.org/10.3390/foods12040843