Effects of Sucrose Replacement by Polyols on the Dough-Biscuit Transition: Understanding by Model Systems

 ,
,  and
and
Abstract
:
1. Introduction
2. Materials and Methods
2.1. Materials
2.1.1. Ingredients
2.1.2. Model System
2.1.3. Biscuit Dough Preparation
2.2. Dough Structure as Observed with Environmental Scanning Electron Microscopy
2.2.1. Dough Water Content
2.2.2. Observation of Sweeteners in SEM
2.2.3. Observation of Biscuit Dough in ESEM
2.3. Study of Major Ingredient Interactions in Dough and Model Systems
2.3.1. Wide-Angle X-ray Diffraction Analysis
2.3.2. Differential Scanning Calorimetry
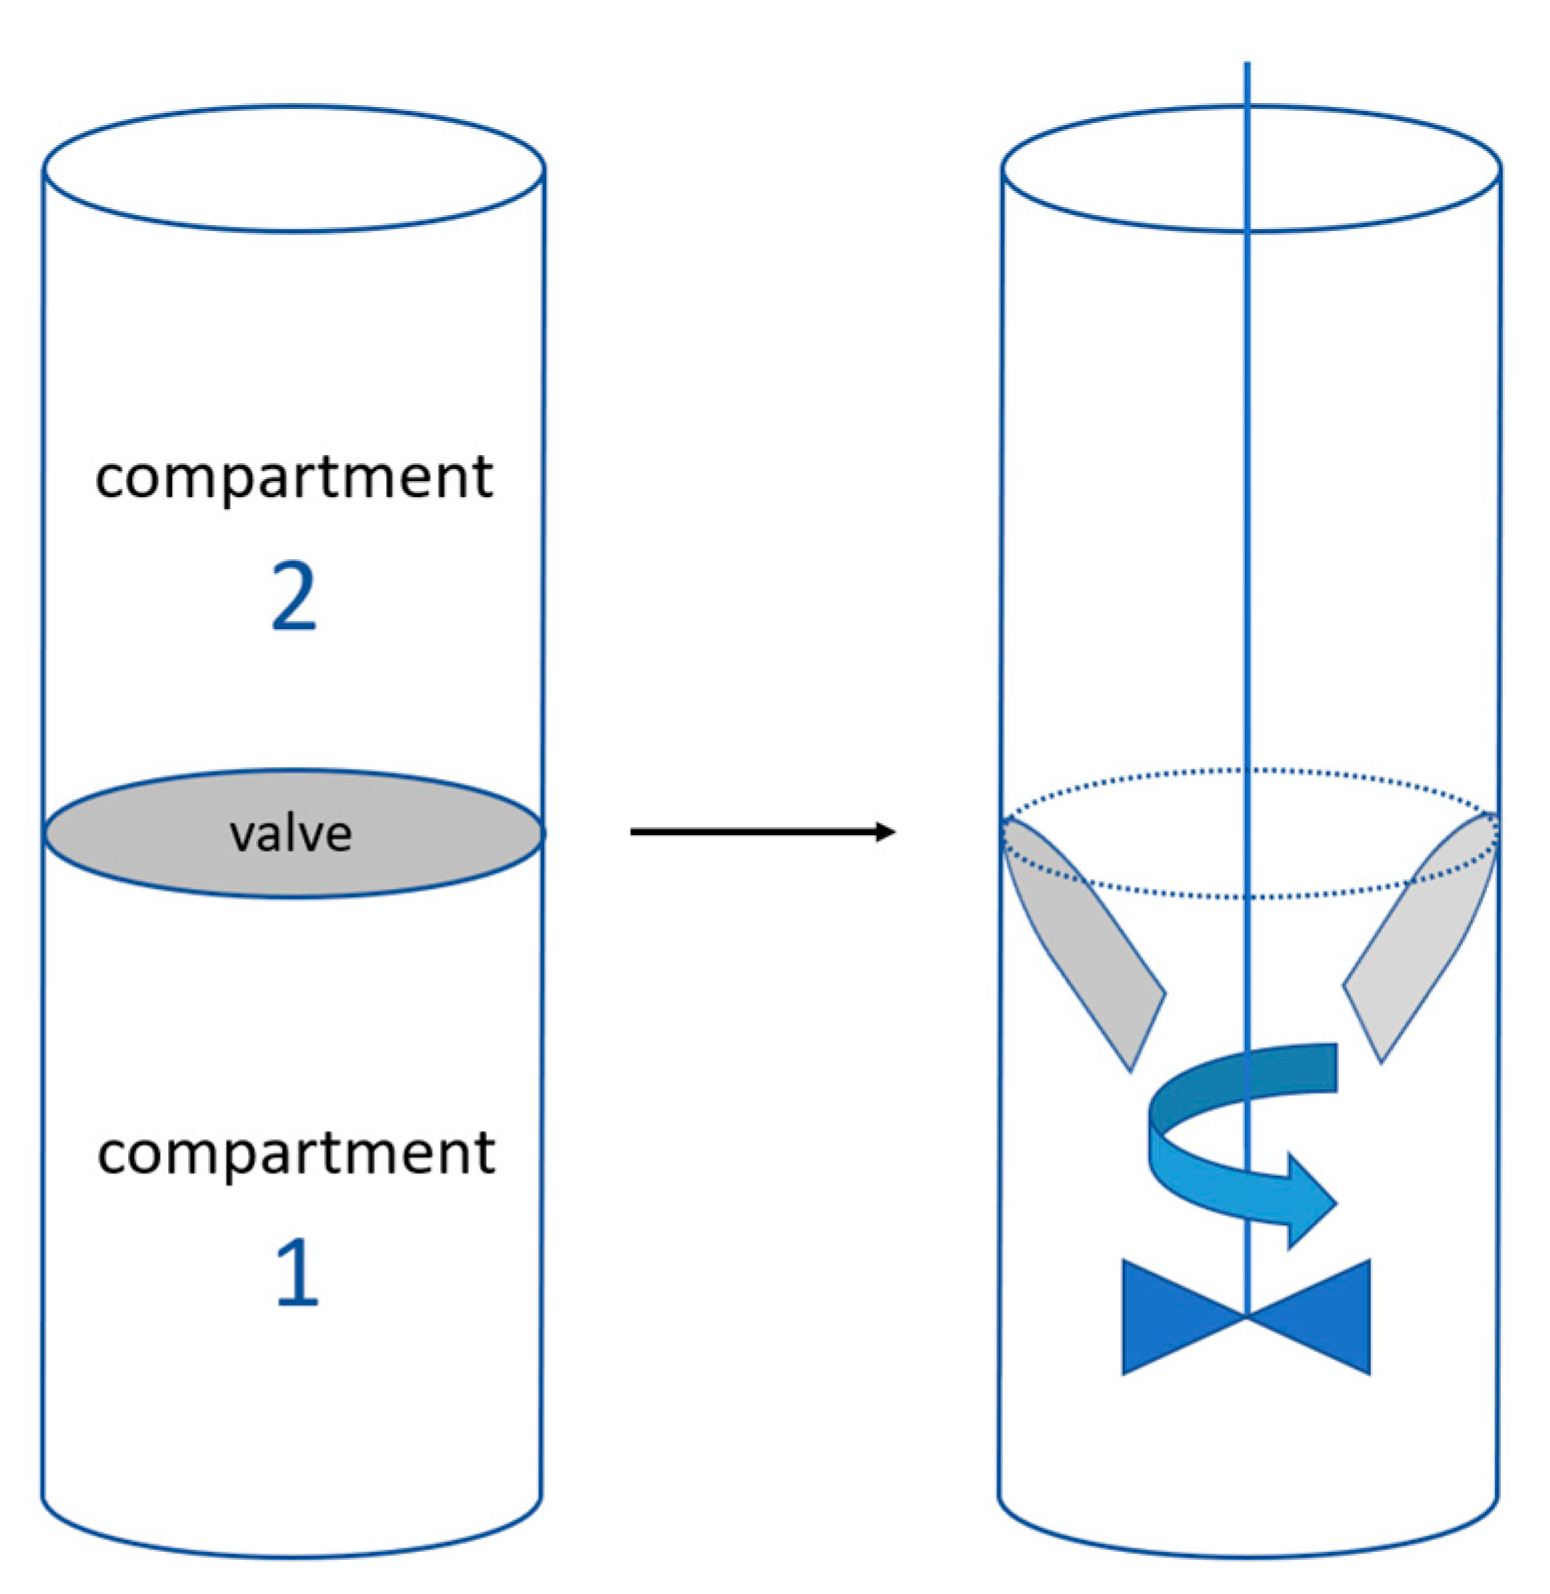
2.3.3. Mixing “Batch” Cells
2.4. Statistical Analysis
3. Results and Discussion
3.1. Surface Aspect and Structure of Doughs
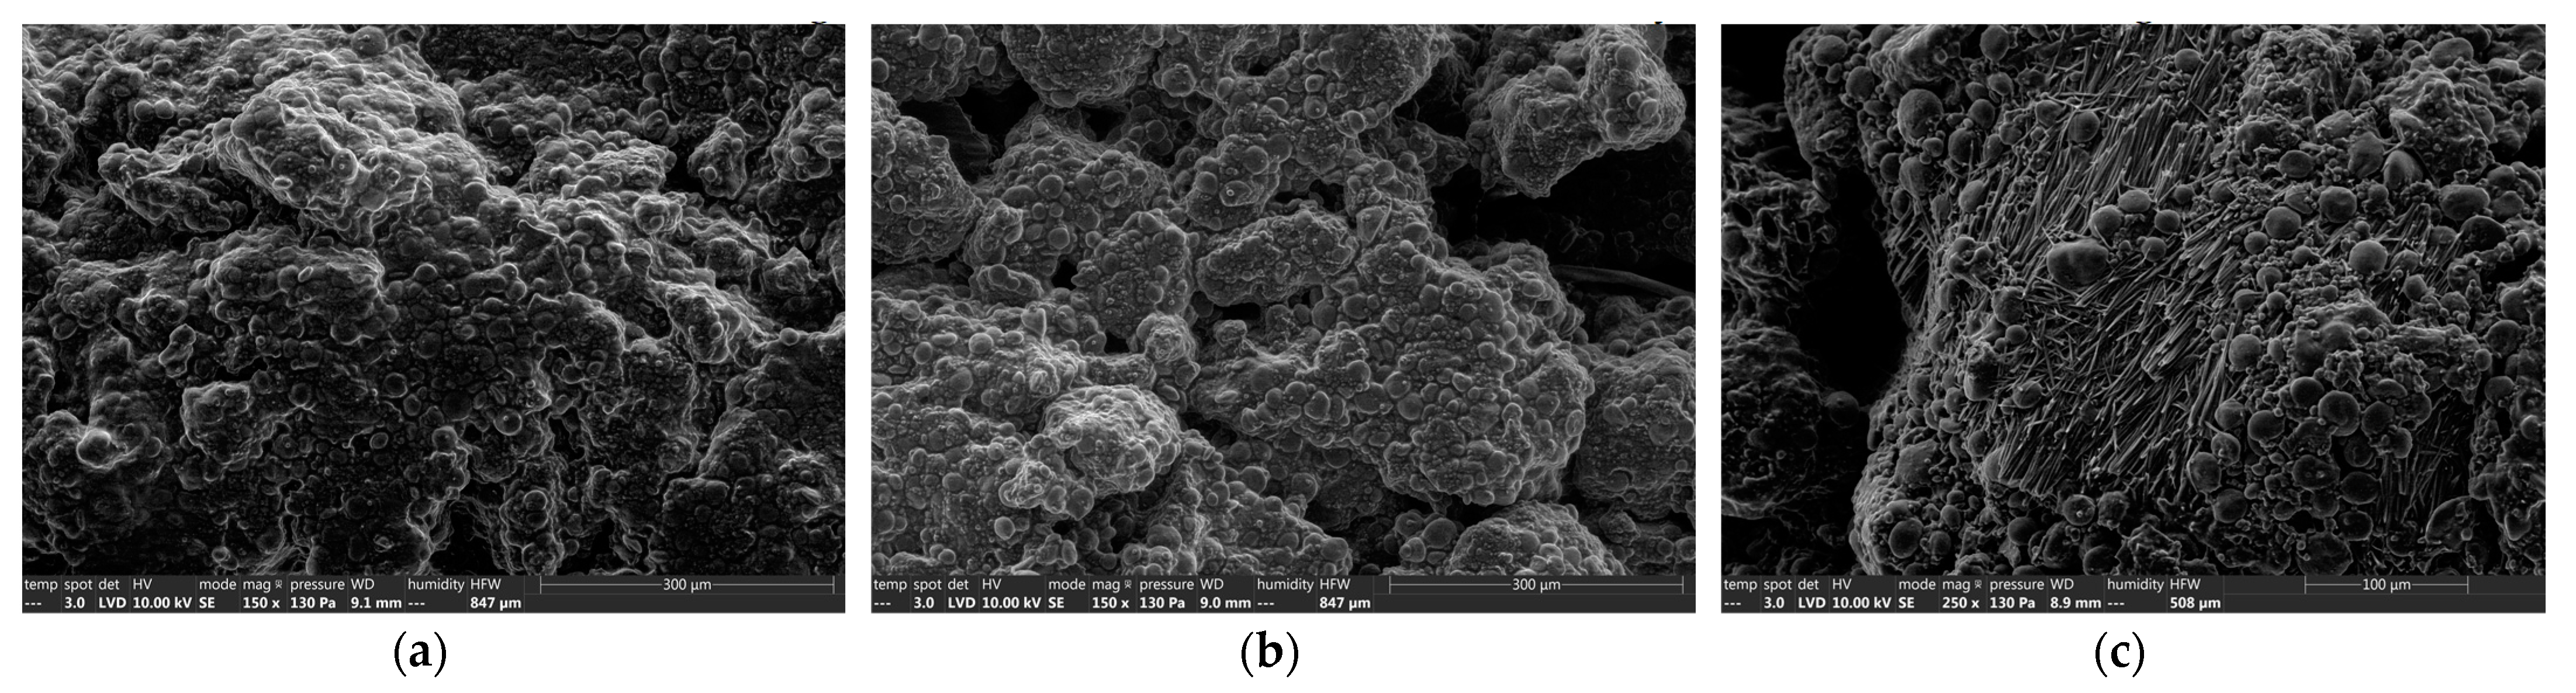
3.1.1. Sweetener Features
3.1.2. Loose Dough
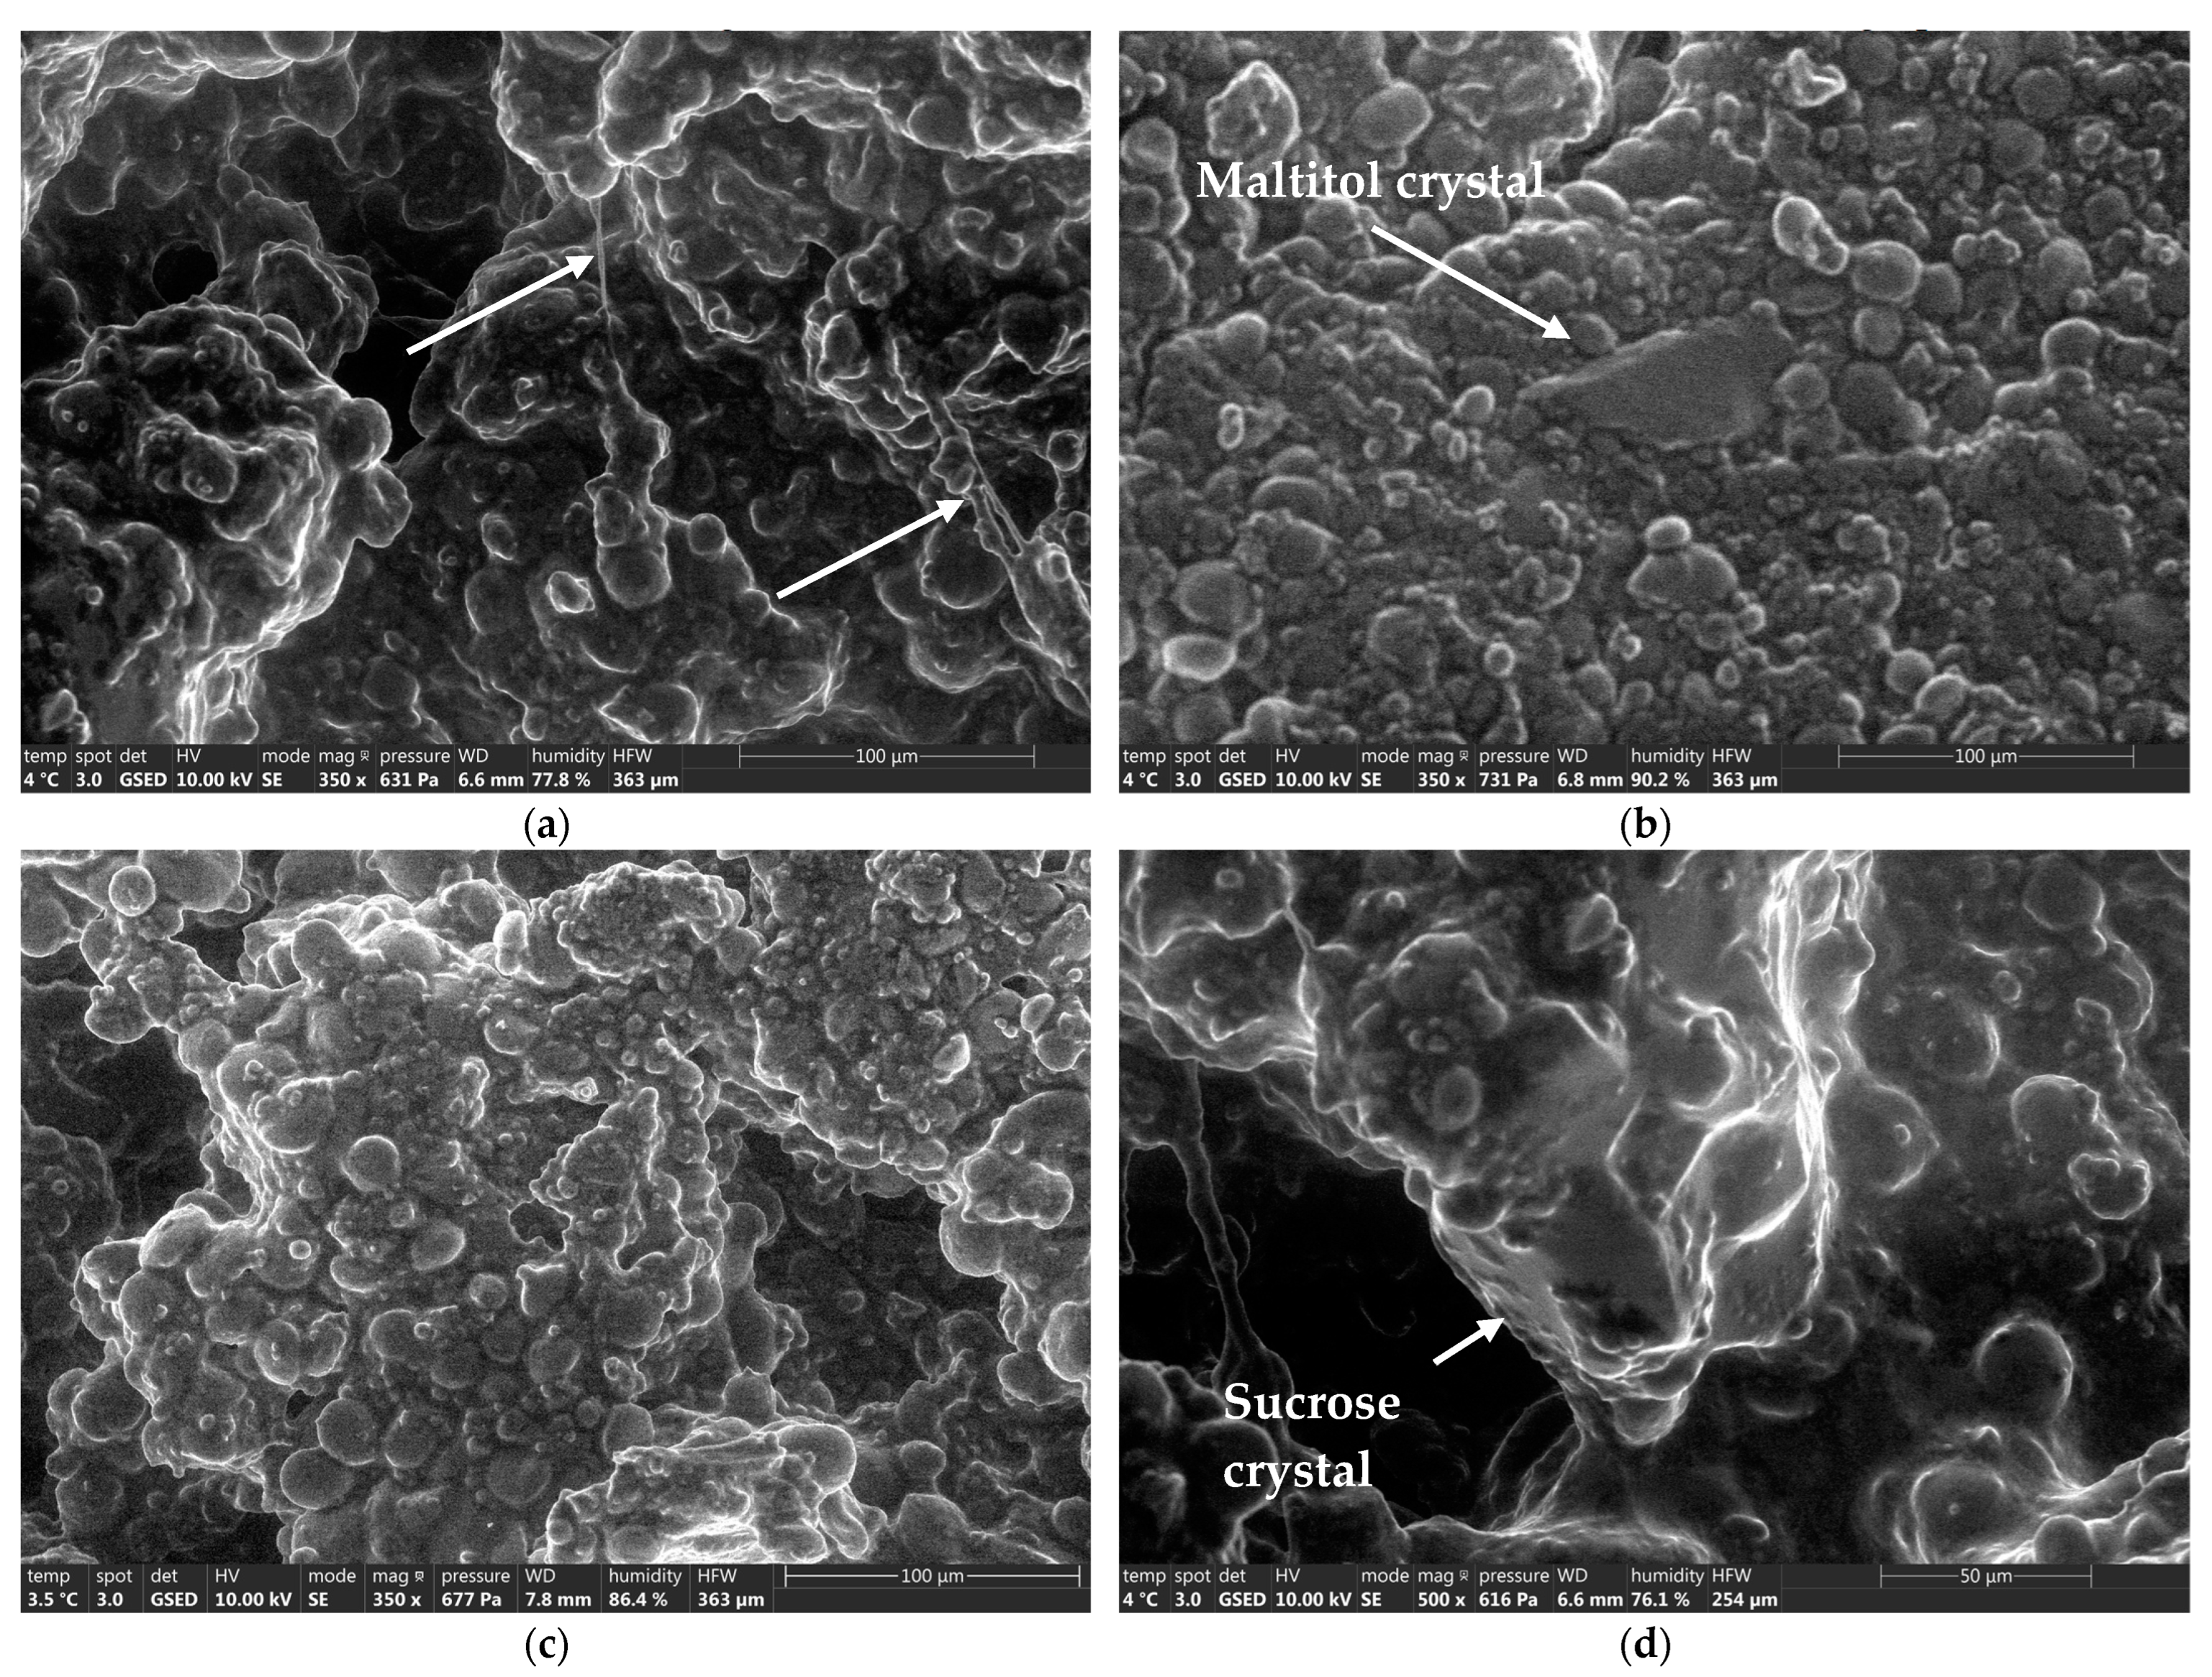
3.1.3. Dough Pieces
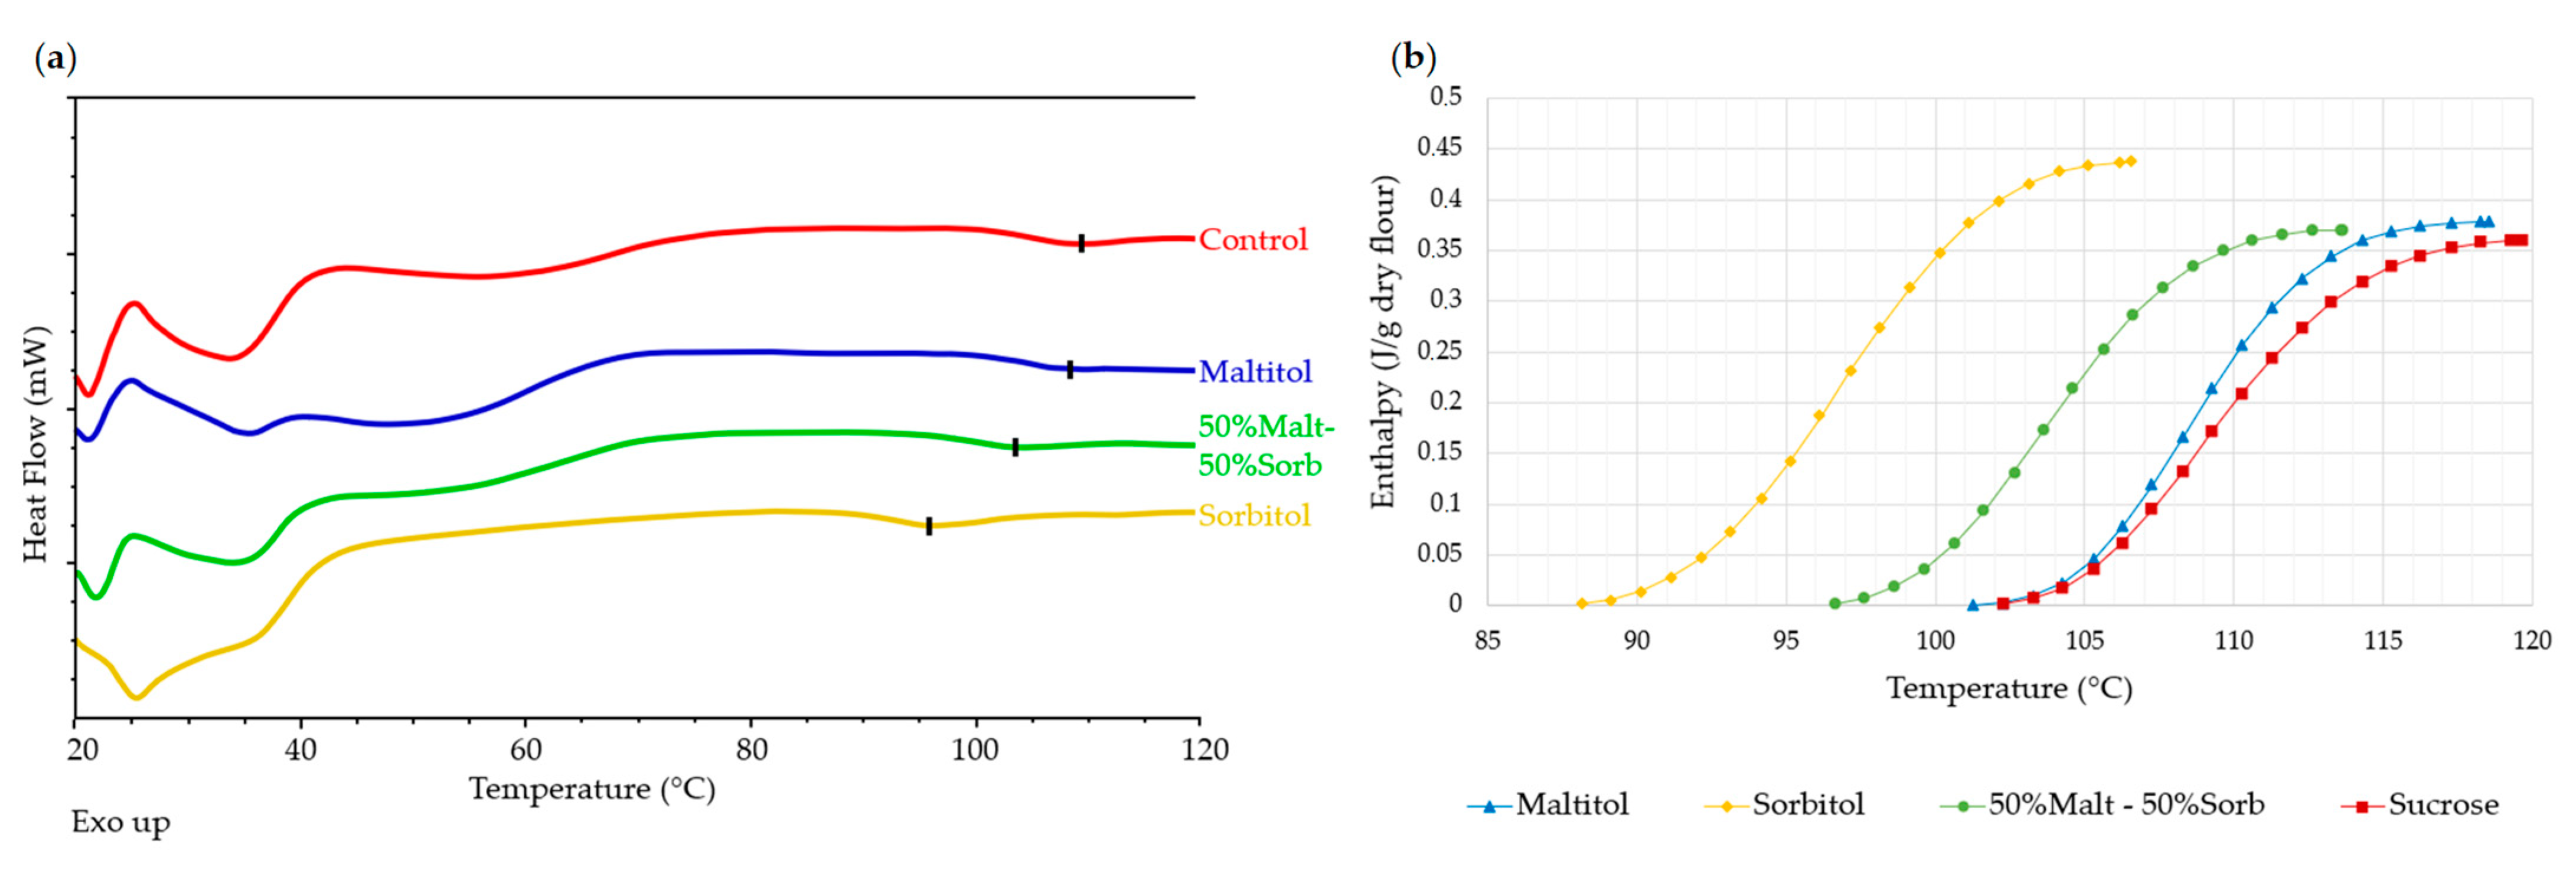
3.2. Impact of Sugar Substitution on Starch Gelatinization in Biscuit Dough
Starch Transition in Dough during Heating
- XRD
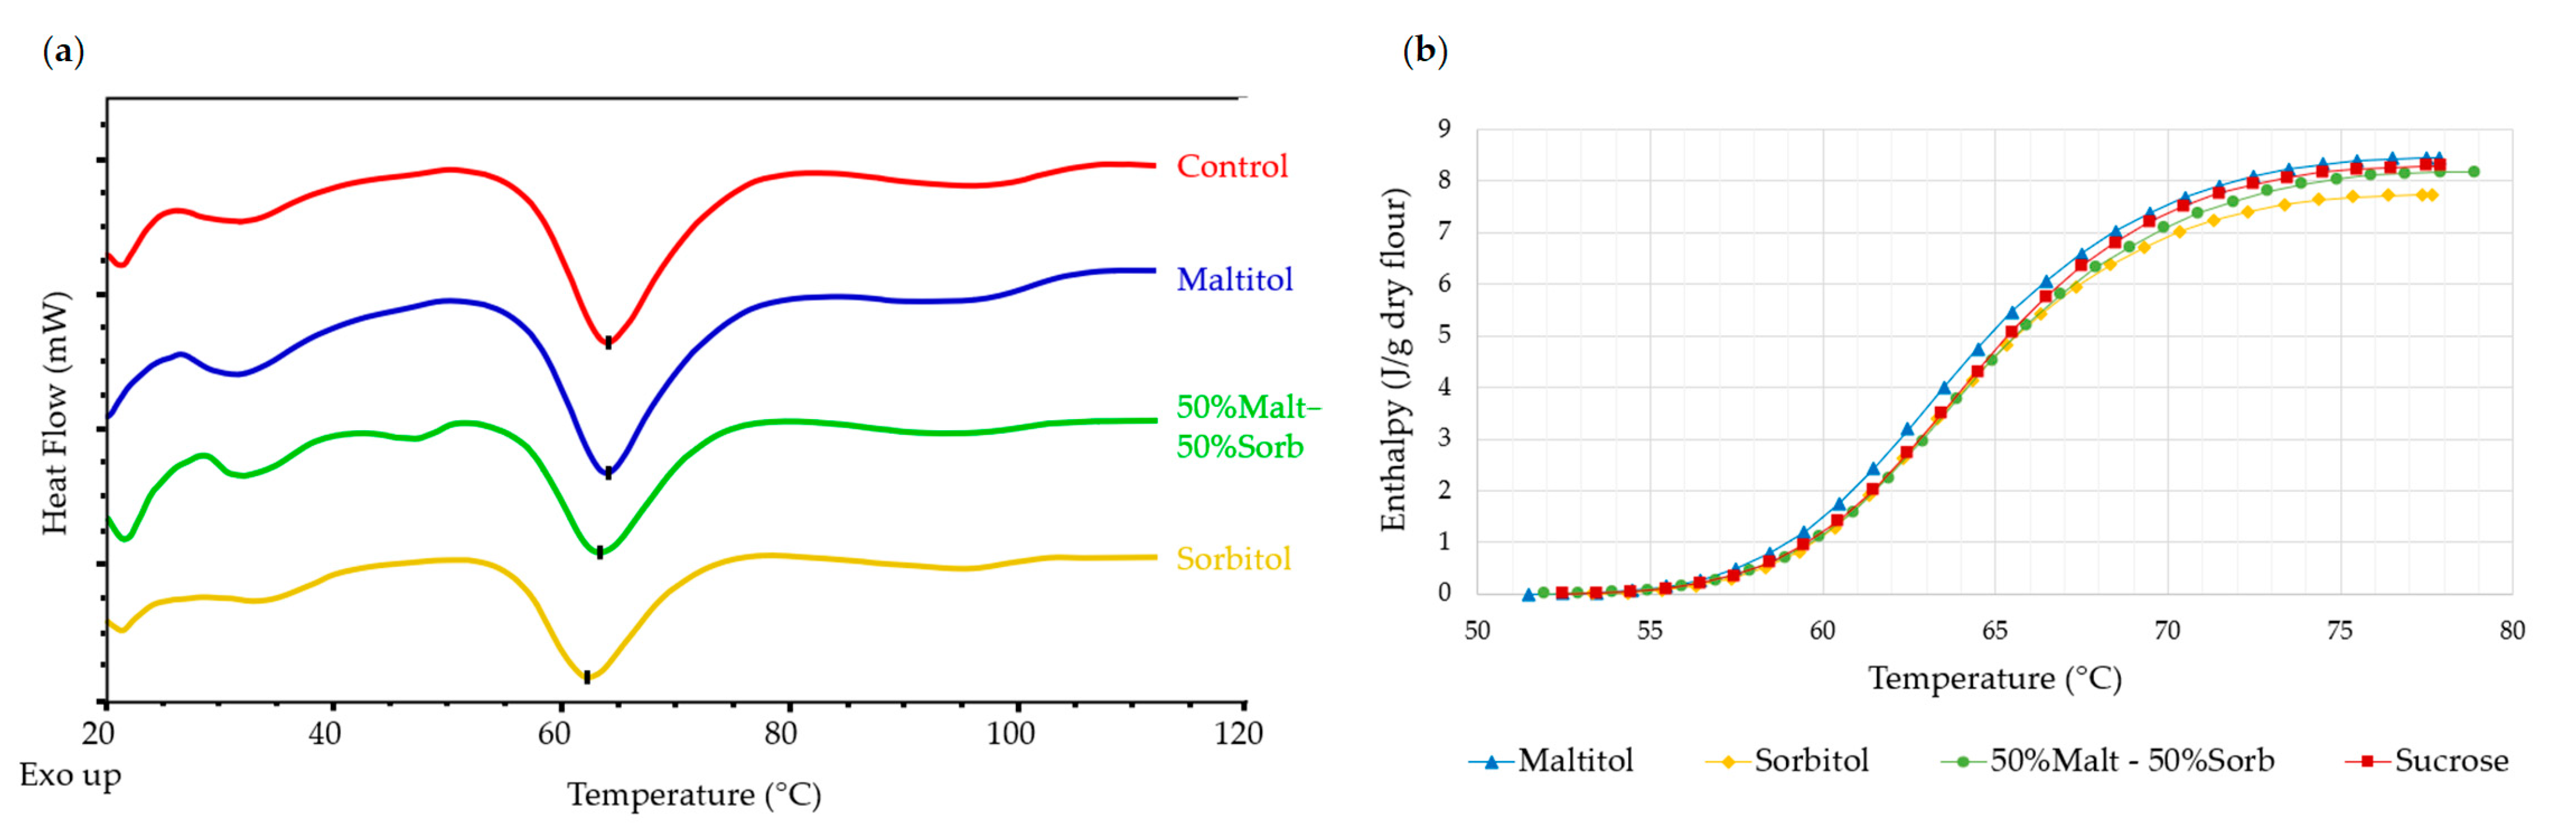
- DSC
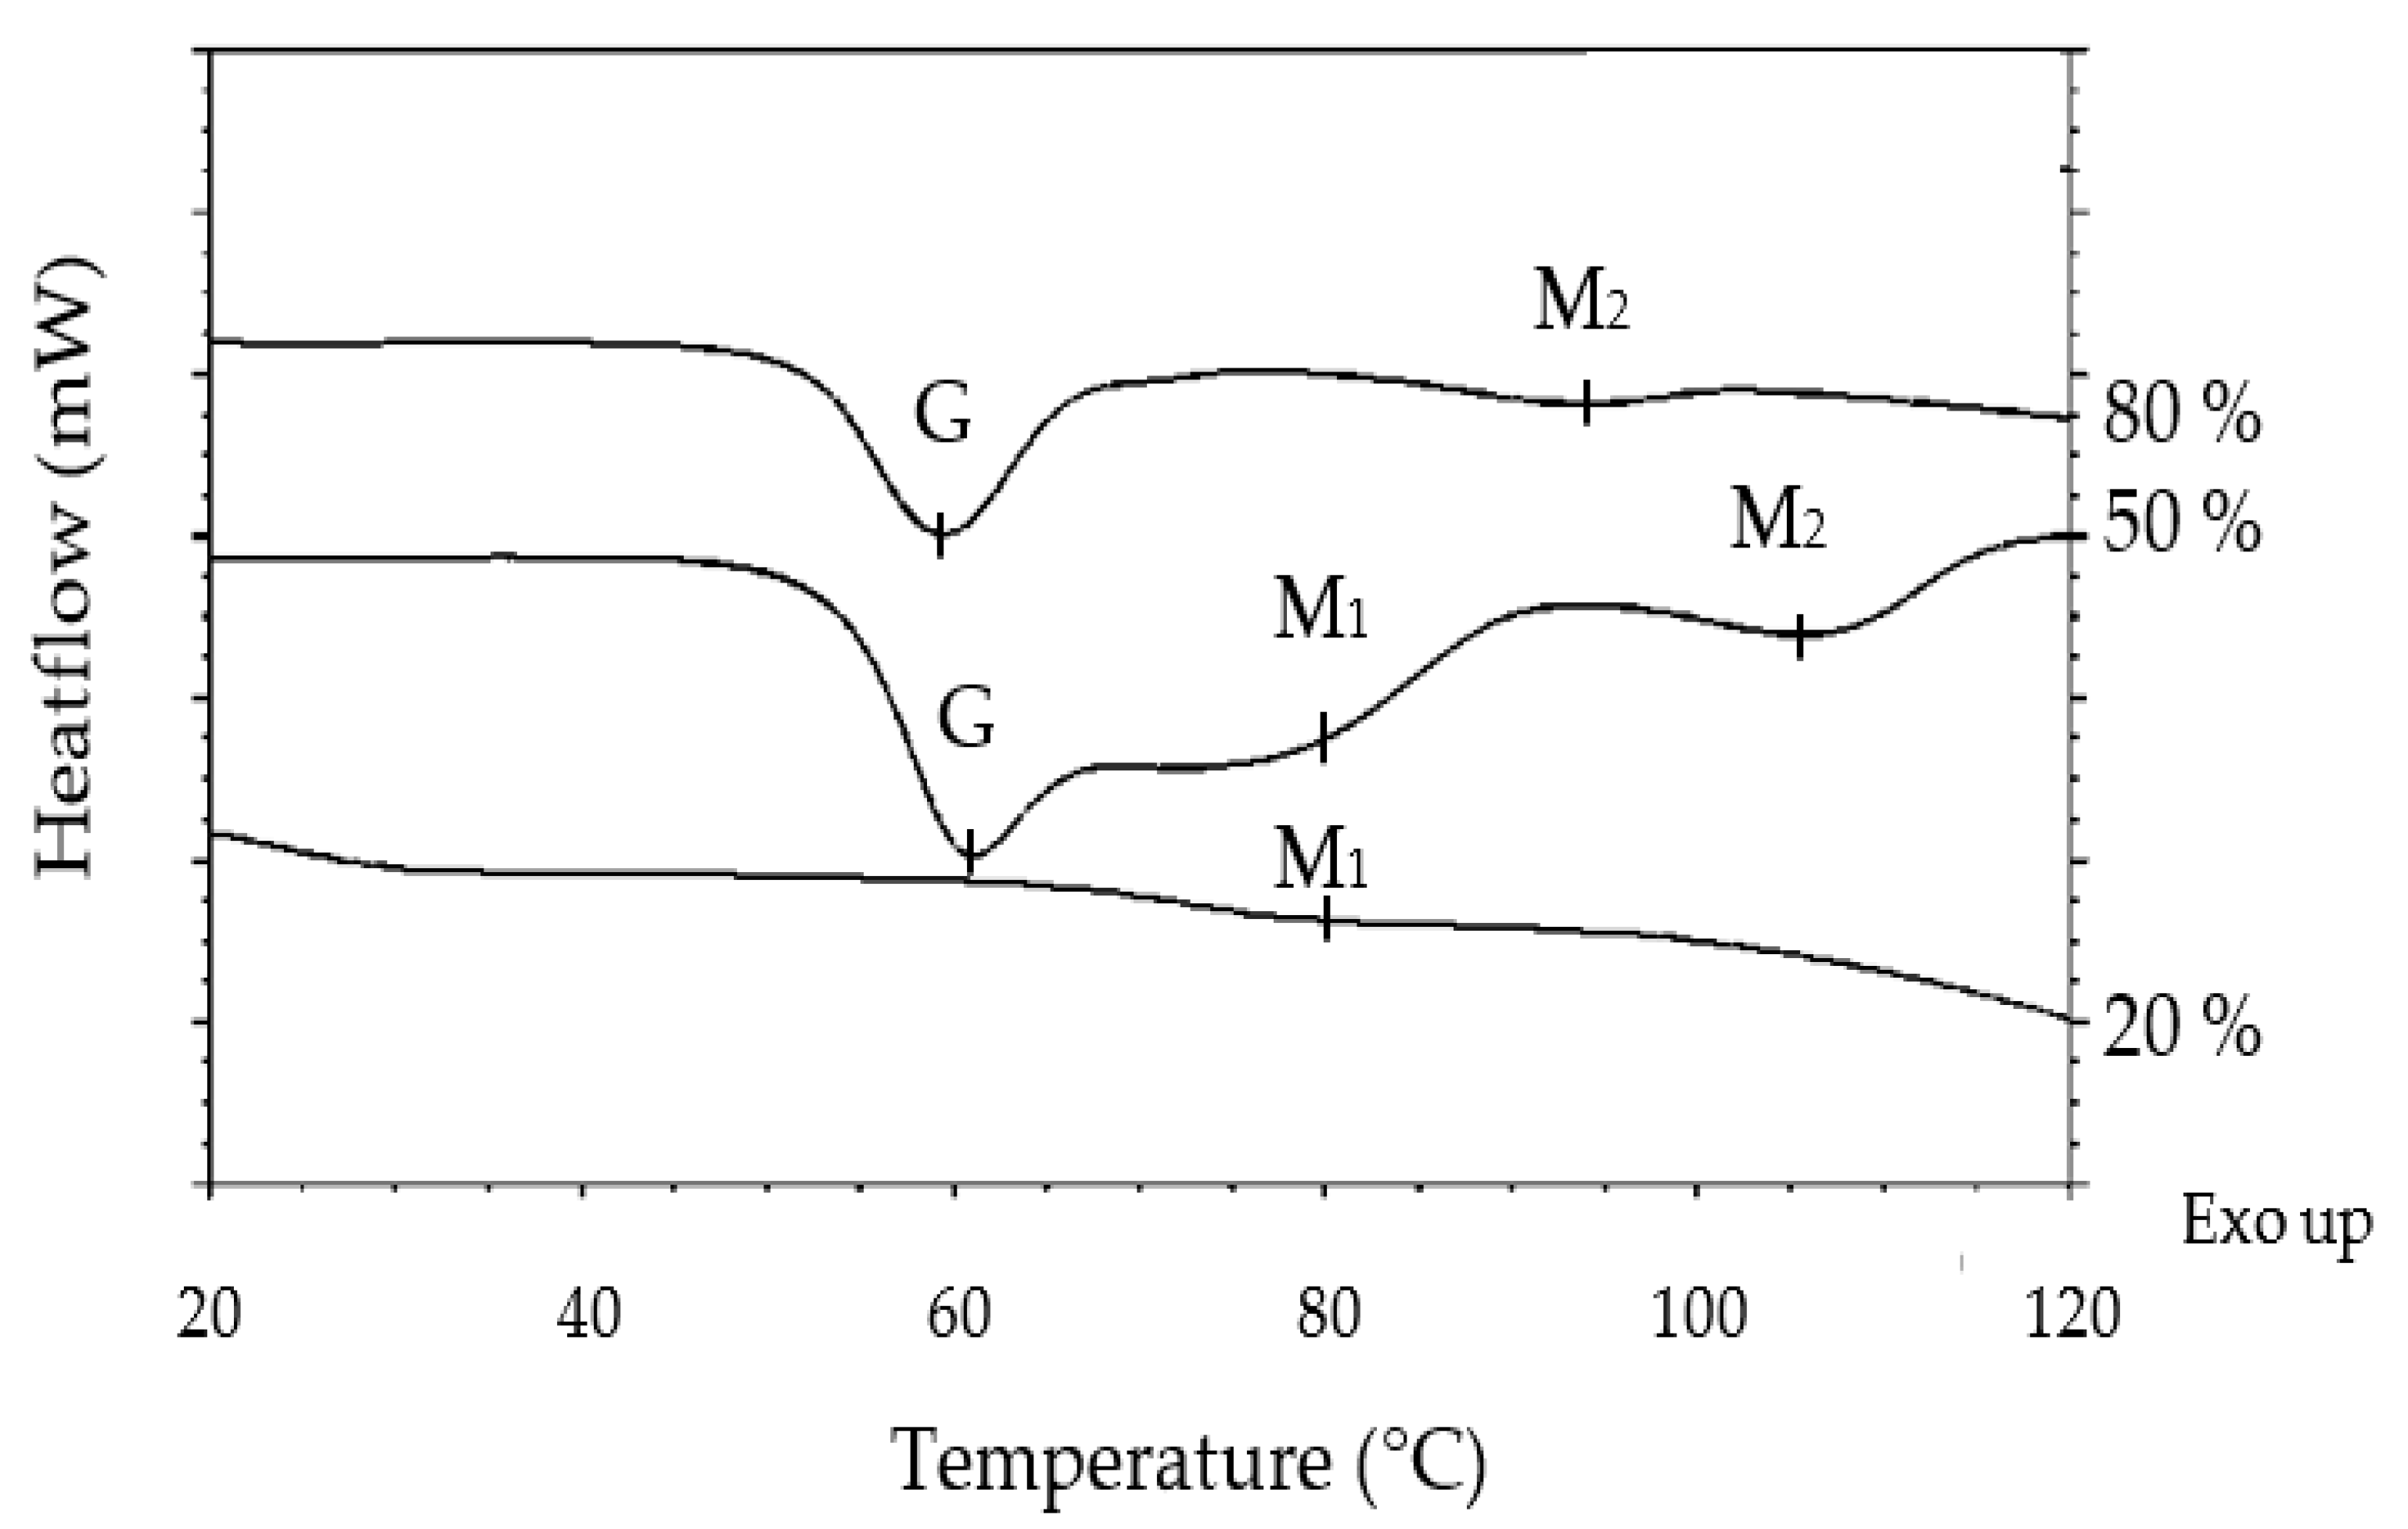
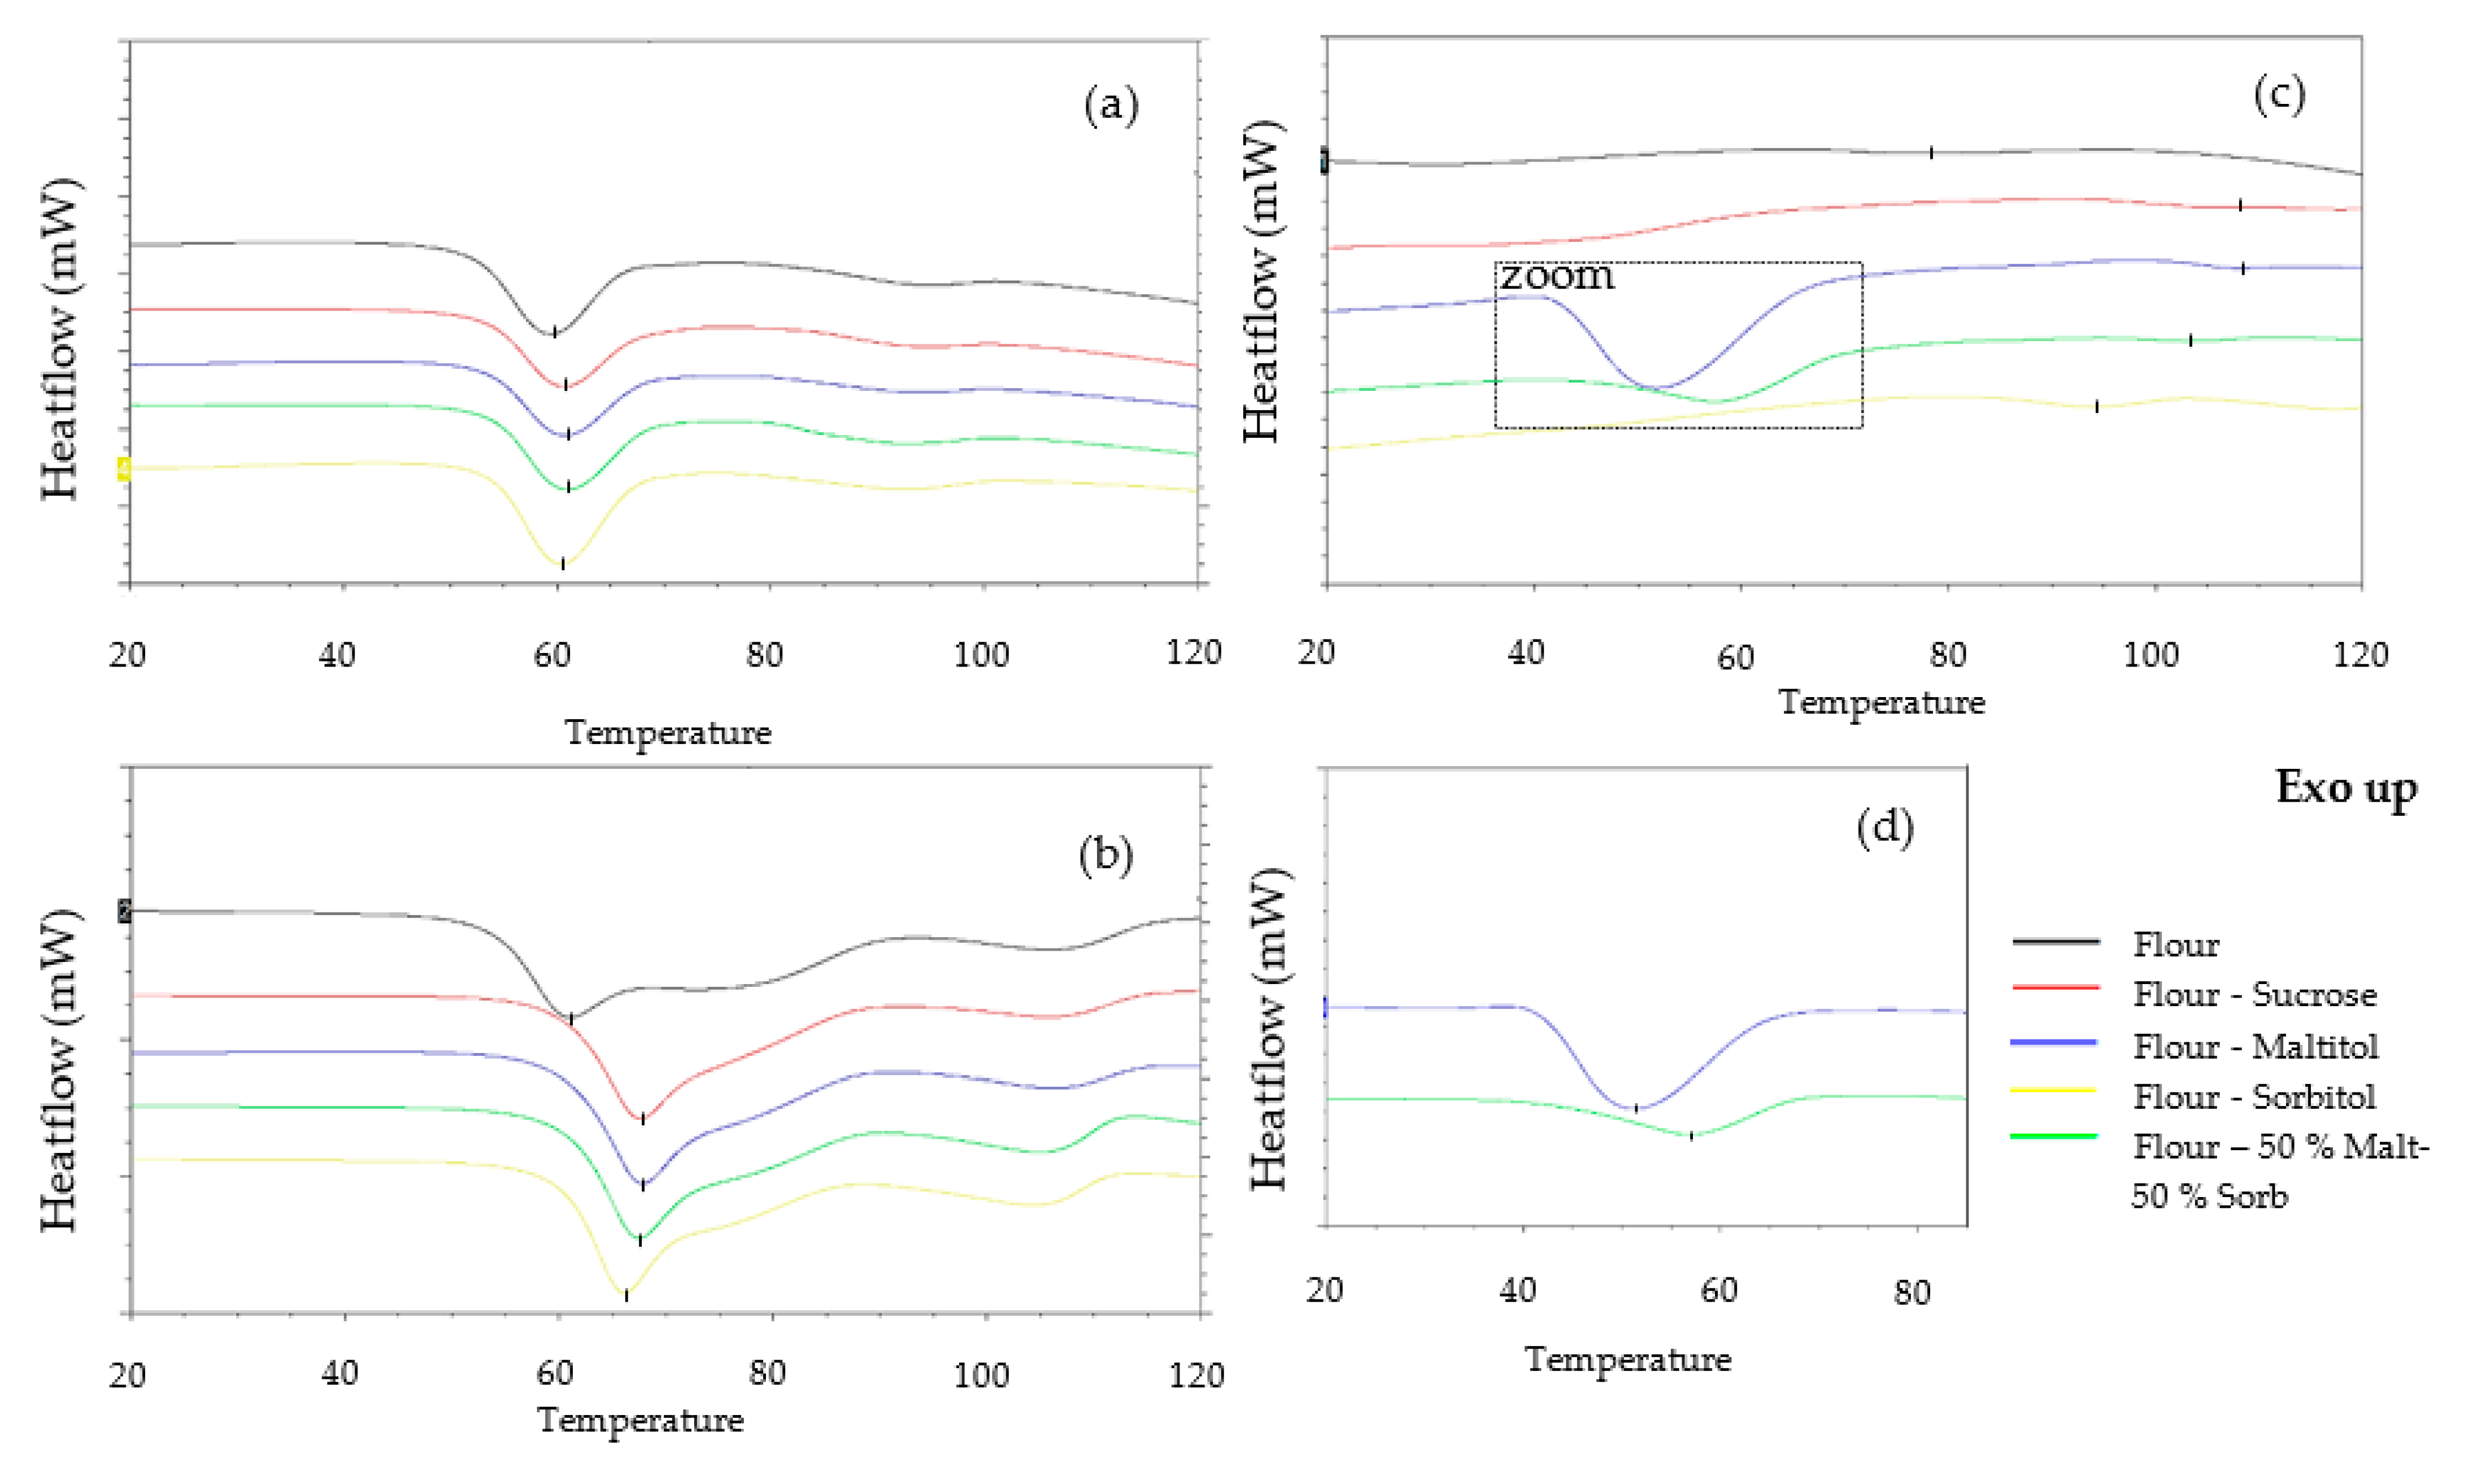
3.3. Insights Extracted from Model Systems
- Water Content Effect
- Effects of Sweeteners
- Ingredients’ Priorities on Water
4. Conclusions
Supplementary Materials
Author Contributions
Funding
Data Availability Statement
Conflicts of Interest
References
- Spies, R.D.; Hoseney, R.C. Effect of sugars on starch gelatinization. Cereal Chem. 1982, 59, 128–131. [Google Scholar]
- Buck, J.S.; Walker, C.E. Sugar and sucrose ester effects on maize and wheat starch gelatinization patterns by differential scanning calorimeter. Starch/Stärke 1988, 40, 353–356. [Google Scholar] [CrossRef]
- Eliasson, A.-C. A calorimetric investigation of the influence of sucrose on the gelatinization of starch. Carbohydr. Polym. 1992, 18, 131–138. [Google Scholar] [CrossRef]
- Jang, J.K.; Lee, S.H.; Cho, S.C.; Pyun, Y.R. Effect of Sucrose on Glass Transition, Gelatinization, and Retrogradation of Wheat Starch. Cereal Chem. 2001, 78, 186–192. [Google Scholar] [CrossRef]
- Perry, P.A.; Donald, A.M. The effect of sugars on the gelatinisation of starch. Carbohydr. Polym. 2002, 49, 155–165. [Google Scholar] [CrossRef]
- Baek, M.H.; Yoo, B.; Lim, S.-T. Effects of sugars and sugar alcohols on thermal transition and cold stability of corn starch gel. Food Hydrocoll. 2004, 18, 133–142. [Google Scholar] [CrossRef]
- Zhang, X.; Tong, Q.; Zhu, W.; Ren, F. Pasting, rheological properties and gelatinization kinetics of tapioca starch with sucrose or glucose. J. Food Eng. 2013, 114, 255–261. [Google Scholar] [CrossRef]
- Allan, M.C.; Rajwa, B.; Mauer, L.J. Effects of sugars and sugar alcohols on the gelatinization temperature of wheat starch. Food Hydrocoll. 2018, 84, 593–607. [Google Scholar] [CrossRef]
- van der Sman, R.G.M.; Mauer, L.J. Starch gelatinization temperature in sugar and polyol solutions explained by hydrogen bond density. Food Hydrocoll. 2019, 94, 371–380. [Google Scholar] [CrossRef]
- Abboud, A.M.; Hoseney, R.C. Differential Scanning Calorimetry of Sugar Cookies and Cookie Doughs. Cereal Chem. 1984, 61, 34–37. [Google Scholar]
- Varriano-Marston, E.; Ke, V.; Huang, G.; Ponte, J., Jr. Comparison of methods to determine starch gelatinization in bakery foods. Cereal Chem. 1980, 57, 242–248. [Google Scholar]
- Psimouli, V.; Oreopoulou, V. The effect of alternative sweeteners on batter rheology and cake properties. J. Sci. Food Agric. 2012, 92, 99–105. [Google Scholar] [CrossRef]
- Martínez-Cervera, S.; Salvador, A.; Sanz, T. Comparison of different polyols as total sucrose replacers in muffins: Thermal, rheological, texture and acceptability properties. Food Hydrocoll. 2014, 35, 1–8. [Google Scholar] [CrossRef]
- Laguna, L.; Vallons, K.J.R.; Jurgens, A.; Sanz, T. Understanding the Effect of Sugar and Sugar Replacement in Short Dough Biscuits. Food Bioprocess Technol. 2013, 6, 3143–3154. [Google Scholar] [CrossRef]
- Eliasson, A.-C. Starch: Physicochemical and Functional Aspects. In Carbohydrates in Food, 3rd ed.; CRC Press: Boca Raton, FL, USA, 2017; pp. 479–577. ISBN 9781482245516. [Google Scholar]
- Ghiasi, K.; Hoseney, R.C.; Varriano-Marston, E. Gelatinization of wheat starch. III. Comparison by Differential Scanning Calorimetry and Light microscopy. Cereal Chem. 1982, 59, 258–262. [Google Scholar]
- Donovan, J.W. Phase transitions of the starch-water system. Biopolymers 1979, 18, 263–275. [Google Scholar] [CrossRef]
- Ghiasi, K.; Hoseney, R.C.; Varriano-Marston, E. Effects of flour constituents and dough ingredients on starch gelatinization. Cereal Chem. 1982, 60, 58–61. [Google Scholar]
- Beleia, A.; Miller, R.A.; Hoseney, R.C. Starch gelatinization in sugar solutions. Starch/Stärke 1996, 48, 259–262. [Google Scholar] [CrossRef]
- Evans, I.D.; Haisman, D.R. The effect of solutes on the gelatinization temperature range of potato starch. Starch/Stärke 1982, 34, 224–231. [Google Scholar] [CrossRef]
- Slade, L.; Levine, H. Non-equilibrium melting of native granular starch: Part I. Temperature location of the glass transition associated with gelatinization of a-type cereal starches. Carbohydr. Polym. 1988, 8, 183–208. [Google Scholar] [CrossRef]
- Hansen, L.M.; Setser, C.S.; Paukstelis, J.V. Investigations of sugar-starch interactions using carbon-13 nuclear magnetic resonance. Cereal Chem. 1989, 66, 411–415. [Google Scholar]
- Hoover, R.; Senanayake, S.P.J.N. Composition and physicochemical properties of oat starches. Food Res. Int. 1996, 29, 15–26. [Google Scholar] [CrossRef]
- Roze, M.; Crucean, D.; Diler, G.; Rannou, C.; Catanéo, C.; Jonchère, C.; Le-Bail, A.; Le-Bail, P. Impact of maltitol and sorbitol on technological and sensory attributes of biscuits. Foods 2021, 10, 2545. [Google Scholar] [CrossRef] [PubMed]


| Ingredients (%, w.b.) | Control | Sorbitol | Maltitol | 50% Maltitol–50% Sorbitol |
|---|---|---|---|---|
| Wheat flour | 63.4 | 63.4 | 63.4 | 63.4 |
| Sucrose | 16.3 | - | - | - |
| Sorbitol | - | 16.3 | - | 8.15 |
| Maltitol | - | - | 16.3 | 8.15 |
| Butter | 13.3 | 13.3 | 13.3 | 13.3 |
| Water | 6.1 | 6.1 | 6.1 | 6.1 |
| Salt | 0.5 | 0.5 | 0.5 | 0.5 |
| Leavening agents (NaHCO3 + Na2H2P2O7) | 0.4 | 0.4 | 0.4 | 0.4 |
| Ingredients | Water Content (% w.b.) |
|---|---|
| Wheat flour | 14.66 ± 1.05 |
| Sucrose | 0.05 ± 0.01 |
| Sorbitol | 0.04 ± 0.00 |
| Maltitol | 0.22 ± 0.02 |
| Butter | 16.72 ± 0.09 |
| Model System (w.b.) | Ingredients | System Water Content (%) |
|---|---|---|
| 1-F2.32 W7.68 | Flour Water | 80% |
| 2-F5.79 W4.21 | Flour Water | 50% |
| 3-F9.26 W0.74 | Flour Water | 20% |
| 4-F1.78(Su0.46 W7.76) | Flour Sucrose Water | 80% |
| 5-F4.46(Su1.15 W4.39) | Flour Sucrose Water | 50% |
| 6-F7.13(Su1.84 W1.03) | Flour Sucrose Water | 20% |
| 7- F1.78(Ma0.46 W7.76) | Flour Maltitol Water | 80% |
| 8-F4.46(Ma1.15 W4.39) | Flour Maltitol Water | 50% |
| 9-F7.13(Ma1.84 W1.03) | Flour Maltitol Water | 20% |
| 10- F1.78(So0.46 W7.76) | Flour Sorbitol Water | 80% |
| 11- F4.46(So1.15 W4.39) | Flour Sorbitol Water | 50% |
| 12- F7.13(So1.84 W1.03) | Flour Sorbitol Water | 20% |
| 13- F1.78(Ma0.23So0.23 W7.76) | Flour Maltitol Sorbitol Water | 80% |
| 14- F4.47(Ma0.57So0.57 W4.39) | Flour Maltitol Sorbitol Water | 50% |
| 15- F7.13(Ma0.92So0.92 W1.03) | Flour Maltitol Sorbitol Water | 20% |
| Ingredients | Water Content (% w.b.) |
|---|---|
| Control | 17.0 ± 0.1 a |
| Maltitol | 17.1 ± 0.2 a |
| 50–50 | 17.1 ± 0.6 a |
| Sorbitol | 17.3 ± 0.6 a |
| Enthalpy (J/g Dry Flour) | Tonset (°C) | Tpeak (°C) | Tend (°C) | ||
|---|---|---|---|---|---|
| Control | iwc | 0.30 ± 0.03 ns | 103.0 ± 0.3 a | 108.6 ± 0.3 a | 118.9 ± 0.6 a |
| Maltitol | iwc | 0.33 ± 0.01 ns | 102.9 ± 0.2 a | 108.4 ± 0.2 a | 117.4 ± 0.5 a |
| 50%Malt–50%Sorb | iwc | 0.29 ± 0.03 ns | 97.5 ± 0.2 b | 103.9 ± 0.3 b | 112.9 ± 1.4 b |
| Sorbitol | iwc | 0.38 ± 0.04 ns | 89.6 ± 0.2 c | 96.6 ± 0.4 c | 105.5 ± 0.8 c |
| Control | 70% | 8.2 ± 0.4 ns | 56.7 ± 0.3 ns | 63.8 ± 0.2 ns | 78.2 ± 0.8 ns |
| Maltitol | 70% | 8.4 ± 0.3 ns | 56.4 ± 0.5 ns | 63.5 ± 0.4 ns | 78.5 ± 0.9 ns |
| 50%Malt–50%Sorb | 70% | 7.8 ± 0.3 ns | 56.7 ± 0.1 ns | 63.5 ± 0.1 ns | 77.4 ± 1.1 ns |
| Sorbitol | 70% | 7.6 ± 0.3 ns | 56.4 ± 0.3 ns | 62.7 ± 0.3 ns | 77.1 ± 0.7 ns |
| Model System | Enthalpy (J/g dry flour) | Tonset (°C) | Tpeak (°C) | Tend (°C) |
|---|---|---|---|---|
| 1—F2.32W7.68 | 6.0 ± 0.4 ns | 53.3 ± 0.8 ns | 60.3 ± 1.4 ns | 71.0 ± 1.7 ns |
| 4—F1.78(Su0.46 W7.76) | 6.9 ± 0.1 ns | 54.4 ± 0.8 ns | 61.5 ± 1.3 ns | 74.0 ± 1.1 ns |
| 7—F1.78(Ma0.46 W7.76) | 6.4 ± 0.9 ns | 54.5 ± 0.9 ns | 61.5 ± 1.4 ns | 71.8 ± 1.6 ns |
| 10—F1.78(So0.46 W7.76) | 6.7 ± 0.5 ns | 54.0 ± 0.1 ns | 60.3 ± 0.1 ns | 69.6 ± 0.2 ns |
| 13—F1.78(Ma0.23So0.23 W7.76) | 7.9 ± 0.1 ns | 54.22 ± 0.01 ns | 60.9 ± 0.1 ns | 72.0 ± 0.9 ns |
| 2—F5.79W4.21 | 7.5 ± 0.3 b | 54.3 ± 0.2 b | 61.1 ± 0.3 d | 90.2 ± 0.4 a |
| 5—F4.46(Su1.15 W4.39) | 8.6 ± 0.2 a | 61.0 ± 0.4 a | 67.9 ± 0.5 ab | 88.3 ± 0.5 b |
| 8—F4.46(Ma1.15 W4.39) | 8.7 ± 0.3 a | 61.1 ± 0.4 a | 67.9 ± 0.3 a | 88.4 ± 0.3 b |
| 11—F4.46(So1.15 W4.39) | 8.3 ± 0.2 a | 60.3 ± 0.2 a | 65.9 ± 0.2 c | 85.9 ± 0.4 c |
| 14—F4.47(Ma0.57So0.57 W4.39) | 8.5 ± 0.1 a | 60.7 ± 0.4 a | 67.0 ± 0.4 b | 87.4 ± 0.6 b |
| 3—F9.26W0.74 | 0.21 ± 0.02 ns | 70.8 ± 1.2 c | 79.9 ± 2.2 c | 95.0 ± 2 c |
| 6—F7.13(Su1.84 W1.03) | 0.11 ± 0.02 ns | 99.9 ± 1.9 a | 105.1 ± 0.8 a | 113.0 ± 1.4 a |
| 9—F7.13(Ma1.84 W1.03) | 0.4 ± 0.3 ns | 99.6 ± 3.3 a | 105.9 ± 1.8 a | 112.7 ± 1.9 a |
| 12—F7.13(So1.84 W1.03) | 1.2 ± 0.7 ns | 84.1 ± 2.2 b | 92.7 ± 2.1 b | 102.2 ± 0.5 b |
| 15—F7.13(Ma0.92So0.92 W1.03) | 0.5 ± 0.2 ns | 96.7 ± 0.6 a | 102.7 ± 0.6 a | 110.1 ± 0.8 a |
Disclaimer/Publisher’s Note: The statements, opinions and data contained in all publications are solely those of the individual author(s) and contributor(s) and not of MDPI and/or the editor(s). MDPI and/or the editor(s) disclaim responsibility for any injury to people or property resulting from any ideas, methods, instructions or products referred to in the content. |
© 2023 by the authors. Licensee MDPI, Basel, Switzerland. This article is an open access article distributed under the terms and conditions of the Creative Commons Attribution (CC BY) license (https://creativecommons.org/licenses/by/4.0/).
Share and Cite
Roze, M.; Diler, G.; Pontoire, B.; Novalès, B.; Jonchère, C.; Crucean, D.; Le-Bail, A.; Le-Bail, P. Effects of Sucrose Replacement by Polyols on the Dough-Biscuit Transition: Understanding by Model Systems. Foods 2023, 12, 607. https://doi.org/10.3390/foods12030607
Roze M, Diler G, Pontoire B, Novalès B, Jonchère C, Crucean D, Le-Bail A, Le-Bail P. Effects of Sucrose Replacement by Polyols on the Dough-Biscuit Transition: Understanding by Model Systems. Foods. 2023; 12(3):607. https://doi.org/10.3390/foods12030607
Chicago/Turabian StyleRoze, Mathilde, Guénaelle Diler, Bruno Pontoire, Bruno Novalès, Camille Jonchère, Doina Crucean, Alain Le-Bail, and Patricia Le-Bail. 2023. "Effects of Sucrose Replacement by Polyols on the Dough-Biscuit Transition: Understanding by Model Systems" Foods 12, no. 3: 607. https://doi.org/10.3390/foods12030607
APA StyleRoze, M., Diler, G., Pontoire, B., Novalès, B., Jonchère, C., Crucean, D., Le-Bail, A., & Le-Bail, P. (2023). Effects of Sucrose Replacement by Polyols on the Dough-Biscuit Transition: Understanding by Model Systems. Foods, 12(3), 607. https://doi.org/10.3390/foods12030607