
Mathematical Modelling of Convective Drying of Orange By-Product and Its Influence on Phenolic Compounds and Ascorbic Acid Content, and Its Antioxidant Activity

 ,
,  ,
,  and
and 
Abstract
1. Introduction
2. Materials and Methods
2.1. Chemicals and Samples
2.2. Drying Process and Kinetics
2.3. Statistical Parameters
2.4. Ultrasound Extraction of Phenolic Compounds
2.5. HPLC-MS Analysis of Phenolic Compounds
2.6. HPLC-UV/VIS Analysis of Vitamin C
2.7. Antioxidant Assays
3. Results and Discussion
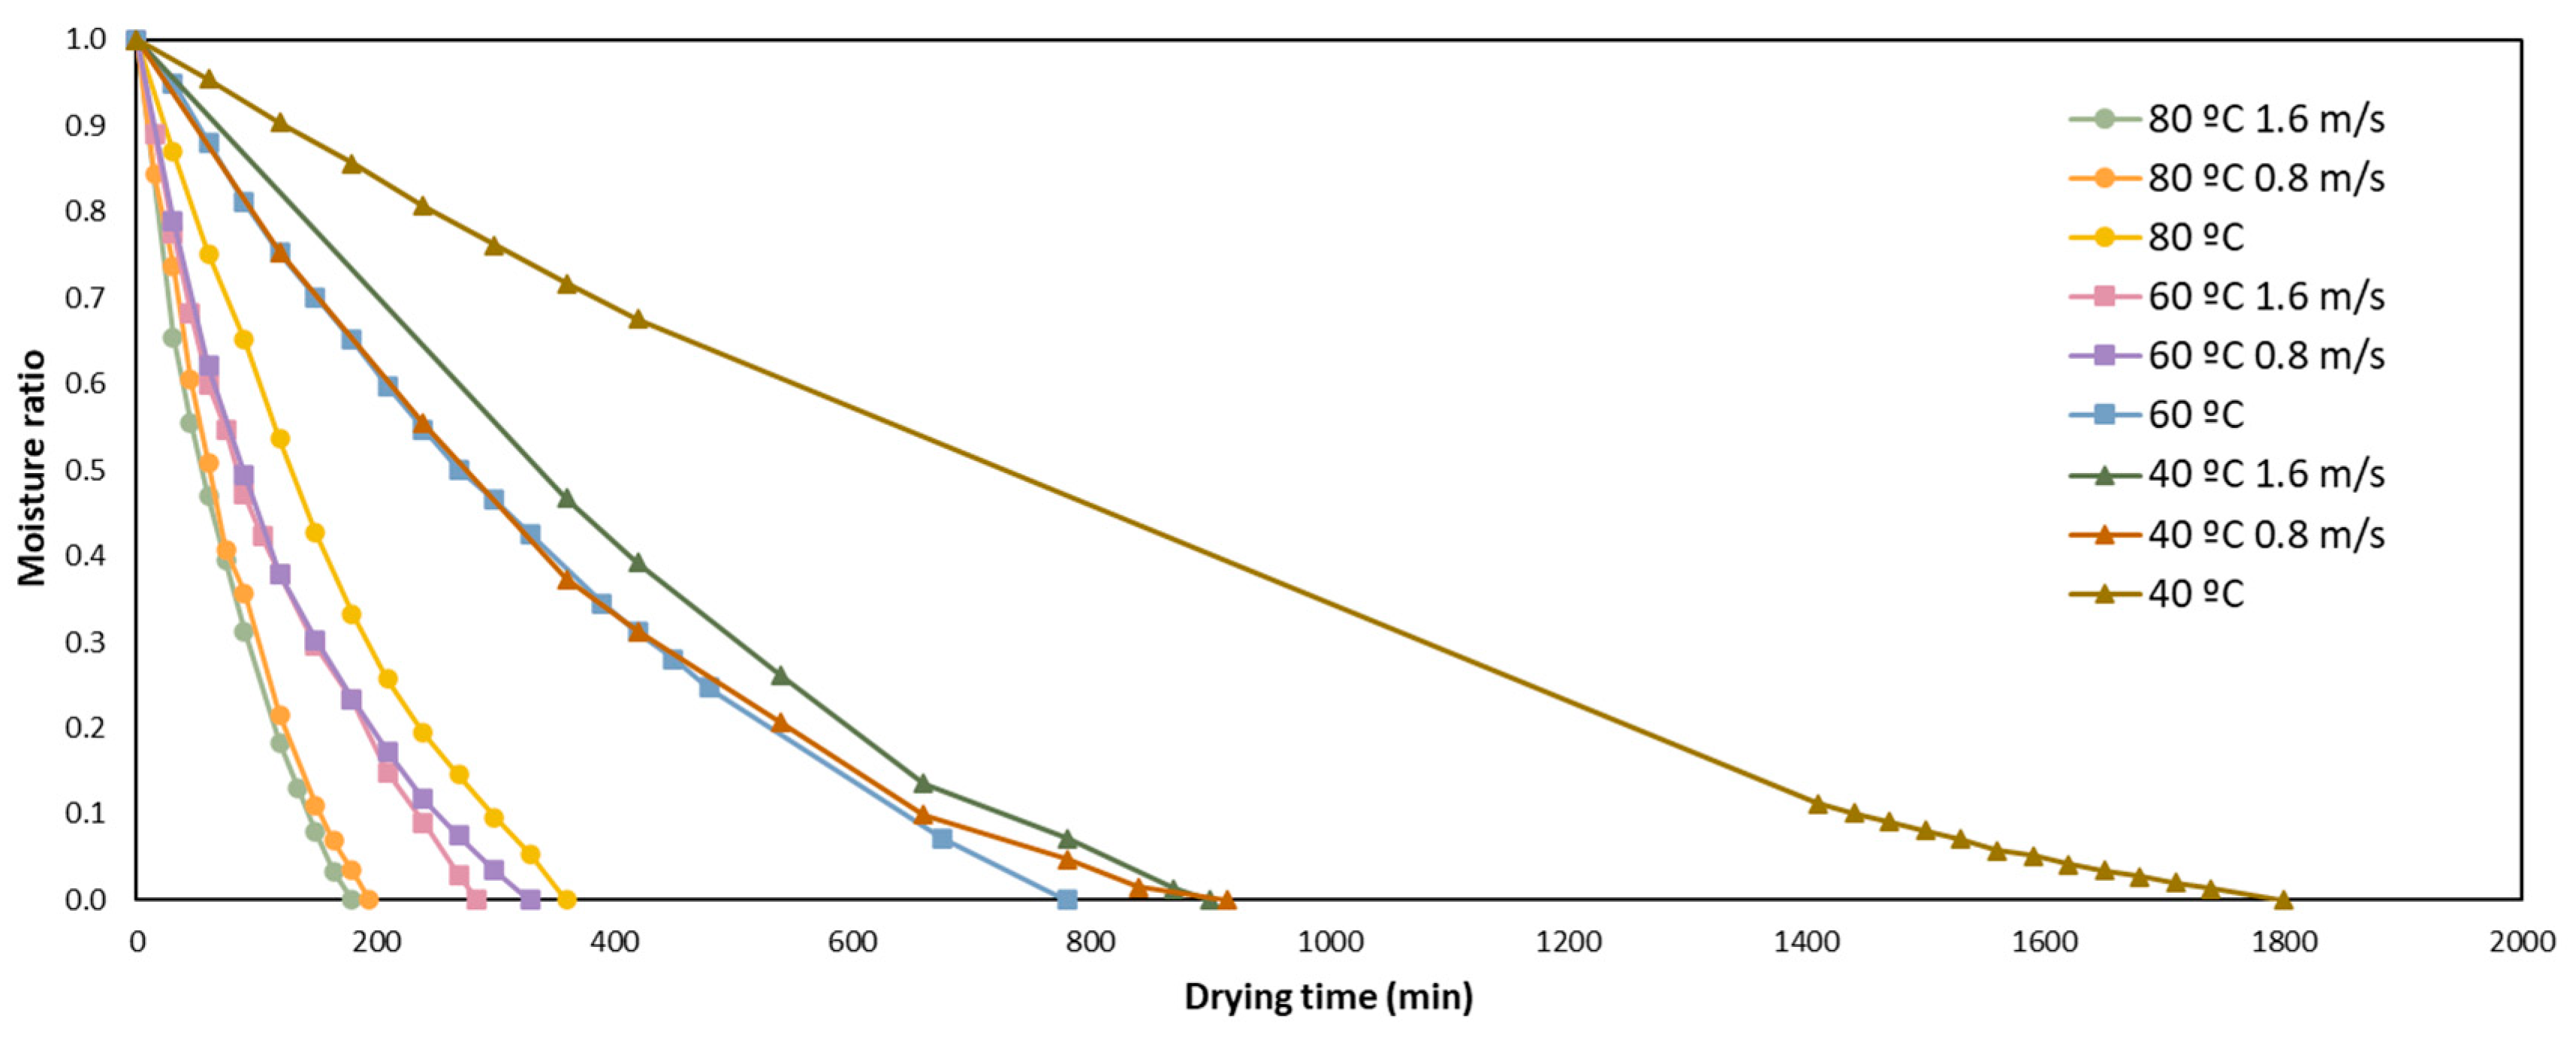
3.1. Drying Kinetics and Modelling
3.2. Effect of Drying on the Phenolic Content Measured by HPLC-MS
3.3. Effect of Drying on the Vitamin C Content
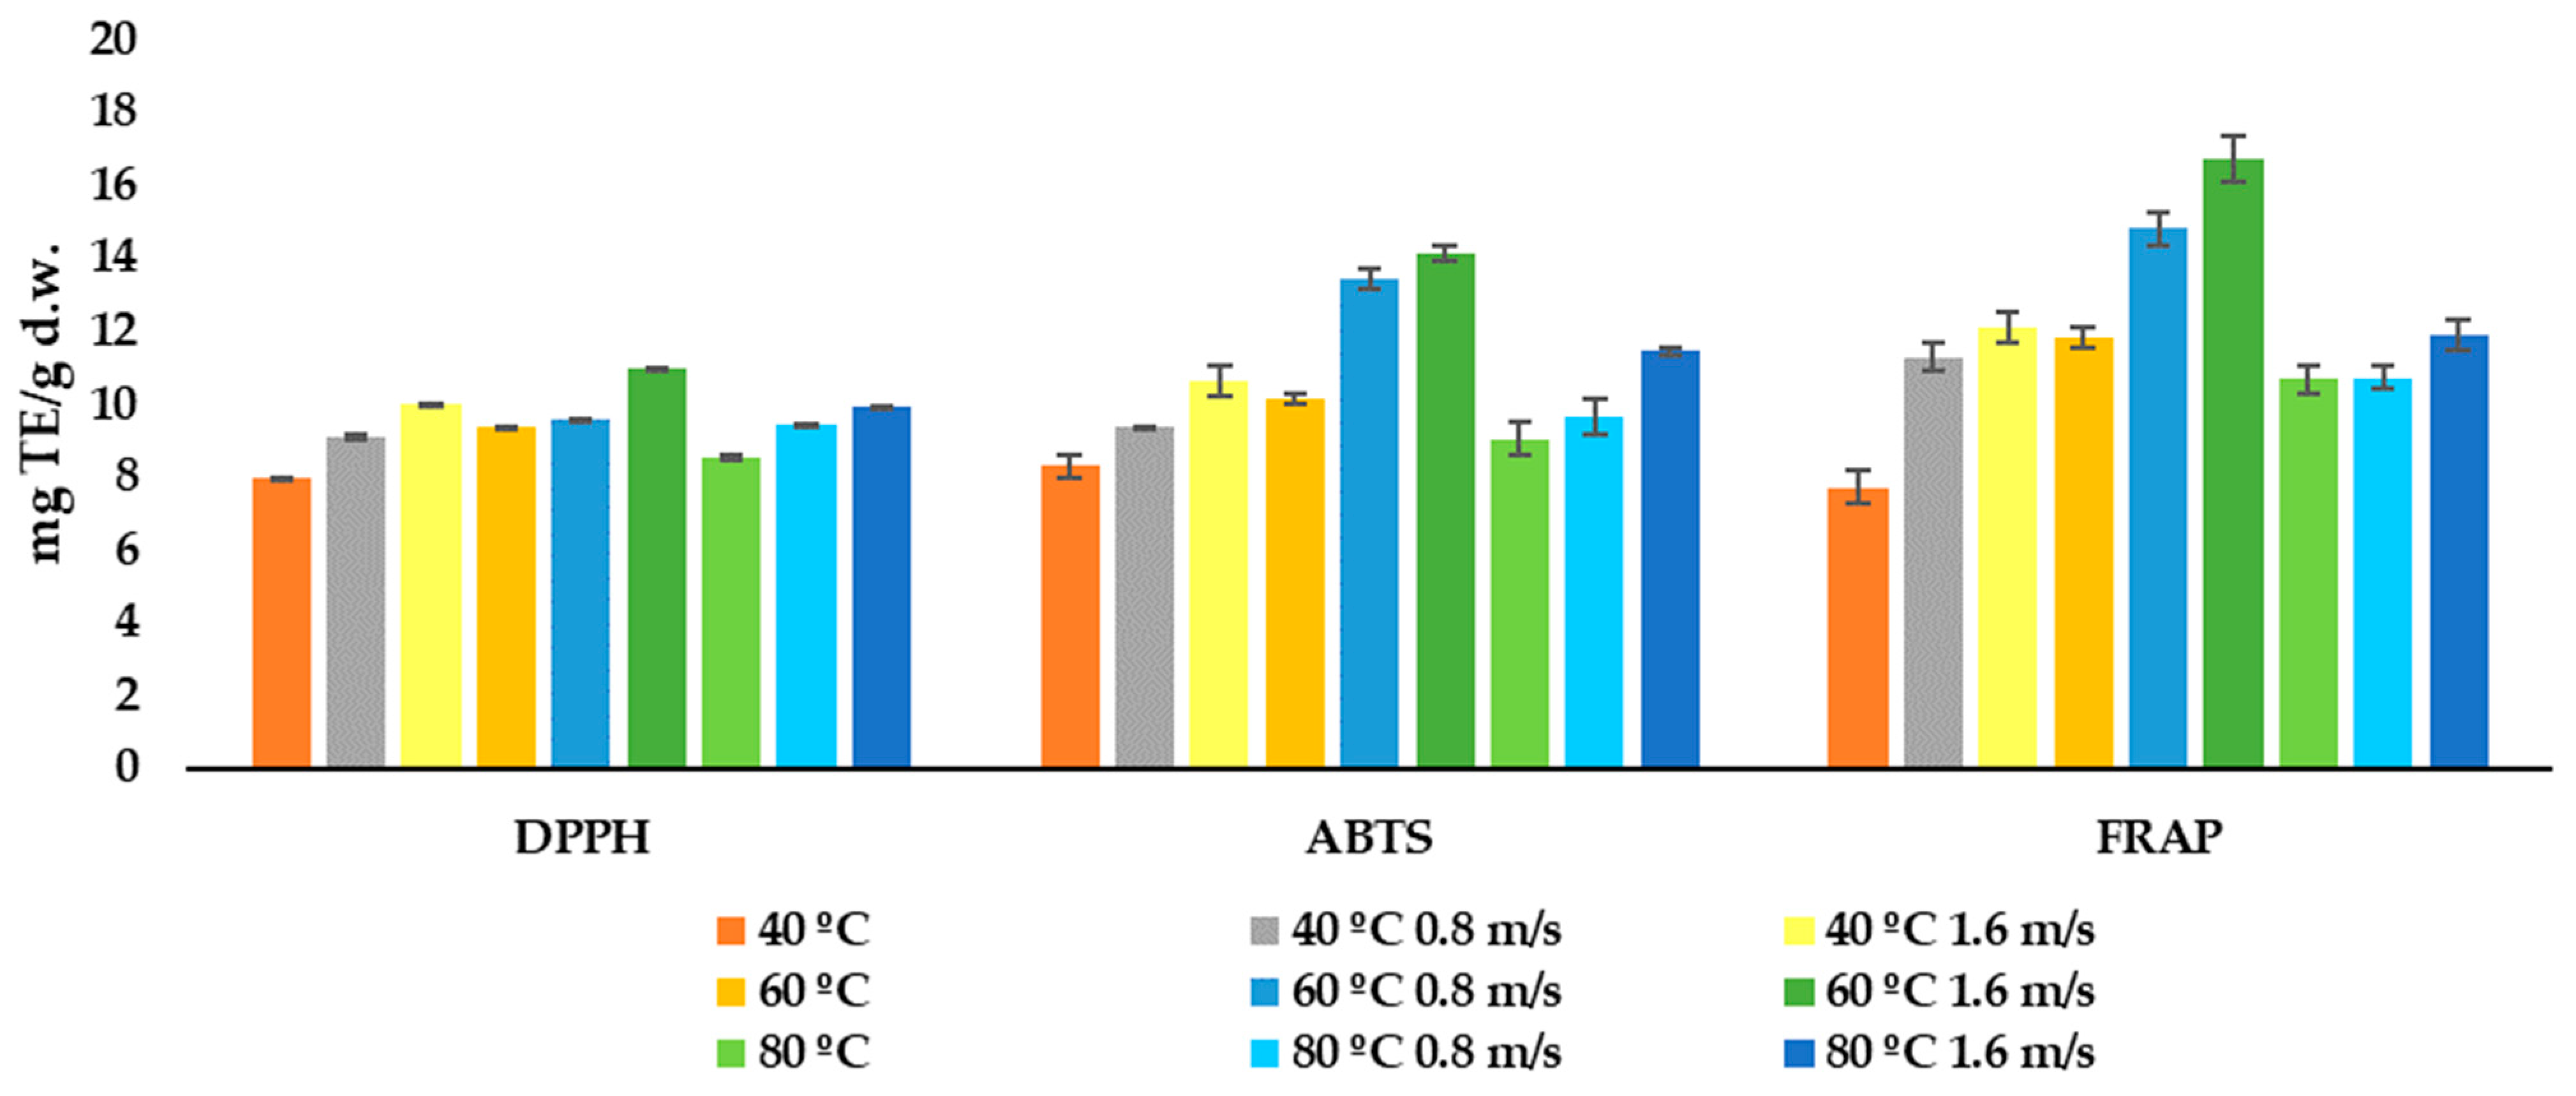
3.4. Effect of Drying on the Antioxidant Activity
4. Conclusions
Author Contributions
Funding
Data Availability Statement
Acknowledgments
Conflicts of Interest
References
- Statista. Available online: https://www.statista.com/ (accessed on 4 May 2022).
- Jimenez, P.; Garcia, P.; Quitral, V.; Vasquez, K.; Parra-Ruiz, C.; Reyes-Farias, M.; Garcia-Diaz, D.F.; Robert, P.; Encina, C.; Soto-Covasich, J. Pulp, Leaf, Peel and Seed of Avocado Fruit: A Review of Bioactive Compounds and Healthy Benefits. Food Rev. Int. 2021, 37, 619–655. [Google Scholar] [CrossRef]
- Colombo, R.; Papetti, A. Avocado (Persea americana Mill.) by-products and their impact: From bioactive compounds to biomass energy and sorbent material for removing contaminants. A review. Int. J. Food Sci. Technol. 2019, 54, 943–951. [Google Scholar] [CrossRef]
- Chua, L.Y.W.; Chong, C.H.; Chua, B.L.; Figiel, A. Influence of Drying Methods on the Antibacterial, Antioxidant and Essential Oil Volatile Composition of Herbs: A Review. Food Bioprocess Technol. 2019, 12, 450–476. [Google Scholar] [CrossRef]
- Del Carmen Razola-Díaz, M.; Guerra-Hernández, E.J.; García-Villanova, B.; Verardo, V. Recent developments in extraction and encapsulation techniques of orange essential oil. Food Chem. 2021, 354, 129575. [Google Scholar] [CrossRef] [PubMed]
- Castro, A.M.; Mayorga, E.Y.; Moreno, F.L. Mathematical modelling of convective drying of fruits: A review. J. Food Eng. 2018, 223, 152–167. [Google Scholar] [CrossRef]
- Garau, M.C.; Simal, S.; Rosselló, C.; Femenia, A. Effect of air-drying temperature on physico-chemical properties of dietary fibre and antioxidant capacity of orange (Citrus aurantium v. Canoneta) by-products. Food Chem. 2007, 104, 1014–1024. [Google Scholar] [CrossRef]
- Farahmandfar, R.; Tirgarian, B.; Dehghan, B.; Nemati, A. Comparison of different drying methods on bitter orange (Citrus aurantium L.) peel waste: Changes in physical (density and color) and essential oil (yield, composition, antioxidant and antibacterial) properties of powders. J. Food Meas. Charact. 2020, 14, 862–875. [Google Scholar] [CrossRef]
- Deng, L.; Mujumdar, A.S.; Yang, W.; Zhang, Q.; Zheng, Z.; Wu, M.; Xiao, H. Hot air impingement drying kinetics and quality attributes of orange peel. J. Food Process. Preserv. 2020, 44, e14294. [Google Scholar] [CrossRef]
- Afrin, S.M.; Acharjee, A.; Sit, N. Convective drying of orange pomace at different temperatures and characterization of the obtained powders. J. Food Sci. Technol. 2022, 59, 1040–1052. [Google Scholar] [CrossRef]
- Kohli, D.; Champawat, P.S.; Jain, S.K.; Mudgal, V.D.; Shahi, N.C. Mathematical modelling for drying kinetics of asparagus roots (Asparagus racemosus l.) and determination of energy consumption. Biointerface Res. Appl. Chem. 2022, 12, 3572–3589. [Google Scholar] [CrossRef]
- Joseph, E.; Cheng, J.; Sun, D. Improving drying kinetics, physicochemical properties and bioactive compounds of red dragon fruit (Hylocereus species) by novel infrared drying. Food Chem. 2022, 375, 131886. [Google Scholar] [CrossRef] [PubMed]
- An, N.N.; Sun, W.H.; Li, B.Z.; Wang, Y.; Shang, N.; Lv, W.Q.; Li, D.; Wang, L.J. Effect of different drying techniques on drying kinetics, nutritional components, antioxidant capacity, physical properties and microstructure of edamame. Food Chem. 2022, 373, 131412. [Google Scholar] [CrossRef] [PubMed]
- Nguyen, H.L.; Le, T.Q. Drying kinetics and effective moisture diffusivity of pomelo albedo under vacuum-assisted microwave drying and its semi-product. J. Food Process Eng. 2022, 45, e13968. [Google Scholar] [CrossRef]
- De Oliveira Gomes, B.; Santos, K.C.; Reis Carvalho, G.; Bitencourt, B.S.; Guedes, J.S.; Augusto, P.E.D. Uvaia fruit (Eugenia pyriformis Cambess) drying: Ethanol as pre-treatment, convective drying kinetics and bioactive compounds. J. Food Process. Preserv. 2022, 46, e16284. [Google Scholar] [CrossRef]
- Sahoo, M.; Titikshya, S.; Aradwad, P.; Kumar, V.; Naik, S.N. Study of the drying behaviour and color kinetics of convective drying of yam (Dioscorea hispida) slices. Ind. Crops Prod. 2022, 176, 114258. [Google Scholar] [CrossRef]
- Vega-Gálvez, A.; Di Scala, K.; Rodríguez, K.; Lemus-Mondaca, R.; Miranda, M.; López, J.; Perez-Won, M. Effect of air-drying temperature on physico-chemical properties, antioxidant capacity, colour and total phenolic content of red pepper (Capsicum annuum, L. var. Hungarian). Food Chem. 2009, 117, 647–653. [Google Scholar] [CrossRef]
- Llavata, B.; Picinelli, A.; Simal, S.; Cárcel, J.A. Cider apple pomace as a source of nutrients: Evaluation of the polyphenolic profile, antioxidant and fiber properties after drying process at different temperatures. Food Chem. X 2022, 15, 100403. [Google Scholar] [CrossRef]
- Loh, Z.H.; Lim, Y.Y. Drying effects on antioxidant activity, enzyme activity, and phytochemicals of avocado (Persea americana) leaves. J. Food Process. Preserv. 2018, 42, e13667. [Google Scholar] [CrossRef]
- Yamassaki, F.T.; Campestrini, L.H.; Zawadzki-Baggio, S.F.; Maurer, J.B.B. Avocado leaves: Influence of drying process, thermal incubation, and storage conditions on preservation of polyphenolic compounds and antioxidant activity. Int. J. Food Prop. 2017, 20, 2280–2293. [Google Scholar] [CrossRef]
- Saavedra, J.; Córdova, A.; Navarro, R.; Díaz-Calderón, P.; Fuentealba, C.; Astudillo-Castro, C.; Toledo, L.; Enrione, J.; Galvez, L. Industrial avocado waste: Functional compounds preservation by convective drying process. J. Food Eng. 2017, 198, 81–90. [Google Scholar] [CrossRef]
- De Lima Ferreira, J.P.; de Melo Queiroz, A.J.; de Figueirêdo, R.M.F.; da Silva, W.P.; Gomes, J.P.; da Costa Santos, D.; Silva, H.A.; Rocha, A.P.T.; de Paiva, A.C.C.; Chaves, A.D.C.G.; et al. Utilization of Cumbeba (Tacinga inamoena) Residue: Drying Kinetics and Effect of Process Conditions on Antioxidant Bioactive Compounds. Foods 2021, 10, 788. [Google Scholar] [CrossRef] [PubMed]
- Lewis, B.W.K. The rate of drying of solid materials. J. Ind. Eng. Chem. 1921, 13, 427–432. [Google Scholar] [CrossRef]
- Penteado-Rosa, D.; Cantú-Lozano, D.; Luna-Solano, G.; Polachini, T.C.; Telis-Romero, J. Modelagem matemática da cinética de secagem de semente de laranja. Cienc. Agrotecnologia 2015, 39, 291–300. [Google Scholar] [CrossRef]
- Ozarslan, R.; Bas, E. Kinetic model for drying in frame of generalized fractional derivatives. Fractal Fract. 2020, 4, 17. [Google Scholar] [CrossRef]
- Berbert, P.A.; de Oliveira, M.T.R.; Molina, M.A.B.; de J. Soares, K.; Coelho, A.A. Thin-layer convective drying behaviour of brazilian peppertree leaves TT—Secagem em camada delgada de folhas de aroeira. Biosci. J. 2019, 35, 540–560. [Google Scholar] [CrossRef]
- Henderson, S.M. Grain Drying Theory (I) Temperature Effect on Drying Coefficient. J. Agric. Eng. Res. 1961, 6, 169–174. [Google Scholar]
- Corrêa, P.C.; Baptestini, F.M.; Zeymer, J.S.; de Araujo, M.E.V.; de Freitas, R.C.P.; Leite, R.A. Dehydration of infrared ginger slices: Heat and mass transfer coefficient and modeling. Cienc. Agrotecnol. 2019, 43, e025318. [Google Scholar] [CrossRef]
- Yang, C.Y.; Fon, D.S.; Lin, T.T. Simulation and Validation of Thin Layer Models for Peanut Drying. Dry. Technol. 2007, 25, 1515–1526. [Google Scholar] [CrossRef]
- Vega-Gálvez, A.; Miranda, M.; Díaz, L.P.; Lopez, L.; Rodriguez, K.; Scala, K. Di Effective moisture diffusivity determination and mathematical modelling of the drying curves of the olive-waste cake. Bioresour. Technol. 2010, 101, 7265–7270. [Google Scholar] [CrossRef]
- Dikmen, E.; Ayaz, M.; Kovacı, T.; Şahin, A.Ş. Mathematical modelling of drying characteristics of medical plants in a vacuum heat pump dryer. Int. J. Ambient Energy 2019, 40, 616–623. [Google Scholar] [CrossRef]
- Karathanos, V.T.; Belessiotis, V.G. Application of a thin-layer equation to drying data of fresh and semi-dried fruits. J. Agric. Eng. Res. 1999, 74, 355–361. [Google Scholar] [CrossRef]
- Górnicki, K.; Kaleta, A.; Choińska, A. Suitable model for thin-layer drying of root vegetables and onion. Int. Agrophysics 2020, 34, 79–86. [Google Scholar] [CrossRef]
- Ghodake, H.M.; Goswami, T.K.; Chakraverty, A. Mathematical Modeling of Withering Characteristics of Tea Leaves. Dry. Technol. 2006, 24, 159–164. [Google Scholar] [CrossRef]
- Falade, K.O.; Solademi, O.J. Modelling of air drying of fresh and blanched sweet potato slices. Int. J. Food Sci. Technol. 2010, 45, 278–288. [Google Scholar] [CrossRef]
- Yaldýz, O.; Ertekýn, C. Thin layer solar drying of some vegetables. Dry. Technol. 2001, 19, 583–597. [Google Scholar] [CrossRef]
- Togrul, I.T.; Pehlivan, D. Mathematical modelling of solar drying of apricots in thin layers. J. Food Eng. 2002, 55, 209–216. [Google Scholar] [CrossRef]
- Xu, H.; Wu, M.; Wang, Y.; Wei, W.; Sun, D.; Li, D.; Zheng, Z.; Gao, F. Effect of Combined Infrared and Hot Air Drying Strategies on the Quality of Chrysanthemum (Chrysanthemum morifolium Ramat.) Cakes: Drying Behavior, Aroma Profiles and Phenolic Compounds. Foods 2022, 11, 2240. [Google Scholar] [CrossRef]
- Zhao, T.; Dong, Q.; Zhou, H.; Yang, H. Drying kinetics, physicochemical properties, antioxidant activity and antidiabetic potential of Sargassum fusiforme processed under four drying techniques. LWT 2022, 163, 113578. [Google Scholar] [CrossRef]
- Taylor, J. Introduction to Error Analysis, the Study of Uncertainties in Physical Measurements, 2nd ed.; University Science Books: Sausalito, CA, USA, 1997. [Google Scholar]
- Avhad, M.R.; Marchetti, J.M. Mathematical modelling of the drying kinetics of Hass avocado seeds. Ind. Crops Prod. 2016, 91, 76–87. [Google Scholar] [CrossRef]
- Verni, M.; Pontonio, E.; Krona, A.; Jacob, S.; Pinto, D.; Rinaldi, F.; Verardo, V.; Díaz-de-Cerio, E.; Coda, R.; Rizzello, C.G. Bioprocessing of Brewers’ Spent Grain Enhances Its Antioxidant Activity: Characterization of Phenolic Compounds and Bioactive Peptides. Front. Microbiol. 2020, 11, 1831. [Google Scholar] [CrossRef]
- Mesías-García, M.; Guerra-Hernández, E.; García-Villanova, B. Determination of furan precursors and some thermal damage markers in baby foods: Ascorbic acid, dehydroascorbic acid, hydroxymethylfurfural and furfural. J. Agric. Food Chem. 2010, 58, 6027–6032. [Google Scholar] [CrossRef] [PubMed]
- Brand-Williams, W.; Cuvelier, M.E.; Berset, C. Use of a free redical method to evaluate antioxidant activity. LWT-Food Sci. Technol. 1995, 28, 25–30. [Google Scholar] [CrossRef]
- Parejo, I.; Codina, C.; Petrakis, C.; Kefalas, P. Evaluation of scavenging activity assessed by Co(II)/EDTA-induced luminol chemiluminescence and DPPH (2,2-diphenyl-1-picrylhydrazyl) free radical assay. J. Pharmacol. Toxicol. Methods 2000, 44, 507–512. [Google Scholar] [CrossRef] [PubMed]
- Re, R.; Pellegrini, N.; Proteggente, A.; Pannala, A.; Yang, M.; Rice-Evans, C. Antioxidant activity applying an improved ABTS radical cation decolorization assay. Free Radic. Biol. Med. 1999, 26, 1231–1237. [Google Scholar] [CrossRef] [PubMed]
- Pulido, R.; Bravo, L.; Saura-Calixto, F. Antioxidant activity of dietary polyphenols as determined by a modified ferric reducing/antioxidant power assay. J. Agric. Food Chem. 2000, 48, 3396–3402. [Google Scholar] [CrossRef] [PubMed]
- Guo, H.L.; Chen, Y.; Xu, W.; Xu, M.T.; Sun, Y.; Wang, X.C.; Wang, X.Y.; Luo, J.; Zhang, H.; Xiong, Y.K. Assessment of Drying Kinetics, Textural and Aroma Attributes of Mentha haplocalyx Leaves during the Hot Air Thin-Layer Drying Process. Foods 2022, 11, 784. [Google Scholar] [CrossRef]
- Karami, H.; Kaveh, M.; Golpour, I.; Khalife, E.; Rusinek, R.; Dobrzański, B.; Gancarz, M. Thermodynamic evaluation of the forced convective hybrid-solar dryer during drying process of rosemary (Rosmarinus officinalis L.) leaves. Energies 2021, 14, 5835. [Google Scholar] [CrossRef]
- Karami, H.; Lorestani, A.N.; Tahvilian, R. Assessment of kinetics, effective moisture diffusivity, specific energy consumption, and percentage of thyme oil extracted in a hybrid solar-electric dryer. J. Food Process Eng. 2021, 44, e13588. [Google Scholar] [CrossRef]
- Cavalcanti-Mata, M.E.R.M.; Duarte, M.E.M.; Lira, V.V.; Oliveira, R.F.; Costa, N.L.; Oliveira, H.M.L. A new approach to the traditional drying models for the thin-layer drying kinetics of chickpeas. J. Food Process Eng. 2020, 43, e13569. [Google Scholar] [CrossRef]
- Gaikwad, P.S.; Sunil, C.K.; Negi, A.; Pare, A. Effect of microwave assisted hot-air drying temperatures on drying kinetics of dried black gram papad (Indian snack food). Appl. Food Res. 2022, 2, 100144. [Google Scholar] [CrossRef]
- Zalazar-Garcia, D.; Román, M.C.; Fernandez, A.; Asensio, D.; Zhang, X.; Fabani, M.P.; Rodriguez, R.; Mazza, G. Exergy, energy, and sustainability assessments applied to RSM optimization of integrated convective air-drying with pretreatments to improve the nutritional quality of pumpkin seeds. Sustain. Energy Technol. Assess. 2022, 49, 101763. [Google Scholar] [CrossRef]
- Del Carmen Razola-Díaz, M.; Guerra-Hernández, E.J.; Rodríguez-Pérez, C.; Gómez-Caravaca, A.M.; García-Villanova, B.; Verardo, V. Optimization of Ultrasound Assisted Extraction of Phenolic Compounds from Orange By-Product. Proceedings 2020, 70, 49. [Google Scholar] [CrossRef]
- Cheriet, T.; Ben-Bachir, B.; Thamri, O.; Seghiri, R.; Mancini, I. Isolation and biological properties of the natural flavonoids pectolinarin and pectolinarigenin—A review. Antibiotics 2020, 9, 417. [Google Scholar] [CrossRef] [PubMed]
- Choi, E.J. Hesperetin Induced G1-Phase Cell Cycle Arrest in Human Breast Cancer MCF-7 Cells: Involvement of CDK4 and p21. Nutr. Cancer 2007, 59, 115–119. [Google Scholar] [CrossRef] [PubMed]
- Choi, E.J.; Kim, G.H. Anti-/pro-apoptotic effects of hesperetin against 7,12-dimetylbenz(a) anthracene-induced alteration in animals. Oncol. Rep. 2011, 25, 545–550. [Google Scholar] [CrossRef] [PubMed]
- El-Sisi, A.E.; Sokkar, S.S.; Ibrahim, H.A.; Hamed, M.F.; Abu-Risha, S.E. Targeting MDR-1 gene expression, BAX/BCL2, caspase-3, and Ki-67 by nanoencapsulated imatinib and hesperidin to enhance anticancer activity and ameliorate cardiotoxicity. Fundam. Clin. Pharmacol. 2020, 1, 458–475. [Google Scholar] [CrossRef]
- Mahmoud, A.M.; Ashour, M.B.; Abdel-Moneim, A.; Ahmed, O.M. Hesperidin and naringin attenuate hyperglycemia-mediated oxidative stress and proinflammatory cytokine production in high fat fed/streptozotocin-induced type 2 diabetic rats. J. Diabetes Complicat. 2012, 26, 483–490. [Google Scholar] [CrossRef]
- Liu, L.; Shan, S.; Zhang, K.; Ning, Z.-Q.; Lu, X.-P.; Cheng, Y.-Y. Naringenin and hesperetin, two flavonoids derived from Citrus aurantium up-regulate transcription of adiponectin. Phyther. Res. 2008, 22, 1400–1403. [Google Scholar] [CrossRef]
- Elavarasan, J.; Velusamy, P.; Ganesan, T.; Ramakrishnan, S.K.; Rajasekaran, D.; Periandavan, K. Hesperidin-mediated expression of Nrf2 and upregulation of antioxidant status in senescent rat heart. J. Pharm. Pharmacol. 2012, 64, 1472–1482. [Google Scholar] [CrossRef]
- Wang, X.; Hasegawa, J.; Kitamura, Y.; Wang, Z.; Matsuda, A.; Shinoda, W.; Miura, N.; Kimura, K. Effects of hesperidin on the progression of hypercholesterolemia and fatty liver induced by high-cholesterol diet in rats. J. Pharmacol. Sci. 2011, 117, 129–138. [Google Scholar] [CrossRef]
- Rizza, S.; Muniyappa, R.; Iantorno, M.; Kim, J.A.; Chen, H.; Pullikotil, P.; Senese, N.; Tesauro, M.; Lauro, D.; Cardillo, C.; et al. Citrus polyphenol hesperidin stimulates production of nitric oxide in endothelial cells while improving endothelial function and reducing inflammatory markers in patients with metabolic syndrome. J. Clin. Endocrinol. Metab. 2011, 96, 782–792. [Google Scholar] [CrossRef] [PubMed]
- Miwa, Y.; Yamada, M.; Sunayama, T.; Mitsuzumi, H.; Tsuzaki, Y.; Chaen, H.; Mishima, Y.; Kibata, M. Effects of glucosyl hesperidin on serum lipids in hyperlipidemic subjects: Preferential reduction in elevated serum triglyceride level. J. Nutr. Sci. Vitaminol. 2004, 50, 211–218. [Google Scholar] [CrossRef] [PubMed]
- Demonty, I.; Lin, Y.; Zebregs, Y.E.M.P.; Vermeer, M.A.; van der Knaap, H.C.M.; Jäkel, M.; Trautwein, E.A. The Citrus Flavonoids Hesperidin and Naringin Do Not Affect Serum Cholesterol in Moderately Hypercholesterolemic Men and Women. J. Nutr. 2010, 140, 1615–1620. [Google Scholar] [CrossRef] [PubMed]
- Jeon, S.M.; Bok, S.H.; Jang, M.K.; Lee, M.K.; Nam, K.T.; Park, Y.B.; Rhee, S.J.; Choi, M.S. Antioxidative activity of naringin and lovastatin in high cholesterol-fed rabbits. Life Sci. 2001, 69, 2855–2866. [Google Scholar] [CrossRef] [PubMed]
- Jeon, S.; Park, Y.B.; Choi, M. Antihypercholesterolemic property of naringin alters plasma and tissue lipids, cholesterol-regulating enzymes, fecal sterol and tissue morphology in rabbits. Clin. Nutr. 2004, 23, 1025–1034. [Google Scholar] [CrossRef]
- Jain, M.; Parmar, H.S. Evaluation of antioxidative and anti-inflammatory potential of hesperidin and naringin on the rat air pouch model of inflammation. Inflamm. Res. 2011, 60, 483–491. [Google Scholar] [CrossRef]
- Chen, M.L.; Yang, D.J.; Liu, S.C. Effects of drying temperature on the flavonoid, phenolic acid and antioxidative capacities of the methanol extract of citrus fruit (Citrus sinensis (L.) Osbeck) peels. Int. J. Food Sci. Technol. 2011, 46, 1179–1185. [Google Scholar] [CrossRef]
- Marfil, P.H.M.; Santos, E.M.; Telis, V.R.N. Ascorbic acid degradation kinetics in tomatoes at different drying conditions. LWT-Food Sci. Technol. 2008, 41, 1642–1647. [Google Scholar] [CrossRef]


| Model Name | Model Equation | References |
|---|---|---|
| Lewis | [23,24,25,26] | |
| Henderson and Pabis | [27,28,29,30,31] | |
| Page | [32,33,34,35] | |
| Logarithmic | [36,37,38,39] | |
| Weibull | [9] |
| Model | T (°C) | Air Flow 1.6 m/s | Air Flow 0.8 m/s | No Air Flow | |||||||||||||||
|---|---|---|---|---|---|---|---|---|---|---|---|---|---|---|---|---|---|---|---|
| R2 | X2 | SEE | RMSE | MAE | P0 | R2 | X2 | SEE | RSME | MAE | P0 | R2 | X2 | SEE | RSME | MAE | P0 | ||
| Lewis | 40 | 0.9224 | 0.0096 | 0.0979 | 0.1494 | 0.0721 | 0.5174 | 0.955 | 0.0072 | 0.0847 | 0.1696 | 0.0656 | 0.2042 | 0.9739 | 0.0100 | 0.0998 | 0.1463 | 0.0660 | 0.1696 |
| 60 | 0.9624 | 0.0029 | 0.0537 | 0.1348 | 0.0476 | 0.9138 | 0.9829 | 0.0018 | 0.0421 | 0.0837 | 0.0365 | 0.1512 | 0.9677 | 0.0028 | 0.0529 | 0.1292 | 0.0507 | 0.1060 | |
| 80 | 0.9984 | 0.0850 | 0.2915 | 0.7517 | 0.2267 | 0.1423 | 0.9702 | 0.0052 | 0.0719 | 0.1552 | 0.0599 | 0.3093 | 0.9765 | 0.0054 | 0.0732 | 0.2581 | 0.0596 | 0.2993 | |
| Henderson and Pabis | 40 | 0.8371 | 0.0897 | 0.2995 | 0.1750 | 0.1578 | 1.0087 | 0.9622 | 0.0087 | 0.0930 | 0.0692 | 0.0608 | 0.1670 | 0.9397 | 0.0150 | 0.1226 | 0.0630 | 0.0685 | 0.1349 |
| 60 | 0.9289 | 0.0064 | 0.0798 | 0.0718 | 0.0613 | 0.9684 | 0.9611 | 0.0050 | 0.0707 | 0.0566 | 0.0480 | 0.1373 | 0.9468 | 0.0043 | 0.0657 | 0.0406 | 0.0527 | 0.1042 | |
| 80 | 0.9352 | 0.0855 | 0.2924 | 0.7337 | 0.2326 | 0.1472 | 0.9543 | 0.0106 | 0.1030 | 0.0717 | 0.0687 | 0.2004 | 0.9603 | 0.0090 | 0.0951 | 0.1820 | 0.0642 | 0.2412 | |
| Page | 40 | 0.9682 | 0.0004 | 0.0207 | 0.0013 | 0.0174 | 0.9524 | 0.9784 | 0.0007 | 0.0256 | 0.0171 | 0.0213 | 0.1016 | 0.9906 | 0.0006 | 0.0237 | 0.0001 | 0.0181 | 0.0634 |
| 60 | 0.9850 | 0.0009 | 0.0292 | 0.0075 | 0.0229 | 1.0105 | 0.9888 | 0.0005 | 0.0216 | 0.0030 | 0.0176 | 0.0877 | 0.995 | 0.0006 | 0.0246 | 0.0064 | 0.0158 | 0.0422 | |
| 80 | 0.9670 | 0.0052 | 0.0718 | 0.2194 | 0.0662 | 1.3791 | 0.9843 | 0.0008 | 0.0289 | 0.0109 | 0.0240 | 0.1291 | 0.9903 | 0.0007 | 0.0261 | 0.0265 | 0.0194 | 0.1662 | |
| Logarithmic | 40 | 0.8959 | 0.2128 | 0.4613 | 1.2140 | 0.4292 | 6.7565 | 0.9178 | 0.1138 | 0.3373 | 1.0278 | 0.3250 | 0.3856 | 0.9426 | 0.0751 | 0.2741 | 1.0456 | 0.2585 | 0.4213 |
| 60 | 0.9289 | 0.0464 | 0.2154 | 0.8036 | 0.2075 | 2.2445 | 0.9611 | 0.0537 | 0.2318 | 0.7804 | 0.2253 | 0.4121 | 0.9468 | 0.0329 | 0.1814 | 0.7208 | 0.1699 | 0.2477 | |
| 80 | 0.9194 | 0.0212 | 0.1458 | 0.3491 | 0.1072 | 2.0326 | 0.9543 | 0.0608 | 0.2465 | 0.8178 | 0.2361 | 0.4897 | 0.9644 | 0.0895 | 0.2991 | 1.1845 | 0.2900 | 0.5417 | |
| Weibull | 40 | 0.8969 | 1.0743 | 1.0365 | 2.9293 | 1.0357 | 14.6110 | 0.9719 | 0.7685 | 0.8766 | 2.7529 | 0.8705 | 0.5651 | 0.8895 | 0.6061 | 0.7785 | 2.1986 | 0.7182 | 0.5254 |
| 60 | 0.9834 | 0.5099 | 0.7140 | 2.6252 | 0.6778 | 5.2870 | 0.9918 | 0.6706 | 0.8189 | 2.7735 | 0.8006 | 0.6357 | 0.9899 | 0.3268 | 0.5717 | 2.1481 | 0.5063 | 0.4372 | |
| 80 | 0.9651 | 0.7082 | 0.8415 | 2.7550 | 0.8307 | 6.6091 | 0.9831 | 0.5480 | 0.7403 | 2.4149 | 0.6971 | 0.6567 | 0.9958 | 0.4631 | 0.6805 | 3.2910 | 0.6098 | 0.6493 | |
| Air Flow | T (°C) | Model | |||||||||||
|---|---|---|---|---|---|---|---|---|---|---|---|---|---|
| Lewis | Henderson and Pabis | Page | Logarithmic | Weibull | |||||||||
| k | k | a | k | N | k | a | c | k | a | b | n | ||
| 1.6 m/s | 40 | 0.004 | 0.005 | 1.824 | 0.000 | 1.850 | 0.005 | 1.368 | 0.456 | 0.000 | 1.000 | −0.933 | 1.850 |
| 60 | 0.010 | 0.011 | 1.212 | 0.006 | 1.091 | 0.011 | 0.909 | 0.303 | 0.006 | 1.007 | −0.259 | 1.091 | |
| 80 | 0.057 | 0.058 | 1.062 | 0.005 | 1.179 | 0.019 | 0.742 | 0.247 | 0.007 | 1.001 | −0.552 | 1.179 | |
| 0.8 m/s | 40 | 0.004 | 0.004 | 1.267 | 0.000 | 1.329 | 0.005 | 1.138 | 0.379 | 0.001 | 1.001 | −0.691 | 1.329 |
| 60 | 0.009 | 0.010 | 1.204 | 0.005 | 1.107 | 0.010 | 0.903 | 0.301 | 0.005 | 1.006 | −0.438 | 1.107 | |
| 80 | 0.015 | 0.017 | 1.290 | 0.006 | 1.187 | 0.017 | 0.967 | 0.322 | 0.005 | 1.007 | −0.234 | 1.187 | |
| No | 40 | 0.002 | 0.002 | 1.408 | 0.000 | 1.343 | 0.002 | 0.998 | 0.333 | 0.000 | 1.000 | −0.229 | 1.343 |
| 60 | 0.003 | 0.004 | 1.181 | 0.001 | 1.188 | 0.004 | 0.886 | 0.295 | 0.001 | 1.001 | −0.062 | 1.188 | |
| 80 | 0.007 | 0.008 | 1.284 | 0.002 | 1.263 | 0.009 | 1.069 | 0.356 | 0.002 | 1.002 | −0.042 | 1.263 | |
| Model | Air Flow 1.6 m/s | Air Flow 0.8 m/s | No Air Flow | |||
|---|---|---|---|---|---|---|
| Ea (kJ/mol) | A | Ea (kJ/mol) | A | Ea (kJ/mol) | A | |
| Lewis | 63.49 | 30,576.90 | 32.14 | 4.26 | 30.68 | 17.10 |
| Henderson and Pabis | 58.37 | 5450.70 | 35.12 | 1.35 | 31.63 | 10.61 |
| Page | 139.57 | 1.62 × 10¹⁵ | 60.60 | 1972.78 | 55.82 | 92.13 |
| Logarithmic | 33.32 | 2.31 | 31.16 | 5.34 | 32.68 | 7.22 |
| Weibull | 41.98 | 6.66 | 55.67 | 351.53 | 49.38 | 9.54 |
| 40 °C | 60 °C | 80 °C | |||||||
|---|---|---|---|---|---|---|---|---|---|
| No Air Flow | Air Flow 0.8 m/s | Air Flow 1.6 m/s | No Air Flow | Air Flow 0.8 m/s | Air Flow 1.6 m/s | No Air Flow | Air Flow 0.8 m/s | Air Flow 1.6 m/s | |
| Total phenolic compounds | 5456.16 ± 26.04 | 5527.02 ± 25.73 | 5682.05 ± 24.84 | 5629.07 ± 20.61 | 5685.66 ± 25.27 | 6051.14 ± 29.42 | 4819.98 ± 21.81 | 5009.58 ± 28.24 | 5209.04 ± 20.51 |
| Total phenolic acids | 4455.51 ± 12.66 | 4468.87 ± 12.06 | 4614.93 ± 10.75 | 4606.92 ± 7.04 | 4644.09 ± 11.63 | 4941.70 ± 15.87 | 3864.45 ± 8.63 | 4032.31 ± 15.04 | 4186.94 ± 7.57 |
| Feruloyl galactaric acid isomer a | 2404.84 ± 1.36 | 2509.04 ± 3.68 | 2683.77 ± 6.18 | 2674.52 ± 0.65 | 2740.43 ± 1.55 | 2664.82 ± 2.67 | 2296.02 ± 2.61 | 2180.15 ± 4.10 | 2376.07 ± 1.39 |
| Feruloyl galactaric acid isomer b | 1017.20 ± 3.48 | 1062.22 ± 1.59 | 1112.53 ± 1.78 | 1096.90 ± 1.10 | 994.47 ± 4.83 | 1158.10 ± 5.79 | 907.51 ± 1.77 | 923.03 ± 0.55 | 943.40 ± 0.96 |
| Sinapinic acid-O-glucuronide | 632.81 ± 4.69 | 660.80 ± 0.99 | 609.71 ± 1.81 | 583.90 ± 1.82 | 664.99 ± 3.82 | 739.48 ± 2.63 | 373.37 ± 2.59 | 586.58 ± 7.54 | 533.36 ± 2.51 |
| Feruloyl isocitric acid isomer a | 148.99 ± 1.64 | 107.74 ± 1.46 | 93.88 ± 0.49 | 122.21 ± 2.00 | 110.17 ± 0.57 | 150.14 ± 1.41 | 82.42 ± 1.20 | 101.45 ± 0.67 | 114.19 ± 0.60 |
| Feruloyl isocitric acid isomer b | 67.76 ± 0.75 | 28.36 ± 1.39 | 24.14 ± 0.15 | 21.07 ± 0.22 | 31.18 ± 0.48 | 51.66 ± 0.72 | 50.10 ± 0.03 | 66.44 ± 0.58 | 51.94 ± 0.68 |
| Feruloyl isocitric acid isomer c | 147.59 ± 0.70 | 77.32 ± 2.48 | 69.85 ± 0.26 | 85.65 ± 1.12 | 78.88 ± 0.32 | 142.24 ± 2.24 | 118.75 ± 0.42 | 151.24 ± 1.15 | 132.76 ± 0.87 |
| Caffeoylmalic acid | 36.32 ± 0.05 | 23.40 ± 0.46 | 21.04 ± 0.08 | 22.66 ± 0.11 | 23.97 ± 0.06 | 35.25 ± 0.40 | 36.27 ± 0.02 | 23.41 ± 0.45 | 35.22 ± 0.56 |
| Total flavonoids | 1000.65 ± 13.38 | 1058.15 ± 13.67 | 1067.12 ± 14.09 | 1022.15 ± 13.57 | 1041.57 ± 13.64 | 1109.43 ± 13.55 | 955.53 ± 12.95 | 977.27 ± 13.20 | 1022.09 ± 13.19 |
| Isorhamnetin-3-O-rutinoside isomer a | 18.55 ± 0.52 | 17.67 ± 0.50 | 16.35 ± 0.46 | 18.10 ± 0.50 | 18.15 ± 0.49 | 19.61 ± 0.53 | 15.96 ± 0.44 | 16.86 ± 0.48 | 16.22 ± 0.46 |
| Isorhamnetin-3-O-rutinoside isomer b | 3.88 ± 0.14 | 4.10 ± 0.15 | 3.87 ± 0.14 | 4.21 ± 0.15 | 4.02 ± 0.15 | 4.09 ± 0.14 | 3.29 ± 0.13 | 3.38 ± 0.13 | 4.02 ± 0.14 |
| Isorhamnetin-3-O-rutinoside isomer c | 4.39 ± 0.16 | 3.15 ± 0.12 | 4.33 ± 0.16 | 4.79 ± 0.17 | 4.19 ± 0.15 | 3.66 ± 0.13 | 4.07 ± 0.15 | 4.33 ± 0.16 | 5.47 ± 0.18 |
| Prunin | 18.71 ± 0.55 | 24.36 ± 0.68 | 23.75 ± 0.69 | 22.82 ± 0.66 | 11.75 ± 0.36 | 24.17 ± 0.64 | 18.81 ± 0.55 | 20.58 ± 0.60 | 18.79 ± 0.52 |
| Didymin | 9.87 ± 0.31 | 10.32 ± 0.31 | 10.21 ± 0.32 | 9.15 ± 0.29 | 11.82 ± 0.36 | 10.45 ± 0.30 | 9.60 ± 0.30 | 10.87 ± 0.33 | 9.74 ± 0.29 |
| Pectolinarigenin | 644.28 ± 4.60 | 675.57 ± 4.66 | 687.33 ± 4.88 | 667.32 ± 4.76 | 678.64 ± 4.86 | 715.95 ± 4.66 | 604.36 ± 4.35 | 615.58 ± 4.43 | 639.10 ± 4.34 |
| Hesperidin | 56.65 ± 1.07 | 58.25 ± 1.06 | 68.40 ± 1.26 | 66.58 ± 1.23 | 71.55 ± 1.32 | 71.99 ± 1.22 | 57.38 ± 1.08 | 57.23 ± 1.08 | 56.01 ± 1.01 |
| Narirutin | 40.17 ± 0.80 | 47.79 ± 0.90 | 49.02 ± 0.94 | 42.80 ± 0.85 | 47.16 ± 0.92 | 47.19 ± 0.85 | 46.93 ± 0.91 | 45.01 ± 0.88 | 45.21 ± 0.84 |
| Naringenin | 2.59 ± 0.11 | 0.96 ± 0.06 | 0.32 ± 0.05 | 1.99 ± 0.09 | 0.54 ± 0.05 | 3.48 ± 0.13 | 0.67 ± 0.06 | 0.61 ± 0.05 | 2.44 ± 0.10 |
| Naringin hydrate | 10.41 ± 0.32 | 13.54 ± 0.39 | 12.23 ± 0.37 | 11.43 ± 0.35 | 12.71 ± 0.39 | 13.98 ± 0.39 | 11.71 ± 0.36 | 11.05 ± 0.34 | 12.86 ± 0.37 |
| Rutin isomer a | 15.18 ± 0.45 | 16.22 ± 0.47 | 14.83 ± 0.44 | 15.04 ± 0.45 | 14.92 ± 0.45 | 15.41 ± 0.42 | 13.95 ± 0.42 | 15.86 ± 0.47 | 15.67 ± 0.44 |
| Rutin isomer b | 11.97 ± 0.36 | 10.53 ± 0.32 | 10.72 ± 0.33 | 10.91 ± 0.34 | 8.19 ± 0.26 | 8.32 ± 0.25 | 9.80 ± 0.31 | 11.18 ± 0.34 | 11.96 ± 0.35 |
| 3’,4’-Didemethylnobiletin | 2.76 ± 0.12 | 2.20 ± 0.10 | 1.85 ± 0.09 | 0.80 ± 0.06 | 0.10 ± 0.04 | 2.79 ± 0.11 | 1.24 ± 0.07 | 0.48 ± 0.05 | 0.61 ± 0.05 |
| Quercetin-3-O-rutinoside-7-O-Glucoside | 1.95 ± 0.09 | 2.29 ± 0.10 | 2.45 ± 0.10 | 2.34 ± 0.10 | 2.84 ± 0.12 | 2.41 ± 0.10 | 2.59 ± 0.11 | 2.42 ± 0.10 | 2.32 ± 0.10 |
| Apigenin 6-C-glucoside 8-C-arabinoside/Vitexin-O-pentoside isomer a | 10.46 ± 0.32 | 10.80 ± 0.32 | 11.63 ± 0.36 | 9.88 ± 0.31 | 11.11 ± 0.34 | 12.23 ± 0.34 | 10.12 ± 0.31 | 9.94 ± 0.31 | 11.63 ± 0.34 |
| Apigenin 6-C-glucoside 8-C-arabinoside/Vitexin-O-pentoside isomer b | 13.04 ± 0.39 | 12.60 ± 0.37 | 13.08 ± 0.39 | 11.77 ± 0.36 | 12.62 ± 0.38 | 14.47 ± 0.40 | 12.28 ± 0.37 | 11.46 ± 0.35 | 14.33 ± 0.41 |
| Apigenin-di-C-hexoside (Vicenin-2) | 63.75 ± 1.18 | 70.19 ± 1.25 | 71.60 ± 1.31 | 66.79 ± 1.24 | 69.71 ± 1.29 | 78.36 ± 1.31 | 60.91 ± 1.14 | 65.73 ± 1.22 | 71.78 ± 1.25 |
| Apigenin 7-O-neohesperidoside | 4.54 ± 0.16 | 5.97 ± 0.20 | 5.27 ± 0.18 | 3.75 ± 0.14 | 5.28 ± 0.18 | 4.96 ± 0.16 | 4.77 ± 0.17 | 5.42 ± 0.19 | 6.24 ± 0.20 |
| Kaempferol 3-apiosyl-(1->2)-galactoside/Luteolin-C-hexoside-C-pentoside isomer a | 3.02 ± 0.12 | 3.86 ± 0.14 | 2.45 ± 0.11 | 3.04 ± 0.12 | 2.32 ± 0.10 | 3.30 ± 0.12 | 2.59 ± 0.11 | 2.38 ± 0.10 | 2.74 ± 0.11 |
| Kaempferol 3-apiosyl-(1->2)-galactoside/Luteolin-C-hexoside-C-pentoside isomer b | <LOQ | <LOQ | 2.58 ± 0.11 | 4.52 ± 0.16 | 1.94 ± 0.09 | 4.57 ± 0.15 | 1.53 ± 0.08 | 1.29 ± 0.07 | 0.03 ± 0.04 |
| Kaempferol 3-[2″-glucosyl-6″-acetyl-galactoside] 7-glucoside isomer a | 5.09 ± 0.18 | 3.69 ± 0.14 | 4.55 ± 0.16 | 3.31 ± 0.13 | 2.42 ± 0.10 | 3.30 ± 0.12 | 3.93 ± 0.15 | 2.34 ± 0.10 | 5.02 ± 0.17 |
| Kaempferol 3-[2″-glucosyl-6″-acetyl-galactoside] 7-glucoside isomer b | 5.17 ± 0.18 | 4.39 ± 0.15 | 2.90 ± 0.12 | 4.42 ± 0.16 | 3.39 ± 0.13 | 4.82 ± 0.16 | 4.84 ± 0.17 | 3.27 ± 0.13 | 5.60 ± 0.18 |
| Kaempferol-dihexosyl acetate | 50.66 ± 0.97 | 58.54 ± 1.07 | 43.42 ± 0.85 | 31.70 ± 0.66 | 43.49 ± 0.86 | 34.87 ± 0.66 | 51.92 ± 0.99 | 58.51 ± 1.10 | 61.64 ± 1.09 |
| kaempferol 3-O-[3″,6″-di-O-(E)-cinnamoyl]-beta-D-glucopyranoside | <LOQ | <LOQ | 0.99 ± 0.07 | 1.51 ± 0.08 | 0.78 ± 0.06 | 1.24 ± 0.07 | 0.06 ± 0.04 | 0.36 ± 0.05 | <LOQ |
| Kaempferol 3-O-(6″-O-acetyl)glucoside-7-O-rhamnoside | 0.63 ± 0.06 | <LOQ | 0.17 ± 0.04 | <LOQ | <LOQ | <LOQ | <LOQ | <LOQ | 0.11 ± 0.04 |
| Kaempferol 3-O-sinapoyl-caffeoyl-sophoroside 7-O-glucoside isomer a | 1.84 ± 0.09 | 1.30 ± 0.07 | 1.11 ± 0.07 | 1.26 ± 0.07 | 1.20 ± 0.07 | 1.99 ± 0.09 | 0.97 ± 0.06 | 0.78 ± 0.06 | 0.76 ± 0.06 |
| Kaempferol 3-O-sinapoyl-caffeoyl-sophoroside 7-O-glucoside isomer b | 0.78 ± 0.06 | 0.46 ± 0.05 | 0.73 ± 0.06 | 0.56 ± 0.05 | 0.15 ± 0.04 | 0.89 ± 0.06 | 0.33 ± 0.05 | <LOQ | 0.67 ± 0.06 |
| Kaempferol 3-apiosyl-(1->4)-rhamnoside-7-rhamnoside | 1.11 ± 0.07 | 0.84 ± 0.06 | 0.98 ± 0.06 | 1.37 ± 0.08 | 0.55 ± 0.05 | 0.94 ± 0.06 | 0.93 ± 0.06 | 0.36 ± 0.05 | 1.13 ± 0.07 |
| Ascorbic Acid | Dehydroascorbic Acid | Ascorbic Acid/Dehydroascorbic Acid Ratio | Total Vitamin C | |
|---|---|---|---|---|
| 40 °C | 522.41 ± 0.00 | 435.51 ± 0.00 | 1.20 | 957.92 ± 0.00 |
| 40 °C 0.8 m/s | 1007.67 ± 3.05 | 457.49 ± 1.39 | 2.20 | 1465.17 ± 4.44 |
| 40 °C 1.6 m/s | 1029.62 ± 5.38 | 503.60 ± 2.63 | 2.04 | 1533.21 ± 8.00 |
| 60 °C | 539.26 ± 0.04 | 342.30 ± 0.02 | 1.58 | 881.57 ± 0.06 |
| 60 °C 0.8 m/s | 707.22 ± 1.81 | 339.75 ± 0.87 | 2.08 | 1046.97 ± 2.68 |
| 60 °C 1.6 m/s | 715.01 ± 2.25 | 323.58 ± 1.02 | 2.21 | 1038.58 ± 3.27 |
| 80 °C | 478.65 ± 2.21 | 349.71 ± 1.62 | 1.37 | 828.36 ± 3.83 |
| 80 °C 0.8 m/s | 615.38 ± 3.85 | 347.15 ± 2.17 | 1.77 | 962.53 ± 6.02 |
| 80 °C 1.6 m/s | 507.13 ± 3.52 | 487.84 ± 3.39 | 1.04 | 994.96 ± 6.91 |
Disclaimer/Publisher’s Note: The statements, opinions and data contained in all publications are solely those of the individual author(s) and contributor(s) and not of MDPI and/or the editor(s). MDPI and/or the editor(s) disclaim responsibility for any injury to people or property resulting from any ideas, methods, instructions or products referred to in the content. |
© 2023 by the authors. Licensee MDPI, Basel, Switzerland. This article is an open access article distributed under the terms and conditions of the Creative Commons Attribution (CC BY) license (https://creativecommons.org/licenses/by/4.0/).
Share and Cite
Razola-Díaz, M.d.C.; Verardo, V.; Gómez-Caravaca, A.M.; García-Villanova, B.; Guerra-Hernández, E.J. Mathematical Modelling of Convective Drying of Orange By-Product and Its Influence on Phenolic Compounds and Ascorbic Acid Content, and Its Antioxidant Activity. Foods 2023, 12, 500. https://doi.org/10.3390/foods12030500
Razola-Díaz MdC, Verardo V, Gómez-Caravaca AM, García-Villanova B, Guerra-Hernández EJ. Mathematical Modelling of Convective Drying of Orange By-Product and Its Influence on Phenolic Compounds and Ascorbic Acid Content, and Its Antioxidant Activity. Foods. 2023; 12(3):500. https://doi.org/10.3390/foods12030500
Chicago/Turabian StyleRazola-Díaz, María del Carmen, Vito Verardo, Ana María Gómez-Caravaca, Belén García-Villanova, and Eduardo Jesús Guerra-Hernández. 2023. "Mathematical Modelling of Convective Drying of Orange By-Product and Its Influence on Phenolic Compounds and Ascorbic Acid Content, and Its Antioxidant Activity" Foods 12, no. 3: 500. https://doi.org/10.3390/foods12030500
APA StyleRazola-Díaz, M. d. C., Verardo, V., Gómez-Caravaca, A. M., García-Villanova, B., & Guerra-Hernández, E. J. (2023). Mathematical Modelling of Convective Drying of Orange By-Product and Its Influence on Phenolic Compounds and Ascorbic Acid Content, and Its Antioxidant Activity. Foods, 12(3), 500. https://doi.org/10.3390/foods12030500