Article

Functional Fruit Trees from the Atlantic and Amazon Forests: Selection of Potential Chestnut Trees Rich in Antioxidants, Nutrients, and Fatty Acids

by
Caroline Palacio de Araujo
1,
Ingridh Medeiros Simões
1,
Thuanny Lins Monteiro Rosa
1,
Tamyris de Mello
1,
Guilherme Bravim Canal
1,
Adésio Ferreira
1,
João Paulo Bestete de Oliveira
2,
Edilson Romais Schmildt
3,
José Carlos Lopes
1,
Tércio da Silva de Souza
2,
Wagner Campos Otoni
4,
Patrícia Fontes Pinheiro
4,
Fábio Junior Moreira Novaes
4,
Fabricio Gomes Gonçalves
1,
Alexandre Rosa dos Santos
1 and
Rodrigo Sobreira Alexandre
1,*
1
Center of Agricultural Sciences and Engineering, Federal University of Espírito Santo/UFES, Alto Universitário, s/n, Alegre 29500-000, ES, Brazil
2
Federal Institute of Espírito Santo, Campus Alegre, BR 482, Km 47, Rive District, Alegre 29500-000, ES, Brazil
3
North University Center of Espírito Santo, Federal University of Espírito Santo/UFES, Rodovia Governador Mário Covas, Km 60, São Mateus 29932-540, ES, Brazil
4
Federal University of Viçosa/UFV, Av. Peter Henry Rolfs, s/n, Viçosa 36570-900, MG, Brazil
*
Author to whom correspondence should be addressed.
Foods 2023, 12(24), 4422; https://doi.org/10.3390/foods12244422
Submission received: 12 June 2023 / Revised: 31 July 2023 / Accepted: 7 August 2023 / Published: 9 December 2023
(This article belongs to the Section Food Nutrition)

Abstract

:
The Amazon rainforest and the biodiversity hotspot of the Atlantic Forest are home to fruit trees that produce functional foods, which are still underutilized. The present study aimed to select potential functional nut donor trees from two Brazilian chestnuts, by evaluating the nutritional and antioxidant composition of the nuts and the fatty acid profile of the oil. The nutritional characteristics, antioxidants, oil fatty acid profile, and X-ray densitometry of the nuts were evaluated, as well as the characterization of leaf and soil nutrients for each parent tree. The nut oil was evaluated through Brix (%), mass (g), yield (%), and the fatty acid profile. For L. pisonis, the most nutritious nuts were produced by L. pisonis tree 4 (N > P > K > Mg > Ca > Zn > Fe) and L. pisonis tree 6 (P > Ca > Mg > Mn > Zn > Cu > Fe), and for the species L. lanceolata, L. lanceolata tree 6 (N > P > Ca > Mg > Zn > Fe > Cu) and L. lanceolata tree 2 (P > K > Mg > Zn > Cu). In L. pisonis, the highest production of anthocyanins, DPPH, total phenolics, and flavonoids was obtained from the nuts of L. pisonis tree 4 as well as for L. lanceolata, from L. lanceolata tree 1, except for flavonoids. The Brix of the oil from the nuts of both species showed no difference between the trees and the fatty acid profile with a similar amount between saturated (48–65%) and unsaturated (34–57%) fatty acids. Both species have nuts rich in nutrients and antioxidant compounds and can be considered unconventional functional foods. The data collected in the present study confirm that the nuts of these species can replace other foods as a source of selenium.

1. Introduction

Brazil is a country rich in biodiversity, where the Amazon Forest and the Atlantic Forest biodiversity hotspot are located, home to native tree species that produce edible fruits [1,2]. In these forest territories, the species Lecythis pisonis Cambess and Lecythis lanceolata Poir can be found, which produce nuts with functional characteristics. The L. pisonis nuts are rich in essential nutrients, antioxidant compounds, and unsaturated fatty acids [3,4,5,6]. The consumption of foods with functional characteristics has great worldwide acceptance, and is responsible for numerous benefits to human health [7]. Studies on native forests that have nuts with food potential are still scarce, compared to the number of resources available in Brazilian biodiversity [6]. Both studied species have great potential to be inserted into the nut market; however, their fruits and co-products are underused. Nut extraction is a common activity in the Amazon biome, becoming a source of subsistence for countless families and also contributing to reforestation and the preservation of forest remnants [6].
The nutritional and functional characterization of unexplored nuts allows the insertion of new products into the human diet and allows for their balanced consumption [8]. Nuts are natural antioxidants and their daily intake in correct amounts helps in the prevention of cardiovascular and inflammatory diseases, besides having antimicrobial activity [9,10]. Cancer, diabetes, and chronic inflammation are related to people’s lifestyles and an unbalanced diet. As a result, the food industry seeks daily to add products with functional characteristics to the shelves, whether fresh or processed, such as fresh or toasted nuts and their derivatives, like flour, biscuits, and milk [11,12,13]. Therefore, this food is gaining prominence due to its characteristics that are beneficial to human health, as it is a rich source of bioactive compounds and essential nutrients. For instance, nuts contribute to the reduction of the risk of chronic and anti-inflammatory diseases, also acting in the reduction of their symptoms [14]. Chestnut shells (Castanea sativa), previously underutilized, are being studied with a view to their inclusion in diets as a nutraceutical compound, which can act by combating oxidative events in the lungs, kidneys, and blood, increasing the expression of antioxidant enzymes and decreasing lipid peroxidation caused by reactive species of oxygen. This compound also decreased metabolic disturbances by combating the increase in glucose and blood lipids [15]. The consumption of nuts is also beneficial for reducing total cholesterol, acting on the levels of low- and high-density lipoproteins [6].
Currently, a pillar of “fundamental nutrition” has been proposed, which associates general human health with the intake of foods (nuts, fruits, and vegetables) that have a synergistic nutritional matrix, which improves the absorption and action of nutrients absorbed by the intestine [16]. This can be observed in the synergistic action between vitamin C (ascorbic acid) and vitamin E (α-tocopherol) in human serum, which have a joint action against oxidative damage [17]. The importance of nutrients is also observed in bone formation, which requires daily supplementation of calcium, magnesium, phosphorus, potassium, fluoride, and vitamin D [18]. The problem of malnutrition affects people worldwide (approximately one in three people) according to the World Health Organization [19], and eating foods rich in minerals is a way to mitigate these effects.
The chemical composition of extracted chestnuts can be influenced by the location of the parent trees. This occurs because the concentrations of trace elements in the soil are variable and are influenced by soil pH, which is observed for the mineral selenium (Se), which is found in soil at safe concentrations of <5 mg kg−1, but slightly abundant in acidic soils [20,21]. Nuts are rich sources of Se, which acts in the production of selenoproteins, associated with maintaining the integrity of cell membranes, developing sperm cells, regulating thyroid hormones, and mitigating stress and intestinal inflammation [22]. Its deficiency is associated with some diseases that affect heart muscle tissue, bone, and colorectal cancer [22].
Many foods are also rich sources of fatty acids, which are formed by a carboxyl group (polar) attached to a hydrocarbon chain (nonpolar). They can be classified into saturated fatty acids (absence of double bond), unsaturated and polyunsaturated, with one or more than one double bonds, respectively [23]. Excessive intake of saturated fatty acids can contribute to the onset of obesity and diabetes, in addition to increasing neurological risks with the onset of dementia, while the intake of unsaturated fats reduces these risks [24]. Nuts are foods rich in unsaturated fatty acids, which are structural components of cell membrane phospholipids [25], and also, when free in the body, are used in energy production through the synthesis of adenosine triphosphate (ATP) in mitochondria [26]. The human body cannot synthesize essential fatty acids, requiring their consumption from food sources. Linoleic and alpha-linoleic acids, both polyunsaturated, are essential fatty acids found in nuts, acting, along with their derivatives (eicosapentaenoic and docosahexaenoic acids), against cardiovascular diseases such as hypertension [27].
In view of all these features, the present study aimed to select L. pisonis and L. lanceolata trees that produce nuts with functional and nutritional characteristics that are suitable for human consumption, through nutritional characterization and antioxidant and oil fatty acid profiles.

2. Materials and Methods

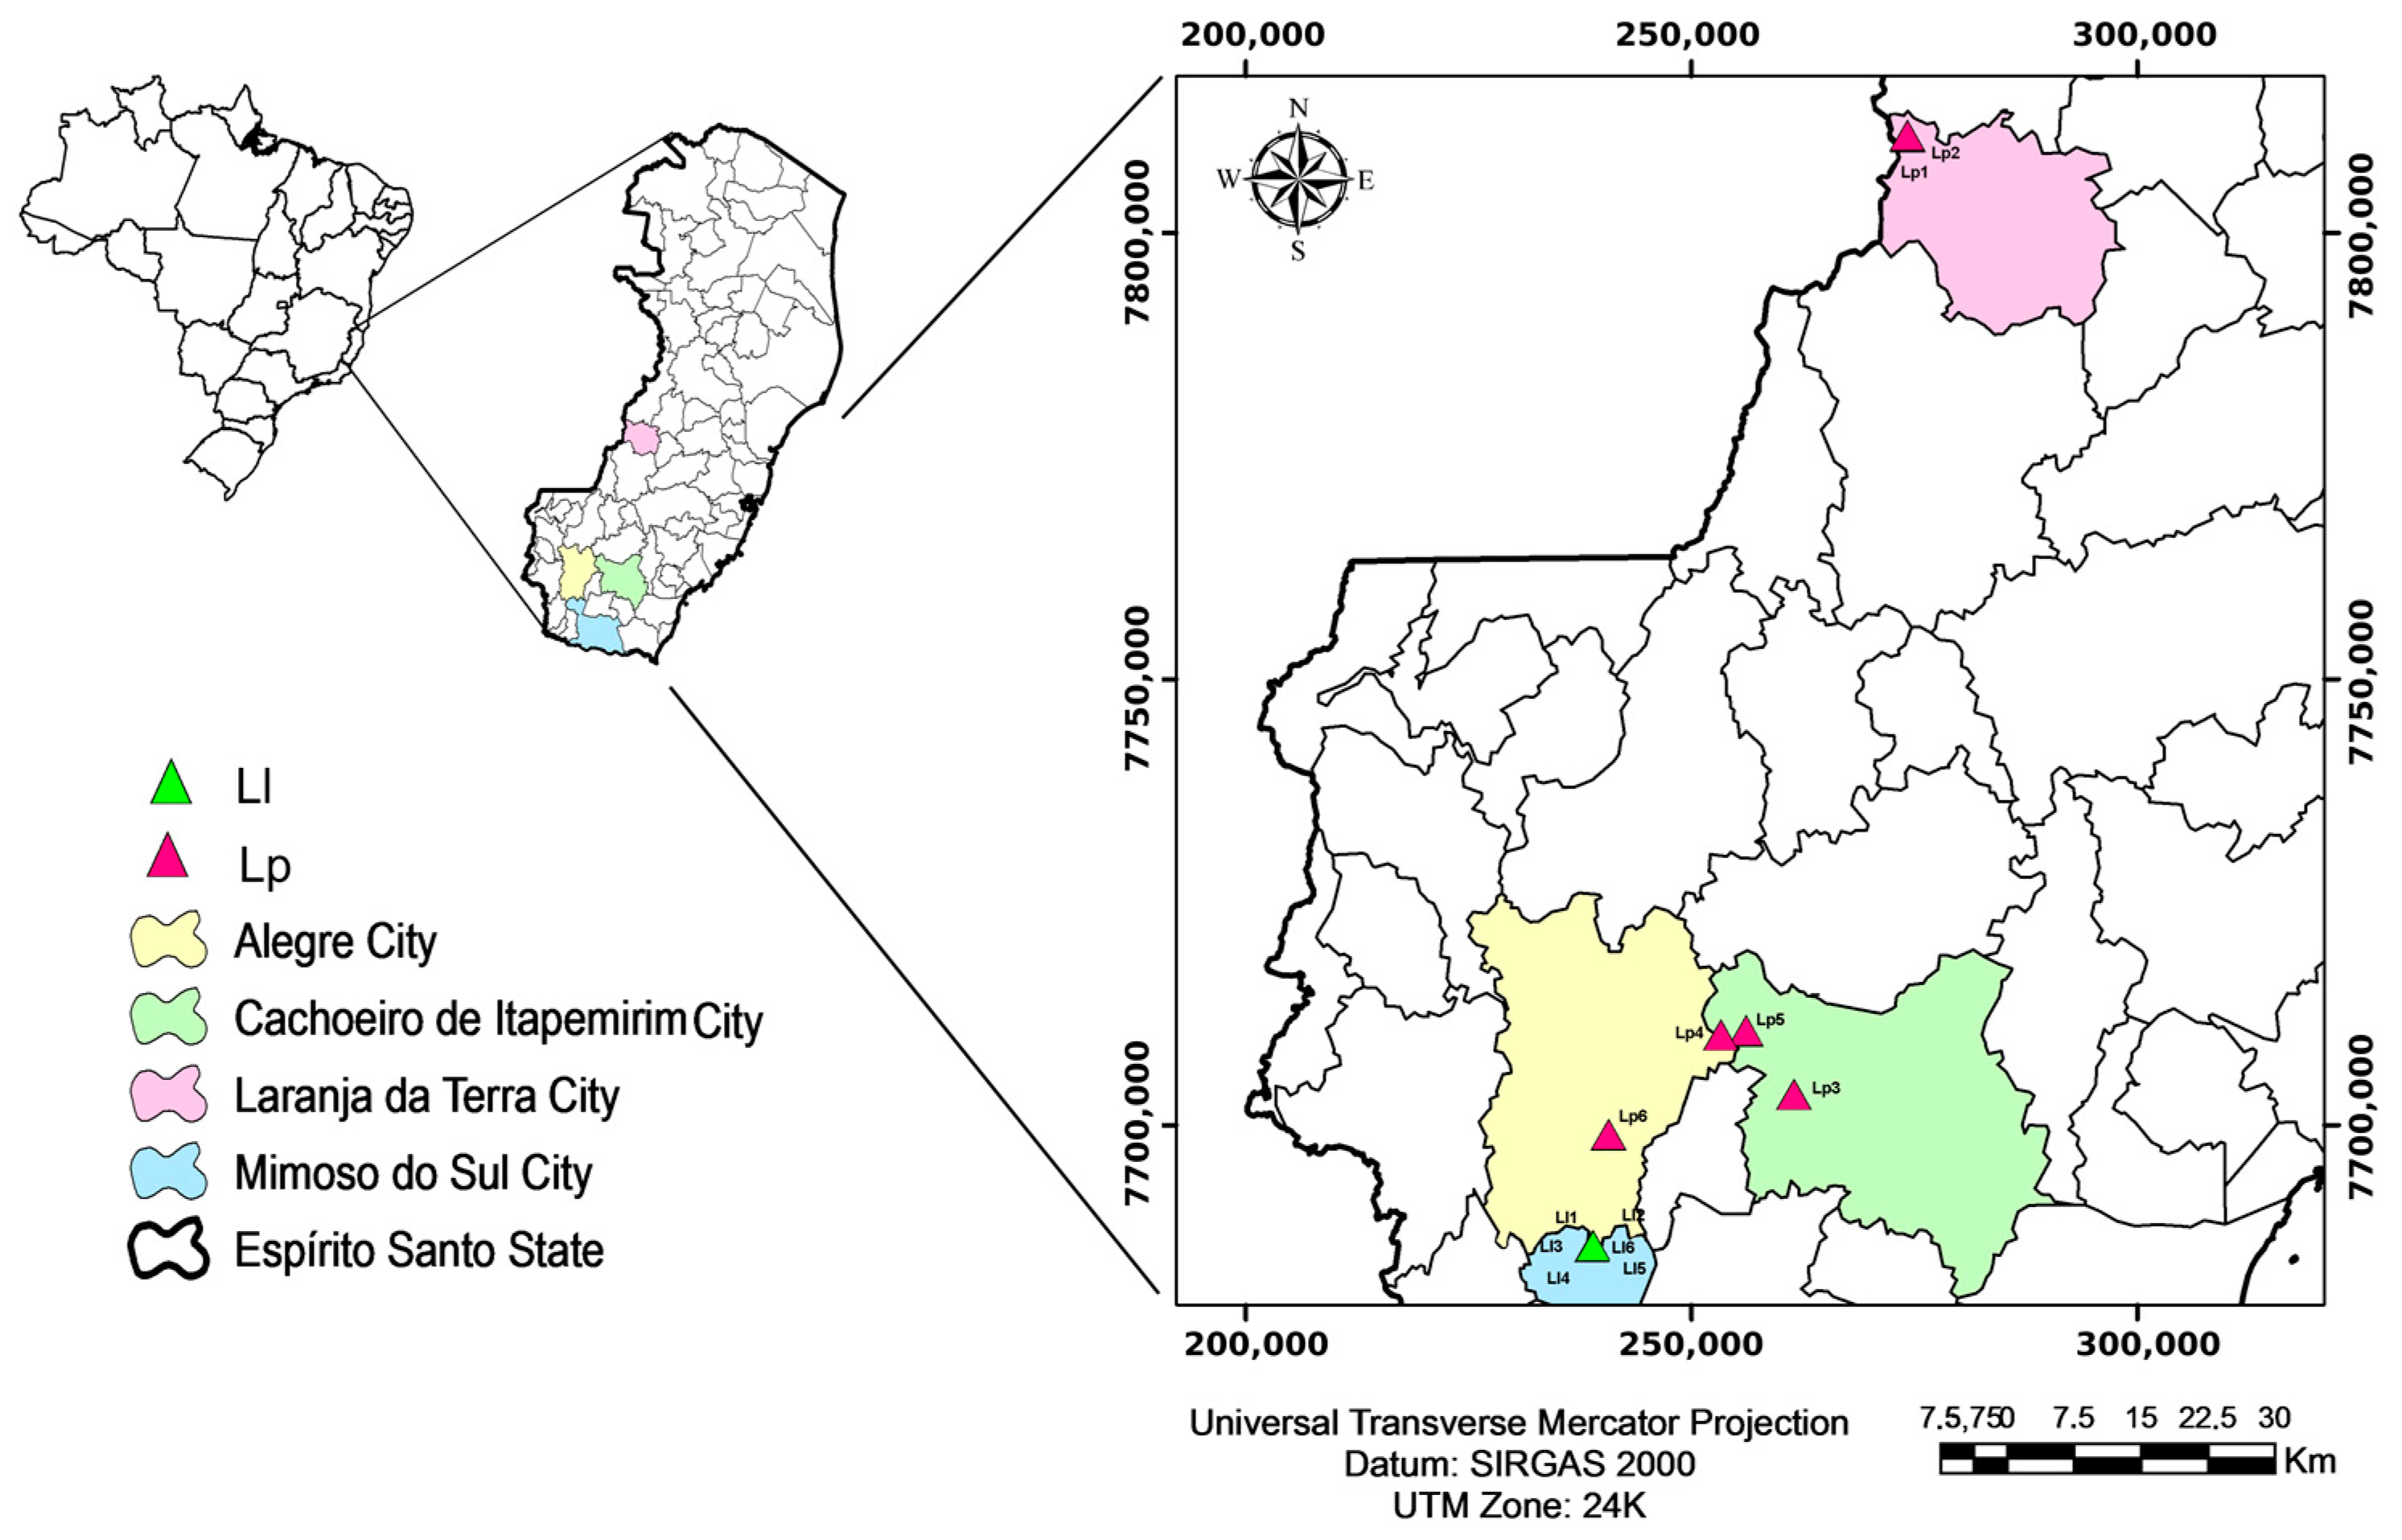
2.1. Location of L. pisonis and L. lanceolata Trees

Six trees of L. pisonis were studied, with tree 1 (19°47′5.49″ S and 41°9′16.53″ W) and tree 2 (19°47′1.045″ S and 41°9′18.411″ W) located in the Earth Orange municipality. Tree 3 (20°45′10.195″ S and 41°17′25.782″ W), tree 4 (20°41′16.82″ S and 41°20′28.616″ W), and tree 5 (20°41′29.895″ S and 41°22′6.972″ O) were located in the municipality of Cachoeiro de Itapemirim and tree 6 (20°47′27.442″ S and 41°29′27.187″ W) in the municipality of Alegre—all belonging to the state of Espírito Santo, Brazil. Six trees of L. lanceolata, located in the municipality of Mimoso do Sul, Espírito Santo, Brazil, were also studied. The geographic coordinates are: tree 1 (20°54′14.458″ S and 41°30′37.221″ W); tree 2 (20°54′11.909″ S and 41°30′36.662″ W); tree 3 (20°54′12.151″ S and 41°30′36.338″ W); tree 4 (20°54′10.938″ S and 41°30′35.767″ W); tree 5 (20°54′10.598″ S and 41°30′35.306″ W); and tree 6 (20°54′10.169″ S and 41°30′35.199″ W) (Figure 1).

2.2. Extraction of Minerals from Chestnuts and Leaves

N, P, K, Ca, Mg, S, Fe, Zn, Cu, and Mn content was measured in the chestnuts and leaves of L. pisonis and L. lanceolata [28], whereas Se was quantified only in chestnuts [29]. Briefly, 0.5 g of samples (tegument or endosperm) was digested with 10 mL nitro-perchloric solution (800 mL of nitric acid + 200 mL of perchloric acid, 4:1 ratio) in a digester block, the temperature of which was gradually increased to 200 °C. The digestion product was diluted in distilled water to 25 mL to obtain the concentrated extract. To determine P content, 0.25 mL concentrated extract was mixed with 21.25 mL distilled water, 2.5 mL solution 725 (1 g bismuth subcarbonate, 20 g ammonium molybdate, 136 mL of H2SO4 97% distilled water to a final volume of 1000 mL), and 1 mL 2% ascorbic acid. Absorbance at 725 nm was read on a spectrophotometer (Bel Photonics 2000 UV). An analytical curve (Ŷ = 0.5131x + 0.0059, R2 = 0.9999) was used to perform absorbance readings.
To determine S content, 2 mL concentrated extract was mixed with 3 mL distilled water, 2.5 mL working buffer solution, and 2.5 mL working reagent. Absorbance at 420 nm was read as above. The working buffer solution was prepared by diluting 200 mL stock buffer solution (80 g MgCl2‧7H2O, 7.7 g ammonium acetate, 1.68 g KNO3, 56 mL 95% ethyl alcohol, distilled water to 1000 mL) to a final volume of 1000 mL. The working reagent was prepared by diluting 26.6 g barium chloride and 0.266 g gum Arabic in 200 mL distilled water.
K content was determined directly from the concentrated extract using a flame photometer (Digimed® DM-61, São Paulo, Brazil). For Ca and Mg analysis, 0.25 mL concentrated extract was mixed with 22.25 mL distilled water and 2.5 mL SrCl2 (16,000 mg L−1), followed by reading on an atomic absorption spectrophotometer (Shimadzu® AA-6200 CE, Kyoto, Japan). The latter was used also to read Cu, Mn, Fe, and Zn directly from the concentrated extract, whereas Se was read in a fluorimeter.
To determine N content in fresh nuts and leaves, 0.1 g from the sample was digested in 1 mL H2SO4 (sulfuric digestion) at 300 °C for 35 min, followed by the addition of 1 mL H2O2 for the second digestion at 200 °C for 15 min. Then, 1 mL concentrated extract was diluted with 19 mL distilled water, 2.5 mL sodium tartrate (10% m v−1), and 2.5 Nessler’s reagent. Absorbance at 480 nm was read on the spectrophotometer.

2.3. Extraction of Minerals from the Soil

Three soil samples were collected from each tree location at 0–20 and 20–40 cm from the soil. The material was homogenized, dried, and sieved (10 mesh = 2 mm) before subsequent chemical analysis [30]. The pH (Gehaka® PG 2000, São Paulo, Brazil) was measured in water on 10 cm3 of air-dried fine soil stirred in 25 mL distilled water and left to rest for 1 h before reading in a pot. To determine C content in the soil, 0.5 g of crushed and sieved soil was weighed at 80-mesh (0.177 mm), mixed with K2Cr2O7 (0.2 M), and left to rest on a hot plate for 10 min. After cooling, 80 mL distilled water, 1 mL H3PO4, and 3 drops of diphenylamine indicator were added and titrated in (NH4)2Fe(SO4)2‧6H2O (0.05 M). The blank was measured by excluding the sample.
To determine exchangeable Ca, Mg, and Al, 10 cm3 soil was mixed with KCl (1 M), followed by agitation and rest for 16 h. Then, 0.5 mL extract was mixed with 10 mL SrCl2 to determine Ca and Mg content using the atomic absorption spectrophotometer. To quantify Al, 25 mL extract was mixed with 3 drops bromothymol blue indicator (1% m v−1) and titrated in NaOH (0.025 M). For the determination of H + Al, 5 cm3 soil was mixed with 75 mL calcium acetate (0.5 M, pH 7.0), followed by agitation and 16 h of rest. Subsequently, 2 drops phenolphthalein were added to 25 mL extract and titrated with NaOH as above.
For the extraction of P, Na, K, Fe, Cu, Zn, and Mn, 10 cm3 soil was mixed with 100 mL Mehlich−1 extracting solution (0.05 M HCl, 0.0125 M H2SO4), agitated, and left to rest for 16 h. Na and K were read on the flame photometer. To determine P content, 5 mL extract was mixed with 5 mL working reagent (200 mL solution 725, 1.6 g ascorbic acid, distilled water to 1000 mL), and absorbance at 725 nm was read on the spectrophotometer. Fe, Cu, Zn, and Mn were analyzed directly from the extract using the atomic absorption spectrophotometer.

2.4. Biochemical Analyses

Biochemical analyses were carried out on tegument samples crushed in a knife mill (Tecnal® Wyllie Micro-TE650, São Paulo, Brazil) using material that passed through a 60-mesh sieve, and on endosperm crushed in a blender at 18,000 rpm. Total phenolic content was determined according to the Folin–Ciocalteu method [31]. Briefly, a 0.25 g sample was mixed with 5 mL HCl (2 M) and kept in a water bath at 95 °C for 30 min, followed by cooling and filtering. Then, 50 μL filtrate (extract) and 2.5 mL Folin–Ciocalteu reagent (1:10 v v−1) were pipetted into test tubes. After 5 min, 2 mL Na2CO3 (4% m v−1) was added and the solution was incubated for 2 h in the dark. Total phenolic content was quantified in triplicate at 760 nm using a UV-VIS spectrophotometer (EDUTEC® EEQ-9023, Brazil). An analytical curve (Ŷ = 0.04193 + 0.76973x; R = 0.99) was prepared with gallic acid (0.1–1 mg mL−1) and the content was expressed in an mg gallic acid equivalents 100 g−1 sample.
For the analysis of anthocyanins and flavonols, a 0.150 g sample was mixed with 4 mL extracting solution (96% ethanol in 1.5 M HCl, 85:15). The samples were homogenized, left to rest for 24 h in the dark, and filtered before analysis in the UV-VIS spectrophotometer at 535 nm (anthocyanin) and 374 nm (flavonols). Anthocyanin content was determined according to Equation (1), where A = anthocyanin, abs = absorbance, V = volume of the extracting solution (in mL), L = optical path (1 cm), and m = mass of the sample (in g) [32].
A m g   100   g 1 = a b s V 105 982 L m ,
whereas flavonoid (FL) content was determined using the Equation (2):
F L m g   100   g 1 = ( a b s V 105 ) 766 L m .
To determine condensed tannin (CT) content, 1 g of sample was mixed with 30 mL extracting solution (methanol:water 8:2), kept in the dark for 24 h, filtered, and placed in a water bath at 40 °C for 60 min to evaporate the methanol. A 1 mL aliquot was removed from the crude extract and diluted in distilled water to a final volume of 25 mL. Triplicates of the extract (2 mL) were diluted with 4 mL vanillin solution (10 g L−1) in 70% H2SO4 (v v−1) and placed in a water bath at 50 °C for 15 min. Absorbance at 500 nm was read using the UV-VIS spectrophotometer and condensed tannin content was expressed by Equation (3). A calibration curve was prepared with catechin (2, 5, 10, 15, 20, 25, and 30 μg mL−1) as indicated by [33].
C T m g   g 1 = ( a b s   +   0.06917 0.01346 ) 25 m .
The antioxidant capacity of the tegument and endosperm of chestnuts was analyzed using the 2,2-diphenyl-1-picrylhydrazyl (DPPH) free radical capture method [34]. An initial ethanolic extract was prepared by diluting a 0.187 g sample to a final volume of 10 mL, homogenizing for 10 min, filtering, and using 1 mL of the filtrate for a second 1:10 dilution.
A control solution consisted of a blank (3 mL ethanol) and three replicates (1 mL ethanol + 2 mL 150 μM DPPH). Tegument and endosperm samples, from each tree of the species L. pisonis and L. lanceolata, consisted of a blank (1 mL filtrate + 2 mL ethanol) and three replicates (1 mL filtrate + 2 mL 150 μM DPPH). The tubes were stored in the dark for 1 h and read at 515 nm on the UV-VIS spectrophotometer. Sequestration of the DPPH free radical (%) was obtained by Equation (4):
D P P H ( % ) = ( a b s C o n t r o l a b s S a m p l e ) a b s C o n t r o l 100 .

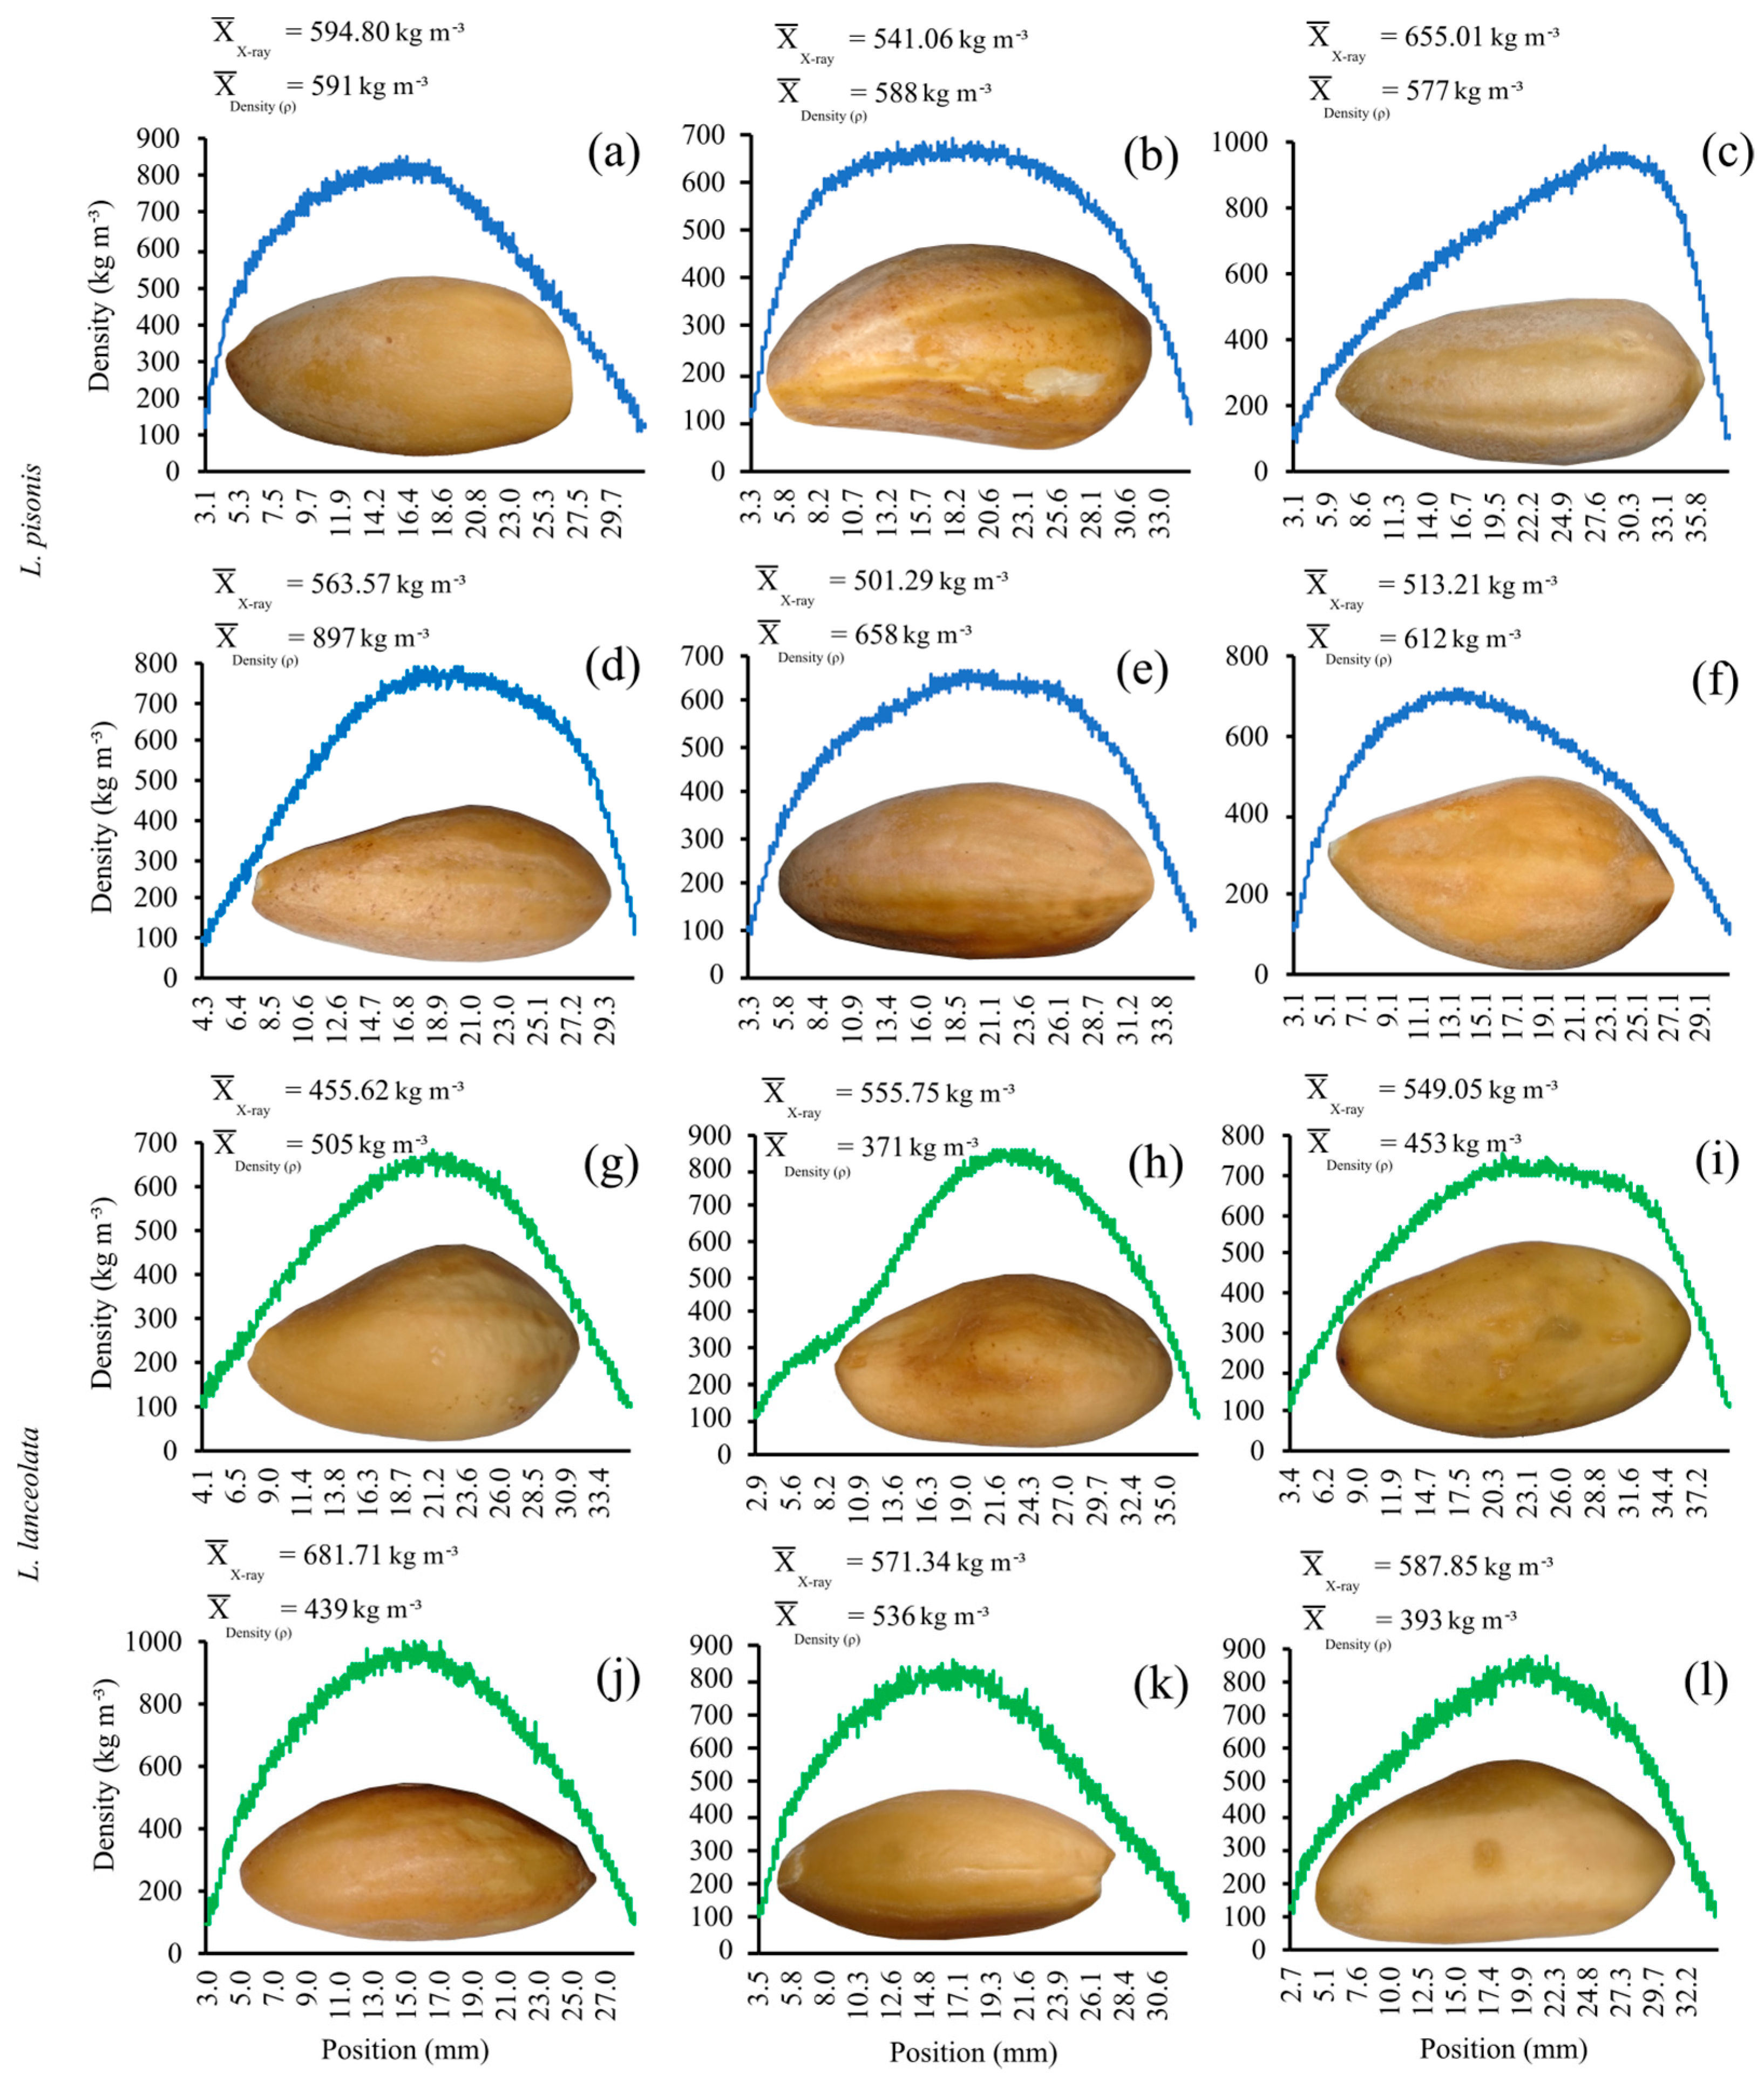
2.5. X-ray Densitometry

X-ray densitometry is a non-destructive analysis, which aims to evaluate the internal morphology of seeds by investigating their density. Based on a previous study [35], the seeds were placed between two wooden samples measuring 5 × 5 × 0.5 cm, in sample holders with a capacity for six samples, in the internal compartment of the X-ray microdensitometer (GreCon®, DAX 6000, Alfeld, Germany). Density values were determined every 20 μm. The X-ray densitometer used has a voltage of 33 kV, current between 0 and 1 mA, a radiation angle of 11°, and initial and final collimation of beams of 100 and 50 μm, respectively. In the end, the average density was determined.

2.6. Extraction of the Oil

To extract the oil from each three tree of L. pisonis and L. lanceolata, four replications were used, consisting of two nuts each. The extraction was carried out cold, using a hydraulic press (Bovenau, SH, Germany). Oil Brix (%) was evaluated using a portable digital refractometer (Megabrix®, REDI-P, Brazil), with the initial (INM, g) and final (FNM, g) nuts mass on an analytical scale of 0.0001 g precision, aiming to obtain the oil mass extracted (OM, g) and the oil yield (OY, %) by Equation (5):
O Y % = O M I N M 100 .

2.7. Transesterification Reaction

Fatty acid methyl esters (FAME) were prepared according to the International Olive Council [36]. Briefly, 0.1 g of oil was dissolved in 2 mL of hexane, to which a methanolic potassium hydroxide (0.2 mL, 2 M) was added. The mixture was shaken for 30 min. After this time, it was rested for 10 min and the organic phase was collected in a 2 mL vial for chromatographic analysis.

2.8. FAME Analysis

An Agilent 7820A gas chromatograph (GC) (Palo Alto, CA, USA) equipped with a G4513A autosampler and coupled with an Agilent 5975 network quadrupole mass spectrometer (MS) was used. Helium (99.9992% purity) carrier gas was used at 1.5 mL min−1 in constant flow mode. The injection used a split mode split (ratio of 1:20) at 220 °C and a 1.0 μL injection volume. A DB-Wax capillary column (polyethylene glycol (PEG) stationary phase of 30 m length, 0.25 mm i.d., and a film thickness of 0.25 μm, J&W Scientific, Agilent Technologies (Palo Alto, CA, USA) was employed with an oven program from 50 °C (hold 1 min) to 150 °C at 10 °C min−1, then from 150 to 240 °C (at 3 °C min−1), then held at 240 °C for 5 min. The MS detector and transfer line (17.2 cm) was held at 250 °C, the ion source at 230 °C, the quadrupole at 150 °C, and an ionization voltage of 70 eV was used. Mass spectra were obtained in scan mode (50−550 Da). Chromatographic data were recorded using the Agilent MassHunter Qualitative analysis B.07.00 software. The identities of the FAME composition were characterized by comparison with the NIST/EPA/NIH Mass Spectral Library databases (2.2 version, 2014) [37].

2.9. Statistical Analysis

This study followed a completely randomized design, and the means were analyzed using the Scott–Knott cluster test (p ≤ 0.05). Box plots and correlation analyses were applied to characterize the minerals and antioxidants in nuts. Differences between pairs of characters were assessed with the t-test at 0.1%, 1%, and 5% significance. For multivariate analyses, data were first standardized to prevent the influence of magnitude between the different variables. Subsequently, principal component analysis (PCA) was performed on the nutrients in leaves, chestnuts, and soils, generating biplots. A Tukey test was performed (p < 0.005) for the characteristics of nuts and oil mass, Brix, and oil yield.

3. Results

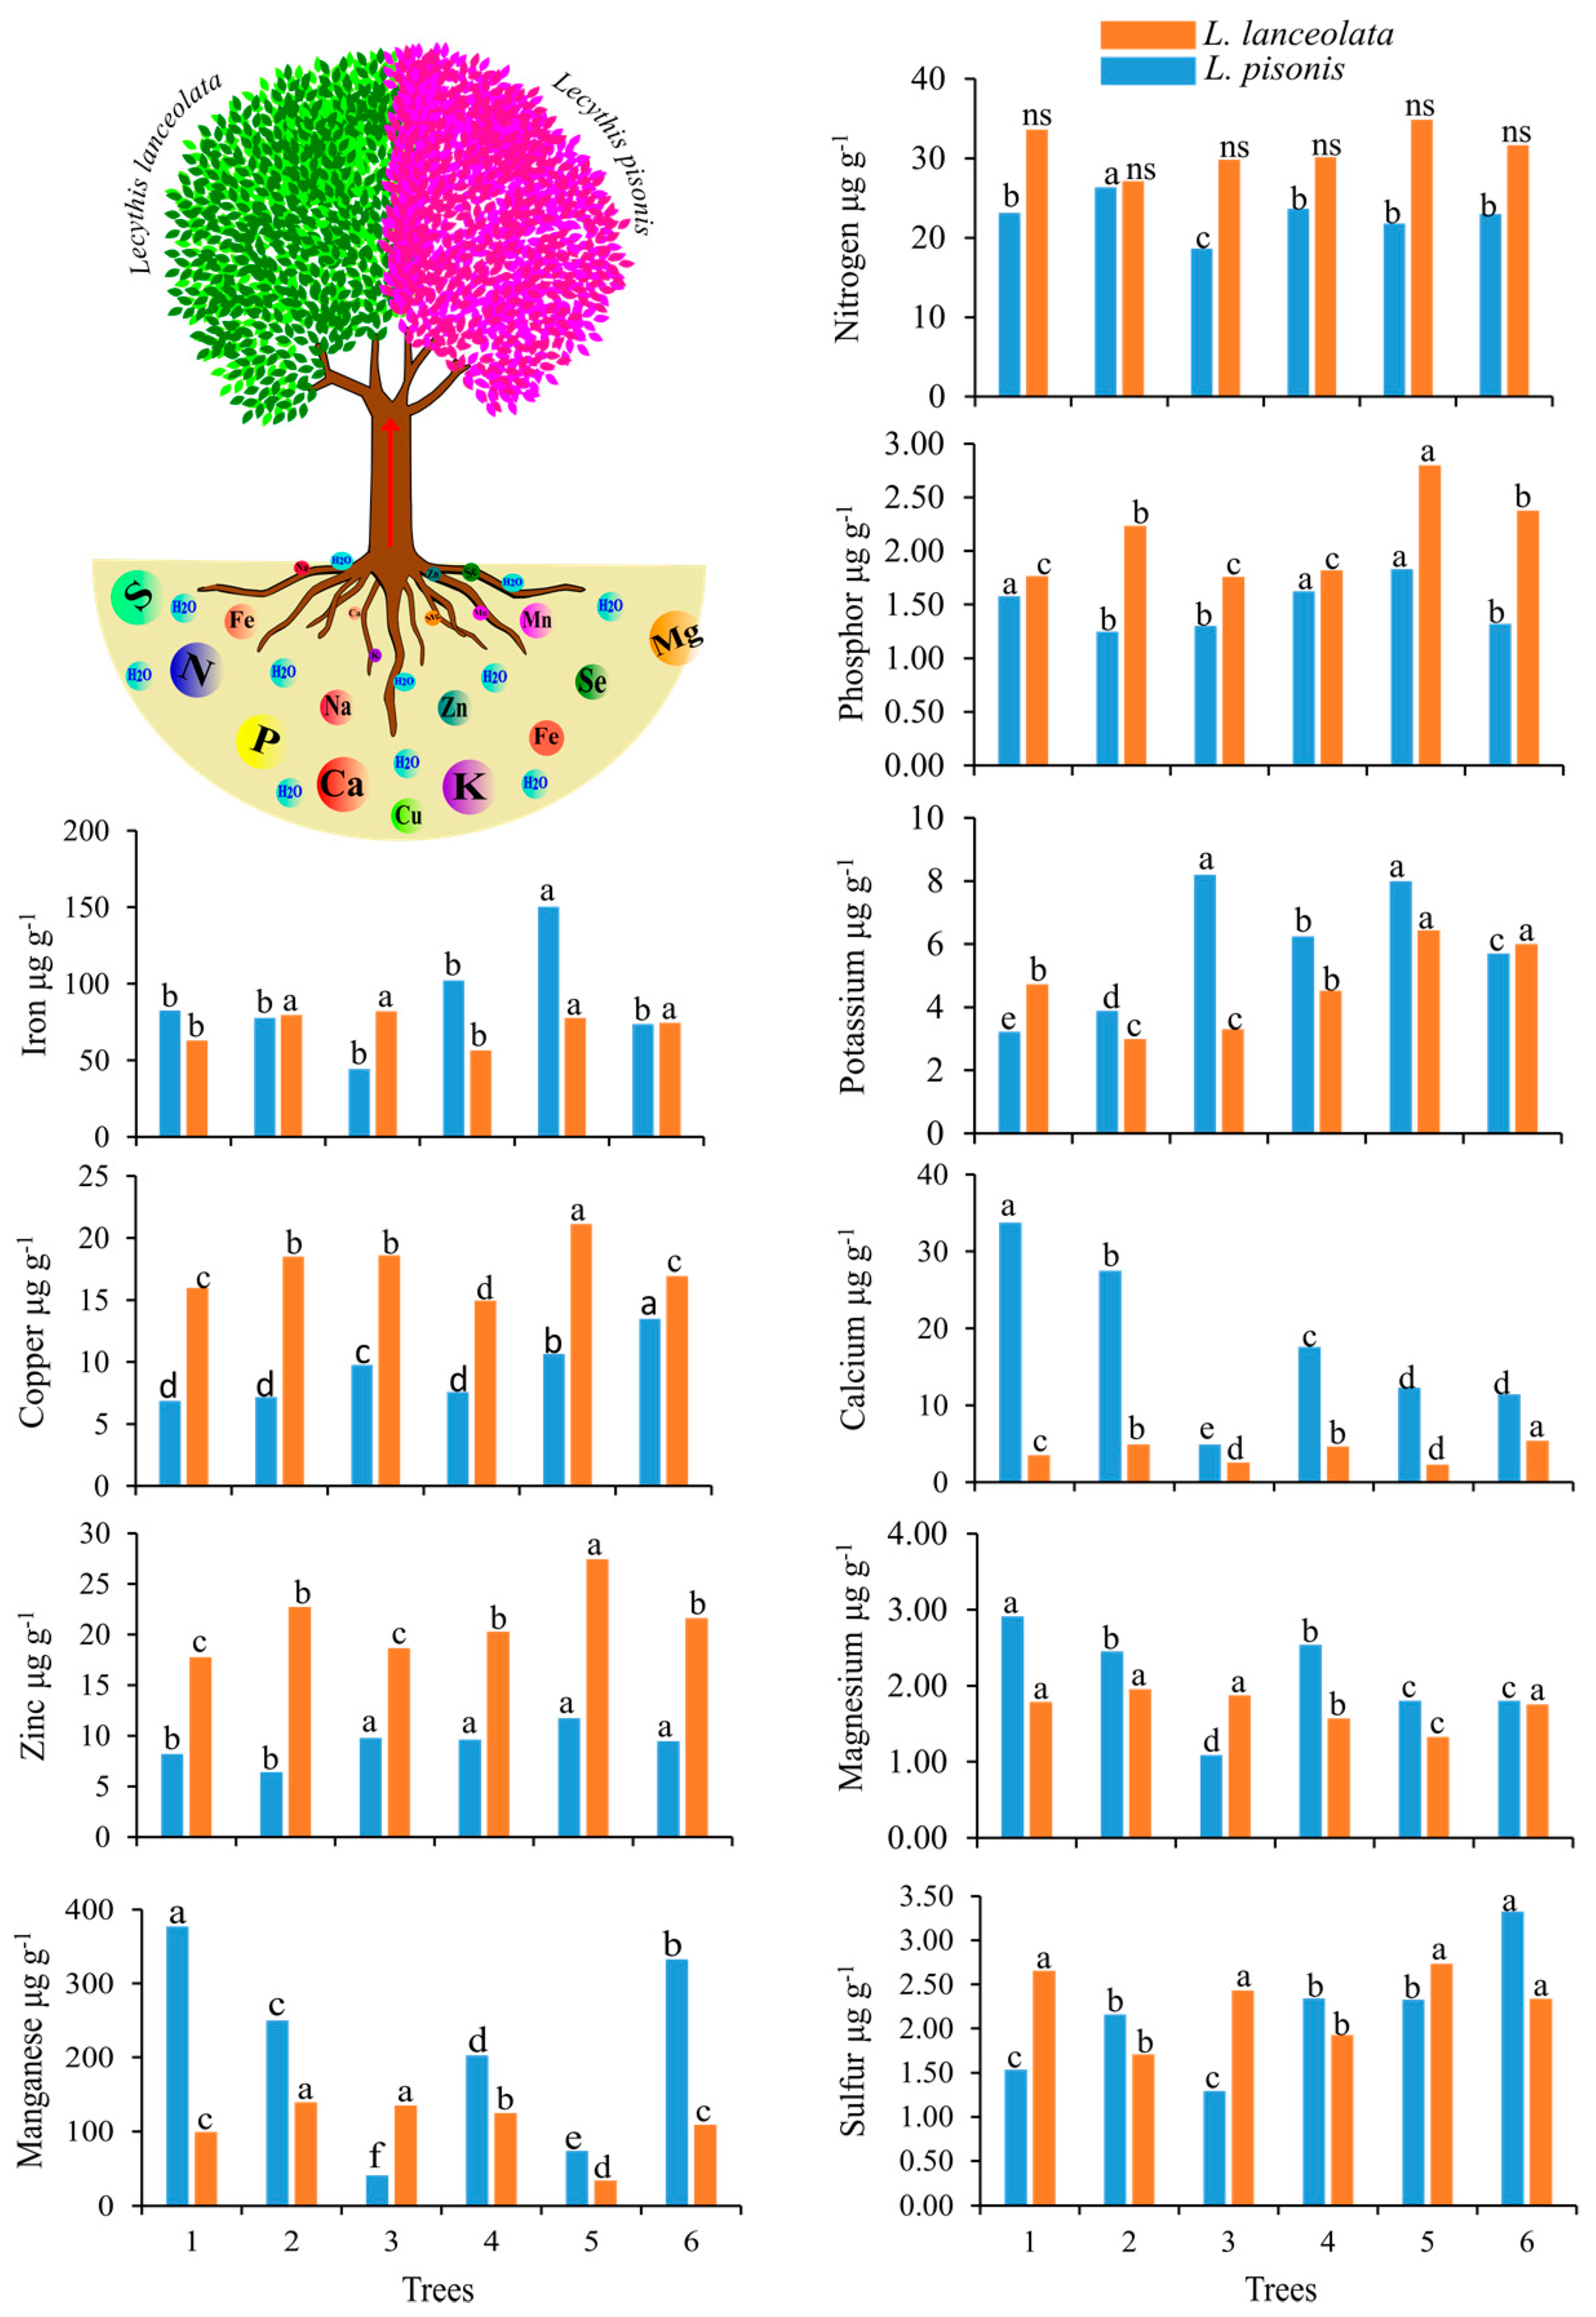
3.1. Extraction of Minerals from Leaves, Soil and Nuts
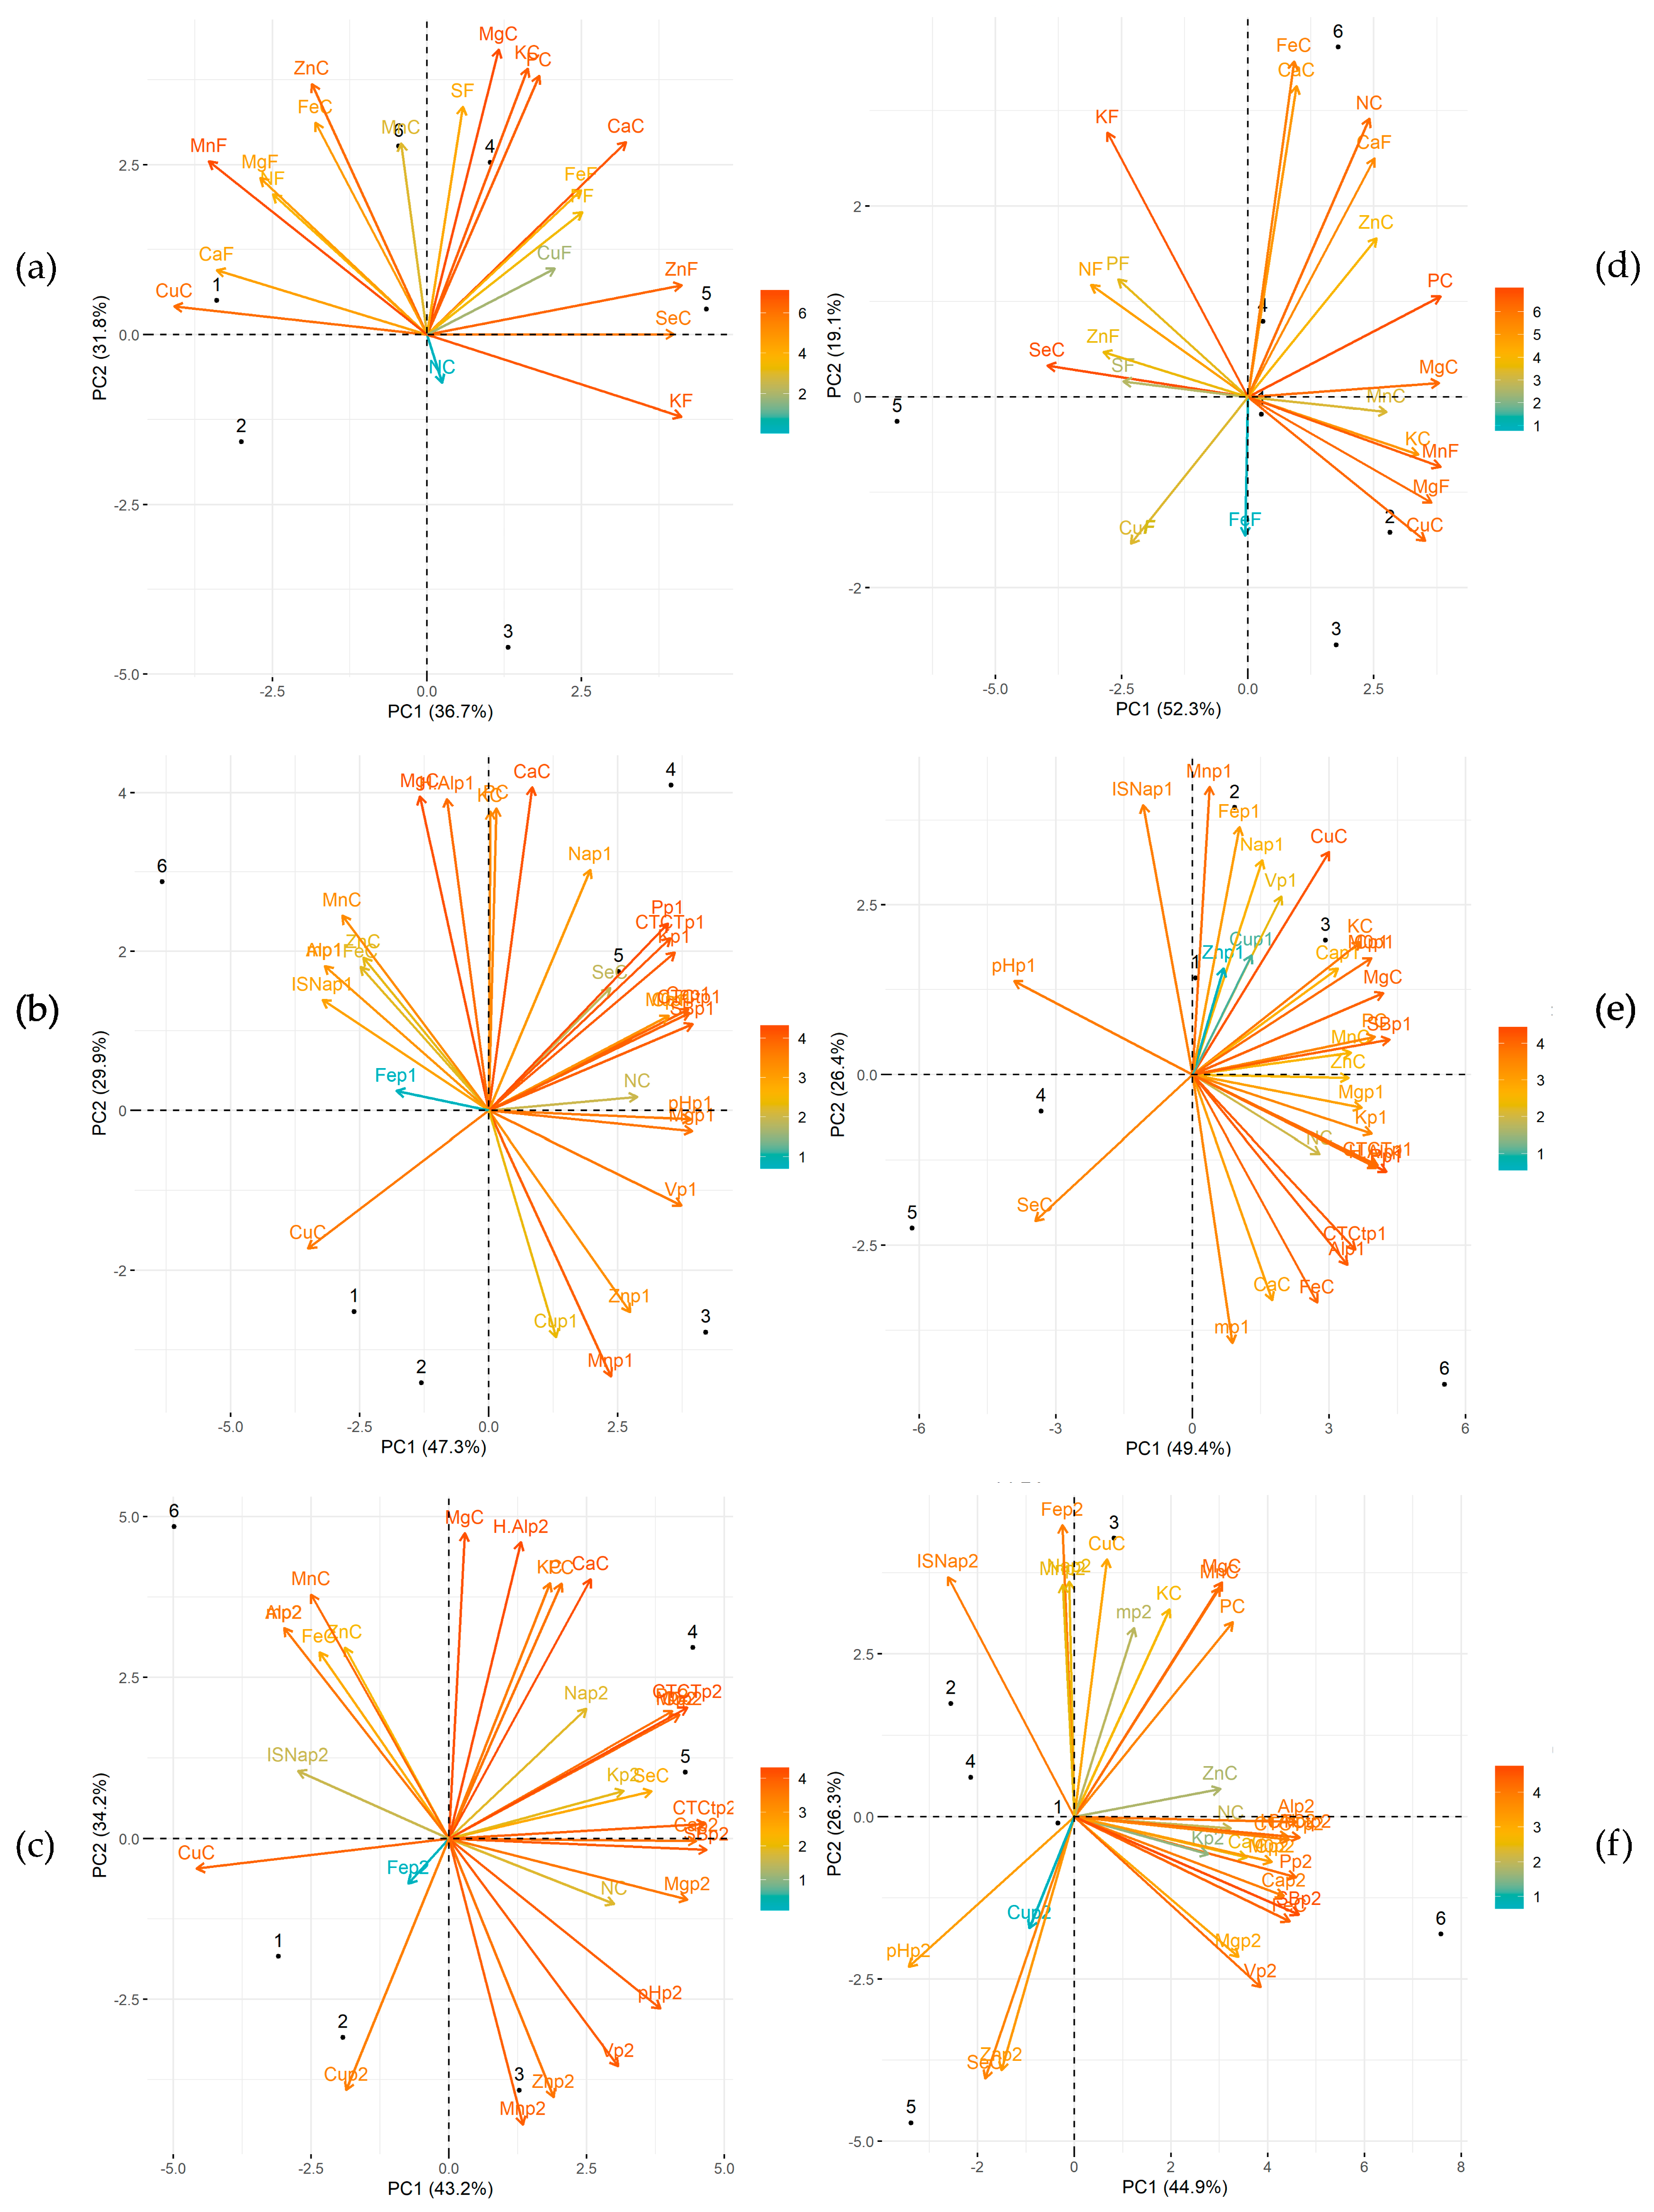
After the absorption of nutrients from the soil, they are transported to the leaves, seeds, and fruits, contributing to the production of nuts rich in macronutrients, micronutrients, and antioxidant compounds. The trees of L. pisonis and L. lanceolata, located in different regions, showed varying concentrations of nutrients in their leaves. Among the L. pisonis trees, L. pisonis tree 1 stood out for presenting higher values for the minerals P (1.58 µg g−1), Ca (33.75 µg g−1), Mg (2.91 µg g−1), and Mn (377.28 µg g−1), followed L. pisonis tree 5 for K (7.99 µg g−1), Fe (150.46 µg g−1), and Zn (11.77 µg g−1), and L. pisonis tree 6 for S (3.33 µg g−1), Cu (13.48 µg g−1) and Zn (9.48 µg g−1). In L. lanceolata, the highest values were observed in L. lanceolata tree 5 for P (2.80 µg g−1), K (6.43 µg g−1), Cu (21.14 µg g−1), Zn (27.44 µg g−1), and Fe (77.64 µg g−1), and L. lanceolata trees 2 and 3 for Mg (1.96 and 1.88 µg g−1, respectively), Fe (79.66 and 82.11 µg g−1, respectively), and Mn (139.33 and 134.96 µg g−1, respectively) (Figure 2). All information is also presented numerically in Supplementary Table S1.
The soil of the L. pisonis trees yielded the following values at 0–20 cm: P (1.01–33.96 mg dm−3), K (48–130 mg dm−3), Ca (0.29–7.89 cmolc dm−3), Mg (0.32–1.80 cmolc dm−3), Fe (13.12–133.21 mg dm−3), Zn (0.33–8.80 mg dm−3), Mn (6.41–81.87 mg dm−3), Cu (0.14–2.25 mg dm−3), and Mo (6.27–29.03 g kg−1). Again, similar values were found also at 20–40 cm: P (0.78–33.38 mg dm−3), K (23–209 mg dm−3), Ca (0.13–6.28 cmolc dm−3), Mg (0.22–1.61 cmolc dm−3), Fe (13.36–147.74 mg dm−3), Zn (0.20–5.42 mg dm−3), Mn (6.45–77.02 mg dm−3), Cu (0.15–1.55 mg dm−3), and Mo (3.43–25.19 g kg−1) (Supplementary Figure S1).
The variation of nutrients present in the soil at depths 0–20 cm and 20–40 cm was similar for the trees of both species. The soil of L. lanceolata trees at a depth of 0–20 cm yielded the following values: P (0.74–1.80 mg dm−3), K (11–23 mg dm−3), Ca (0.04–0.10 cmolc dm−3), Mg (0.06–0.11 cmolc dm−3), Fe (78.89–141.98 mg dm−3), Zn (0.14–0.51 mg dm−3), Mn (2.62–5.19 mg dm−3), Cu (0.01–0.14 mg dm−3), and Mo (22.35–33.64 g kg−1). Similar values were found at a depth of 20–40 cm: P (0.86–1.96 mg dm−3), K (10–22 mg dm−3), Ca (0.02–0.13 cmolc dm−3), Mg (0.06–0.12 cmolc dm−3), Fe (66.08–120.34 mg dm−3), Zn (0.10–1.52 mg dm−3), Mn (2.27–5.70 mg dm−3), Cu (0.10–0.38 mg dm−3), and Mo (23.23–30.69 g kg−1) (Supplementary Figure S2).
For L. pisonis, the highest concentrations of minerals were observed in nuts from L. pisonis tree 4 (N > P > K > Mg > Ca > Zn > Fe) and L. pisonis tree 6 (P > Ca > Mg > Mn > Zn > Cu > Fe). L. pisonis tree 5 obtained the highest concentration of the antioxidant Se and the minerals P > Mg > Ca. For L. lanceolata, the highest mineral concentrations were observed in L. lanceolata tree 6 (N > P > Ca > Mg > Zn > Fe > Cu) and L. lanceolata tree 2 (P > K > Mg > Zn > Cu). L. lanceolata tree 5 obtained the highest values of the antioxidant Se and the mineral Mg (Supplementary Figure S3).

3.2. PCA Analysis

In L. pisonis, the PCA of the minerals present in nuts and leaves revealed that the first two components (PC1 + PC2) could explain 68.5% of the total variation. The greatest contribution was from MgC, MnF, CaC, KF, KC, PC, ZnF, ZnC, CuC, and SeC, where “C” denotes chestnuts and “F” leaves. L. pisonis trees 4 and 6 are associated closely with most minerals; whereas L. pisonis tree 5 was close to Se, which shows a strong association with Zn and K in the leaf (Figure 3a). The PCA analysis of the minerals present in chestnuts and soil at depth p1 (0–20 cm) in L. pisonis revealed that the first two components explained 77.2% of the total variation. The variables that contributed most to Pp1 were MgC, CaC, CTCTp1, Kp1, SBp1, Mnp1, Cap1, H + Alp1, Mgp1, Vp1, pHp1, CuC, PC, KC, MnC, and Znp1. Most chemical characteristics of the soil are associated closely with L. pisonis tree 5, while Se is strongly associated with CTCTp1, Pp1, and Kp1 (Figure 3b).
The PCA of the minerals present in chestnuts and soil at depth p2 (20–40 cm) in L. pisonis revealed that 77.4% of the total variation could be explained by the first two components. The variables that contributed most were H + Alp2, CTCTp2, CaC, MgC, Vp2, SBp2, pHp2, Mnp2, CuC, Cp2, Mop2, MnC, Pp2, Cap2, PC, Znp2, Mgp2, Alp2, mp2, KC, and Cup2. Most of them are localized to the upper right side of the PCA plot, which is close to L. pisonis trees 4 and 5. SeC displayed a high positive association with Kp2, CTCtp2, Cap2, and SBp2 (Figure 3c).
In L. lanceolata, the first two PCA components explained 71.4% of the total variation, with the strongest contribution coming from SeC, PC, KF, MnF, CuC, MgF, MgC, NC, FeC, CaF, KC, and CaC. Most nutrients present in the leaves and nuts are associated closely with L. lanceolata trees 1, 2, and 4. There was also a strong association between Se in the chestnut, and Zn and S in the leaves (Figure 3d). In L. lanceolata, the first two components explained 75.8% of total variation, with the major contributions coming from Pp1, CuC, Alp1, SBp1, MgC, FeC, Cp1, Mop1, CTCTp1, H + Alp1, Mnp1, KC, pHp1, ISNap1, SeC, PC, mp1, and Kp1. Most variables were located on the right side of the PCA plot, close to L. lanceolata trees 1–3; these were negatively associated with SeC, which instead was closer to L. lanceolata trees 1 and 4 (Figure 3e).
In L. lanceolata, the first two components explained 71.2% of total variation, with the main contribution coming from SBp2, FeC, MgC, Pp2, CTCtp2, Vp2, MnC, Alp2, ISNap2, Cap2, Fep2, CTCTp2, PC, SeC, H + Alp2, Znp2, Cp2, Mop2, and pHp2. Most soil variables were close to L. lanceolata tree 6 and had a negative association with ISNap2. SeC was close to L. lanceolata tree 5 and positively associated with Znp2, Cup2, and pHp2 in the soil (Figure 3f). The high values of the first two components with respect to total variation (Figure 3) strongly support the observed behavior of the trees toward the analyzed variables.

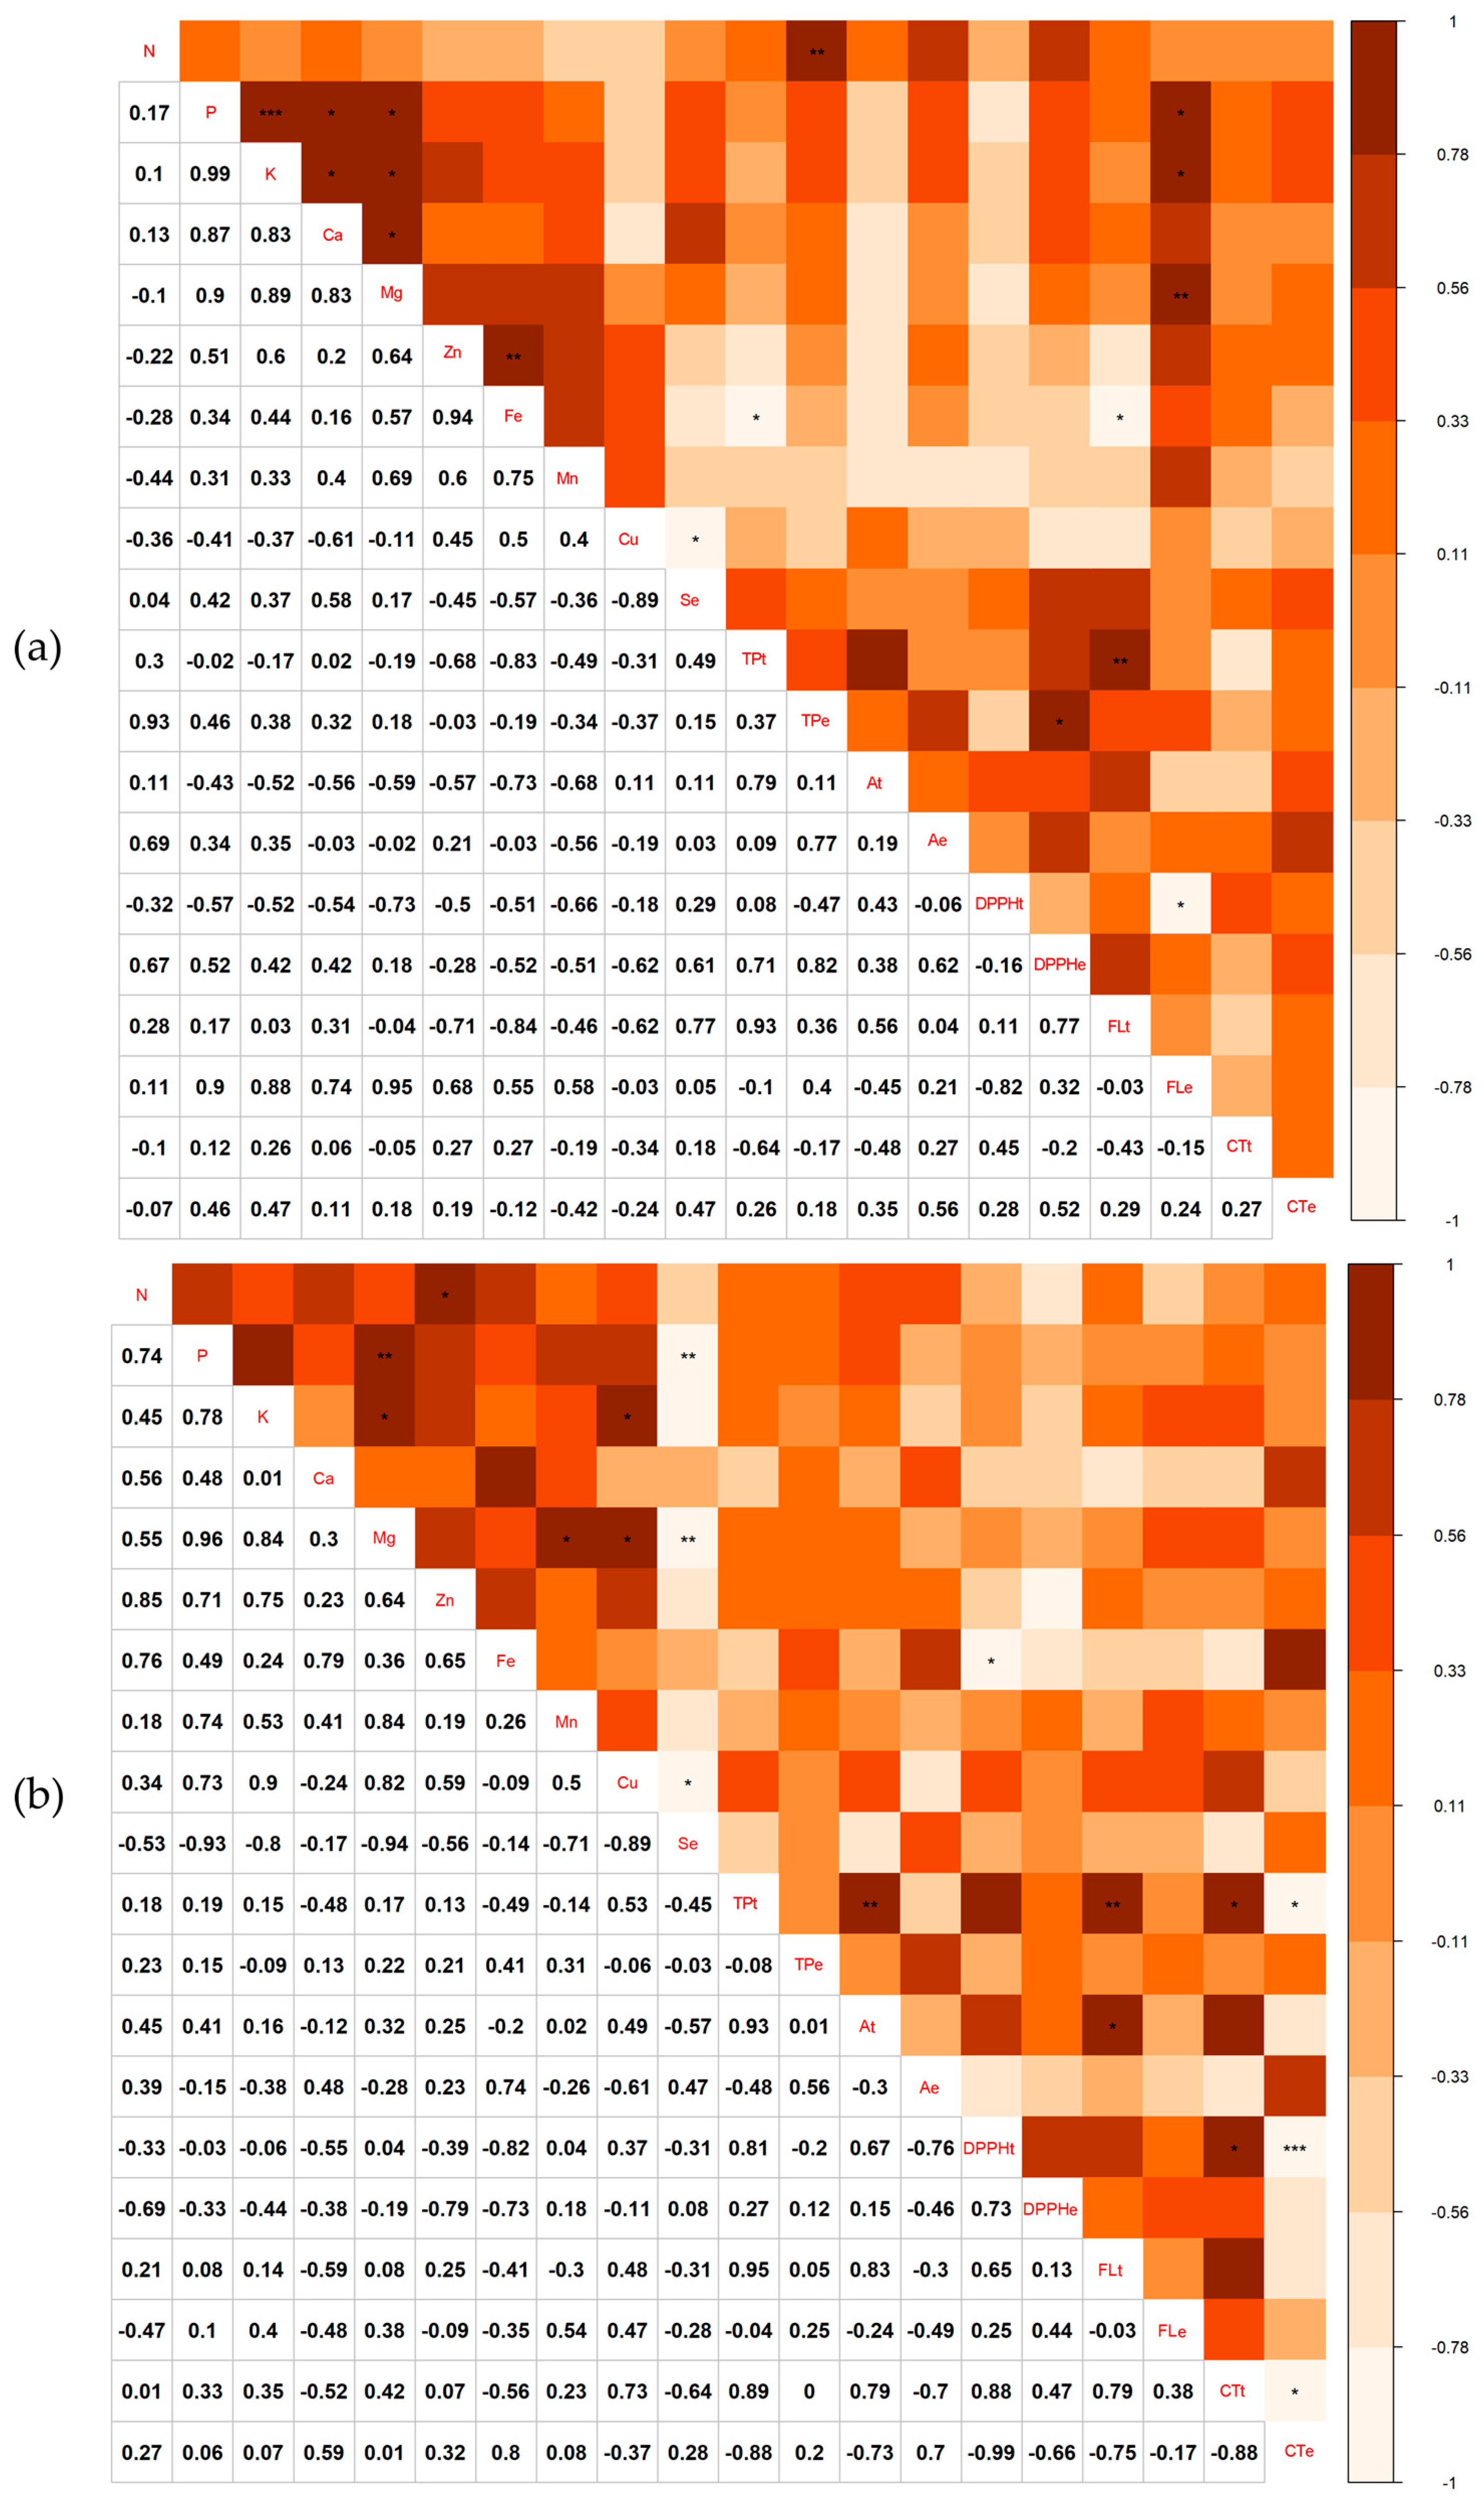
3.3. Minerals and Antioxidants in Chestnuts

In L. pisonis, tree 4 obtained the highest accumulation of antioxidants in nuts, reaching high values for the characteristics of anthocyanin, DPPH, total phenolics, and flavonoids, its tegument being rich in tannin. L. pisonis tree 5 obtained the tegument with the highest DPPH, flavonoids, and tannin. In L. lanceolata, tree 1 obtained the highest accumulation of anthocyanin, DPPH, and total phenolics in its nuts. L. lanceolata tree 3 had the highest DPPH and flavonoids and L. lanceolata tree 6 had the highest accumulation of anthocyanins, total phenolics, and tannin. In both species, DPPH was lower in the endosperm than in the tegument (Supplementary Figure S4).
In L. pisonis, the DPPH of the endosperm (DPPHe) of chestnuts correlated positively with total phenolics of the endosperm (TPe) (r = 0.82). High positive correlations (r ≥ 0.87) were observed also between P and K (r = 0.99), Ca (r = 0.87), Mg (r = 0.90), and flavonols in the endosperm (FLe) (r = 0.90); between K and Ca (r = 0.83), Mg (r = 0.89), and FLe (r = 0.88); between Mg and Ca (r = 0.83) and FLe (r = 0.95); between Zn and Fe (r = 0.94); between total tegument phenolics (TPt) and tegument flavonols (FLt) (r = 0.93); between N and total phenolics in the endosperm (r = 0.93); and between Se and Cu (r = −0.89) (Figure 4a). In L. lanceolata, total tegument phenolics exhibited a high positive correlation with anthocyanins in the tegument (At) (r = 0.93), FLt (r = 0.95), and condensed tegument tannins (CTt) (r = 0.89); while DPPH of the tegument (DPPHt) correlated positively with CTt (r = 0.88). Other positive correlations included N with Zn (r = 0.85); Mg with P (r = 0.96), K (r = 0.84), Cu (r = 0.82), and Mn (r = 0.84); K with Cu (r = 0.90) and FLt (r = 0.83); and Se with P (r = −0.93), Mg (r = −0.94), and Cu (r = −0.89) (Figure 4b).

3.4. X-ray Densitometry in Chestnuts

The X-ray densitometry method used was efficient in the density analysis of Lecythis nuts (Figure 5), and different nut formats could also be observed. Density ranged from 501.29 to 655.01 kg m−3 in the L. pisonis trees (Figure 5a–f), and from 455.62 to 681.71 kg m−3 in the L. lanceolata trees (Figure 5g–l).

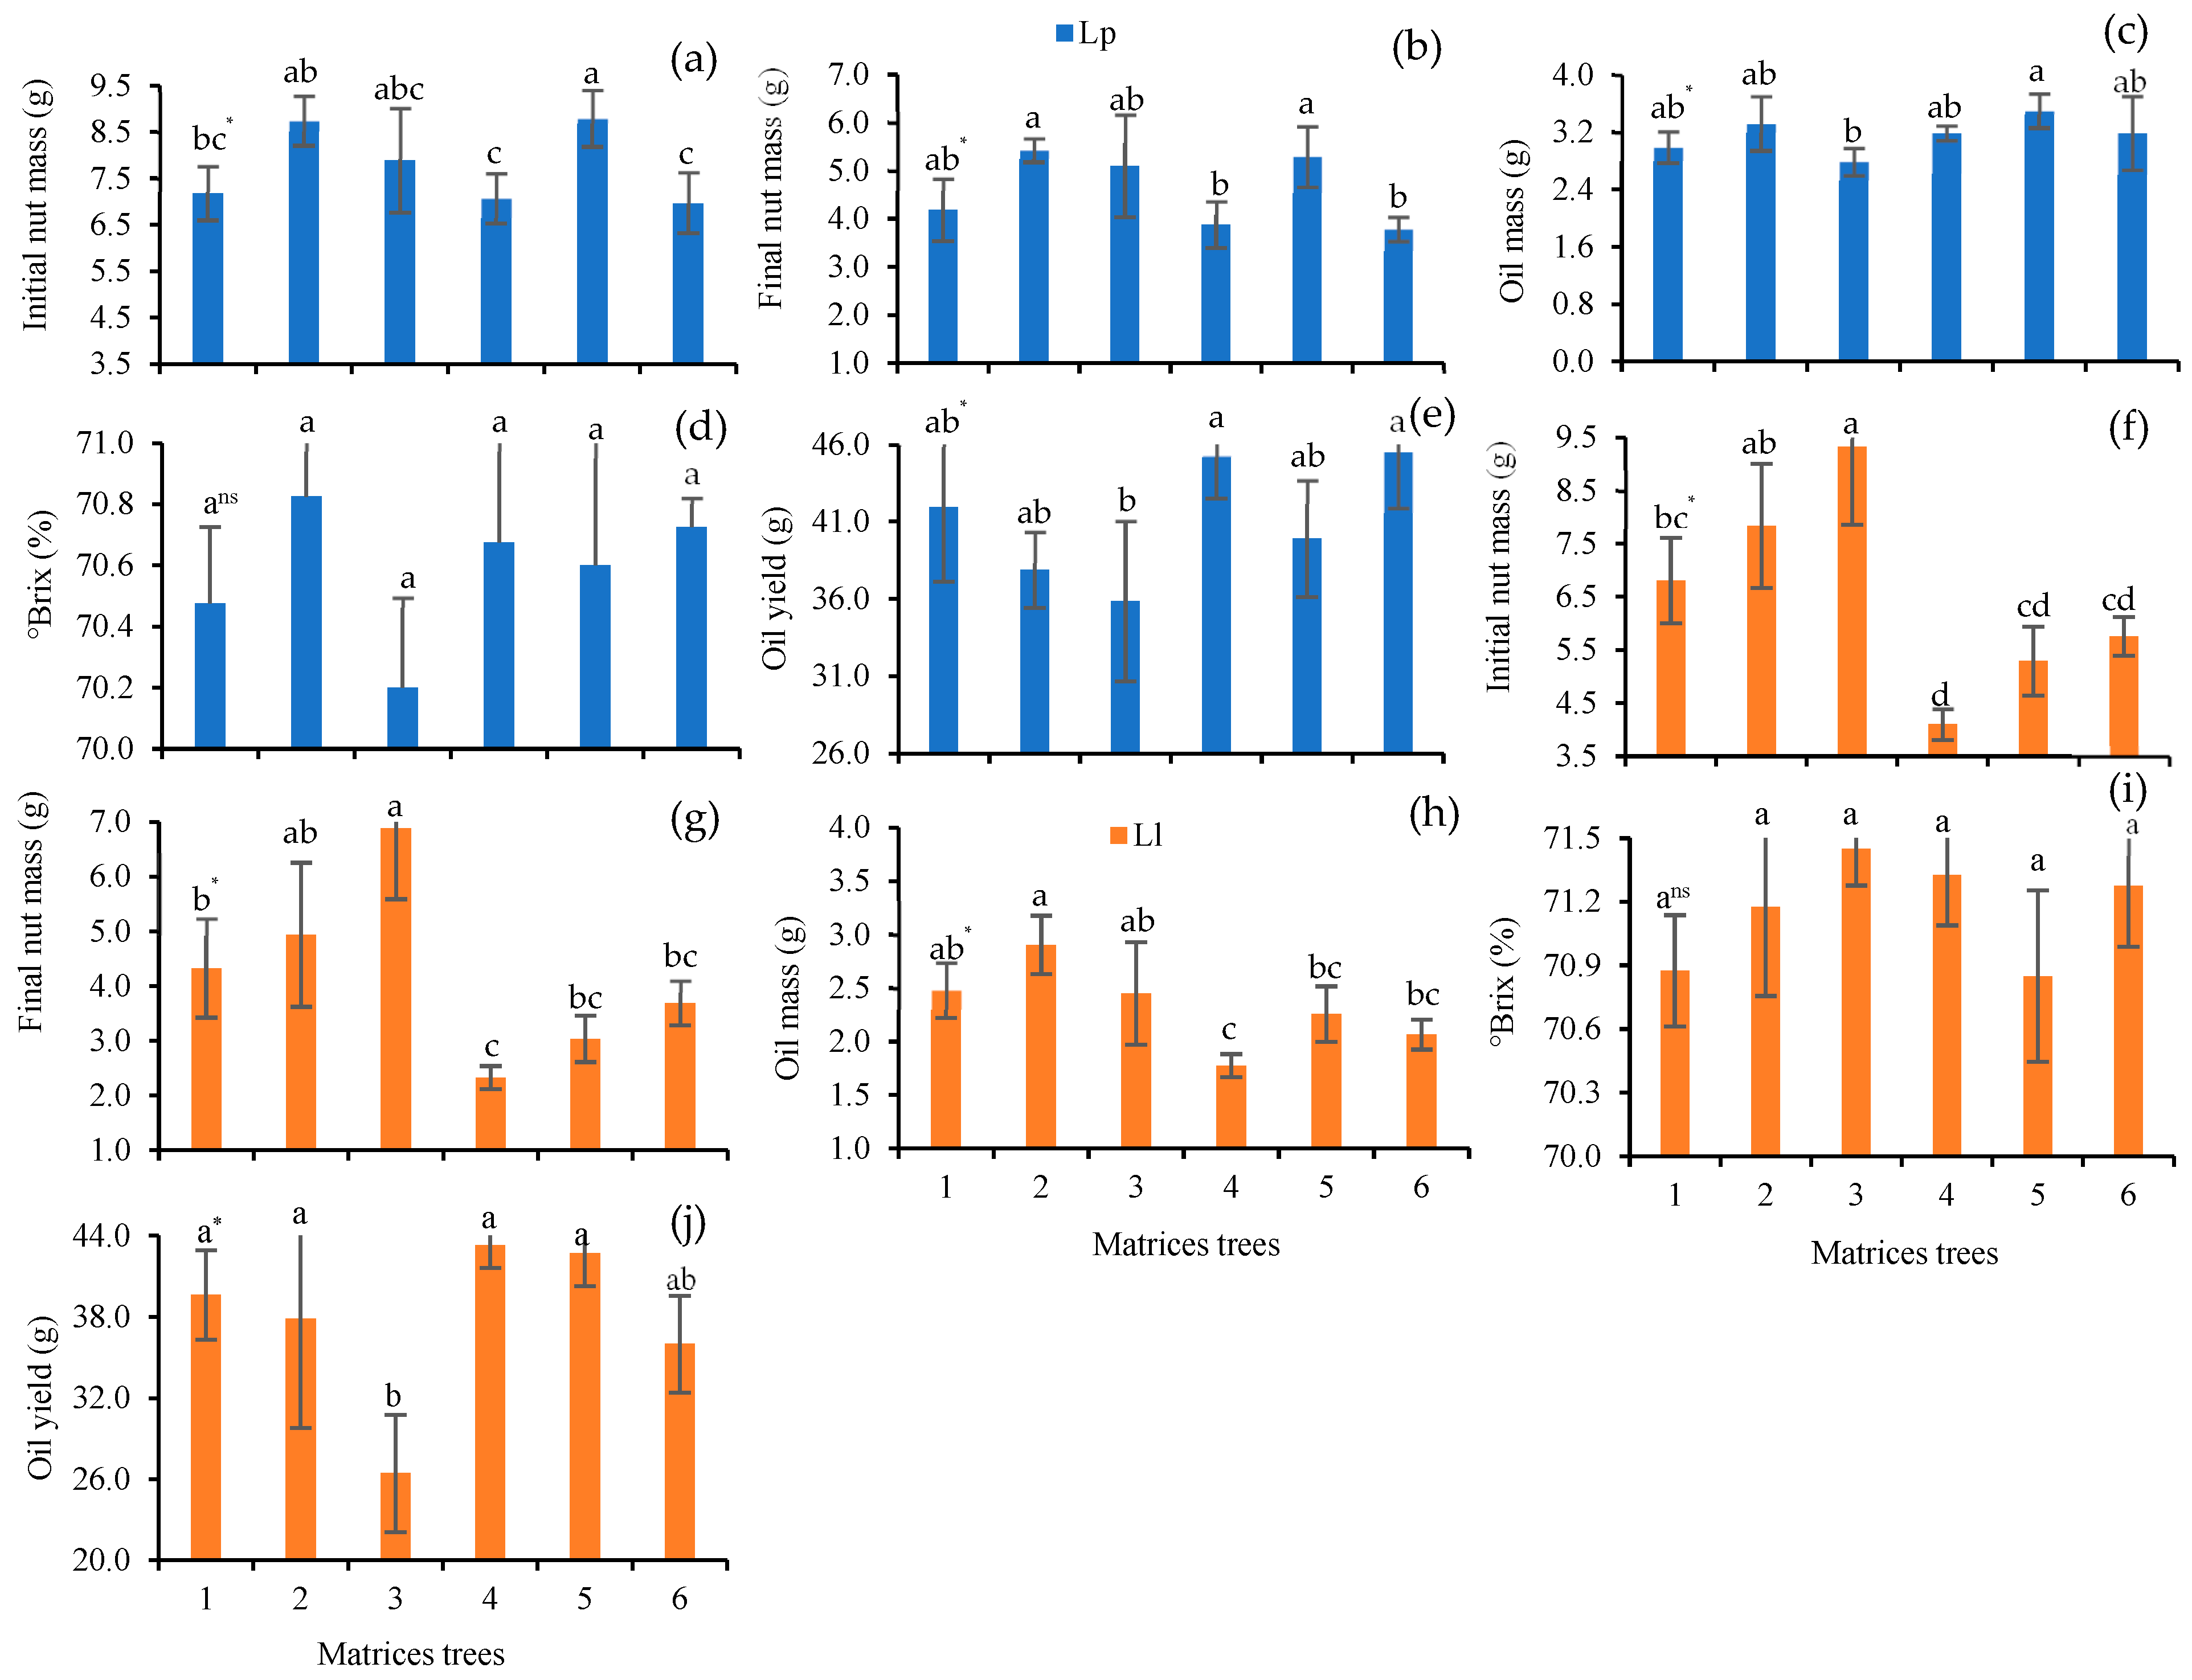
3.5. Brix and Fatty Acid Composition in Chestnut Oil

The nuts of L. pisonis showed a higher initial mass for L. pisonis tree 5 (8.79 g), which was not statistically different from L. pisonis trees 2 and 3 (8.75 and 7.89, respectively), and the final mass followed the same behavior. The oil mass presented the highest average in L. pisonis tree 5 and there was no statistical difference for the Brix between the trees, with the highest oil yield being observed for L. pisonis trees 4 and 6 (45.26 and 45.53%). For the species L. lanceolata, trees with the highest weight of nuts reached the highest oil mass. No statistical difference was observed for Brix between the trees studied and the oil yield ranged from 26.44% (L. pisonis tree 3) to 43.31% (Figure 6f–j).
Ten different fatty acids were identified in the chestnut Lecythis pisonis and Lecythis lanceolata oils and their percentage values were determined (Table 1). Stearic (31.8–52.4%) and oleic (24.2–50.5%) acids were predominant, followed by myristic (8–13%), heptadec-10-enoic (3–13%), vaccenic (1–2%), and other (lower than 1%) acids.

4. Discussion

According to the data obtained in this study, it was observed that nuts of the species L. pisonis and L. lanceolata are rich sources of minerals and antioxidant compounds. Within each species, some trees stood out in terms of mineral accumulation in L. pisonis (L. pisonis trees 4 and 6) and L. lanceolata (L. lanceolata trees 2 and 6). The chemical characteristics, size, and number of seeds vary according to the producing parent plant and its location [5,38]. The absorption of nutrients and their transport to fruits and seeds leads to foods rich in mineral compounds with potential benefits for humans [39]. Nutrient levels vary during the reproductive period. As observed by [40], the formation of Punica granatum L. fruits was accompanied by an increase in Ca, Mg, Mn, and Cu, which was followed by a decrease in N, P, K, S, Fe, and Zn in the leaves. In bean cultivars, Fe, Zn, and Se were reduced in the pod during maturation, indicating that they were translocated to the seed [41].
Foods rich in bioactive compounds, which complement the human diet, contribute to the proper functioning of bodily processes. N is involved in the synthesis of proteins and amino acids (glutamine, proline, and arginine) in seeds [42], and is widely found in sapucaia nuts (19.86 g 100 g−1) [43], Brazil nuts (15.52 g 100 g−1), cashew nuts (18.4 g 100 g−1), peanuts (25.2 g 100 g−1), pistachios (15.2 g 100 g−1), almonds (20.8 g 100 g−1), nuts (14.1 g 100 g−1), and macadamia nuts (8.7 g 100 g−1) [44]. The recommended daily concentrations are P (700 mg), Ca (1000 mg), Mg (400 mg), K (3500 mg), Fe (10 mg for men and 15 mg for women), and Zn (15 mg for men and 12 mg for women) [45,46].
P is involved in maintaining pH, producing reducing power in the form of inorganic phosphate, is a structural component of cell membrane phospholipids and nucleotides, participates in phosphorylation and enzyme activation processes, and its deficiency can cause anemia, infections, and muscle weakness [47]. Lysosomal Ca2+ mediates autophagy and any defects in this process are associated with aberrant protein formation and disease [48]. Mg is involved in the development of skeletal tissue and the transport of neurons and muscle cells [47]. K regulates osmotic pressure, cardiovascular, respiratory, digestive, endocrine, and cell division processes [47]. Zn has a neuroprotective function as it binds to radical-scavenging proteins, and its deficiency is associated with degenerative diseases such as multiple sclerosis [49].
Selenium is one of the main antioxidants present in L. pisonis and L. lanceolata nuts. Its recommended consumption is 55 µg day−1 in adults, with a maximum of 400 µg day−1 [45]. Multiplied by the average mass of the endosperm the amount of Se chestnut−1 was calculated as L. pisonis trees 1 (66.83 µg), 2 (134.35 µg), 3 (221.26 µg), 4 (191.68 µg), 5 (649.05 µg), and 6 (98.33 µg); L. lanceolata trees 1 (190.99 µg), 2 (21.14 µg), 3 (73.82 µg), 4 (169.84 µg), 5 (883.16 µg), and 6 (172.21 µg). For all L. pisonis matrices studied, consumption should be one nut per day; only L. pisonis tree 5 should be limited to 1/2 a chestnut day. Seemingly, the recommended daily dose of all L. lanceolata trees is one chestnut; however, L. lanceolata tree 5 should be limited to 1/3 of a chestnut, while L. lanceolata tree 2 can be increased to three. In studies with four L. pisonis trees located in the states of Piau and Minas Gerais, [3,4] reported Se concentrations of 26.4–46.9 μg g−1, which are well below those found in the present study. In samples from the state of Pará, [50] reported Se concentrations of 1.2–151 μg g−1; whereas for 71 Brazil nut trees distributed in the regions of Acre, Mato Grosso, Roraima, Amapá, and Amazonas, the levels of Se ranged from <0.5 to 146.6 μg g−1. The concentration of Se in the nut can be influenced by soil pH, geology, and hydrology [21,22]. Soil pH is strictly related to the Se absorption capacity by plants, as observed by [21] when studying different soil types in the Amazon Forest, noting that even in soils with lower Se concentrations, the available fraction (Sesoluble + Seadsorbed) was higher in higher pH sites (~5.5 to 6).
Nuts of L. pisonis tree 4 exhibited the highest values of anthocyanins, total phenolics, flavonols, and DPPH, as did nuts of L. lanceolata tree 4, except for flavonols. Anthocyanins are flavonoid pigments providing color to plants, fruits, seeds, and flowers. They help scavenge free radicals and are abundant in blueberries and cranberries, whose ingestion is associated with cognitive improvements [51] and reduced triglycerides, blood pressure, and glycemia in the elderly [52]. The highest total phenolics content reported by [3,4] in L. pisonis was 4134 mg 100 g−1 for the endosperm and 37,764 mg 100 g−1 for the tegument. These values are higher than those reported here (513.89 and 3815.53 mg 100 g−1, respectively, for L. pisonis and 403.88 and 2695.43 mg 100 g−1, respectively, for L. lanceolata). The present values for the endosperm are more similar to those of Brazil nuts (169.2 mg 100 g−1), cashew nuts (316.4 mg 100 g−1), hazelnuts (314.8 mg 100 g−1), macadamia nuts (497.8 mg 100 g−1), peanuts (645.9 mg 100 g−1), pine nuts (152.9 mg 100 g−1), and pistachios (571.8 mg 100 g−1); while the tegument is akin to the values for nuts (1580.5 mg 100 g−1) and pecans (1463.9 mg 100 g−1) [53].
The following flavonoid contents have been reported for Brazil nuts (107.8 mg 100 g−1), cashew nuts (63.7 mg 100 g−1), hazelnuts (113.7 mg 100 g−1), macadamia nuts (137.9 mg 100 g−1), peanuts (189.8 mg 100 g−1), pecans (704.7 mg 100 g−1), pine nuts (45.00 mg 100 g−1), pistachios (143.3 mg 100 g−1), and nuts (744.8 mg 100 g−1) [53]. Catechin was the most commonly found flavonoid in the seed coat of L. pisonis [3,4]. It acts as a strong antioxidant by capturing ROS and may be a chelator of metal ions [54]. Tannin content in the tegument of L. pisonis (mean = 5.52 mg g−1) and L. lanceolata (mean = 6.42 mg g−1) nuts was lower than that reported by [3,4] in the chestnut coat of L. pisonis (123.81 mg g−1). These authors did not detect this compound in the endosperm; here, only 0.49 mg g−1 of tannin was found in both species. Tannins are secondary metabolites that help plants defend themselves against predators, as confirmed by rodents preferring seeds with low tannin content [55]. They also exert antioxidant effects, as seen in barley seeds, whose cultivars with higher levels of condensed tannins and total phenolics showed greater antioxidant power and protection against DNA damage [56]. In the present study, tannin concentrations were higher in the tegument than in the endosperm of chestnuts, suggesting an antioxidant and protective role for seeds in their natural environment.
The antioxidant power of the L. pisonis chestnut skin was associated with the presence of phenolic compounds [4]. However, this protective structure is also rich in tannins, which are responsible for the characteristic brownish color of the nuts in both species. In L. lanceolata, DPPHt displayed an elevated positive correlation (r = 0.88) with CTt, but a highly negative one (r = −0.99) with CTe. In studies with Brazil nuts, [57] found the phenolic compounds to be more concentrated in the brown film covering the chestnut (1236.07 mg 100 g−1) than in the whole nut (519.11 mg 100 g−1). In L. pisonis, phenolics of the endosperm content correlated positively with N in the endosperm. Higher N content promotes the production of proteins in seeds [58], which can become more soluble and change amino acid composition in the presence of phenolic compounds [59]. A strong positive association was detected also between Fe and Zn in L. pisonis nuts. Studies with cashew nuts observed that these nutrients were associated with proteins and that only 1/3 was absorbed during digestion in humans [60].
In the present study, Se in chestnuts displayed a negative association with Cu in the soil at a depth of 0–20 cm, but a positive one at a depth of 20–40 cm. Se content in chestnuts can be influenced by soil pH, as well as geological and hydrological conditions. Moreover, Se correlates positively with clay and soil S at depths of 0–20 and 20–40 [20,22]. In Brassica napus L., pH, S, and sulfate in the soil were related to the absorption of Se, with S and sulfate lowering soil pH [61]. Plants with elevated capacity for Se accumulation possess transporters with greater affinity for Se than S [62]. The sulfur metabolic pathway is often employed for the uptake of Se as selenate, the main form of Se in soil, is absorbed by sulfate transporters, as selenite import depends on phosphate and aquaporin transporters. Hyperaccumulating species, which can contain more than 1000 µg g−1 of Se in their tissues, employ complex mechanisms for the absorption and metabolism of Se [63,64]. Such species accumulate seven times more Se than L. pisonis tree 5 (149.55 µg g−1) and three times more than L. lanceolata tree 5 (333.27 µg g−1).
The determination of the nuts’ density using the X-ray densitometry method was efficient. X-ray densitometry is little explored in seed analysis; however, it is a promising non-destructive technique for quantifying the density and evaluating the internal morphology of the seed, being able to identify empty and partially empty seeds and defects in the endosperm [65]. In addition to not causing damage to the seeds, the technique is fast and does not require preparation or treatment of the seed nuts for the analysis.
The fatty acid composition of Lecythis pisonis and Lecythis lanceolata oils is different from that found in the nut Lecythis pisonis Cambess (LPC) [3]. The main constituents are oleic (40–45%), linoleic (32–47%), and palmitic (11–15%) acids [3]. In comparison, nuts do not have the same fatty acids, such as total saturated fatty acids (47.7–65.3% L. pisonis and L. lanceolata × 43.1–58.8% LPC), monounsaturated (34.4–51.8% L. pisonis and L. lanceolata × 40.8–56.6% LPC), polyunsaturated (0.30–0.50% L. pisonis and L. lanceolata × 0.10–0.30% LPC), and the ratio between saturated and unsaturated (S/U: 0.91–1.88% L. pisonis and L. lanceolata × 0.76–1.43% LPC) values. This is mainly due to the representative presence of linoleic acid in LPC and that it is almost absent in L. pisonis and L. lanceolata, which have a wide concentration of their constituents and specific fatty acids (oleic and heptadec-10-enoic acid), and the ratio between them (myristic/palmitic, for example). This may facilitate the chemical distinction of this species from other nuts. Within the same family (Lecythidaceae), B. excelsa nuts present about 80% of unsaturated fatty acids, with higher concentrations of palmitic acid (14–16%), stearic (9–11%), oleic acid (28–36%) and linoleic (36–40%) [66,67,68]. Oleic and linoleic acid are extremely important in the diet, as they may be associated with a reduction in the incidence of cardiovascular diseases [69].
Nuts can be used as a source of raw material for the production of processed foods, gaining prominence in the production of pasta and bread, due to the absence of gluten in their constitution [70]. This food can be included in the diet of people with celiac disease, which is an autoimmune condition caused by inflammation of the small intestine mucosa and atrophy of its villi [71]. This group of people cannot ingest gluten, a compound derived from wheat, rye, and barley, and replacing gluten with nut flour makes these foods suitable for inclusion in their diet [71]. The addition of gluten-free flour was also used in the production of biscuits, where the addition of chestnut flour had positive effects on organoleptic characteristics and shelf life by increasing its stability [72]. Some nuts, like the Castanea sativa species, are rich in condensed tannins and, consequently, have high levels of polyphenols, which can be used in the treatment of human gastritis due to their anti-inflammatory potential [73].

5. Conclusions

Both studied species presented trees that stood out in terms of the concentration of nutrients and antioxidants present in their nuts. L. pisonis trees 4 and 6 and L. lanceolata trees 2 and 6 have the most nutritious nuts. L. pisonis tree 4 also showed the highest accumulation of antioxidant compounds in its nuts. Principal component analyses (PCA) showed the behavior of nutrient absorption in nuts in terms of foliar and soil minerals. L. pisonis trees (1, 2, 3, 4, and 6) and L. lanceolata trees (1, 2, 4, and 6) have adequate Se concentrations for human consumption (one walnut day-1), while the consumption of nuts from L. pisonis tree 5 and L. lanceolata tree 5 should be limited to 1/2 and 1/3 of a nut day-1, respectively. The data collected in the present study confirm that the nuts of these species are rich sources of Se and can be used in the human diet, replacing other foods. X-ray densitometry can be a useful tool for analyzing nut quality, as it allows for the measurement of the density of samples. The Brix of the nut oil of both species showed no difference between the studied trees, showing that the variation of soluble solids is low. The predominant fatty acids were stearic acid and oleic acid, followed by myristic acid, eptadic-10-enoic, and vaccenic acid. Based on the results obtained, we conclude that these two species produce nuts with beneficial nutritional and functional properties, which can be included in human consumption. The sustainable exploitation of this material is still limited and little-known, and new complementary studies are needed to insert these nuts into the market.

Supplementary Materials

The following supporting information can be downloaded at: https://www.mdpi.com/article/10.3390/foods12244422/s1.

Author Contributions

C.P.d.A.: designed the study and performed most of the experiments; I.M.S.: performed most of the experiments; T.L.M.R.: performed most of the experiments; T.d.M.: performed most of the experiments; G.B.C.: analyzed the data; A.F.: analyzed the data; J.P.B.d.O.: analyzed the data; E.R.S.: analyzed the data; J.C.L.: manuscript review; T.d.S.d.S.: performed the biochemical analyses; W.C.O.: manuscript review; P.F.P.: performed fatty acid analysis; F.J.M.N.: performed fatty acid analysis; F.G.G.: performed X-ray densitometry analysis; A.R.d.S.: manuscript review; R.S.A.: designed the study. All authors have read and agreed to the published version of the manuscript.

Funding

This study was funded by the Coordenação de Aperfeiçoamento de Pessoal de Nível Superior–Brazil (CAPES)–(Finance code 001), Fundação de Amparo à Pesquisa e Inovação do Espírito Santo (FAPES) (EDITAL FAPES/CNPq N° 05/2017–PRONEM–PROGRAMA DE APOIO A NÚCLEOS EMERGENTES). The agreement was registered with SICONV under n° 794009/2013 and Process FAPES n° 72660945, Conselho Nacional de Desenvolvimento Científico e Tecnológico (CNPq) (Finance code 308365/2019-4) and Fundação de Amparo à Pesquisa de Minas Gerais (FAPEMIG–Process Grant: APQ-01574-22). This work was carried out with the support of FAPES through the granting of funding for the publication of the article in open access, based on public notice N° 05/2023–Publication of technical-scientific articles (7th cycle).

Data Availability Statement

Data is contained within the article and supplementary material.

Acknowledgments

The authors would like to thank Conselho Nacional de Desenvolvimento Científico e Tecnológico (CNPq), the Fundação de Amparo à Pesquisa e Inovação do Espírito Santo (FAPES) for research funding, the Federal University of Espirito Santo.

Conflicts of Interest

The authors declare that there are no conflict of interest regarding the publication of this article.

References

  1. Teixeira, N.; Melo, J.C.; Batista, L.F.; Paula-Souza, J.; Fronza, P.; Brandão, M.G. Edible fruits from Brazilian biodiversity: A review on their sensorial characteristics versus bioactivity as tool to select research. Food Res. Int. 2019, 119, 325–348. [Google Scholar] [PubMed]
  2. Lima, R.A.F.; Souza, V.C.; Siqueira, M.F.; Steege, H. Defining endemism levels for biodiversity conservation: Tree species in the Atlantic Forest hotspot. Biol. Conserv. 2020, 252, 108825. [Google Scholar]
  3. Demoliner, F.; Policarpi, P.d.B.; Ramos, J.C.; Bascuñan, V.L.A.F.; Ferrari, R.A.; Jachmanián, I.; Casas, A.d.F.d.; Vasconcelos, L.F.L.; Block, J.M. Sapucaia nut (Lecythis pisonis Cambess) and its by-products: A promising and underutilized source of bioactive compounds. Part I: Nutritional composition and lipid profile. Food Res. Int. 2018, 108, 27–34. [Google Scholar] [PubMed]
  4. Demoliner, F.; Policarpi, P.d.B.; Vasconcelos, L.F.L.; Vitali, L.; Micke, G.A.; Block, J.M. Sapucaia nut (Lecythis pisonis Cambess) and its by-products: A promising and underutilized source of bioactive compounds. Part II: Phenolic compounds profile. Food Res. Int. 2018, 112, 434–442. [Google Scholar]
  5. Rosa, T.L.M.; de Araujo, C.P.; Kamke, C.; Ferreira, A.; Ferreira, M.F.d.S.; de Oliveira, J.P.B.; Schmildt, E.R.; Lopes, J.C.; Mengarda, L.H.G.; Otoni, W.C.; et al. Sapucaia nut: Morphophysiology, minerals content, methodological validation in image analysis, phenotypic and molecular diversity in Lecythis pisonis Cambess. Food Res. Int. 2020, 137, 109383. [Google Scholar]
  6. Polmann, G.; Badia, V.; Danielski, R.; Ferreira, S.R.S.; Block, J.M. Non-conventional nuts: An overview of reported composition and bioactivity and new approaches for its consumption and valorization of co-products. Future Foods 2021, 4, 100099. [Google Scholar]
  7. Araujo, N.M.P.; Arruda, H.S.; Marques, D.R.P.; Oliveira, W.Q.; Pereira, G.A.; Pastore, G.M. Functional and nutritional properties of selected Amazon fruits: A review. Food Res. Int. 2021, 147, 110520. [Google Scholar]
  8. Massantini, R.; Moscetti, R.; Frangipane, M.T. Evaluating progress of chestnut quality: A review of recent developments. Trends Food Sci. Technol. 2021, 113, 245–254. [Google Scholar]
  9. Vieira, M.E.B.; Vasconcelos, I.M.; Machado, O.L.T. Isolation, characterization and mechanism of action of an antimicrobial peptide from Lecythis pisonis seeds with inhibitory activity against Candida albicans. Acta Biochim. Biophys. Sin. 2015, 47, 716–729. [Google Scholar]
  10. Carvalho, R.F.; Huguenin, G.V.B.; Luiz, R.R.; Moreira, A.S.B.; Oliveira, G.M.M.; Rosa, G. Intake of partially defatted Brazil nut flour reduces serum cholesterol in hypercholesterolemic patients-a randomized controlled trial. Nutr. J. 2015, 14, 59. [Google Scholar]
  11. Yilmaz-Ersan, L.; Ozcan, T.; Akpinar-Bayizit, A.; Usta-Gorgun, B.; Keser, G.; Ciniviz, M.; Demiray-Teymuroglu, M. The probiotic chestnut-based dairy matrix: Influence on the metabolomic formation and the nutritional quality. Int. J. Dairy Technol. 2023. [Google Scholar] [CrossRef]
  12. Mas, A.L.; Brigante, F.I.; Salvucci, E.; Ribotta, P.; Martinez, M.L.; Wunderlin, D.A.; Baroni, M.V. Novel cookie formulation with defatted sesame flour: Evaluation of its technological and sensory properties. Changes in phenolic profile, antioxidant activity, and gut microbiota after simulated gastrointestinal digestion. Food Chem. 2022, 389, 133122. [Google Scholar]
  13. Pinto, D.; Moreira, M.M.; Vieira, E.F.; Švarc-Gajić, J.; Vallverdú-Queralt, A.; Brezo-Borjan, T.; Delerue-Matos, C.; Rodrigues, F. Development and characterization of functional cookies enriched with chestnut shells extract as source of bioactive phenolic compounds. Foods 2023, 12, 640. [Google Scholar]
  14. Luvián-Morales, J.; Varela-Castillo, F.O.; Flores-Cisneros, L.; Cetina-Pérez, L.; Castro-Eguiluz, D. Functional foods modulating inflammation and metabolism in chronic diseases: A systematic review. Crit. Rev. Food Sci. Nutr. 2022, 62, 4371–4392. [Google Scholar]
  15. Pinto, D.; Almeida, A.; López-Yerena, A.; Pinto, S.; Sarmento, B.; Lamuela-Raventós, R.; Vallverdedú-Queralt, A.; Delerue-Matos, C.; Rodrigues, F. Appraisal of a new potential antioxidants-rich nutraceutical ingredient from chestnut shells through in-vivo assays–A targeted metabolomic approach in phenolic compounds. Food Chem. 2023, 404, 134546. [Google Scholar] [PubMed]
  16. Townsend, J.R.; Kirby, T.O.; Marshall, T.M.; Church, D.D.; Jajtner, A.R.; Esposito, R. Foundational Nutrition: Implications for Human Health. Nutrients 2023, 15, 2837. [Google Scholar] [PubMed]
  17. Yeum, K.-J.; Beretta, G.; Krinsky, N.I.; Russell, R.M.; Aldini, G. Synergistic interactions of antioxidant nutrients in a biological model system. Nutrition 2009, 25, 839–846. [Google Scholar] [PubMed]
  18. Palacios, C. The role of nutrients in bone health, from A to Z. Crit. Rev. Food Sci. Nutr. 2006, 46, 621–628. [Google Scholar]
  19. World Health Organization. Fact Sheet: Malnutrition; WHO: Geneva, Switzerland, 2021. [Google Scholar]
  20. Junior, E.S.; Wadt, L.; Silva, K.; Lima, R.; Batista, K.; Guedes, M.; Carvalho, G.; Reis, A.; Lopes, G.; Guilherme, L. Natural variation of selenium in Brazil nuts and soils from the Amazon region. Chemosphere 2017, 188, 650–658. [Google Scholar]
  21. Junior, E.C.d.S.; Wadt, L.H.d.O.; da Silva, K.E.; de Lima, R.M.B.; Batista, K.D.; Guedes, M.C.; Junior, R.C.d.O.; dos Reis, A.R.; Lopes, G.; Broadley, M.R.; et al. Geochemistry of selenium, barium, and iodine in representative soils of the Brazilian Amazon rainforest. Sci. Total Environ. 2022, 828, 154426. [Google Scholar]
  22. Statwick, J.; Sher, A.A. Selenium in soils of western Colorado. J. Arid. Environ. 2017, 137, 1–6. [Google Scholar]
  23. Gunstone, F.D. Fatty acids—Nomenclature, structure, isolation and structure determination, biosynthesis and chemical synthesis. In Fatty Acid and Lipid Chemistry; Blackie Academic & Profesional: Glasgow, UK, 1996; pp. 1–33. [Google Scholar]
  24. Haast, R.A.; Kiliaan, A.J. Impact of fatty acids on brain circulation, structure and function. Prostaglandins Leukot. Essent. Fat. Acids 2015, 92, 3–14. [Google Scholar]
  25. Dyall, S.C.; Balas, L.; Bazan, N.G.; Brenna, J.T.; Chiang, N.; Souza, F.d.C.; Dalli, J.; Durand, T.; Galano, J.-M.; Lein, P.J.; et al. Polyunsaturated fatty acids and fatty acid-derived lipid mediators: Recent advances in the understanding of their biosynthesis, structures, and functions. Prog. Lipid Res. 2022, 86, 101165. [Google Scholar]
  26. Mallick, R.; Duttaroy, A.K. Modulation of endothelium function by fatty acids. Mol. Cell. Biochem. 2022, 477, 15–38. [Google Scholar]
  27. Brosolo, G.; Da Porto, A.; Marcante, S.; Picci, A.; Capilupi, F.; Capilupi, P.; Bertin, N.; Vvarelli, C.; Bulfone, L.; Vacca, A.; et al. Omega-3 fatty acids in arterial hypertension: Is there any good news? Int. J. Mol. Sci. 2023, 24, 9520. [Google Scholar] [PubMed]
  28. Silva, F.C. Manual de Análises Químicas de Solos, Plantas E Fertilizantes, 2nd ed.; Embrapa Informação Tecnológica: Rio de Janeiro, Brazil, 2009; p. 627. [Google Scholar]
  29. Olson, O.E.; Palmer, I.S.; Cary, E.E. Modification of the Official Fluorometric Method for Selenium in Plants. J. AOAC Int. 1975, 58, 117–121. [Google Scholar]
  30. Teixeira, P.C.; Donagemma, G.K.; Fontana, A.; Teixeira, W.G. Manual de Métodos de Análise de Solo, 3rd ed.; Embrapa Solos: Brasília, Brazil, 2017. [Google Scholar]
  31. Singleton, V.L.; Orthofer, R.; Lamuela-Raventós, R.M. Analysis of total phenols and other oxidation substrates and antioxidants by means of folin-ciocalteu reagent. Methods Enzymol. 1999, 299, 152–178. [Google Scholar]
  32. Francis, F.J. Analysis of anthocyanins. In Anthocyanins as Food Colors; Markakis, P., Ed.; Academic Press: New York, NY, USA, 1982; pp. 182–205. [Google Scholar]
  33. Hagerman, A.E. Radial diffusion method for determining tannin in plant extracts. J. Chem. Ecol. 1987, 13, 437–449. [Google Scholar]
  34. Nascimento, J.C.; Lage, L.F.O.; Camargos, C.R.D.; Amaral, J.C.; Costa, L.M.; Sousa, A.D.; Oliveira, F.Q. Determinação da atividade antioxidante pelo método DPPH e doseamento de flavonóides totais em extratos de folhas da Bauhinia variegata L. Rev. Bras. Farmácia 2011, 92, 327–332. [Google Scholar]
  35. Mello, T.; Zanardo, T.É.C.; dos Santos Taliuli, Y.; Simões, I.M.; Baptista, J.O.; Gonçalves, F.G.; Hegedus, C.E.N.; Schmildt, E.R.; Ferreira, A.; Santos, H.O.; et al. Maturation and quality of seeds of an endangered tropical palm species (Euterpe edulis Martius) assessed by imaging and X-ray densitometry. 2023. [Google Scholar] [CrossRef]
  36. Zeng, A.X.; Chin, S.-T.; Nolvachai, Y.; Kulsing, C.; Sidisky, L.M.; Marriott, P.J. Characterisation of capillary ionic liquid columns for gas chromatography–mass spectrometry analysis of fatty acid methyl esters. Anal. Chim. Acta 2013, 803, 166–173. [Google Scholar]
  37. International Olive Council. Determination of Fatty Acid Methyl Esters by Gas Chromatography. COI/T. 20/DOC. No 33/Ver. 1. 2007. Available online: https://www.internationaloliveoil.org/wp-content/uploads/2019/11/COI-T.20-Doc.-No-33-Rev.-1-2017.pdf (accessed on 29 May 2022).
  38. Rosa, T.L.M.; de Araujo, C.P.; Alexandre, R.S.; Schmildt, E.R.; Lopes, J.C. Biometry and genetic diversity of paradise nut genotypes (Lecythidaceae). Pesqui. Agropecu Bras. 2019, 54, e00240. [Google Scholar]
  39. Barker, A.V.; Stratton, M.L. Nutrient density of fruit crops as a function of soil fertility. In Fruit Crops: Diagnosis and Management of Nutrient Constraints; Srivastava, A.K., Hu, C., Eds.; Elsevier: Oxford, UK, 2020; pp. 13–31. [Google Scholar]
  40. Maity, A.; Babu, K.D.; Sarkar, A.; Pal, R.K. Seasonality of nutrients vis-à-vis fruit quality of pomegranate cv. Bhagwa on vertisol. J. Plant Nutr. 2017, 40, 1351–1363. [Google Scholar]
  41. de Figueiredo, M.A.; Boldrin, P.F.; Hart, J.J.; de Andrade, M.J.; Guilherme, L.R.; Glahn, R.P.; Li, L. Zinc and selenium accumulation and their effect on iron bioavailability in common bean seeds. Plant Physiol. Biochem. 2017, 111, 193–202. [Google Scholar] [PubMed]
  42. Zuo, Q.S.; Zhou, G.S.; Yang, S.F.; Yang, Y.; Wu, L.R.; Leng, S.H.; Yang, G.; Wu, J.S. Effects of nitrogen rate and genotype on seed protein and amino acid content in canola. J. Agric. Sci. 2016, 154, 438–455. [Google Scholar]
  43. Vallilo, M.I.; Tavares, M.; Pimentel, S.A.; Badolato, E.S.G.; Inomata, E.I. Caracterização química parcial das sementes de Lecythis pisonis Camb. (Sapucaia). Acta Amaz. 1998, 28, 131–140. [Google Scholar]
  44. Cardoso, B.R.; Duarte, G.B.S.; Reis, B.Z.; Cozzolino, S.M. Brazil nuts: Nutritional composition, health benefits and safety aspects. Food Res. Int. 2017, 100, 9–18. [Google Scholar]
  45. Monsen, E.R. Dietary reference intakes for the antioxidant nutrients: Vitamin C, vitamin E, selenium, and carotenoids. J. Am. Diet Assoc. 2000, 100, 637–640. [Google Scholar]
  46. Esteve-Llorens, X.; Darriba, C.; Moreira, M.T.; Feijoo, G.; González-García, S. Towards an environmentally sustainable and healthy Atlantic dietary pattern: Life cycle carbon footprint and nutritional quality. Sci. Total Environ. 2019, 646, 704–715. [Google Scholar]
  47. Combet, E.; Buckton, C. Micronutrient deficiencies, vitamin pills and nutritional supplements. Med. Baltim. 2019, 47, 145–151. [Google Scholar]
  48. Liu, E.A.; Lieberman, A.P. The intersection of lysosomal and endoplasmic reticulum calcium with autophagy defects in lysosomal diseases. Neurosci. Lett. 2019, 697, 10–16. [Google Scholar] [PubMed]
  49. Mezzaroba, L.; Alfieri, D.F.; Simão, A.N.C.; Reiche, E.M.V. The role of zinc, copper, manganese and iron in neurodegenerative diseases. Neurotoxicology 2019, 74, 230–241. [Google Scholar] [PubMed]
  50. de Brito, R.C.M.; Junior, J.B.P.; Dantas, K.d.G.F. Quantification of inorganic constituents in Brazil nuts and their products by inductively coupled plasma optical emission spectrometry. LWT-Food Sci. Technol. 2019, 116, 108383. [Google Scholar]
  51. Krikorian, R.; Kalt, W.; McDonald, J.E.; Shidler, M.D.; Summer, S.S.; Stein, A.L. Cognitive performance in relation to urinary anthocyanins and their flavonoid-based products following blueberry supplementation in older adults at risk for dementia. J. Funct. Foods 2020, 64, 103667. [Google Scholar]
  52. Novotny, J.A.; Baer, D.J.; Khoo, C.; Gebauer, S.K.; Charron, C.S. Cranberry juice consumption lowers markers of cardiometabolic risk, including blood pressure and circulating c-reactive protein, triglyceride, and glucose concentrations in adults. J. Nutr. 2015, 145, 1185–1193. [Google Scholar]
  53. Yang, J. Brazil nuts and associated health benefits: A review. LWT-Food Sci. Technol. 2009, 42, 1573–1580. [Google Scholar]
  54. Bernatoniene, J.; Kopustinskiene, D.M. The role of catechins in cellular responses to oxidative stress. Molecules 2018, 23, 965. [Google Scholar]
  55. Zhang, M.; Steele, M.A.; Yi, X. Reconsidering the effects of tannin on seed dispersal by rodents: Evidence from enclosure and field experiments with artificial seeds. Behav. Process. 2013, 100, 200–207. [Google Scholar]
  56. Salar, R.K.; Purewal, S.S.; Sandhu, K.S. Relationships between DNA damage protection activity, total phenolic content, condensed tannin content and antioxidant potential among Indian barley cultivars. Biocatal. Agric. Biotechnol. 2017, 11, 201–206. [Google Scholar]
  57. John, J.A.; Shahidi, F. Phenolic compounds and antioxidant activity of Brazil nut (Bertholletia excelsa). J. Funct. Foods 2010, 2, 196–209. [Google Scholar]
  58. Aliakbarkhani, S.T.; Farajpour, M.; Asadian, A.H.; Aalifar, M.; Ahmadi, S.; Akbari, M. Variation of nutrients and antioxidant activity in seed and exocarp layer of some Persian pistachio genotypes. Ann. Agric. Sci. 2017, 62, 39–44. [Google Scholar]
  59. Yan, X.; Liang, S.; Peng, T.; Zhang, G.; Zeng, Z.; Yu, P.; Gong, D.; Deng, S. Influence of phenolic compounds on physicochemical and functional properties of protein isolate from Cinnamomum camphora seed kernel. Food Hydrocoll. 2020, 102, 105612. [Google Scholar] [CrossRef]
  60. Xavier, A.D.S.; Furtado, D.Z.S.; Assunção, N.A.; Nascimento, A.N. Bioacessibility of Fe and Zn (associated to proteins) in cashew nut. J. Food Compos. Anal. 2019, 83, 103259. [Google Scholar]
  61. Liu, X.; Yang, Y.; Deng, X.; Li, M.; Zhang, W.; Zhao, Z. Effects of sulfur and sulfate on selenium uptake and quality of seeds in rapeseed (Brassica napus L.) treated with selenite and selenate. Environ. Exp. Bot. 2017, 135, 13–20. [Google Scholar]
  62. Pilon-Smits, E.A.; Quinn, C.F.; Tapken, W.; Malagoli, M.; Schiavon, M. Physiological functions of beneficial elements. Curr. Opin. Plant Biol. 2009, 12, 267–274. [Google Scholar] [CrossRef]
  63. White, P.J. Selenium metabolism in plants. Biochim. Biophys. Acta-Gen. Subj. 2018, 1862, 2333–2342. [Google Scholar] [CrossRef]
  64. Trippe, R.C., III; Pilon-Smits, E.A.H. Selenium transport and metabolism in plants: Phytoremediation and biofortification implications. J. Hazard Mater. 2021, 404, 124178. [Google Scholar] [CrossRef]
  65. Gomes-Junior, F.; Yagushi, J.; Belini, U.; Cicero, S.; Tomazello-Filho, M. X-ray densitometry to assess internal seed morphology and quality. Seed Sci. Technol. 2012, 40, 102–107. [Google Scholar] [CrossRef]
  66. Colpo, E.; Vilanova, C.D.D.; Reetz, L.G.B.; Duarte, M.M.; Farias, I.L.G.; Meinerz, D.F.; Mariano, D.O.C.; Vendrusculo, R.G.; Boligon, A.A.; Corte, C.L.D.; et al. Brazilian nut consumption by healthy volunteers improves inflammatory parameters. Nutrition 2014, 30, 459–465. [Google Scholar] [CrossRef]
  67. Stockler-Pinto, M.B.; Carrero, J.J.; Weide, L.D.C.C. Effect of selenium supplementation via Brazil nut (Bertholletia excelsa, HBK) on thyroid hormones levels in hemodialysis patients: A pilot study. Nutr. Hosp. 2015, 32, 1808–1812. [Google Scholar]
  68. Zanqui, A.B.; Silva, C.M.D.; Ressutte, J.B.; Morais, D.R.D. Brazil nut oil extraction using subcritical n-propane: Advantages and chemical composition. J. Braz. Chem. Soc. 2020, 31, 603–612. [Google Scholar]
  69. Venkatachalam, M.; Sathe, S.K. Chemical composition of selected edible nut seeds. J. Agric. Food Chem. 2006, 54, 4705–4714. [Google Scholar] [PubMed]
  70. Aglietti, C.; Cappelli, A.; Andreani, A. From chestnut tree (Castanea sativa) to flour and foods: A systematic review of the main criticalities and control strategies towards the relaunch of chestnut production chain. Sustainability 2022, 14, 12181. [Google Scholar] [CrossRef]
  71. Xhaferaj, M.; Alves, T.O.; Ferreira, M.S.; Scherf, K.A. Recent progress in analytical method development to ensure the safety of gluten-free foods for celiac disease patients. J. Cereal Sci. 2020, 96, 103114. [Google Scholar] [CrossRef]
  72. Paciulli, M.; Rinaldi, M.; Cavazza, A.; Ganino, T.; Rodolfi, M.; Chiancone, B.; Chiavaro, E. Effect of chestnut flour supplementation on physico-chemical properties and oxidative stability of gluten-free biscuits during storage. LWT 2018, 98, 451–457. [Google Scholar] [CrossRef]
  73. Sangiovanni, E.; Piazza, S.; Vrhovsek, U.; Fumagalli, M.; Khalilpour, S.; Masuero, D.; Di Lorenzo, C.; Colombo, L.; Mattivi, F.; De Fabiani, E.; et al. A bio-guided approach for the development of a chestnut-based proanthocyanidin-enriched nutraceutical with potential anti-gastritis properties. Pharmacol. Res. 2018, 134, 145–155. [Google Scholar] [CrossRef] [PubMed]
Figure 1. Geographical coordinates of the L. pisonis (Lp) and L. lanceolata (Ll) trees located in the state of Espírito Santo, Brazil.
Foods 12 04422 g001
Figure 2. Nutrients present in the leaves of L. pisonis and L. lanceolata trees. Means followed by the same letter in the column belong to the same group of averages based on the Scott–Knott group of averages test (p ≤ 0.05). ns = not significant.
Foods 12 04422 g002
Figure 3. Principal component analysis (PCA) of chestnut and leaf minerals (a,d); chestnut and soil at depth p1 (0–20 cm) (b,e), and chestnut and soil at depth p2 (0–40 cm) (c,f) for L. pisonis (ac) and L. lanceolata (df) trees. N, nitrogen; P, phosphorus; K, potassium; Ca, calcium; Mg, magnesium; Fe, iron; Zn, zinc; Cu, copper; Mn, manganese; S, sulfur; Se, selenium; pH, hydrogenionic potential in water; Al+3, exchangeable acidity; H + Al, potential acidity; C, carbon; Mo, organic matter; CTCt, effective cation exchange capacity; CTCT, cation exchange capacity; SB, sum of exchangeable bases; V, base saturation; ISNa, sodium saturation index for chestnut (C) and leaf (F).
Foods 12 04422 g003
Figure 4. Pearson’s correlation between N, P, K, Ca, Mg, Fe, Zn, Cu, Mn, and Se content, total phenolics in the tegument (TPt) and endosperm (TPe), anthocyanins in the tegument (At) and endosperm (Ae), flavonols in the tegument (FLt) and endosperm (FLe), condensed tannins in the tegument (CTt) and endosperm (CTe), as well as 2,2-diphenyl-1-picrylhydrazyl in the tegument (DPPHt) and endosperm (DPPHe) of nuts of L. pisonis (a) and L. lanceolata (b). Significance levels were * 5%, ** 1%, and *** 0.1%.
Foods 12 04422 g004
Figure 5. X-ray densitometry in nuts from L. pisonis trees (1, (a), 2 (b), 3 (c), 4 (d), 5 (e), and 6 (f)) and L. lanceolata (1 (g), 2 (h), 3 (i), 4 (j), 5 (k) and 6 (l)), starting in the apical region of the nut to the basal region (hilum).
Foods 12 04422 g005
Figure 6. Characteristics of oil from fresh chestnuts of L. pisonis (Lp, ae) and L. lanceolata (Ll, fj) cold extracted using a hydraulic press, analyzing the of initial and final nut mass (g), oil mass (g), oil yield (%), and oil Brix (%). * Means followed by the same lowercase letter do not differ from each other by Tukey’s test (p < 0.05). Bar: standard deviation.
Foods 12 04422 g006
Table 1. Fatty acid composition of Lecythis pisonis and Lecythis lanceolata oils.
tR (min)Fatty acidL. pisonis
123456
15.59Myristic acid (C14:0)11.01 ± 0.2311.50 ± 0.3412.10 ± 0.4012.70 ± 0.0312.00 ± 0.2213.00 ± 0.08
19.88Palmitic acid (C16:0)0.24 ± 0.030.20 ± 0.010.60 ± 0.340.30 ± 0.010.30 ± 0.010.40 ± 0.01
20.41Palmitoleic acid (C16:1)0.10 ± 0.01-0.10 ± 0.010.10 ± 0.010.10 ± 0.01-
22.19Margaric acid (C17:0)--0.10 ± 0.01---
22.71Heptadec-10-enoic acid (17:1)12.80 ± 0.086.50 ± 0.158.40 ± 0.0611.70 ± 0.0113.00 ± 0.117.60 ± 0.04
24.75Stearic acid (C18:0)36.50 ± 0.1641.60 ± 0.2552.40 ± 0.7738.90 ± 0.0540.20 ± 0.1644.80 ± 0.02
25.22Oleic acid (C18:1 n9c)37.70 ± 0.19 38.50 ± 0.2824.20 ± 0.0734.40 ± 0.0232.90 ± 0.0732.10 ± 0.01
25.46Vaccenic acid (C18:1 n11c)1.30 ± 0.051.30 ± 0.011.70 ± 0.091.30 ± 0.021.10 ± 0.011.60 ± 0.03
26.39Linoleic acid (C18:2 n6c)0.10 ± 0.030.10 ± 0.010.10 ± 0.010.20 ± 0.010.10 ± 0.010.20 ± 0.02
27.85Linolenic acid (C18:3)0.20 ± 0.050.20 ± 0.010.20 ± 0.030.40 ± 0.030.30 ± 0.010.30 ± 0.01
Total saturated fatty acids47.70 ± 0.2053.20 ± 0.1065.30 ± 0.3251.90 ± 0.2552.40 ± 0.0858.20 ± 0.07
Total monounsaturated fatty acids51.80 ± 0.1546.40 ± 0.1234.40 ± 0.2847.50 ± 0.4047.10 ± 0.0741.30 ± 0.08
Total polyunsaturated fatty acids0.40 ± 0.030.30 ± 0.020.30 ± 0.030.50 ± 0.010.50 ± 0.010.50 ± 0.02
S/U *0.91 ± 0.041.14 ± 0.011.88 ± 0.041.08 ± 0.011.10 ± 0.011.39 ± 0.03
tR (min)Fatty acidL. lanceolata
123456
15.59Myristic acid (C14:0)9.30 ± 0.169.70 ± 0.2310.30 ± 0.0311.60 ± 0.159.80 ± 0.188.20 ± 0.15
19.88Palmitic acid (C16:0)0.10 ± 0.010.10 ± 0.030.10 ± 0.01-0.10 ± 0.010.10 ± 0.03
20.41Palmitoleic acid (C16:1)----0.10 ± 0.01-
22.19Margaric acid (C17:0)------
22.71Heptadec-10-enoic acid (17:1)3.70 ± 0.204.70 ± 0.055.60 ± 0.015.10 ± 0.036.10 ± 0.055.30 ± 0.07
24.75Stearic acid (C18:0)45.90 ± 0.1745.10 ± 0.2132.70 ± 0.0531.80 ± 0.0844.00 ± 0.1150.50 ± 0.16
25.22Oleic acid (C18:1 n9c)39.40 ± 0.3238.60 ± 0.0149.50 ± 0.0650.50 ± 0.1038.50 ± 0.1334.40 ± 0.02
25.46Vaccenic acid (C18:1 n11c)1.40 ± 0.011.40 ± 0.011.40 ± 0.051.00 ± 0.031.20 ± 0.021.00 ± 0.01
26.39Linoleic acid (C18:2 n6c)-0.10 ± 0.030.10 ± 0.02-0.10 ± 0.010.10 ± 0.01
27.85Linolenic acid (C18:3)0.10 ± 0.010.20 ± 0.010.20 ± 0.02-0.20 ± 0.050.20 ± 0.03
Total saturated fatty acids55.40 ± 0.0154.90 ± 0.0143.10 ± 0.0243.40 ± 0.1053.96 ± 0.0858.80 ± 0.04
Total monounsaturated fatty acids44.50 ± 0.0544.80 ± 0.0156.60 ± 0.0356.60 ± 0.1045.80 ± 0.0940.80 ± 0.03
Total polyunsaturated fatty acids0.10 ± 0.010.30 ± 0.010.30 ± 0.0100.30 ± 0.010.30 ± 0.01
S/U *1.24 ± 0.011.22 ± 0.020.76 ± 0.010.77 ± 0.071.17 ± 0.011.43 ± 0.05
* S/U: saturated to unsaturated ratio.
Disclaimer/Publisher’s Note: The statements, opinions and data contained in all publications are solely those of the individual author(s) and contributor(s) and not of MDPI and/or the editor(s). MDPI and/or the editor(s) disclaim responsibility for any injury to people or property resulting from any ideas, methods, instructions or products referred to in the content.

