Abstract
Cinnamaldehyde (CA), a natural plant extract, possesses notable antimicrobial properties and the ability to inhibit mycotoxin synthesis. This study investigated the effects of different concentrations of gaseous CA on A. flavus and found that higher concentrations exhibited fungicidal effects, while lower concentrations exerted fungistatic effects. Although all A. flavus strains exhibited similar responses to CA vapor, the degree of response varied among them. Notably, A. flavus strains HN-1, JX-3, JX-4, and HN-8 displayed higher sensitivity. Exposure to CA vapor led to slight damage to A. flavus, induced oxidative stress, and inhibited aflatoxin B1 (AFB1) production. Upon removal of the CA vapor, the damaged A. flavus resumed growth, the oxidative stress weakened, and AFB1 production sharply increased in aflatoxin-producing strains. In the whole process, no aflatoxin was detected in aflatoxin-non-producing A. flavus. Moreover, the qRT-PCR results suggest that the recovery of A. flavus and the subsequent surge of AFB1 content following CA removal were regulated by a drug efflux pump and velvet complex proteins. In summary, these findings emphasize the significance of optimizing the targeted concentrations of antifungal EOs and provide valuable insight for their accurate application.
1. Introduction
As an infamous fungal species, Aspergillus flavus is prone to infecting cereal grains, nuts, and dried fruits, leading to substantial agricultural commodities losses [1,2]. Compounding this issue is the production of hazardous aflatoxins by A. flavus, which poses significant risks to both human and animal health [3,4]. Among these aflatoxins, aflatoxin B1 (AFB1) is the most mutagenic, teratogenic, and carcinogenic mycotoxin, classified as a group I carcinogen by the International Agency for Research on Cancer [5,6]. Therefore, it is necessary to carry out interventions to prevent A. flavus growth and aflatoxin contamination in food and feed.
Over the past decades, chemicals have been used to inhibit spoilage microorganisms’ growth and the toxic metabolites’ synthesis. However, this measure has faced substantial criticism due to its significant contribution to drug resistance, adverse effects on human health, and environmental pollution [7,8,9]. Thus, it is now urgent to find and develop environment-friendly alternatives. Essential oils (EOs), a kind of natural plant extract, possess broad-spectrum antimicrobial, insecticidal, and antioxidant properties [10,11,12]. In addition, EOs have been classified as Generally Recognized as Safe (GRAS) by the FDA [13]. Due to the hydrophobicity and low solubility of EOs, the required dose of liquid EOs in practical application is often a higher concentration, which will influence the sensory quality of the final product [14,15]. In contrast, gaseous EO treatment exhibits enhanced antimicrobial effects compared to liquid EOs and offers a promising method to diminish the usage of EOs while preserving their efficacy.
EOs have high volatility, resulting in a gradual decrease in their concentration during application. It is reported that EO treatment intensity, in terms of the time or concentration, affects antimicrobial activities [16,17]. Cinnamaldehyde (CA), a natural aldehyde extracted from plants, possesses prominent antifungal properties and can effectively inhibit both A. flavus growth and aflatoxin production [18,19]. Previous research from our team showed that the damage of highly aflatoxin-producing A. flavus caused by insufficient CA vapor treatment recovered with the disappearance of CA [20]. It is worth noting that different A. flavus strains, especially those aflatoxin-producing and aflatoxin-non-producing strains, exhibit diverse stress-response patterns [17]. Consequently, the regulation mechanisms of growth recovery in different A. flavus strains after EO removal also be different. It is necessary to investigate the regulatory responses of different A. flavus strains throughout the entire process of gaseous EO treatment, from initial exposure to eventual dissipation.
The objectives of this study were to investigate the sensitivity patterns of different A. flavus isolates to CA vapor treatment and analyze the temporal dynamics of aflatoxin production and oxidative stress response. By exploring the expression of relevant genes, we aimed to gain a preliminary understanding of the molecule regulatory mechanisms underlying the response of A. flavus to gaseous CA, which can be utilized to optimize the treatment intensities of CA and explore the action target of CA for the mitigation of A. flavus and aflatoxin contamination and its associated risks.
2. Materials and Methods
2.1. Materials
CA and AFB1 standards were obtained from Shanghai Yuanye Bio-Technology Co., Ltd. (Shanghai, China). Potato dextrose agar (PDA) was purchased from Qingdao Hope Bio-Technology Co., Ltd. (Qingdao, China). All chemicals were analytical reagents.
2.2. A. flavus Isolation and Identification
All A. flavus strains were isolated from paddy samples collected from three provinces (Jiangxi, Henan, and Fujian) in southern China. Briefly, aliquots of 10 g of paddy samples and 90 mL of a sterile saline solution were transferred aseptically to a stomacher bag. The mixture was homogenized and shaken for 5 min to prepare spore suspensions. After the prepared spore suspensions underwent 1:10 serial dilutions, the spore suspensions with different concentrations were spread onto PDA plates and cultivated at 28 °C for 7 days. The colonies with yellow and green spores on the PDA plates were selected and purified to obtain single colonies.
The isolates were identified by amplifying and sequencing the calmodulin genes, the primers of which were CL1 and CL2A, as listed in Table 1 [21]. The PCR conditions were: initial denaturation at 94 °C for 5 min, reaction cycles of 94 °C for 30 s, 54 °C for 30 s, 72 °C for 90 s, and final elongation for 7 min at 72 °C. The amplified product was sequenced by Sangon Biotech (Shanghai) Co., Ltd. (Shanghai, China). The sequencing results were then compared against the NCBI database using the nucleotide BLAST program (https://blast.ncbi.nlm.nih.gov/Blast.cgi?PROGRAM=blastn&PAGE_TYPE=BlastSearch&LINK_LOC=blasthome (accessed on 24 October 2023)) to identify A. flavus [22].
Inoculum conidia were collected from a 7-day-old fungal strain grown on the PDA plates by adding a sterile 0.85% NaCl solution, and the surface of the mycelium was rubbed using a sterile L-shaped spreader. The final concentration of the spore suspensions was adjusted to approximately 1.0 × 10⁶ spores/mL using a hemacytometer.
2.3. Determination of the AFB1 Production Ability
The AFB1 production ability of the A. flavus isolates was measured according to the method of [23], with slight modifications. All A. flavus isolates were cultured on PDA plates individually at 28 °C for 7 days. Three 6 mm diameter plugs were excavated from each sample using an Oxford Cup and put into brown centrifuge tubes. Then, 2 mL of high-performance liquid chromatography (HPLC)-grade extraction solvent (methanol/water, 7:3, v/v) was added. After ultrasonic extraction for 20 min, centrifugation was conducted at 6000 rpm for 10 min, and the supernatant was pipetted into fresh tubes and evaporated by N2 flow. The derivatization procedure was carried out by adding 200 μL hexane and 100 μL of trifluoroacetic acid to the residue. The mixture was vortexed for 30 s and left at 40 °C for 15 min. Next, the entire contents continued to be evaporated by N2 flow. A mobile phase (methanol/water/acetonitrile, 3:6:1, v/v) was used to redissolve the residue, and the mixture was vortexed for 30 s. After being filtered by nylon filters (13 mm × 0.22 μm), the filtrate was collected into amber-silanized vials to carry out HPLC analysis. The AFB1 standard was dissolved by a mobile phase to prepare a standard solution. A standard curve can be prepared by measuring the AFB1 content in standard solutions. The HPLC system used for the AFB1 analyses was an Agilent 1260 series system (Agilent Technologies Co., Ltd., Palo Alto, CA, USA) equipped with a fluorescence detector (FLD). The excitation wavelength and emission wavelength were, respectively, 365 nm and 464 nm. The stationary phase was a C18 column (Phenomenex Luna 5 μm, 150 × 4.6 mm). The mobile phase mentioned above was used, the flow was 1 mL/min, and the run time was 15 min.
2.4. CA Vapor Sensitivity Testing
Certain isolates were specifically chosen to encompass a diverse range of A. flavus with varying abilities to produce AFB1. Four representative isolates of aflatoxin-producing A. flavus (JX-3, JX-4, FJ-5, and HN-8) and four representative isolates of aflatoxin-non-producing A. flavus (JX-1, JX-2, FJ-4, and HN-1) were selected for the subsequent test. Aliquots of 10 μL A. flavus spore suspension were inoculated on PDA plates by the point inoculation method and incubated at 28 °C for 3 days. Then, filter papers containing CA were pasted on the inner cover of Petri dishes. The concentrations of the CA vapor were, respectively, 0, 0.1, 0.2, 0.4, 0.6, 0.8, and 1.6 μL/mL, which were speculated by dividing the volume of the remaining air in the Petri dishes by the amount of CA. Parafilm (Bemis, Neenah, WI, USA) was used to seal the plates. After 12 h of incubation, the morphological changes and colony diameters of the recovered A. flavus were recorded to assess the CA vapor sensitivity of the A. flavus strains. The treatment groups with less recovered hyphae and slower growth rates were considered to be more sensitive.
The recovery of A. flavus was determined according to the method described by [24], with minor modifications. After 12 h of treatment, new sterile covers were used to take the place of the covers containing the antifungal atmosphere, and the A. flavus continued to cultivate for 3 days. Morphological changes in the A. flavus at different stages were observed and photographed. The groups with and without CA vapor treatment were treated as the control (C) and treatment (T) groups, respectively, while the groups treated with cover displacement were treated as the recovery (R) group.
The colony diameters were determined according to the method of Wang et al. [25], with minor modifications. Treated and untreated spores were acquired by washing the plates with sterile saline solutions. Then, 10 μL spore suspensions were added to the PDA plate centers and then cultured at 28 °C. The colony diameter was determined every day during the incubation period (7 days) using the cross method.
2.5. AFB1 Production Analysis after CA Vapor Treatment
Spore suspensions (10 μL) were inoculated in the center of the PDA plates. After 3 days of incubation, CA was dripped onto sterile filter papers taped onto the plate cover’s inner center. Based on the results of the sensitivity testing, a CA concentration of 0.4 μL/mL was selected for subsequent experiments to explore the damage and recovery of different A. flavus strains in response to CA. These plates were wrapped with parafilm and cultured for 12 h. Then, the plate covers were replaced with sterile covers, and incubation was continued for 3 days. The AFB1 contents in the C, T, and R groups were measured as described above.
2.6. Evaluation of Oxidative Stress Response
2.6.1. Measurement of Reactive Oxygen Species (ROS)
The level of ROS was detected following the directions of the Reactive Oxygen Species Assay Kit (Beyotime Biotechnology, Shanghai, China). Firstly, the mycelia in the C, T, and R groups were stained with a 10 μM DCFH-DA probe. After incubation at 37 °C for 20 min, the mycelia were washed with PBS three times, fixed on slides, and then their fluorescence intensity was observed with a fluorescent microscope. The fluorescence intensity represents the contents of ROS.
2.6.2. Measurement of Catalase (CAT) and Superoxide Dismutase (SOD) Activities
A. flavus mycelia were homogenized in cold PBS (0.01 mol/L and pH = 7.4) and centrifuged at 15,000× g for 10 min at 4 °C to obtain the supernatant [16]. According to the instructions of the Catalase Assay Kit and Total Superoxide Dismutase Assay Kit with WST-8 (Beyotime Biotechnology, Shanghai, China), CAT and SOD in the supernatant were determined by a spectrophotometer at wavelengths of 520 nm and 450 nm. The activity of CAT was determined by calculating the amount of H2O2 catalyzed by CAT in the sample converted into H2O and O2 in units of time and units of volume. The activity of SOD had a negative correlation with the amount of formazan dye converted by WST-8, which was obtained by the colorimetric analysis of a WST-8 product.
2.6.3. Measurement of Malondialdehyde (MDA) Content
A Lipid Peroxidation MDA Assay Kit (Beyotime Biotechnology, Shanghai, China) was used based on the manufacturer’s protocol to determine the content of MDA. The reaction between MDA and thiobarbituric acid (TBA) produces red products. The absorbance was measured by a spectrophotometer at a wavelength of 532 nm, and the MDA content was calculated through a standard curve.
2.7. RNA Extraction
The total RNA was extracted by the Trizol method. Mycelia growing for three days and continuing to grow for three days after CA removal were collected and grounded with liquid nitrogen. Then, 1 mL of Trizol reagent was added to the mycelia and incubated for 15 min. Then, 200 μL chloroform was added and vortexed 15 s. After 5 min of incubation, centrifugation was conducted at 4 °C, 12,000 rpm for 15 min. Following centrifugation, the mixture was divided into three phases, and the upper transparent aqueous phase contained the RNA. An aliquot of 400 μL of aqueous phase was transferred to a fresh RNase-free tube, mixed with 400 μL isopropyl alcohol, and placed for 10 min. The RNA precipitate, which is often invisible before centrifugation, formed a pellet on the side and bottom of the tube after centrifugation. Removing the supernatant, the RNA pellet was mixed with 1 mL of 75% ethanol and recollected by centrifugation at 4 °C, 10,000 rpm for 5 min. This step was repeated once. At the end of the procedure, the RNA pellet was first dried and then dissolved in RNase-free water.
The concentration and purity of the RNA were appraised using a NanoDrop 2000 spectrophotometer (Thermo Scientific, Waltham, MA, USA). The integrity of the RNA was appraised by agarose gel and a gel imaging system (Tianneng Instrument Co., Ltd., Shanghai, China).
2.8. qRT-PCR Analysis
Reverse transcription and qRT-PCR were both carried out using a kit (Vazyme Biotech Co., Ltd., Nanjing, China) according to the manufacturer’s directions. The reaction for reverse transcription was conducted at 37 °C for 15 min and then at 85 °C for 5 s. Totals of 10 μL 2 × ChamQ SYBR qPCR Master Mix, 2 μL cDNA, 0.8 μL primer, and 7.2 μL RNase-free ddH2O existed in the qRT-PCR reaction volumes. The specific primers used in the qRT-PCR are listed in Table 1. The qRT–PCR program included an initial denaturation at 95 °C for 30 s and cyclic reactions of 95 °C for 10 s, 60 °C for 30 s, 95 °C for 15 s, 60 °C for 60 s, and 95 °C for 15 s. The 2−ΔΔCt method was used to determine the relative quantification of a target gene by comparing it with a reference gene [26].

Table 1.
Primers used for qRT-PCR.
Table 1.
Primers used for qRT-PCR.
| Gene | Forward Primer (5′–3′) | Reverse Primer (5′–3′) | Reference |
|---|---|---|---|
| Actin | ACGGTGTCGTCACAAACTGG | CGGTTGGACTTAGGGTTGATAG | [27] |
| CL1/CL2A | GARTWCAAGGAGGCCTTCTC | TTTTTGCATCATGAGTTGGAC | [21] |
| laeA | GAAAGGTTGCTCGCTGGTA | GAACGCCTCCGACTTGACT | This study |
| velB | GTAGACTTGTGGAACGCAGAG | AGAGGACATAGCCGTGGAT | This study |
| vosA | GTGGGAAAGAGAAAGAACGC | GCAGCACATAAAATAATAGGGACT | [18] |
| fnx1 | AGGCAAGTCTCCGAGTGAA | CCGAAGATTAGCCAAAACC | This study |
| mdrA | TTGCTTGTGTGCCTTTTCCCTT | TCCCCAAATCCTGTCCTCCAT | This study |
| FLU1 | ATTCTTGGCTTCGCTTTTGGA | GCGGCGGTATTCTTGCTTGTT | This study |
2.9. Statistical Analysis
All data were recorded as the mean ± SD of three independent replicates. Statistical analyses and graph drawing were conducted using GraphPad Prism 9.4 software. Student’s t-test and one-way ANOVA were used to evaluate the differences among the data in the different groups. Differences were considered significant at p < 0.05.
3. Results
3.1. Fungal Strain Identification
The A. flavus isolates were initially screened by their morphology, further confirmed by comparing the calmodulin sequences of these isolates using the BLAST algorithm, and identified as A. flavus strains. The AFB1 production ability of the A. flavus isolates was determined by HPLC. According to these results, these isolates can be categorized into aflatoxin-producing A. flavus and aflatoxin-non-producing A. flavus. Among them, A. flavus JX-1, JX-2, FJ-4, and HN-1 were unable to produce this aflatoxin, while A. flavus JX-3, FJ-5, HN-8, and JX-4 were capable of producing AFB1, and their production rates were, respectively, 902.02, 256.03, 133.263, and 100.88 ng/mL (Figure 1). A. flavus JX-3 showed the highest AFB1 production ability.
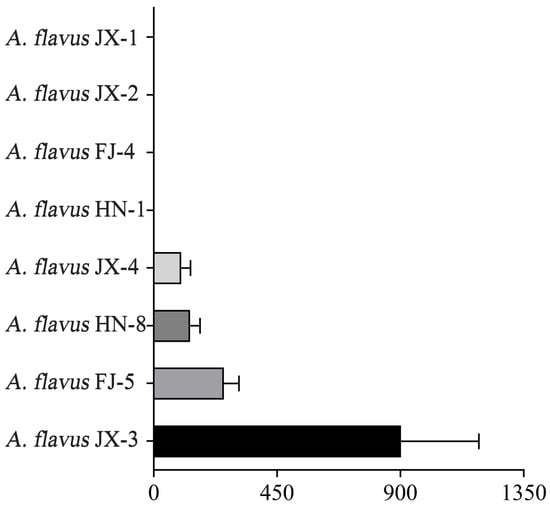
Figure 1.
Columns with different lengths represent the production of AFB1.
3.2. CA Vapor Sensitivity Patterns of A. flavus
All A. flavus strains were sensitive to CA vapor, with their growth being inhibited in a concentration-dependent manner. With the increase in the concentration of CA vapor, the damage degree of A. flavus increased, resulting in a slower growth rate of the treated spores (Figure 2a,b, Figures S1a,b, S2a,b, and S3a,b). In most cases, the colony diameter of the spores treated with 0.4 μL/mL CA was significantly different from that of the untreated spores and spores treated with 0.8 μL/mL CA vapor during the same incubation time. After being treated with a gaseous CA concentration of 1.6 μL/mL, all spores of A. flavus lost their ability to grow. It was observed that different isolates of A. flavus presented varying sensitivities to gaseous CA. Specifically, after being treated with a CA concentration of 0.6 μL/mL, the spores of A. flavus HN-1, JX-3, and JX-4 did not exhibit any growth on the first day, indicating a higher level of sensitivity compared to the other five isolates of A. flavus.
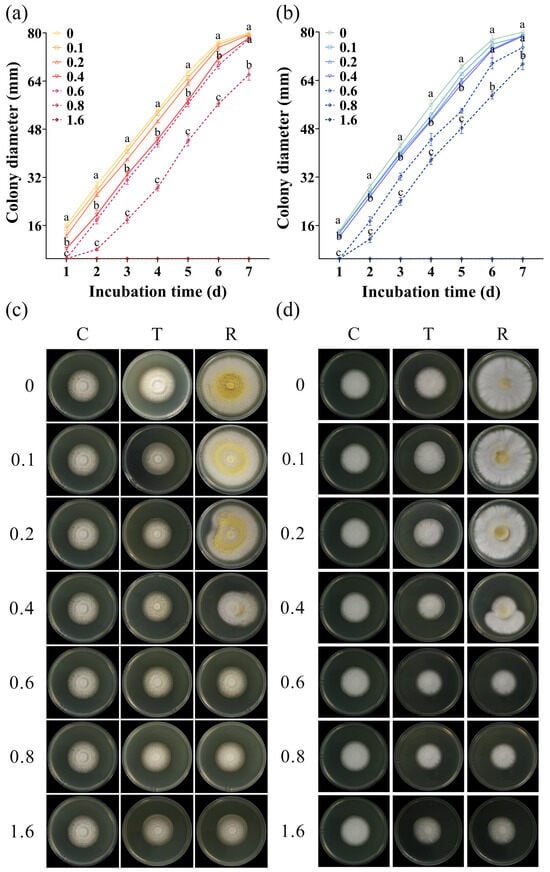
Figure 2.
CA vapor sensitivity patterns representative of A. flavus. Growth curves (a,b) and morphological changes (c,d) of aflatoxin-producing A. flavus JX-3 and aflatoxin-non-producing A. flavus HN-1. C—control group, T—group treated with CA vapor for 12 h, R—group with CA vapor that disappeared after 12 h treatment. The concentrations of the CA vapor were 0, 0.1, 0.2, 0.4, 0.6, 0.8, and 1.6. The colony diameters of spores treated by 0, 0.4, and 0.8 μL/mL CA vapor were selected as typical representatives. Values in the same incubation time with different lowercase letters are significantly different (p < 0.05).
The morphological changes in the A. flavus strains are shown in Figure 2c,d, Figures S1c,d, S2c,d, and S3c,d. When the CA vapor was removed, the previously inhibited A. flavus resumed growth. Notably, all isolates of A. flavus recovered after CA removal when the concentration of the CA vapor was below 0.4 μL/mL. At a concentration of 0.4 μL/mL, all A. flavus recovered slightly. Meanwhile, an observation of the colony sizes revealed that A. flavus JX-3, JX-4, HN-1, and HN-8 showed relatively poor recovery ability. After treatment with 0.6 and 0.8 μL/mL gaseous CA, partial recovery of A. flavus was observed. CA vapor at a concentration of 1.6 μL/mL completely inhibited the growth of A. flavus. Among the tested concentrations, the experimental results were found to be the most consistent and stable when the concentration of CA vapor was set at 0.4 μL/mL. Thus, considering the sensitivity of eight A. flavus isolates to CA comprehensively, 0.4 was selected as the CA concentration for subsequent experiments.
3.3. AFB1 Production Analysis after CA Vapor Treatment
Gaseous CA treatment had an inhibitory effect on AFB1 synthesis in aflatoxin-producing A. flavus JX-3 and JX-4, as evidenced by a decrease in the AFB1 levels compared to the control group. However, after the removal of the CA vapor, a sharp increase in AFB1 synthesis was observed in these strains (Figure 3), which were as high as 1439 ng/mL and 1347 ng/mL, respectively. AFB1 of aflatoxin-producing A. flavus FJ-5 and HN-8 was not detected in either the group in which A. flavus grew for three days or the group in which the A. flavus was continuously treated with CA vapor for 12 h. During the entire period of the CA vapor treatment and removal, aflatoxin-non-producing A. flavus JX-1, JX-2, FJ-4, and HN-1 did not produce AFB1.
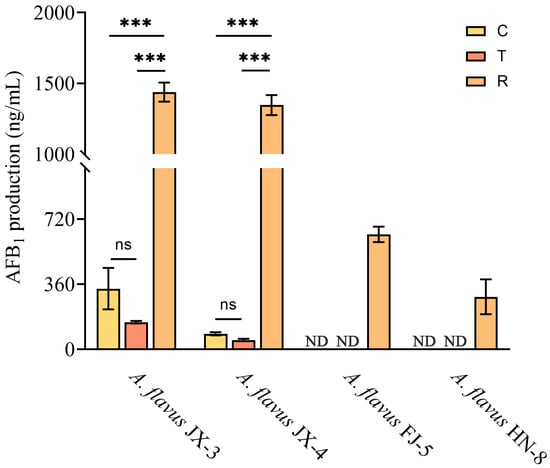
Figure 3.
AFB1 production analysis after CA vapor treatment in aflatoxin-producing A. flavus. ND indicates that AFB1 was not detected in this group; ns—no significant differences. *** p < 0.001. C—control group, T—group treated with CA vapor for 12 h, R—group with CA vapor that disappeared after 12 h treatment.
3.4. Evaluation of Oxidative Stress Response in A. flavus
The responses of aflatoxin-producing A. flavus and aflatoxin-non-producing A. flavus to oxidative stress were similar. Fluorescence microscope observation showed that the green fluorescence of A. flavus in the T group was obvious and continuous. (Figure 4 and Figures S4–S6). In contrast, the fluorescence intensity of A. flavus was weaker in the R group, whereas the mycelia were not stained in the C group.
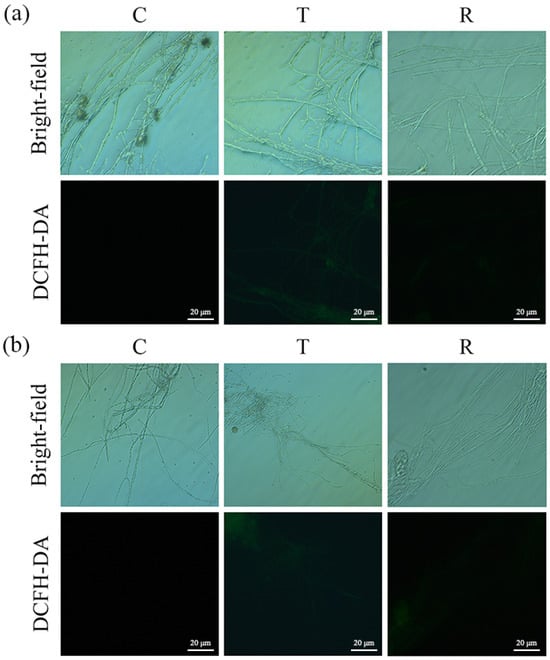
Figure 4.
Changes in ROS in A. flavus JX-3 (a) and A. flavus HN-1 (b). C—control group, T—group treated with CA vapor for 12 h, R—group with CA vapor that disappeared after 12 h treatment.
The activities of CAT and SOD (Figure 5 and Figures S7–S9) were found to be increased in the T group as compared to the C group. The activities of these antioxidant enzymes in A. flavus were reduced after CA removal. Likewise, gaseous CA caused a substantial increase in the MDA levels in A. flavus cells (Figure 5 and Figures S7–S9). The content of MDA returned to normal levels in the R group.
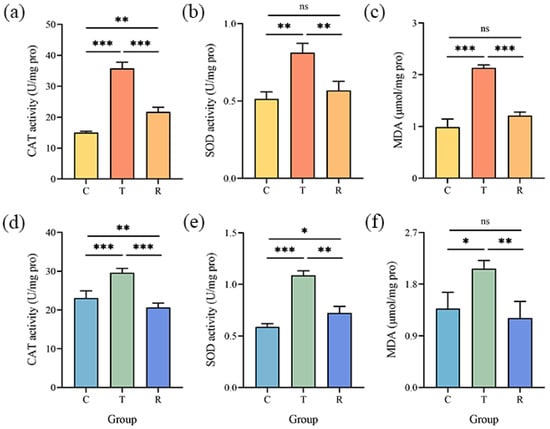
Figure 5.
Changes in CAT (a,d), SOD (b,e) activities, and MDA content (c,f) in A. flavus JX-3 (upper panel) and A. flavus HN-1 (lower panel); ns, no significant differences. * p < 0.05, ** p < 0.01, *** p < 0.001. C—control group, T—group treated with CA vapor for 12 h, R—group with CA vapor that disappeared after 12 h treatment.
3.5. Effects of CA Vapor on Velvet Complex Proteins and Drug Efflux Pump Gene Expression
The gene expression profiles of velvet complex proteins were down-regulated in both the aflatoxin-producing and aflatoxin-non-producing A. flavus, while the expressions of three velvet complex protein genes at different A. flavus strains had varied levels (Figure 6). Gene expression increase was determined in terms of the drug efflux pumps. However, there was wide variation in the expression levels of the drug efflux pumps in different A. flavus strains, and in some instances, the expression of certain genes was not detected.
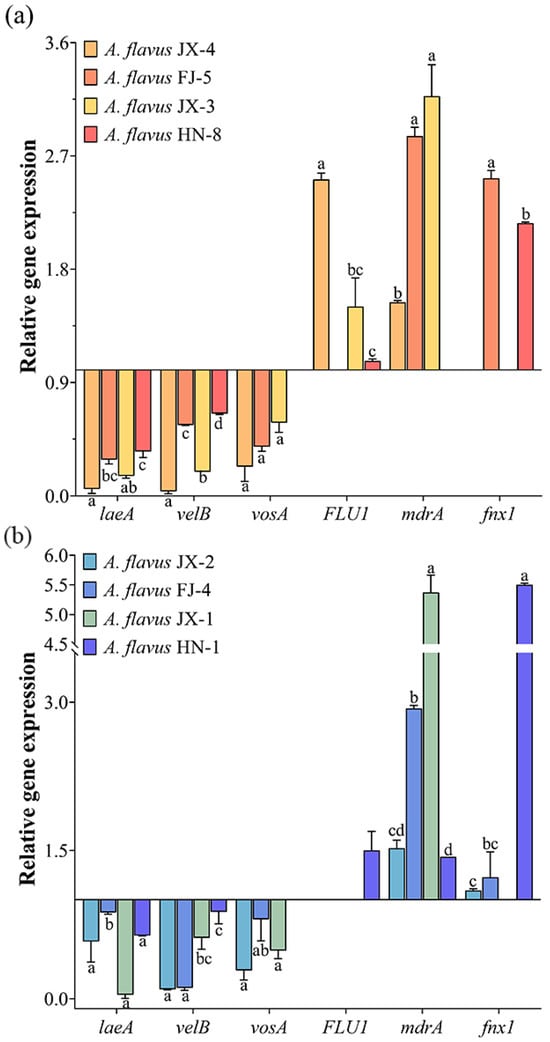
Figure 6.
Effects of CA vapor on velvet complex proteins and drug efflux pump gene expression in aflatoxin-producing A. flavus (a) and aflatoxin-non-producing A. flavus (b). Different lowercase letters indicate significant differences (p < 0.05).
4. Discussion
EOs possess excellent antimicrobial properties against food-related microorganisms, which have been widely reported [28,29,30]. Depending on the specific doses utilized, EOs exhibit fungicidal or fungistatic effects on fungi [31,32,33]. Due to their high volatility, the concentration of EOs will gradually decrease or even disappear during the course of actual usage. Therefore, impaired fungi can recover growth after the elimination of a low-intensity EO treatment. Růžička et al. [34] reported that the growth of yeasts was completely inhibited when the concentrations of monocaprin were 150–200 mg/L, while the growth of the most filamentous fungi was inhibited at concentrations of 100–400 mg/L. Consistent with these findings, this study observed that a high concentration of CA vapor completely prevented the growth of A. flavus, while A. flavus treated with low-concentration CA vapor recovered growth after CA removal. These results were found in both aflatoxin-producing and aflatoxin-non-producing A. flavus strains. The observed effect persisted regardless of the removal of the antifungal environment or the transfer of spores to a new environment. Therefore, the inhibitory effect of gaseous CA on A. flavus growth could be attributed to the interference of the metabolism process of A. flavus. However, it is worth noting that the sensitivity pattern of A. flavus to CA vapor varied from different Aspergillus strains, among which A. flavus JX-3, JX-4, HN-1, and HN-8 showed high sensitivity to CA vapor.
Based on previous research, EOs have demonstrated the ability to inhibit mycotoxin production [35,36,37]. However, these studies have primarily paid more attention to the persistent treatment process and have overlooked the possibility of the incomplete eradication of fungi. It is important to consider that residual fungal presence may pose a continued risk of mycotoxin contamination. In this work, gaseous CA treatment was found to effectively inhibit the production of AFB1. Nevertheless, the synthesis of AFB1 in all aflatoxin-producing A. flavus strains increased sharply once the CA vapor was removed. Therefore, it is of great importance to completely inhibit the growth of A. flavus in practical applications by using high-intensity EO treatment. In addition, aflatoxin was not detected in aflatoxin-producing A. flavus FJ-5 and HN-8 after three days of growth. By contrast, A. flavus JX-3 and JX-4 were capable of accumulating aflatoxin during the early growth stage, thereby amplifying the potential harm associated with mycotoxin contamination.
The velvet complex, formed by a combination of veA, velB, vosA, and laeA, serves as a global regulator in the secondary metabolism of fungi [38,39]. Kale et al. [40] found that the deletion of Laea in A. flavus generated the deficiency of aflatoxin synthesis, with restoration observed in complemented strains. Bayram et al. [41] demonstrated the absence of detectable aflatoxin production in Aspergillus nidulans strains with deletions of either velB or veA. Wang et al. [42] reported a decrease in aflatoxin content with increasing expression levels of the laeA and velB genes in A. flavus treated with CA. Consistent with previous findings, a good correlation was observed between the increased AFB1 content and the downregulation of the laeA, velB, and vosA genes. It is worth noting that aflatoxin-non-producing A. flavus also showed the same gene expression pattern. Previous research by our team found no correlation between the sharp increase in AFB1 in recovered A. flavus JX-3 and the two key regulators, aflR and aflS, involved in aflatoxin biosynthesis [18]. Therefore, it is comprehensively predicted that the velvet complex influences the structural genes of AFB1 synthesis through global regulation, leading to the elevation of aflatoxin production.
A burst of ROS is often regarded as a sign of apoptosis and can easily disturb cellular oxygen metabolism and induce oxidative stress [43,44]. Studies have reported that oxidative stress in cells may enhance the activity of antioxidant enzymes, which in turn alleviates the damage of ROS to cells [45,46]. CAT and SOD are important antioxidant enzymes involved in cellular defense mechanisms. SOD converts superoxide radicals to H2O2, which is then decomposed by CAT [47]. In the present study, gaseous CA treatment led to the accumulation of ROS, accompanied by a corresponding increase in antioxidant enzyme activities. The observed variations in the ROS levels and antioxidant enzyme response were found to be associated with the differences among the A. flavus strains and treatment conditions. The heightened CAT and SOD activities observed in the T group suggest activation of the defense system against oxidative damage. After the CA vapor was removed, the ROS in the A. flavus significantly decreased, while antioxidant enzyme activities returned to normal levels, suggesting the cessation of the defense mechanism. In the same group, the levels of ROS contents and antioxidant enzymes among different A. flavus strains were also different. Cells often undergo membrane lipid peroxidation when exposed to a large amount of ROS [48,49]. MDA, as one of the important products of lipid peroxidation [45,50], is also produced subsequently. The substantial increase in the MDA levels following the gaseous CA treatment further confirms the induction of oxidative stress in A. flavus cells. The subsequent normalization of MDA content in the R group indicates the restoration of cellular homeostasis.
Previous studies have shown that fungi can diminish drug levels by activating drug efflux transporters and enhancing the exogenous detoxification ability to alleviate unfavorable growth situations [51,52]. The drug efflux pumps in fungi are divided into two categories: significant facilitator superfamily transporters (MFS) and ATP-binding cassette (ABC) transporters [53]. It was reported that a large proportion of genes belonging to MFS were up-regulated in Penicillium digitatum treated by the compound nanoemulsion [54]. In this study, the expressions of genes FLU1, mdrA, and fnx1, which are related to drug efflux pumps, were examined by qRT-PCR. On the whole, the colony diameter of A. flavus in the recovery group was positively correlated with the up-regulation of the drug efflux protein gene. For example, the colony was larger in the recovered aflatoxin-producing A. flavus JX-4 and FJ-5 and the aflatoxin-non-producing A. flavus FJ-4 and JX-1. Therefore, it can be inferred that the recovery of A. flavus after the removal of CA could be ascribed to the persistent up-regulation of multidrug resistance gene expression.
Through the above experimental findings, it was observed that all strains of A. flavus showed comparable responses to the existence and disappearance of CA vapor. However, the levels of tolerance to oxidative stress between the aflatoxin-producing and aflatoxin-non-producing A. flavus strains were different, and generally aflatoxin-producing A. flavus strains tolerate higher oxidation levels [55,56]. For example, Narasaiah et al. [57] showed that the activities of xanthine oxidase and free radical scavenging enzymes (SOD and GSH-Px) in aflatoxin-producing A. flavus increased compared to the aflatoxin-non-producing strain in the presence of H2O2. However, Fountain et al. [58] found that most toxigenic isolates were able to tolerate higher concentrations of H2O2 in toxin-conducive media, while there were also certain toxigenic isolates that exhibited comparable tolerance levels to those of the atoxigenic isolates in their study. Probst et al. [59] found that the addition of H2O2 to aflatoxin-non-conducive YEP medium induced the production of ROS, while a decrease in aflatoxin production did not significantly impact the level of ROS. Similarly, in this study, some aflatoxin-producing A. flavus possessed strong levels of oxidative stress tolerance and damage repair capacity, while others demonstrated weaker responses. Therefore, it is likely that the extent of tolerance to oxidative stress caused by CA among A. flavus isolates could also be modulated by additional crucial factors unrelated to aflatoxin production, which needs to be further studied.
5. Conclusions
In this study, the sensitivity and response patterns of different A. flavus isolates to CA vapor were investigated. It was found that high-intensity CA vapor treatment exerted fungicidal effects, while mild treatment exerted fungistatic effects and allowed for growth recovery after CA vapor removal. CA vapor revealed an inhibitory effect on AFB1 synthesis. Exposure to CA vapor also led to the accumulation of endogenous ROS in A. flavus, along with increased activity of antioxidant enzymes and the content of MDA. However, upon the removal of CA vapor, there was a sharp increase in the AFB1 content in the recovered A. flavus, and the levels of ROS and MDA, as well as the activities of CAT and SOD, returned to their original levels. Notably, different A. flavus strains exhibited similar changes in the oxidative stress induced by CA vapor, albeit with varying degrees of response. Furthermore, the utilization of qRT-PCR highlighted the regulatory role of drug efflux proteins and velvet complex proteins in the recovery of A. flavus and the subsequent sharp increase in AFB1 content following CA removal. These results emphasize the importance of applying a sufficiently intense treatment of EOs to completely inhibit the recovery of A. flavus and the subsequent increase in mycotoxin production, which provide valuable theoretical guidance for the practical application of EOs in controlling A. flavus contamination and mycotoxin formation.
Supplementary Materials
The following supporting information can be downloaded at: https://www.mdpi.com/article/10.3390/foods12234311/s1.
Author Contributions
A.N.: Conceptualization, methodology, investigation, data curation, writing—original draft. L.T.: Validation, investigation, resources. S.T.: Investigation, visualization. G.W.: Conceptualization, writing—review and editing, supervision. W.Q.: Writing—review and editing, supervision, project administration. All authors have read and agreed to the published version of the manuscript.
Funding
This research was funded by the National Natural Science Foundation of China (grant number 32272439) and the Natural Science Foundation of Jiangsu Province (grant number BK20221346).
Data Availability Statement
The data used to support the findings of this study can be made available by the corresponding author upon request.
Acknowledgments
We thank the Qinglan Project of the Jiangsu Higher Education Institutions, the Priority Academic Program Development of Jiangsu Higher Education Institutions, and the Joint Laboratory for International Cooperation in Grain Circulation and Security for their support.
Conflicts of Interest
The authors declare no conflict of interest.
References
- Mateo, E.M.; Gómez, J.V.; Gimeno-Adelantado, J.V.; Romera, D.; Mateo-Castro, R.; Jiménez, M. Assessment of azole fungicides as a tool to control growth of Aspergillus flavus and aflatoxin B1 and B2 production in maize. Food Addit. Contam. Part A 2017, 34, 1039–1051. [Google Scholar] [CrossRef] [PubMed]
- Taniwaki, M.H.; Pitt, J.I.; Magan, N. Aspergillus species and mycotoxins: Occurrence and importance in major food commodities. Curr. Opin. Food Sci. 2018, 23, 38–43. [Google Scholar] [CrossRef]
- Xing, F.; Ding, N.; Liu, X.; Selvaraj, J.N.; Wang, L.; Zhou, L.; Zhao, Y.; Wang, Y.; Liu, Y. Variation in fungal microbiome (mycobiome) and aflatoxins during simulated storage of in-shell peanuts and peanut kernels. Sci. Rep. 2016, 6, 25930. [Google Scholar] [CrossRef]
- Rushing, B.R.; Selim, M.I. Aflatoxin B1: A review on metabolism, toxicity, occurrence in food, occupational exposure, and detoxification methods. Food Chem. Toxicol. 2019, 124, 81–100. [Google Scholar] [CrossRef] [PubMed]
- Caceres, I.; Khoury, A.A.I.; El Khoury, R.; Lorber, S.; Oswald, I.P.; El Khoury, A.; Atoui, A.; Puel, O.; Bailly, J.-D. Aflatoxin Biosynthesis and Genetic Regulation: A Review. Toxins 2020, 12, 150. [Google Scholar] [CrossRef] [PubMed]
- Roze, L.V.; Hong, S.-Y.; Linz, J.E. Aflatoxin Biosynthesis: Current Frontiers. Annu. Rev. Food Sci. Technol. 2013, 4, 293–311. [Google Scholar] [CrossRef]
- Avanço, G.B.; Ferreira, F.D.; Bomfim, N.S.; Santos, P.A.D.S.R.D.; Peralta, R.M.; Brugnari, T.; Mallmann, C.A.; Filho, B.A.A.; Mikcha, J.M.G.; Machinski, M., Jr. Curcuma longa L. essential oil composition, antioxidant effect, and effect on Fusarium verticillioides and fumonisin production. Food Control 2017, 73, 806–813. [Google Scholar] [CrossRef]
- Singh, P.; Shukla, R.; Prakash, B.; Kumar, A.; Singh, S.; Mishra, P.K.; Dubey, N.K. Chemical profile, antifungal, antiaflatoxigenic and antioxidant activity of Citrus maxima Burm. and Citrus sinensis (L.) Osbeck essential oils and their cyclic monoterpene, dl-limonene. Food Chem. Toxicol. 2010, 48, 1734–1740. [Google Scholar] [CrossRef] [PubMed]
- Tang, X.; Shao, Y.-L.; Tang, Y.-J.; Zhou, W.-W. Antifungal Activity of Essential Oil Compounds (Geraniol and Citral) and Inhibitory Mechanisms on Grain Pathogens (Aspergillus flavus and Aspergillus ochraceus). Molecules 2018, 23, 2108. [Google Scholar] [CrossRef] [PubMed]
- Liu, F.; Jin, P.; Sun, Z.; Du, L.; Wang, D.; Zhao, T.; Doyle, M.P. Carvacrol oil inhibits biofilm formation and exopolysaccharide production of Enterobacter cloacae. Food Control 2021, 119, 107473. [Google Scholar]
- Lang, G.; Buchbauer, G. A review on recent research results (2008–2010) on essential oils as antimicrobials and antifungals. A review. Flavour Frag. J. 2012, 27, 13–39. [Google Scholar]
- Bakkali, F.; Averbeck, S.; Averbeck, D.; Idaomar, M. Biological effects of essential oils—A review. Food Chem. Toxicol. 2008, 46, 446–475. [Google Scholar] [PubMed]
- Prakash, B.; Kedia, A.; Mishra, P.K.; Dubey, N.K. Plant essential oils as food preservatives to control moulds, mycotoxin contamination and oxidative deterioration of agri-food commodities—Potentials and challenges. Food Control 2015, 47, 381–391. [Google Scholar]
- Niu, A.; Wu, H.; Ma, F.; Tan, S.; Wang, G.; Qiu, W. The antifungal activity of cinnamaldehyde in vapor phase against Aspergillus niger isolated from spoiled paddy. LWT 2022, 159, 113181. [Google Scholar]
- Nadjib, B.M.; Amine, F.M.; Abdelkrim, K.; Fairouz, S.; Maamar, M. Liquid and vapour phase antibacterial activity of Eucalyptus globulus essential oil= susceptibility of selected respiratory tract pathogens. J. Infect. Dis. 2014, 10, 105. [Google Scholar]
- Sun, Q.; Li, J.; Sun, Y.; Chen, Q.; Zhang, L.; Le, T. The antifungal effects of cinnamaldehyde against Aspergillus niger and its application in bread preservation. Food Chem. 2020, 317, 126405. [Google Scholar] [PubMed]
- Sun, Q.; Shang, B.; Wang, L.; Lu, Z.; Liu, Y. Cinnamaldehyde inhibits fungal growth and aflatoxin B1 biosynthesis by modulating the oxidative stress response of Aspergillus flavus. Appl. Microbiol. Biotechnol. 2016, 100, 1355–1364. [Google Scholar]
- Kiran, S.; Kujur, A.; Prakash, B. Assessment of preservative potential of Cinnamomum zeylanicum Blume essential oil against food borne molds, aflatoxin B1 synthesis, its functional properties and mode of action. Innov. Food Sci. Emerg. Technol. 2016, 37, 184–191. [Google Scholar]
- Shreaz, S.; Wani, W.A.; Behbehani, J.M.; Raja, V.; Irshad, M.; Karched, M.; Ali, I.; Siddiqi, W.A.; Hun, L.T. Cinnamaldehyde and its derivatives, a novel class of antifungal agents. Fitoterapia 2016, 112, 116–131. [Google Scholar]
- Niu, A.; Wu, H.; Hu, X.; Tan, S.; Wu, Y.; Yin, X.; Chen, Y.; Sun, X.; Wang, G.; Qiu, W. New insights into the persistent effect of transient cinnamaldehyde vapor treatment on the growth and aflatoxin synthesis of Aspergillus flavus. Food Res. Int. 2023, 163, 112300. [Google Scholar]
- Zhang, C.-S.; Xing, F.-G.; Selvaraj, J.N.; Yang, Q.-L.; Zhou, L.; Zhao, Y.-J.; Liu, Y. The effectiveness of ISSR profiling for studying genetic diversity of Aspergillus flavus from peanut-cropped soils in China. Biochem. Syst. Ecol. 2013, 50, 147–153. [Google Scholar] [CrossRef]
- Kumar, S.; Stecher, G.; Li, M.; Knyaz, C.; Tamura, K. MEGA X: Molecular evolutionary genetics analysis across computing platforms. Mol. Biol. Evol. 2018, 35, 1547. [Google Scholar] [CrossRef] [PubMed]
- Bernáldez, V.; Córdoba, J.J.; Magan, N.; Peromingo, B.; Rodriguez, A. The influence of ecophysiological factors on growth, aflR gene expression and aflatoxin B1 production by a type strain of Aspergillus flavus. LWT 2017, 83, 283–291. [Google Scholar] [CrossRef]
- López, P.; Sánchez, C.; Batlle, R.; Nerín, C. Solid-and vapor-phase antimicrobial activities of six essential oils: Susceptibility of selected foodborne bacterial and fungal strains. J. Agric. Food Chem. 2005, 53, 6939–6946. [Google Scholar] [CrossRef] [PubMed]
- Zuo, C.; Hu, Q.; Su, A.; Pei, F.; Ma, G.; Xu, H.; Xie, M.; Liu, J.; Mariga, A.; Yang, W. Transcriptome analysis reveals the underlying mechanism of nanocomposite packaging in delaying quality deterioration of Flammulina velutipes. Postharvest Biol. Technol. 2021, 182, 111723. [Google Scholar] [CrossRef]
- Wang, Y.; Feng, K.; Yang, H.; Zhang, Z.; Yuan, Y.; Yue, T. Effect of cinnamaldehyde and citral combination on transcriptional profile, growth, oxidative damage and patulin biosynthesis of Penicillium expansum. Front. Microbiol. 2018, 9, 597. [Google Scholar] [CrossRef] [PubMed]
- Hu, Z.; Yuan, K.; Zhou, Q.; Lu, C.; Du, L.; Liu, F. Mechanism of antifungal activity of Perilla frutescens essential oil against Aspergillus flavus by transcriptomic analysis. Food Control 2021, 123, 107703. [Google Scholar] [CrossRef]
- Upadhyay, A.; Upadhyaya, I.; Kollanoor-Johny, A.; Ananda Baskaran, S.; Mooyottu, S.; Karumathil, D.; Venkitanarayanan, K. Inactivation of Listeria monocytogenes on frankfurters by plant-derived antimicrobials alone or in combination with hydrogen peroxide. Int. J. Food Microbiol. 2013, 163, 114–118. [Google Scholar] [CrossRef] [PubMed]
- Xing, F.; Hua, H.; Selvaraj, J.N.; Zhao, Y.; Zhou, L.; Liu, X.; Liu, Y. Growth inhibition and morphological alterations of Fusarium verticillioides by cinnamon oil and cinnamaldehyde. Food Control 2014, 46, 343–350. [Google Scholar] [CrossRef]
- Jo, Y.-J.; Chun, J.-Y.; Kwon, Y.-J.; Min, S.-G.; Hong, G.-P.; Choi, M.-J. Physical and antimicrobial properties of trans-cinnamaldehyde nanoemulsions in water melon juice. LWT 2015, 60, 444–451. [Google Scholar] [CrossRef]
- Znini, M.; Cristofari, G.; Majidi, L.; Paolini, J.; Desjobert, J.; Costa, J. Essential oil composition and antifungal activity of Pulicaria mauritanica Coss., against postharvest phytopathogenic fungi in apples. LWT 2013, 54, 564–569. [Google Scholar] [CrossRef]
- Nguefack, J.; Tamgue, O.; Dongmo, J.L.; Dakole, C.; Leth, V.; Vismer, H.; Zollo, P.A.; Nkengfack, A. Synergistic action between fractions of essential oils from Cymbopogon citratus, Ocimum gratissimum and Thymus vulgaris against Penicillium expansum. Food Control 2012, 23, 377–383. [Google Scholar] [CrossRef]
- Da Rocha Neto, A.C.; Beaudry, R.; Maraschin, M.; Di Piero, R.M.; Almenar, E. Double-bottom antimicrobial packaging for apple shelf-life extension. Food Chem. 2019, 279, 379–388. [Google Scholar] [CrossRef] [PubMed]
- Růžička, J.; Velclová, K.; Janiš, R.; Krejci, J. Antimicrobial effects of 1-monoacylglycerols prepared by catalytic reaction of glycidol with fatty acids. Eur. Food Res. Technol. 2003, 217, 329–331. [Google Scholar] [CrossRef]
- Tajkarimi, M.M.; Ibrahim, S.A.; Cliver, D.O. Antimicrobial herb and spice compounds in food. Food Control 2010, 21, 1199–1218. [Google Scholar] [CrossRef]
- Li, X.; Ren, Y.; Jing, J.; Jiang, Y.; Yang, Q.; Luo, S.; Xing, F. The inhibitory mechanism of methyl jasmonate on Aspergillus flavus growth and aflatoxin biosynthesis and two novel transcription factors are involved in this action. Food Res. Int. 2021, 140, 110051. [Google Scholar] [CrossRef] [PubMed]
- Liang, D.; Xing, F.; Selvaraj, J.N.; Liu, X.; Wang, L.; Hua, H.; Zhou, L.; Zhao, Y.; Wang, Y.; Liu, Y. Inhibitory effect of cinnamaldehyde, citral, and eugenol on aflatoxin biosynthetic gene expression and aflatoxin B1 biosynthesis in Aspergillus flavus. J. Food Sci. 2015, 80, M2917–M2924. [Google Scholar] [CrossRef]
- Lv, C.; Wang, P.; Ma, L.; Zheng, M.; Liu, Y.; Xing, F. Large-Scale Comparative Analysis of Eugenol-Induced/Repressed Genes Expression in Aspergillus flavus Using RNA-seq. Front Microbiol. 2018, 9, 1116. [Google Scholar] [CrossRef]
- Amare, M.G.; Keller, N.P. Molecular mechanisms of Aspergillus flavus secondary metabolism and development. Fungal Genet Biol. 2014, 66, 11–18. [Google Scholar] [CrossRef]
- Kale, S.P.; Milde, L.; Trapp, M.K.; Frisvad, J.C.; Keller, N.P.; Bok, J.W. Requirement of LaeA for secondary metabolism and sclerotial production in Aspergillus flavus. Fungal Genet Biol. 2008, 45, 1422–1429. [Google Scholar] [CrossRef]
- Bayram, Ö.; Krappmann, S.; Ni, M.; Bok, J.W.; Helmstaedt, K.; Valerius, O.; Braus-Stromeyer, S.; Kwon, N.-J.; Keller, N.P.; Yu, J.-H.; et al. VelB/VeA/LaeA Complex Coordinates Light Signal with Fungal Development and Secondary Metabolism. Science 2008, 320, 1504–1506. [Google Scholar] [CrossRef]
- Wang, P.; Ma, L.; Jin, J.; Zheng, M.; Pan, L.; Zhao, Y.; Sun, X.; Liu, Y.; Xing, F. The anti-aflatoxigenic mechanism of cinnamaldehyde in Aspergillus flavus. Sci. Rep. 2019, 9, 10499. [Google Scholar] [CrossRef] [PubMed]
- Hwang, J.H.; Hwang, I.-S.; Liu, Q.-H.; Woo, E.-R.; Lee, D.G. (+)-Medioresinol leads to intracellular ROS accumulation and mitochondria-mediated apoptotic cell death in Candida albicans. Biochimie 2012, 94, 1784–1793. [Google Scholar] [CrossRef] [PubMed]
- Chen, J.; Li, B.; Qin, G.; Tian, S. Mechanism of H2O2-induced oxidative stress regulating viability and biocontrol ability of Rhodotorula glutinis. Int. J. Food Microbiol. 2015, 193, 152–158. [Google Scholar] [CrossRef]
- Dong, H.; Zheng, L.; Yu, P.; Jiang, Q.; Wu, Y.; Huang, C.; Yin, B. Characterization and Application of Lignin–Carbohydrate Complexes from Lignocellulosic Materials as Antioxidants for Scavenging In Vitro and In Vivo Reactive Oxygen Species. ACS Sustain. Chem. Eng. 2020, 8, 256–266. [Google Scholar] [CrossRef]
- Zhang, C.; Zhao, J.; Famous, E.; Pan, S.; Peng, X.; Tian, J. Antioxidant, hepatoprotective and antifungal activities of black pepper (Piper nigrum L.) essential oil. Food Chem. 2021, 346, 128845. [Google Scholar] [CrossRef] [PubMed]
- Weydert, C.J.; Cullen, J.J. Measurement of superoxide dismutase, catalase and glutathione peroxidase in cultured cells and tissue. Nat. Protoc. 2010, 5, 51–66. [Google Scholar] [CrossRef]
- Pei, S.; Liu, R.; Gao, H.; Chen, H.; Wu, W.; Fang, X.; Han, Y. Inhibitory effect and possible mechanism of carvacrol against Colletotrichum fructicola. Postharvest Biol. Technol. 2020, 163, 111126. [Google Scholar] [CrossRef]
- OuYang, Q.; Duan, X.; Li, L.; Tao, N. Cinnamaldehyde Exerts Its Antifungal Activity by Disrupting the Cell Wall Integrity of Geotrichum citri-aurantii. Front. Microbiol. 2019, 10, 55. [Google Scholar] [CrossRef]
- Ju, J.; Xie, Y.; Yu, H.; Guo, Y.; Cheng, Y.; Zhang, R.; Yao, W. Synergistic inhibition effect of citral and eugenol against Aspergillus niger and their application in bread preservation. Food Chem. 2020, 310, 125974. [Google Scholar] [CrossRef]
- Gulshan, K.; Moye-Rowley, W.S. Multidrug resistance in fungi. Eukaryot. Cell. 2007, 6, 1933–1942. [Google Scholar] [CrossRef] [PubMed]
- Morschhäuser, J. Regulation of multidrug resistance in pathogenic fungi. Fungal Genet. Biol. 2010, 47, 94–106. [Google Scholar] [CrossRef]
- Paul, S.; Moye-Rowley, W.S. Multidrug resistance in fungi: Regulation of transporter-encoding gene expression. Front. Physiol. 2014, 5, 143. [Google Scholar] [CrossRef]
- Yang, R.; Chen, X.; Huang, Q.; Chen, C.; Rengasamy, K.R.R.; Chen, J.; Wan, C. Mining RNA-Seq Data to Depict How Penicillium digitatum Shapes Its Transcriptome in Response to Nanoemulsion. Front. Nutr. 2021, 8, 724419. [Google Scholar] [CrossRef]
- Roze, L.V.; Laivenieks, M.; Hong, S.-Y.; Wee, J.; Wong, S.-S.; Vanos, B.; Awad, D.; Ehrlich, K.C.; Linz, J.E. Aflatoxin biosynthesis is a novel source of reactive oxygen species—A potential redox signal to initiate resistance to oxidative stress? Toxins 2015, 7, 1411–1430. [Google Scholar] [CrossRef] [PubMed]
- Jayashree, T.; Subramanyam, C. Oxidative stress as a prerequisite for aflatoxin production by Aspergillus parasiticus. Free Radical. Biol. Med. 2000, 29, 981–985. [Google Scholar] [CrossRef] [PubMed]
- Narasaiah, K.V.; Sashidhar, R.B.; Subramanyam, C. Subramanyam CJM. Biochemical analysis of oxidative stress in the production of aflatoxin and its precursor intermediates. Mycopathologia 2006, 162, 179–189. [Google Scholar] [CrossRef]
- Fountain, J.C.; Scully, B.T.; Chen, Z.-Y.; Gold, S.E.; Glenn, A.E.; Abbas, H.K.; Lee, R.D.; Kemerait, R.C.; Guo, B. Effects of hydrogen peroxide on different toxigenic and atoxigenic isolates of Aspergillus flavus. Toxins 2015, 7, 2985–2999. [Google Scholar] [CrossRef]
- Probst, C.; Bandyopadhyay, R.; Price, L.E.; Cotty, P.J. Identification of Atoxigenic Aspergillus flavus Isolates to Reduce Aflatoxin Contamination of Maize in Kenya. Plant Dis. 2011, 95, 212–218. [Google Scholar] [CrossRef]
Disclaimer/Publisher’s Note: The statements, opinions and data contained in all publications are solely those of the individual author(s) and contributor(s) and not of MDPI and/or the editor(s). MDPI and/or the editor(s) disclaim responsibility for any injury to people or property resulting from any ideas, methods, instructions or products referred to in the content. |
© 2023 by the authors. Licensee MDPI, Basel, Switzerland. This article is an open access article distributed under the terms and conditions of the Creative Commons Attribution (CC BY) license (https://creativecommons.org/licenses/by/4.0/).