
Rapid Indentification of Auramine O Dyeing Adulteration in Dendrobium officinale, Saffron and Curcuma by SERS Raman Spectroscopy Combined with SSA-BP Neural Networks Model

 ,
, 
Abstract
:1. Introduction
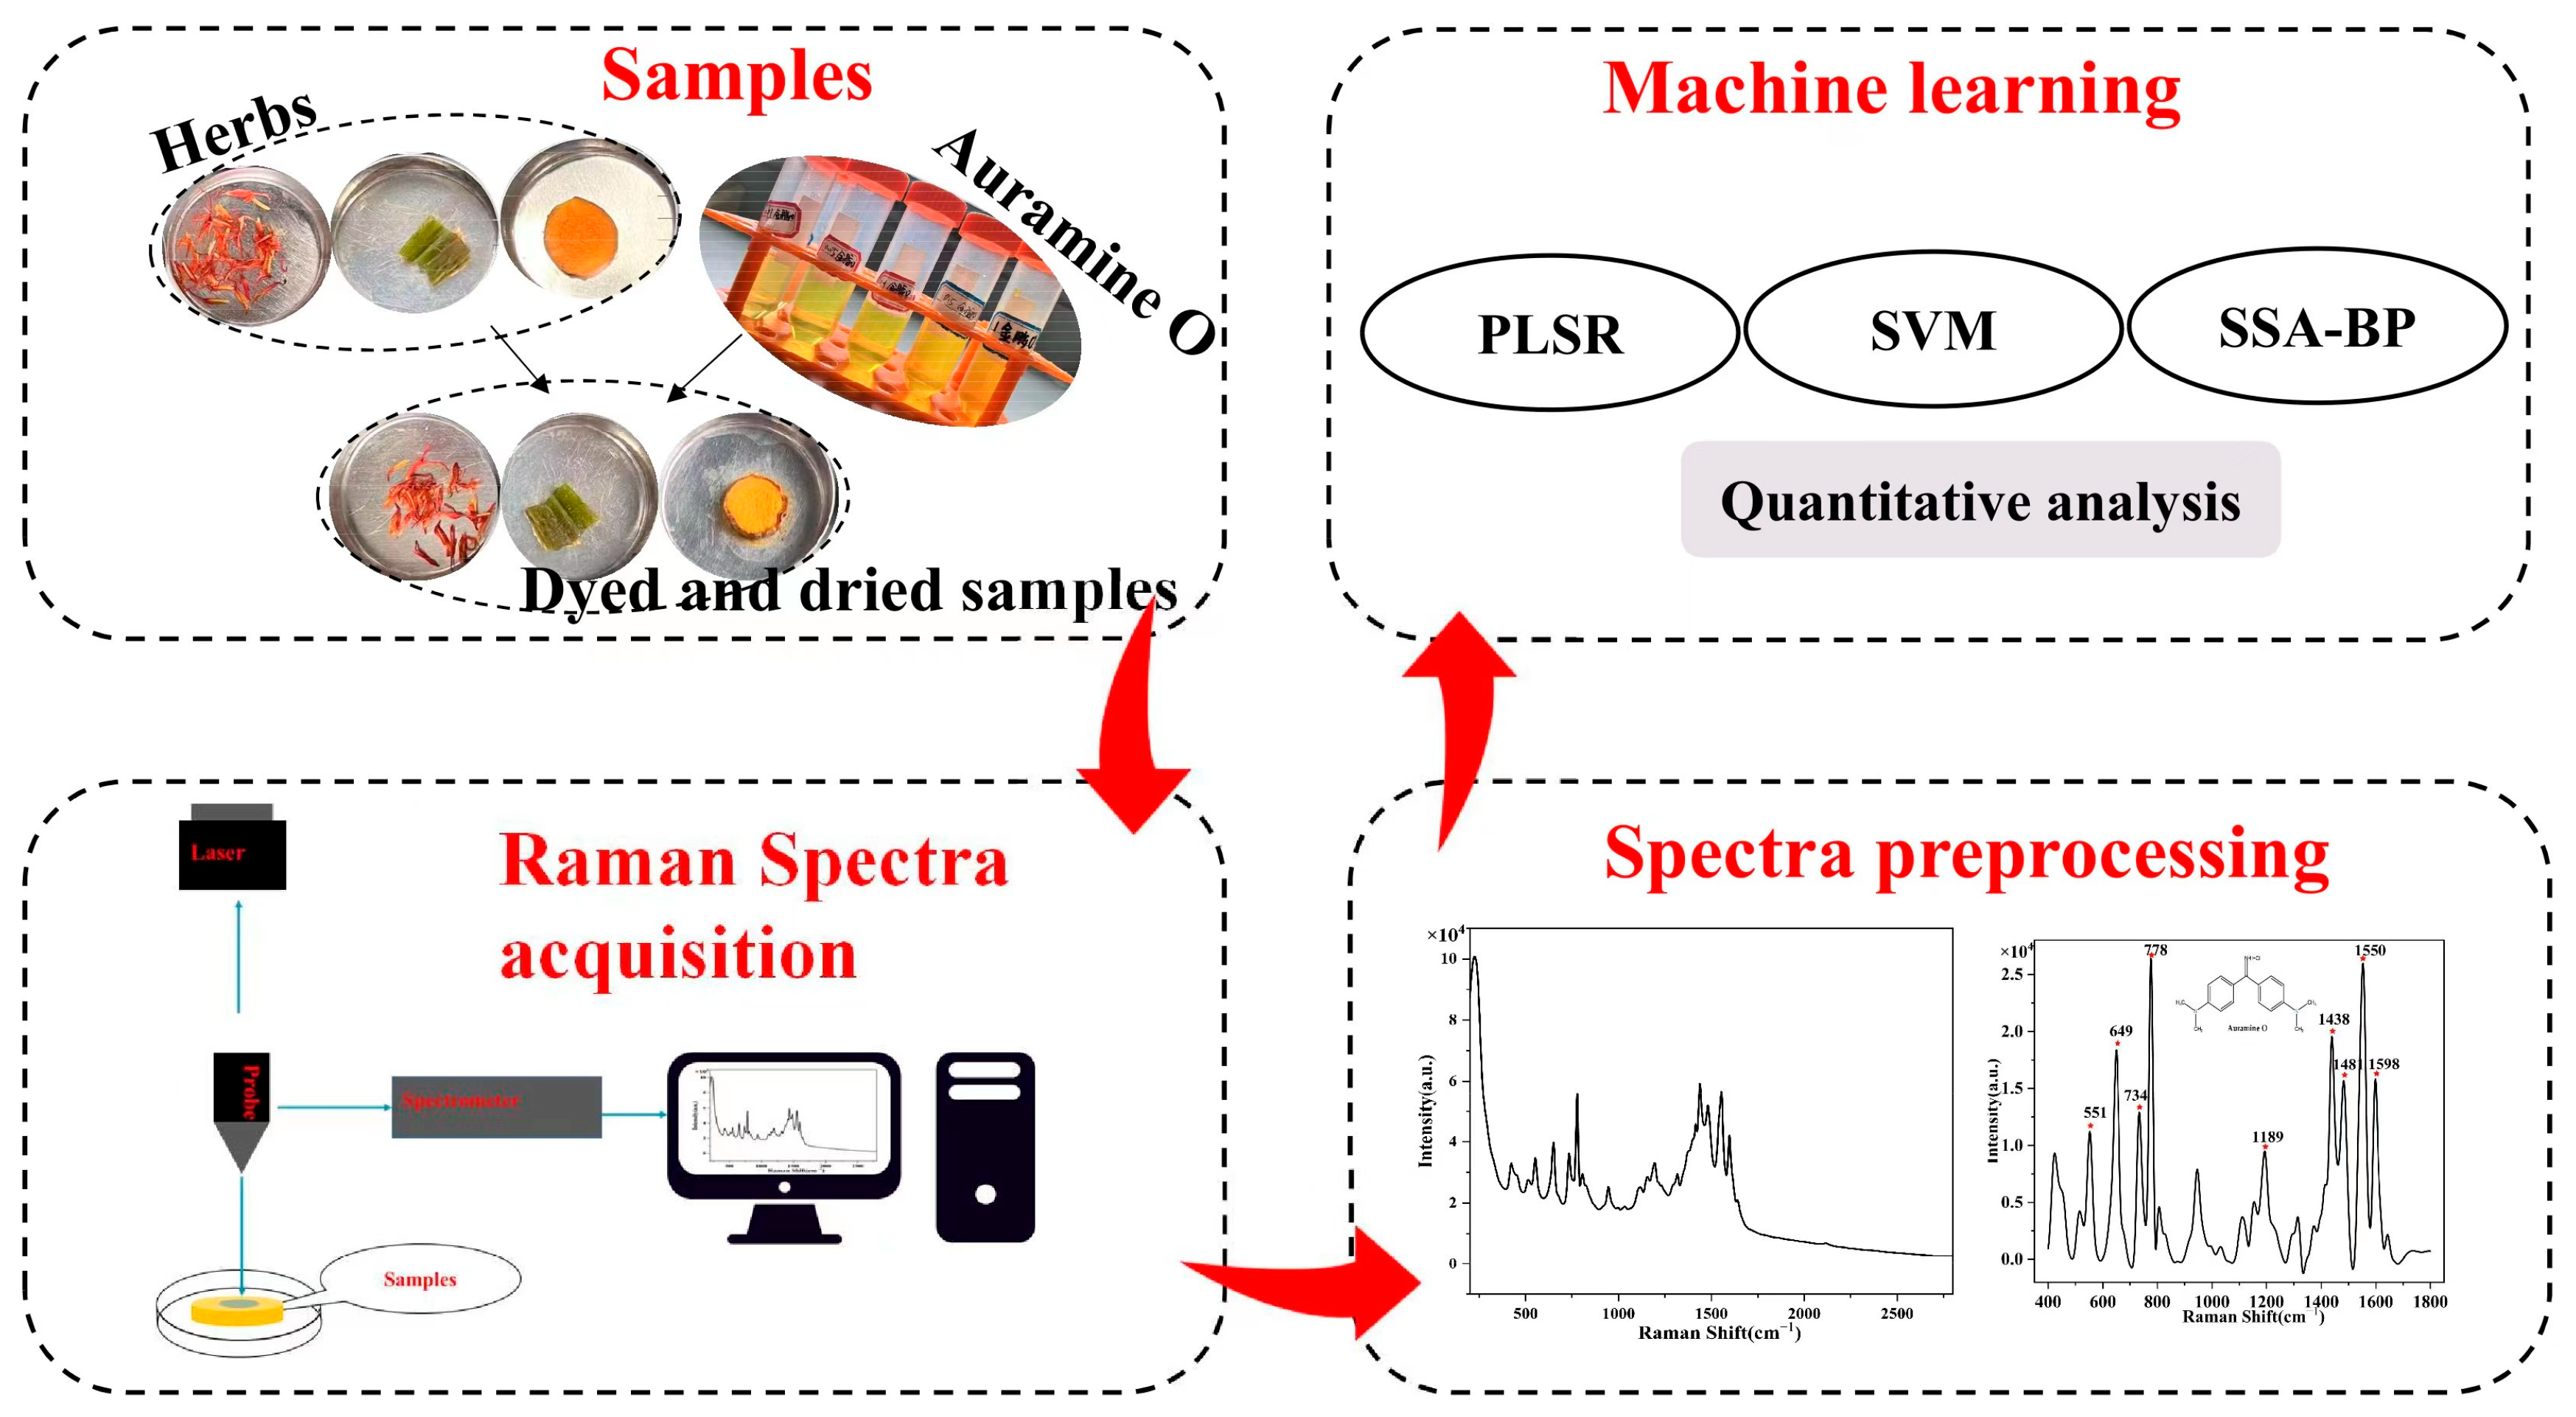
2. Materials and Methods
2.1. Materials
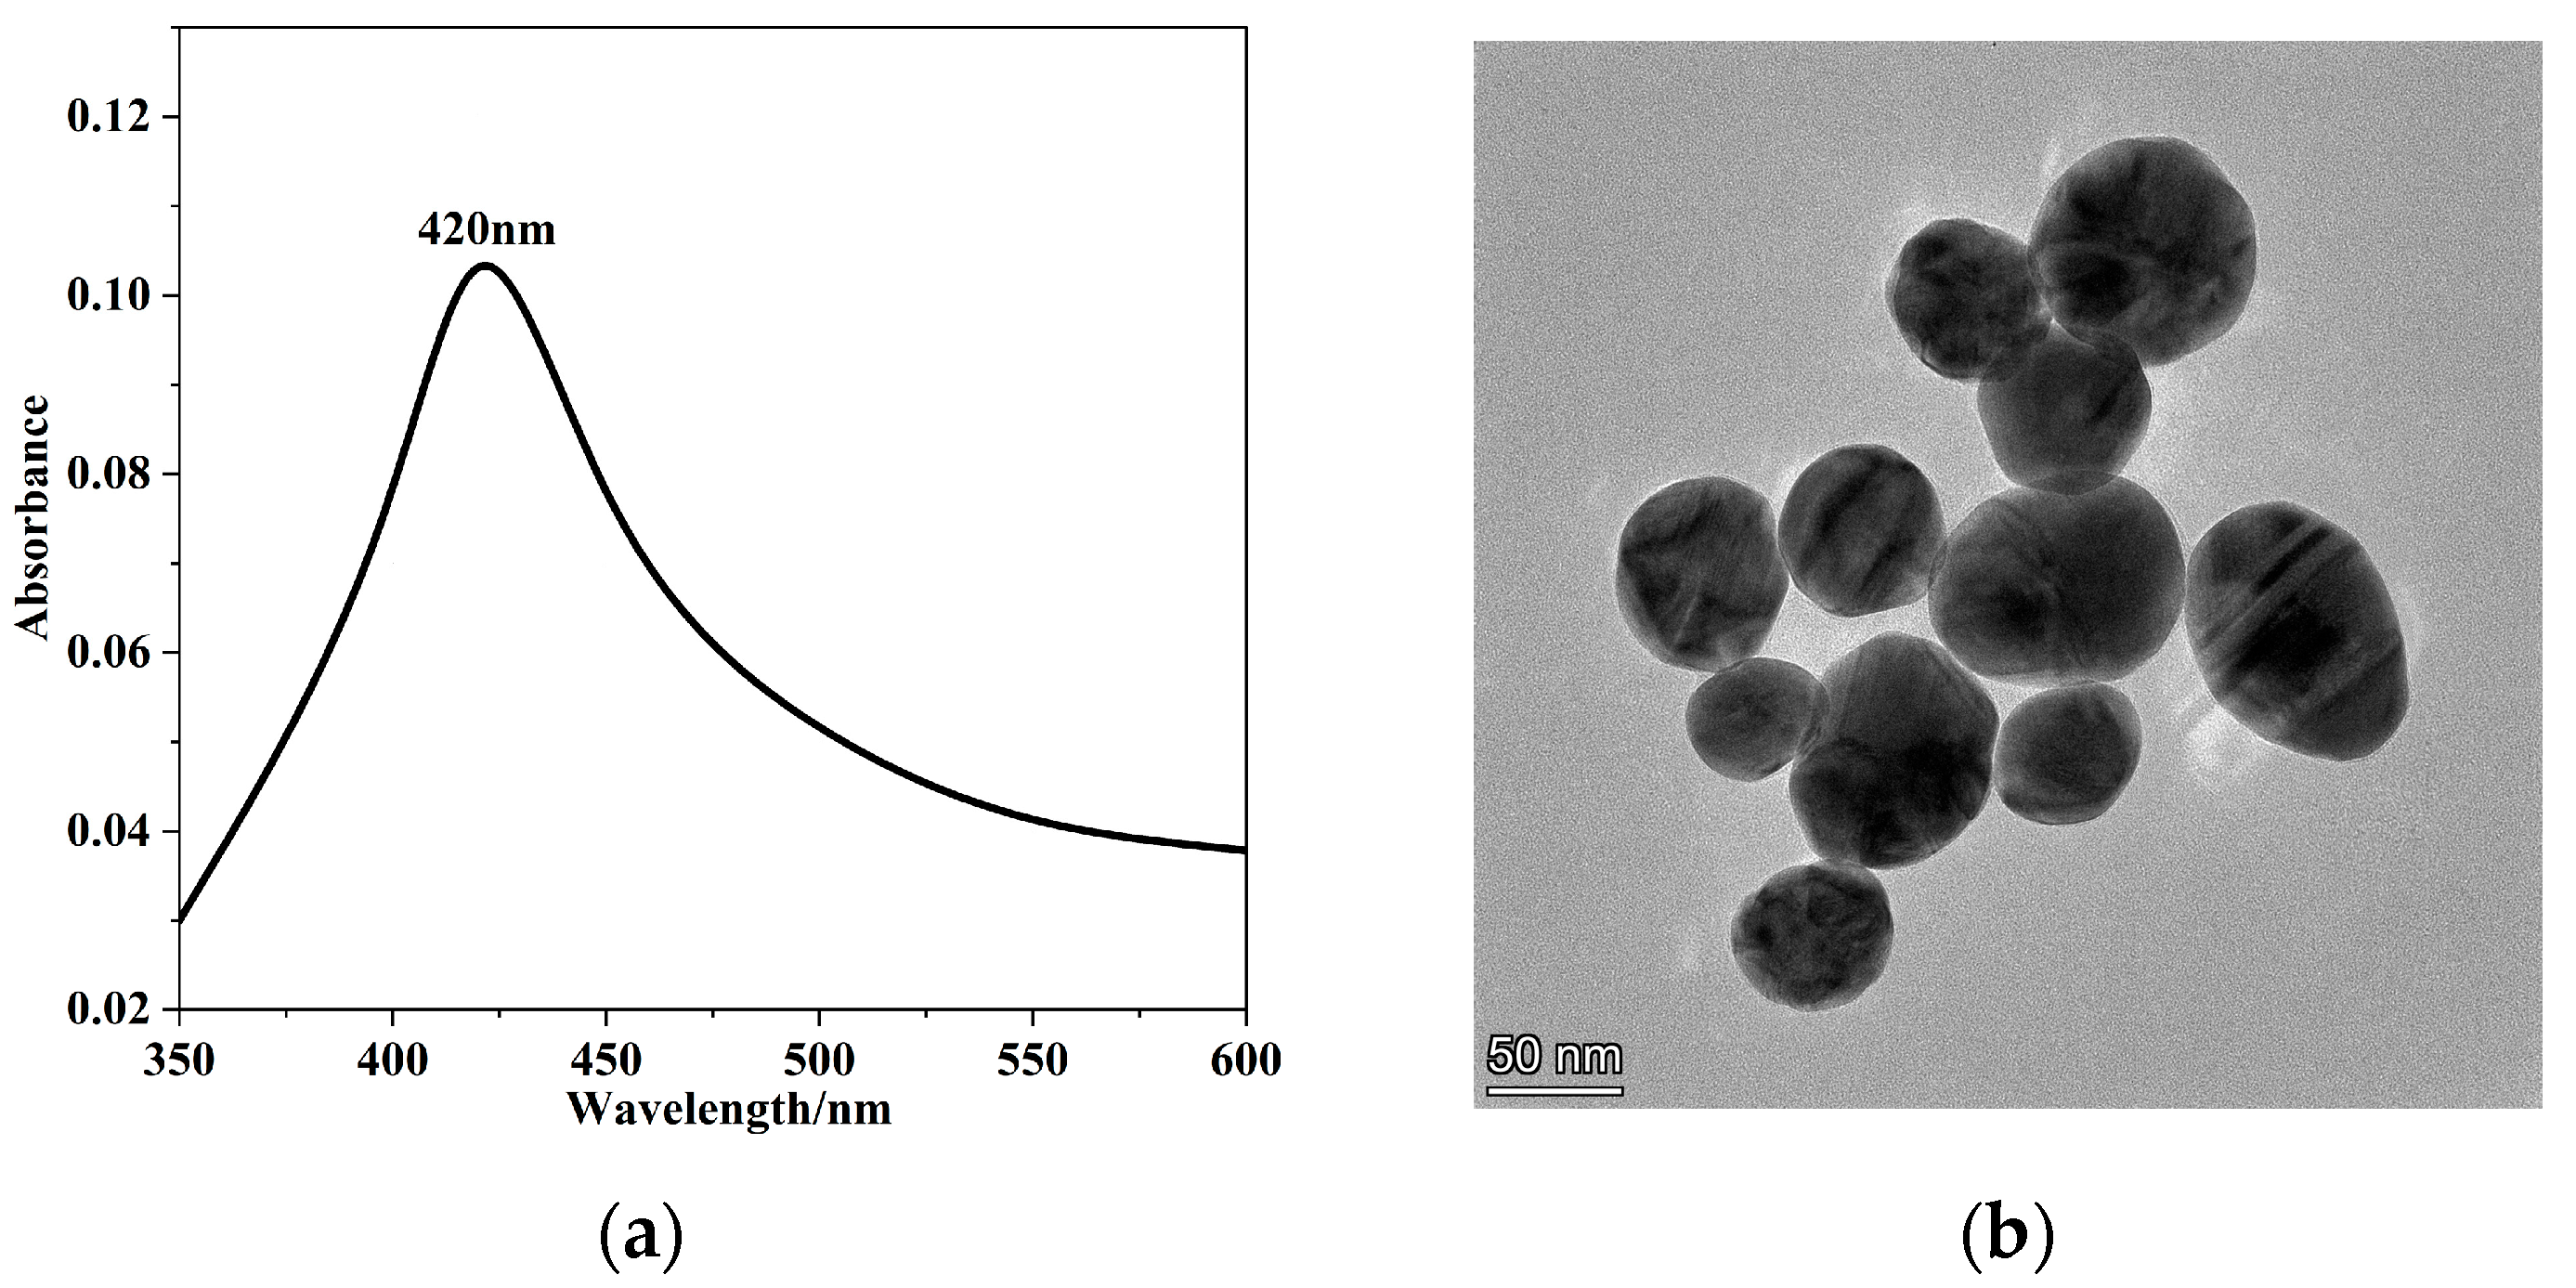
2.2. Preparation and Characterization of AgNPs
2.3. SERS Spectra Acquisition
2.4. Sample Set Division
2.5. Data Pre-Processing and Characteristic Wavelength Screening
2.6. Method
2.6.1. PLSR
2.6.2. SVM
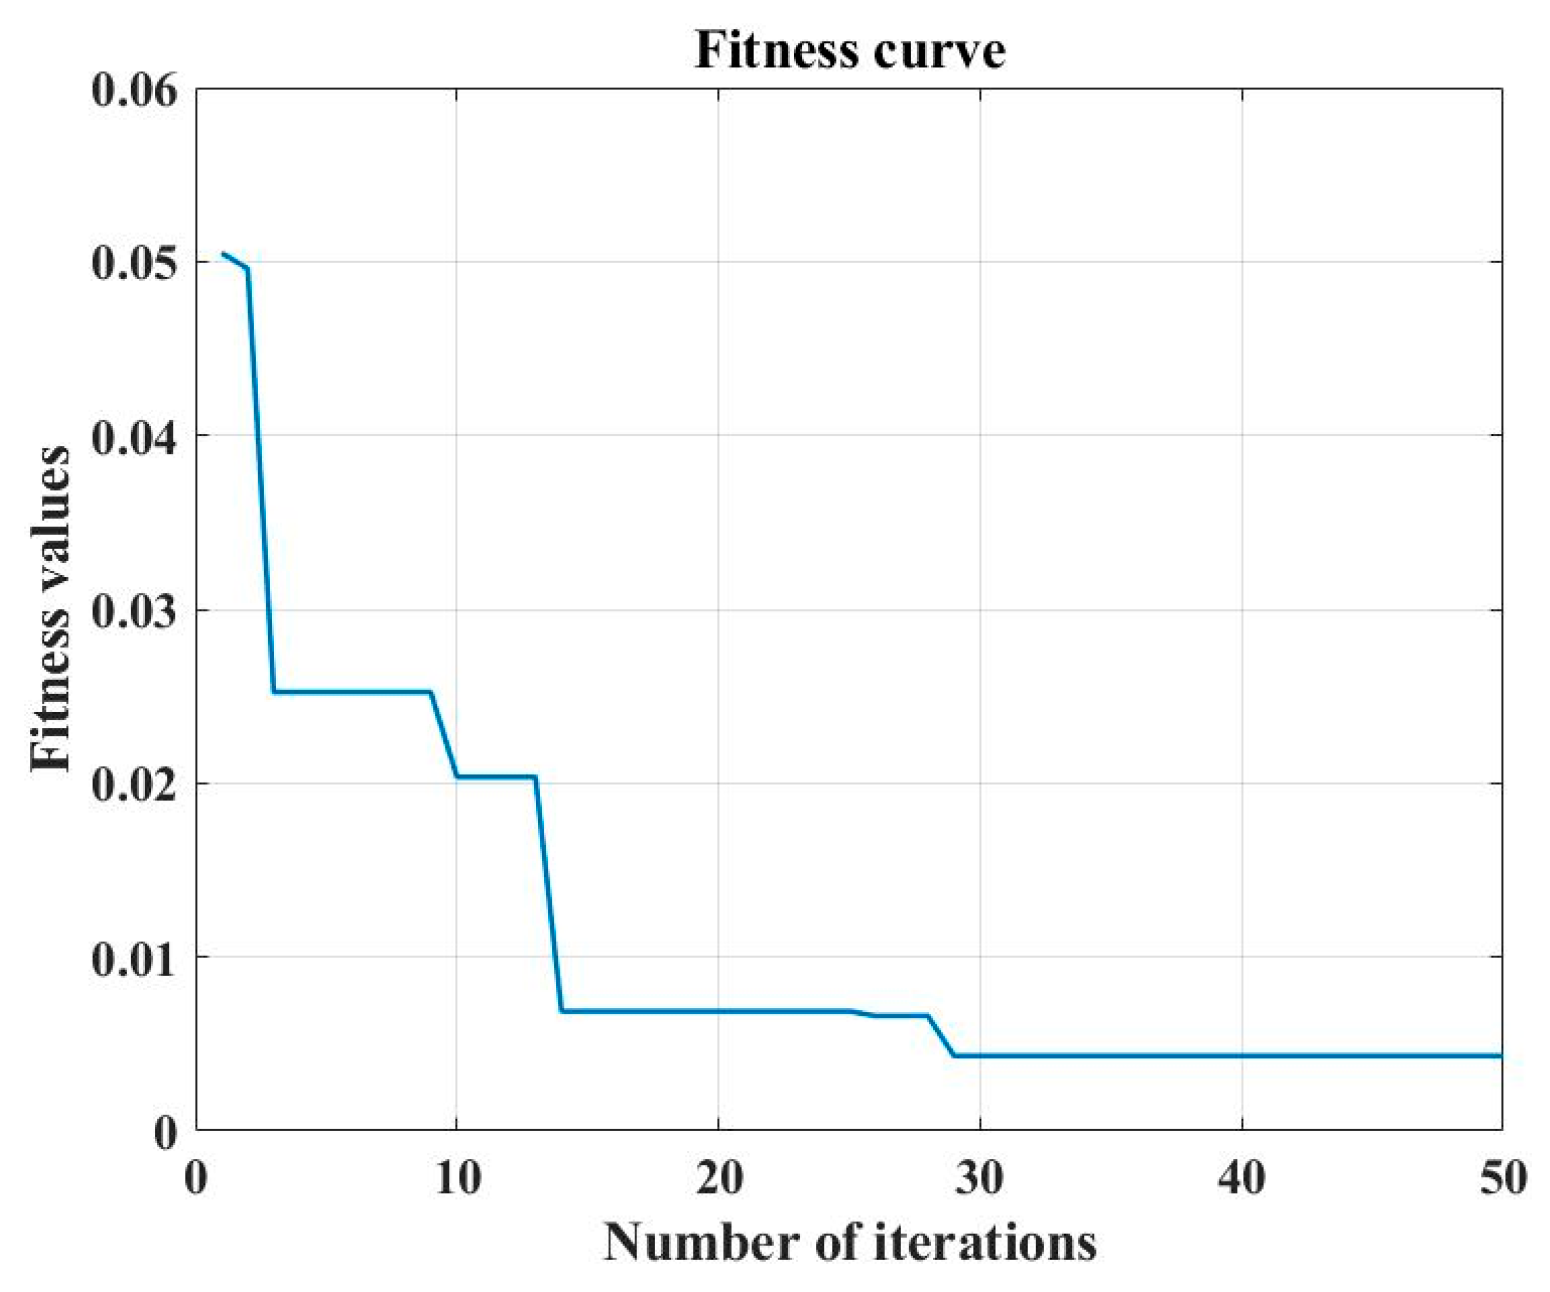
2.6.3. SSA-BP
2.6.4. Models Building Procedure
2.7. Model Evaluation Indexes
3. Results and Discussion
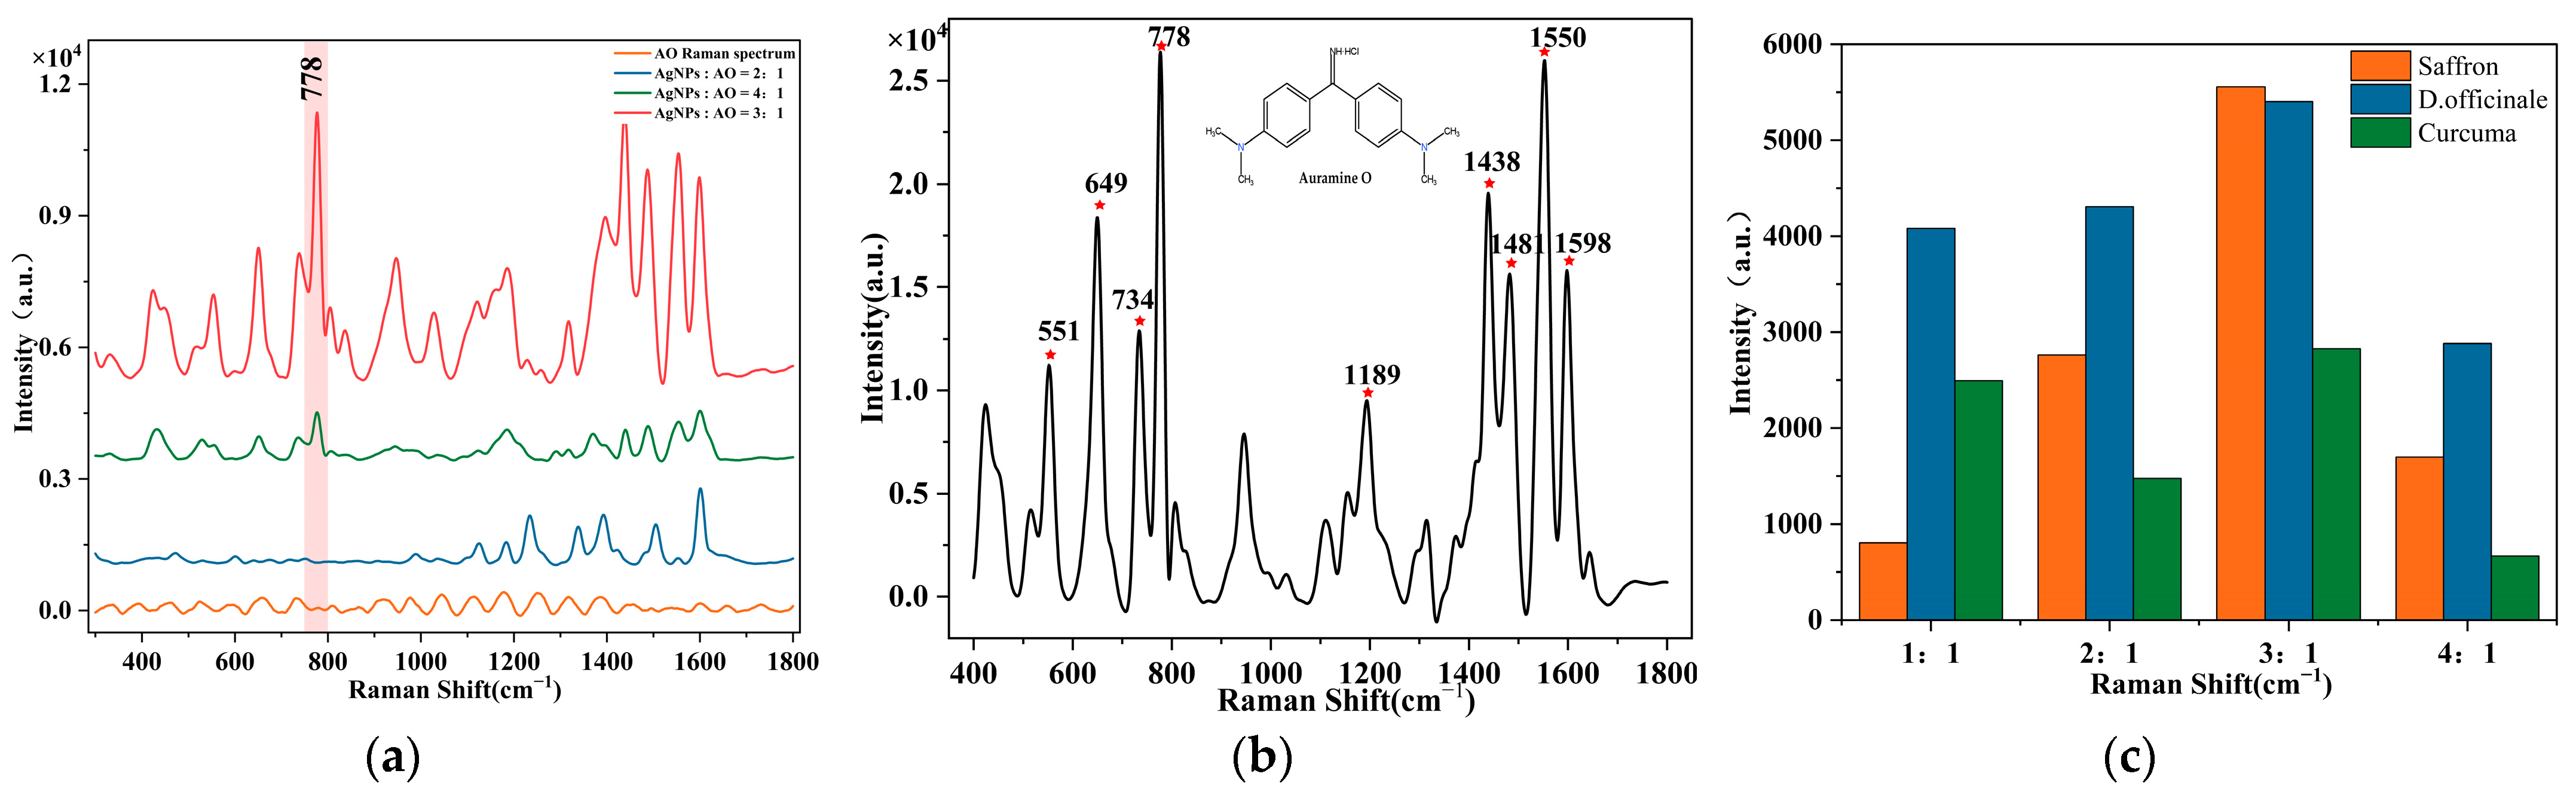
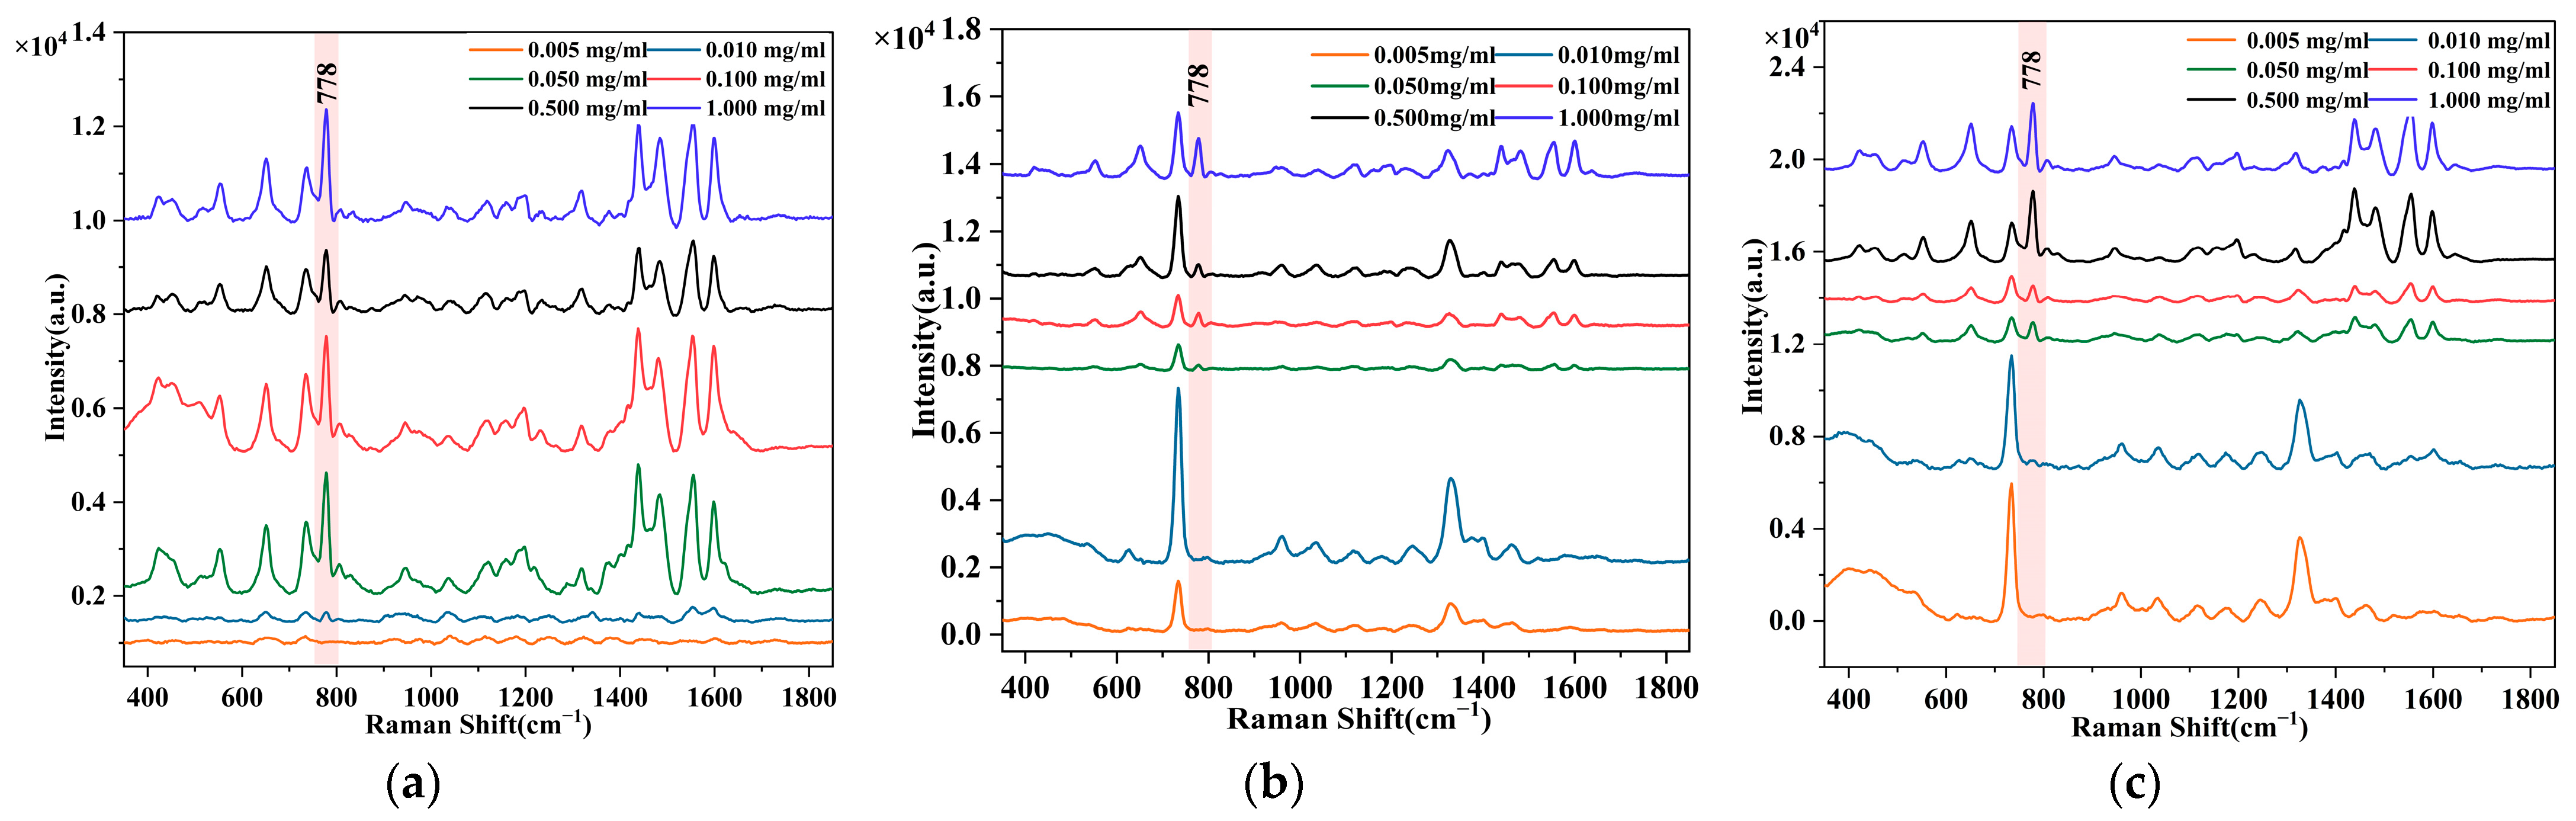
3.1. SERS Spectra Analysis of AO
3.2. Model Establishment and Research
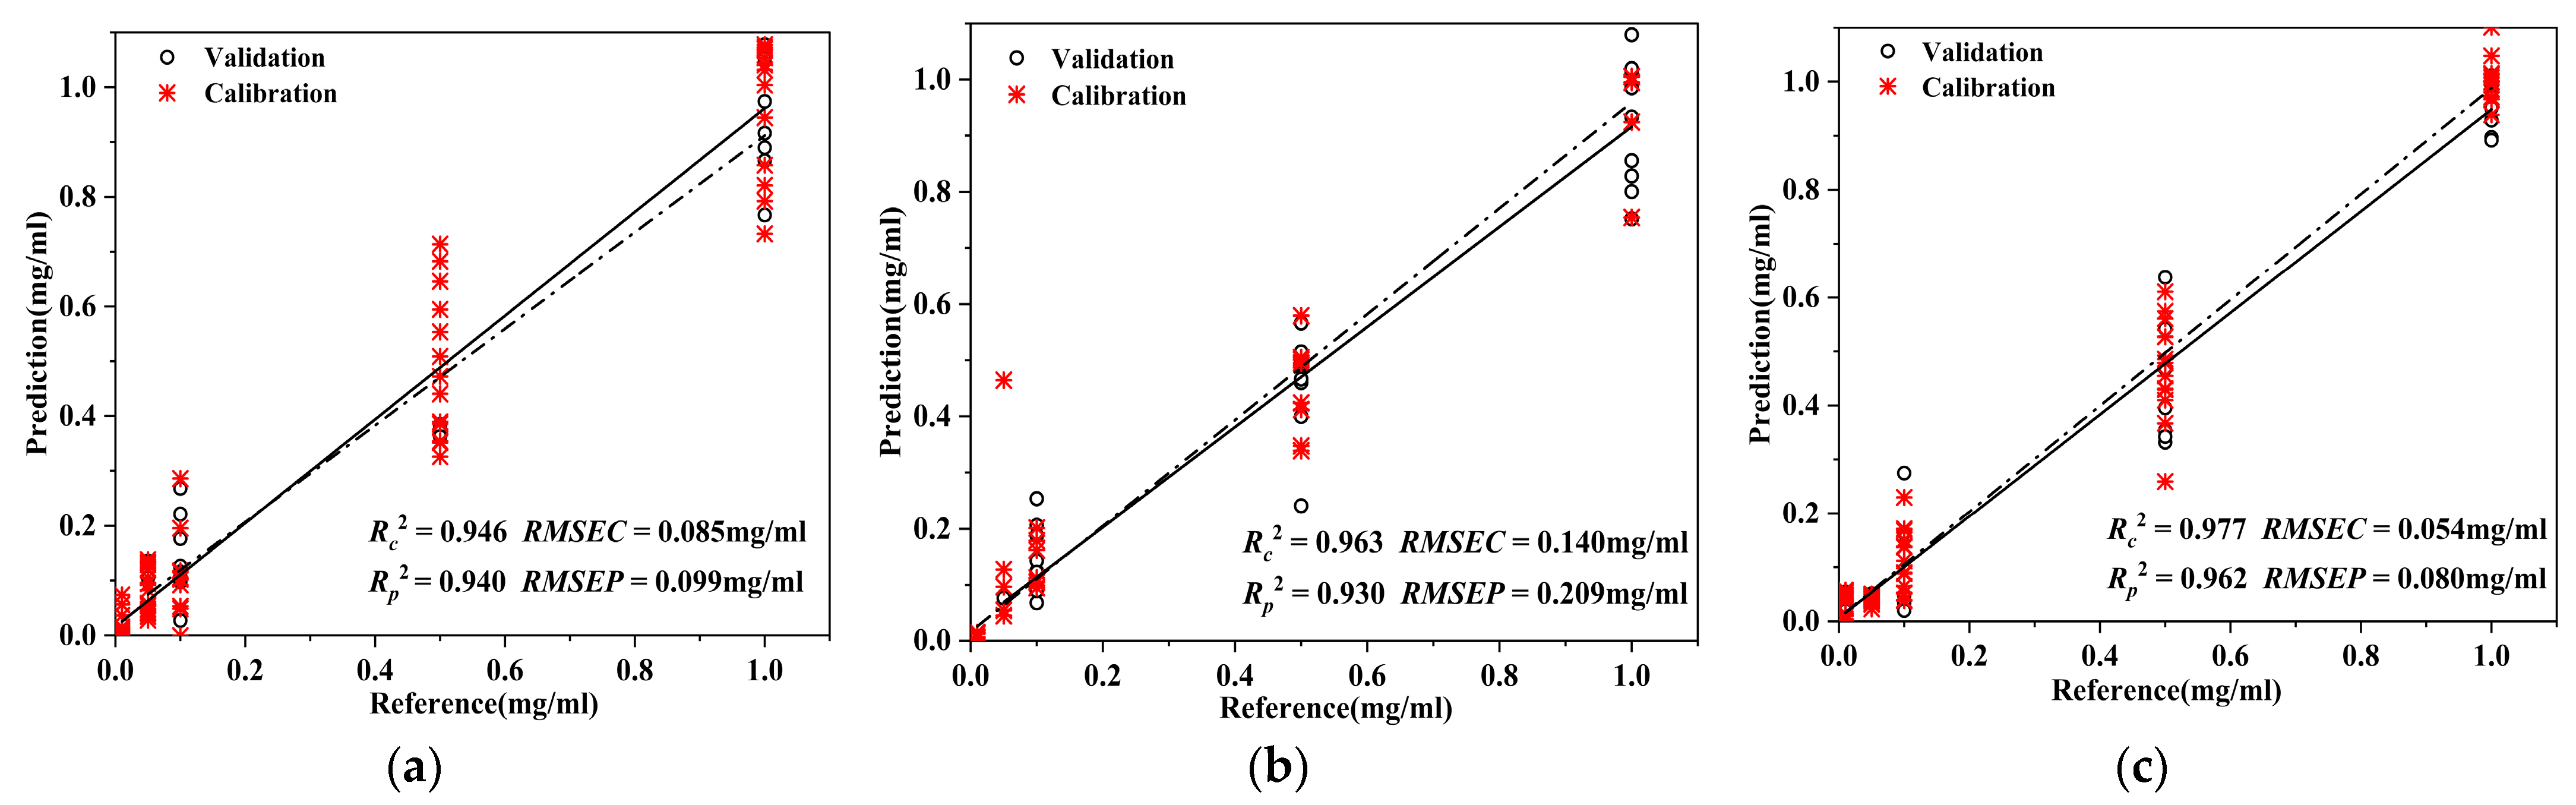
3.2.1. Predictive Modelling of AO Content in D. officinale
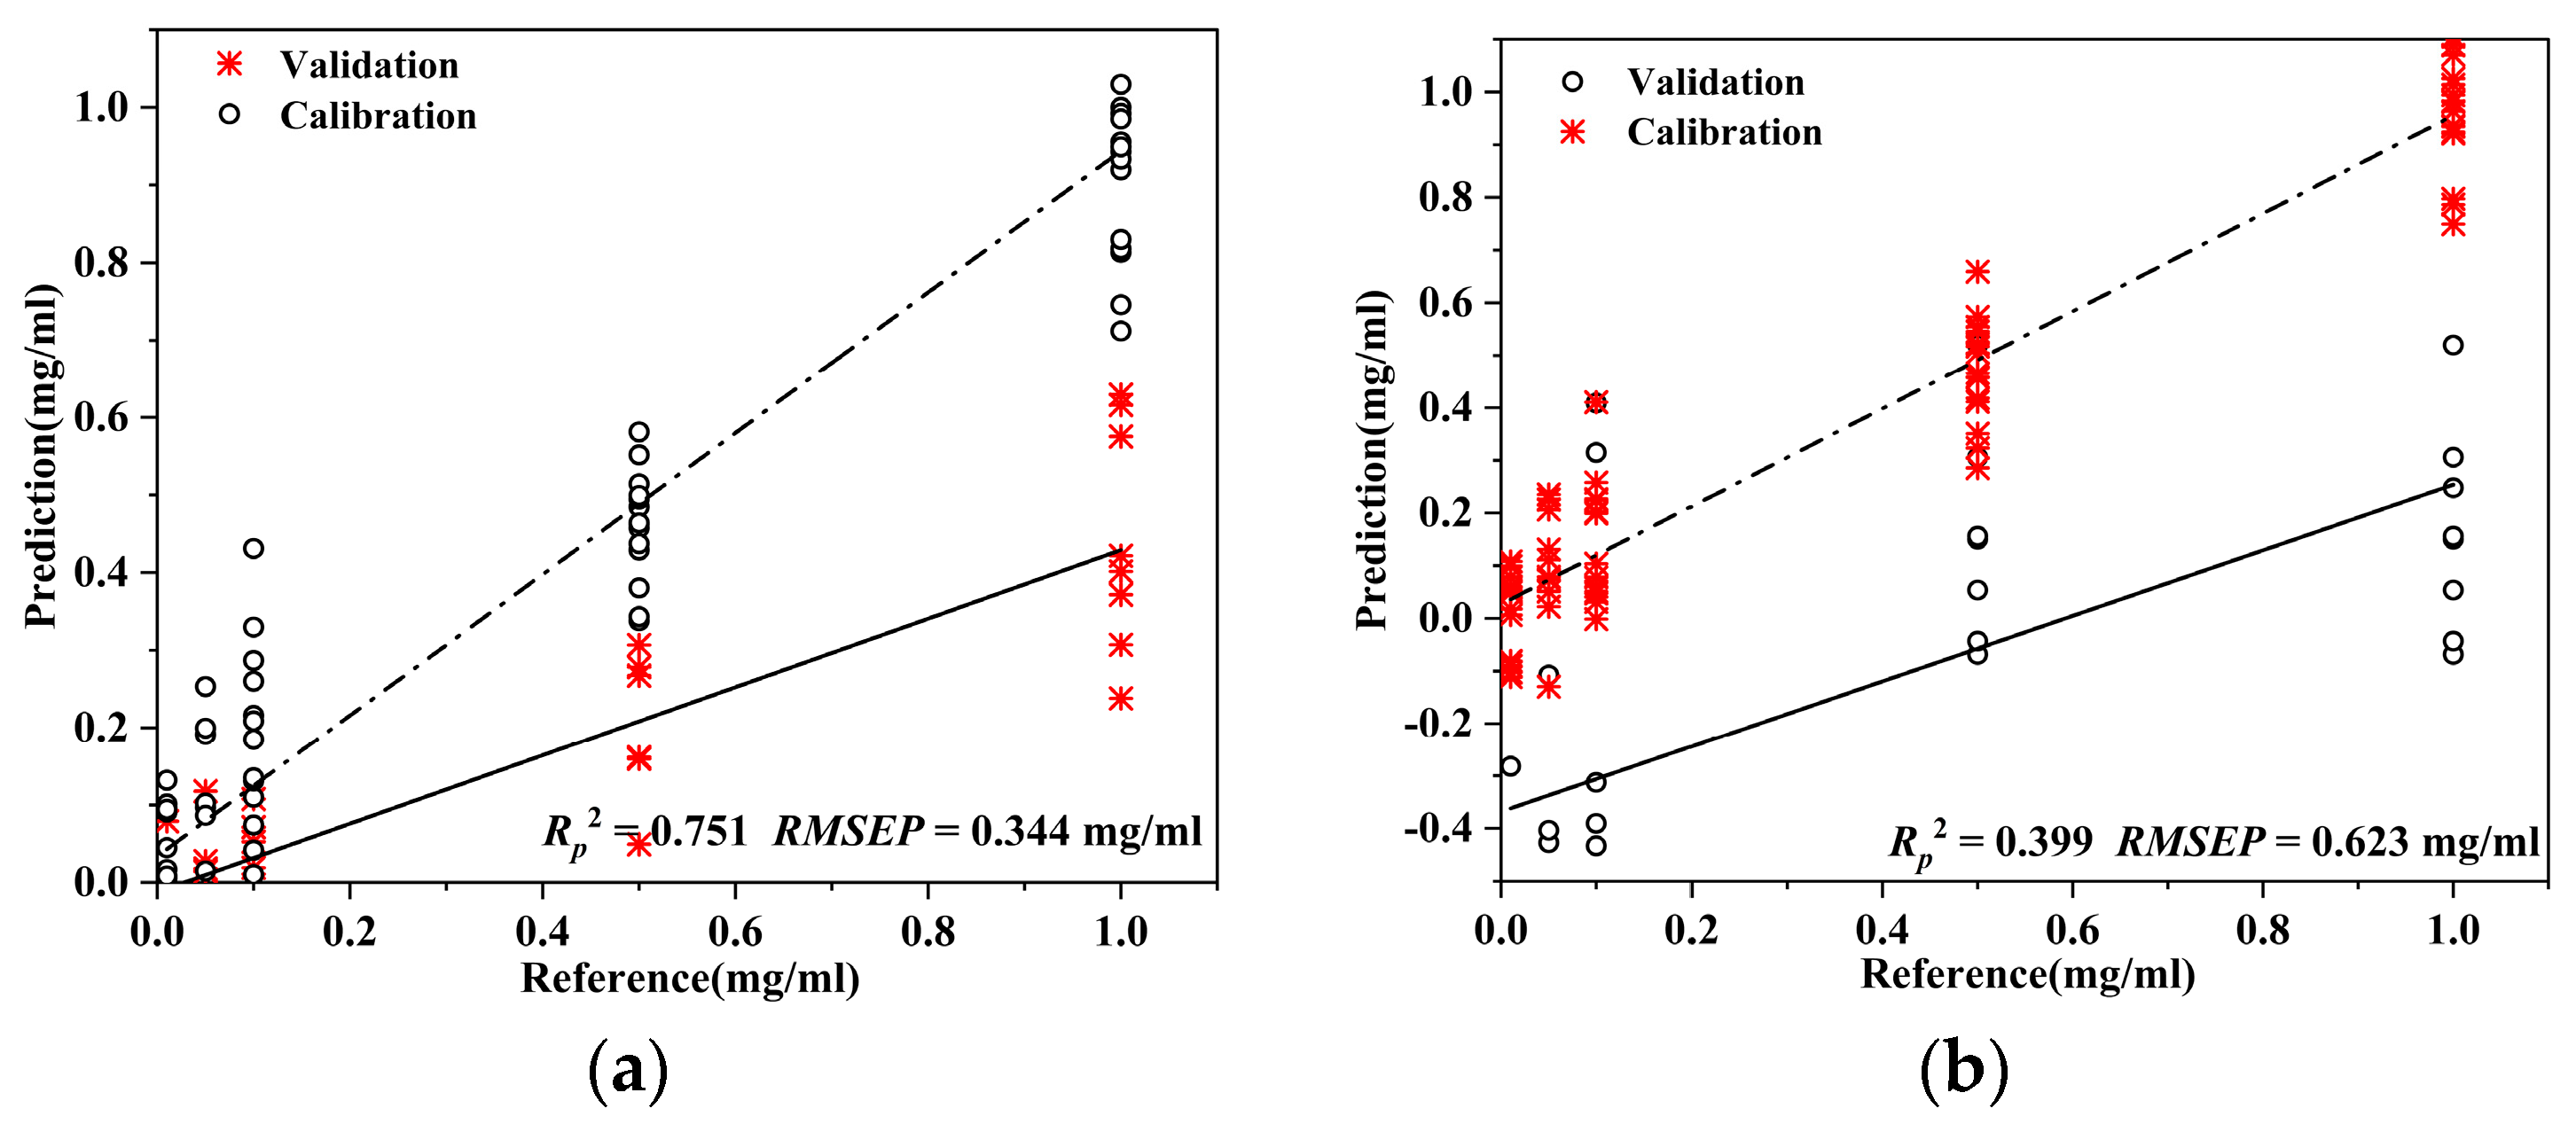
3.2.2. Generalization of the Prediction Model across Multiple Chinese Herbs
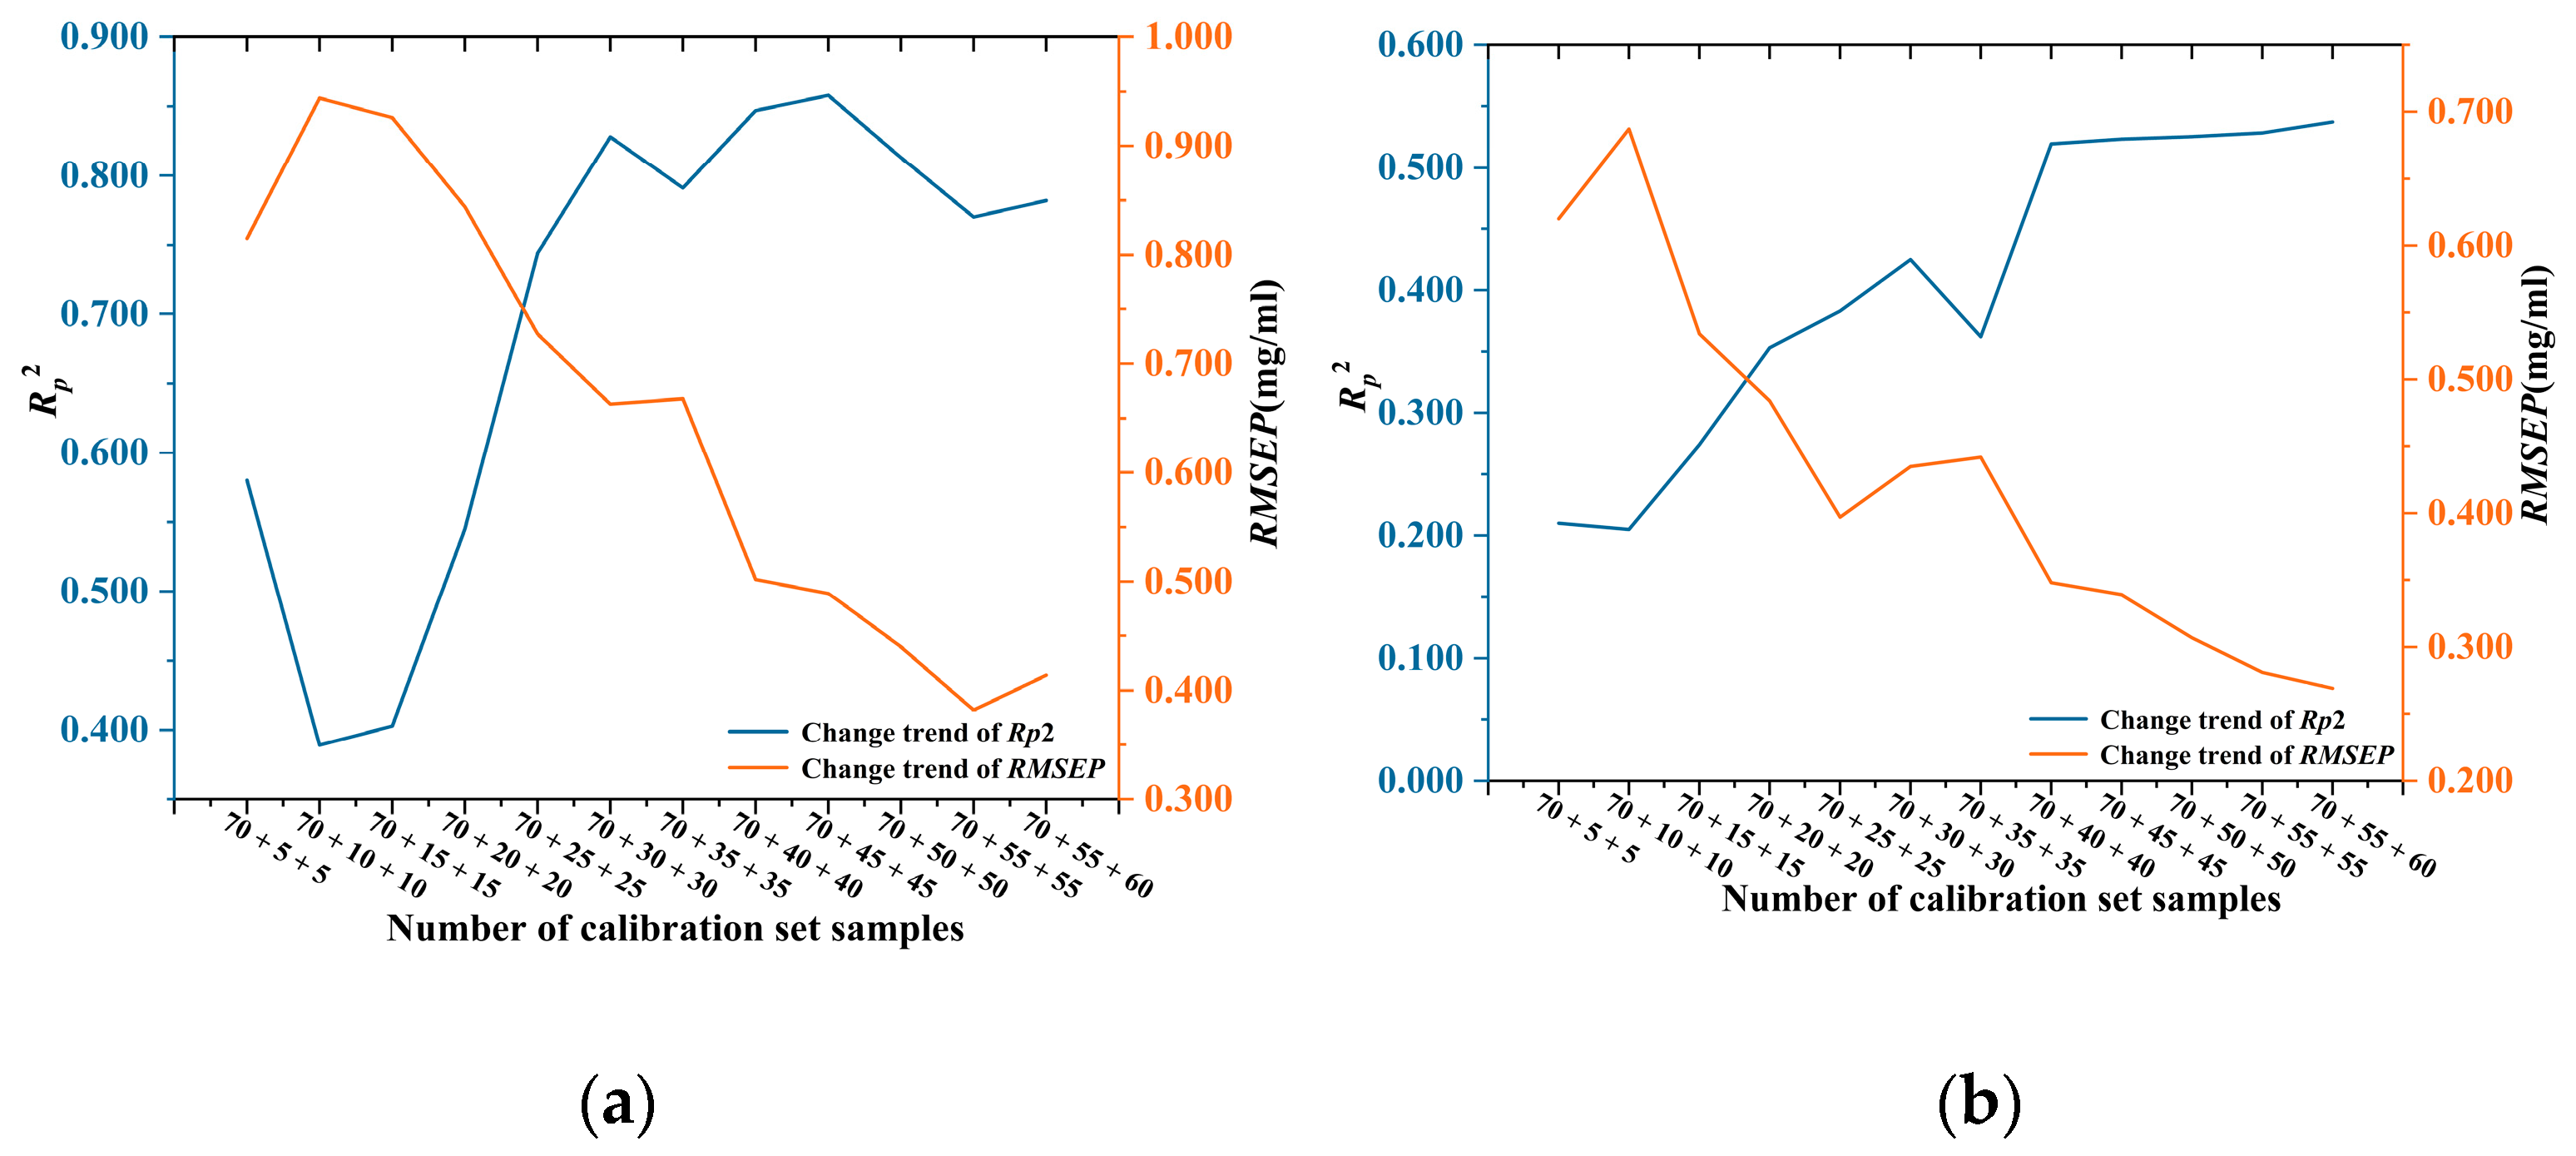
3.2.3. Improvement of the Prediction Precision of AO Model for Multiple Chinese Herbs
4. Conclusions
Supplementary Materials
Author Contributions
Funding
Data Availability Statement
Conflicts of Interest
References
- Geng, Z.; Gou, Y.; Zhou, J.; Yuan, J.; Wei, F.; Ma, S.C.; Zhang, Y.F.; Guo, L. Status of Testing Methods for Pigments in Chinese Material Medica, Decoction Pieces and Chinese Patent Medicine and Establishment General Pigment Testing Methods. Chin. Pharm. J. 2019, 54, 1418–1424. [Google Scholar]
- Zhou, J.; Liang, L.J.; Zeng, B. Separation and determination of basic orange II, acid orange II and auramine O in soybean products based on ionic liquid reverse micelle microextraction and ultra-high-performance liquid chromatography. J. Chromatogr. A 2022, 1673, 463042. [Google Scholar] [CrossRef] [PubMed]
- Burapan, S.; Kim, M.; Paisooksantivatana, Y.; Eser, B.E.; Han, J. Thai Curcuma Species: Antioxidant and Bioactive Compounds. Foods 2020, 9, 1219. [Google Scholar] [CrossRef] [PubMed]
- Ceja-Galicia, Z.A.; Aranda-Rivera, A.K.; Amador-Martinez, I.; Aparicio-Trejo, O.E.; Tapia, E.; Trujillo, J.; Ramírez, V.; Pedraza-Chaverri, J. The Development of Dyslipidemia in Chronic Kidney Disease and Associated Cardiovascular Damage, and the Protective Effects of Curcuminoids. Foods 2023, 12, 921. [Google Scholar] [CrossRef] [PubMed]
- Singh, K.; Srichairatanakool, S.; Chewonarin, T.; Prommaban, A.; Samakradhamrongthai, R.S.; Brennan, M.A.; Bennan, C.S.; Utama-Ang, N. Impact of Green Extraction on Curcuminoid Content, Antioxidant Activities and Anti-Cancer Efficiency (In Vitro) from Turmeric Rhizomes (Curcuma longa L.). Foods 2022, 11, 3633. [Google Scholar] [CrossRef] [PubMed]
- Zhang, J.C.; Fan, J.K.; Luo, H.; Liang, Z.W.; Guan, Y.H.; Lei, X.; Bo, N.G.; Zhao, M. Alleviation of Alcoholic Fatty Liver by Dendrobium officinale Flower Extracts due to Regulation of Gut Microbiota and Short-Chain Fatty Acids in Mice Exposed to Chronic Alcohol. Foods 2023, 12, 1428. [Google Scholar] [CrossRef] [PubMed]
- Liu, H.D.; Xing, Y.; Wang, Y.B.; Ren, X.X.; Zhang, D.Y.; Dai, J.Y.; Xiu, Z.L.; Yu, S.Q.; Dong, Y.S. Dendrobium officinale Polysaccharide Prevents Diabetes via the Regulation of Gut Microbiota in Prediabetic Mice. Foods 2023, 12, 2310. [Google Scholar] [CrossRef] [PubMed]
- Zara, S.; Petretto, G.L.; Mannu, A.; Zara, G.; Budroni, M.; Mannazzu, I.; Multineddu, C.; Pintore, G.; Fancello, F. Antimicrobial Activity and Chemical Characterization of a Non-Polar Extract of Saffron Stamens in Food Matrix. Foods 2021, 10, 703. [Google Scholar] [CrossRef]
- Chinese Pharmacopoeia Commission. Chinese Pharmacopoeia of the People’s Republic of China; China Medical Science and Technology Press: Beijing, China, 2020; Volume I.
- Jana, R.K.; Klara, N.; Vojtech, H.; Jana, H. Detection of botanical adulterants in Saffron powder. Anal. Bioanal. Chem. 2023, 415, 5723–5734. [Google Scholar]
- Younis, I.Y.; Mohsen, E.; Ibrahim, R.M.; Fernie, R.; Alseekh, S.; Salem, M.A. Non-targeted metabolomics and chemometrics for Saffron (Crocus sativus L.) authentication and adulteration detection in relation to its anticholinesterase activity. Food Chem. Adv. 2023, 2, 100217. [Google Scholar] [CrossRef]
- Pejman, A.; Reyhaneh, P.; Narges, G.G.; Soodabeh, E.; Abbas, R.; Hossein, S.M. Detection and Classification of Saffron Adulterants by Vis-Nir Imaging, Chemical Analysis, and Soft Computing. Foods 2023, 12, 2192. [Google Scholar]
- Holz, N.; Illarionov, B.; Wax, N.; Schmidt, C.; Fischer, M. Point-of-care suitable identification of the adulterants Carthamus tinctorius and Curcuma longa in Crocus sativus based on loop-mediated isothermal amplification (LAMP) and lateral-flow-assay (LFA). Food Control 2023, 148, 109637. [Google Scholar] [CrossRef]
- Yang, L.; Wu, W.R.; Zhou, H.; Lai, H.L.; Fu, F. Rapid identification of Dendrobium officinale using Loop-Mediated Isothermal Amplification (LAMP) method. Chin. J. Nat. Med. 2019, 17, 337–345. [Google Scholar] [CrossRef] [PubMed]
- Bansal, S.; Thakur, S.; Mangal, M.; Mangal, A.K.; Gupta, R.K. Identification of Suitable Locus for Specific Detection of Biological Adulterants of Saffron. Food Anal. Methods 2019, 12, 2509–2517. [Google Scholar] [CrossRef]
- Zhao, M.M.; Wang, B.; Xiang, L.; Xiong, C.; Shi, Y.H.; Meng, X.X.; Dong, G.Q.; Xie, Y.Q.; Sun, W. A novel onsite and visual molecular technique to authenticate Saffron (Crocus sativus) and its adulterants based on recombinase polymerase amplification. Food Control 2019, 100, 117–121. [Google Scholar] [CrossRef]
- Chu, C.; Yin, H.M.; Cheng, D.D.; Yan, J.Z.; Zhu, L. Discrimination of Dendrobium officinale and Its Common Adulterants by Combination of Normal Light and Fluorescence Microscopy. Molecules 2014, 19, 3718–3730. [Google Scholar] [CrossRef] [PubMed]
- Hu, C.; Zhang, Y.Z.; Yuan, Y.; Jiang, C.; Wei, F.; Ma, S.H. Molecular identification of Dendrobium huoshanense by PCR-RFLP analysis. Chin. J. Pharm. Anal. 2020, 40, 2109–2115. [Google Scholar]
- Wang, H.; Shi, L.L.; Zhou, J.; Zhu, G.P. DNA barcoding identification of Dendrobium huoshanense and its adulterants. China J. Chin. Mater. Medica 2018, 43, 4055–4061. [Google Scholar]
- Li, Q.; Yan, X.J.; Zhao, K.; Li, L.; Peng, S.G.; Luo, X.; Wen, Y.S.; Yan, Z.Y. Fast Inspection of Saffron on the Spot Based on Cloud-Connected Portable Near-Infrared Technology. Spectrosc. Spectr. Anal. 2020, 40, 3029–3037. [Google Scholar]
- Martina, F.; Ludovica, T.; Francesca, D.D.; Alessandra, B.; Antonio, D.A.A. A Novel FTIR-Based Chemometric Solution for the Assessment of Saffron Adulteration with Non-Fresh Stigmas. Molecules 2022, 28, 33. [Google Scholar]
- Dai, H.C.; Gao, Q.X.; Lu, J.K.; He, L.L. Improving the Accuracy of Saffron Adulteration Classification and Quantification through Data Fusion of Thin-Layer Chromatography Imaging and Raman Spectral Analysis. Foods 2023, 12, 2322. [Google Scholar] [CrossRef] [PubMed]
- Bandara, C.G.W.; Prabhath, K.W.G.; Dissanayake, B.C.S.W.D.; Herath, R.V.; Godaliyadda, I.R.M.G.; Ekanayake, B.P.M.; Demini, D.; Madhujith, T. Validation of multispectral imaging for the detection of selected adulterants in turmeric samples. J. Food Eng. 2020, 266, 109700. [Google Scholar]
- Zhai, Q.; Yang, Z.W.; Shi, X.L.; Fan, C.L. Detection method of staining in turmeric Auramine O. China Med. Pharm. 2015, 5, 57–60. [Google Scholar]
- Zhang, B.B.; Shi, Y.; Chen, H.; Zhu, Q.X.; Lu, F. TLC-SERS for detection of the dyed Croci Stigma. J. Pharm. Pract. Serv. 2017, 35, 215–218. [Google Scholar]
- Sun, J.W. Liquid chromatographic method for the determination of the colouring agent Auramine O in Dendrobium officinale. Shandong J. Tradit. Chin. Med. 2015, 34, 53–54. [Google Scholar]
- TranLam, T.T.; Hong, M.B.T.; Le, G.T.; Luu, P.D. Auramine O in foods and spices determined by an UPLC-MS/MS method. Food Addit. Contam. Part B Surveill. 2020, 13, 171–176. [Google Scholar] [CrossRef] [PubMed]
- Amalraj, A.; Peruaml, P. Label-free DNAzyme for highly sensitive detection of multiple biomolecules in real samples through target-triggered catalytic cleavage reactions with auramine O’s discriminated fluorescence emission. Anal. Bioanal. Chem. 2022, 414, 4021–4037. [Google Scholar] [CrossRef]
- Wang, W.H.; Yang, Z.Q.; Xiao, L.X.; Han, J.; Guan, T.Z.; Gong, X.J.; Hu, Q. Paper-based visualization of Auramine O in food and drug samples with carbon dots-incorporated fluorescent microspheres as sensing element. Food Chem. 2023, 429, 136890. [Google Scholar] [CrossRef]
- Wang, W.H.; Yang, Z.Q.; Xiao, L.X.; Han, J.; Guan, T.Z.; Gong, X.J.; Hu, Q. Supersensitive detection of Auramine O in food and drug samples by using carbon dots as sensing reagents. J. Food Meas. Charact. 2023, 17, 5360–5370. [Google Scholar] [CrossRef]
- Kim, T.N.T.; Bui, T.T.; Pham, A.T.; Duong, V.T.; Le, T.H.G. Fast Determination of Auramine O in Food by Adsorptive Stripping Voltammetry. J. Anal. Methods Chem. 2019, 2019, 8639528. [Google Scholar]
- Mahmoud Mohamed, E.; Abdelwahab Mohamed, S.; Ibrahim Ghada, A.A. Surface functionalization of magnetic graphene oxide@ bentonite with α-amylase enzyme as a novel bionanosorbent for effective removal of Rhodamine B and Auramine O dyes. Mater. Chem. Phys. 2023, 301, 127638. [Google Scholar] [CrossRef]
- Zhang, H.; Li, Z.; Chen, T.; Qin, B.Y. Quantitative determination of Auramine O by terahertz spectroscopy with 2DCOS-PLSR model. Spectrochim. Acta Part A Mol. Biomol. Spectrosc. 2017, 184, 335–341. [Google Scholar] [CrossRef] [PubMed]
- Zhang, H.; Li, Z. Terahertz spectroscopy applied to quantitative determination of harmful additives in medicinal herbs. Optik 2018, 156, 834–840. [Google Scholar] [CrossRef]
- Luca, E.D.; Redaelli, M.; Zaffino, C.; Bruni, S. A SERS and HPLC study of traditional dyes from native Chinese plants. Vib. Spectrosc. 2018, 95, 62–67. [Google Scholar] [CrossRef]
- Shi, G.C.; Li, K.H.; Gu, J.G.; Yuan, W.Z.; Xu, S.Q.; Han, W.; Gu, J.J.; Wang, L.Y.; Zhang, B.B.; Chen, C.Z.; et al. Fabrication of Multifunctional SERS Platform Based on AgNPs Self-Assembly Ag-AAO Nanoarray for Direct Determination of Pesticide Residues and Baicalein in Real Samples. Coatings 2021, 11, 1054. [Google Scholar] [CrossRef]
- Li, L.J.; Cao, X.N.; Zhang, T.; Xiang, P.; Shen, C.H.; Zou, L.; Li, Q. Recent Developments in Surface-Enhanced Raman Spectroscopy and Its Application in Food Analysis: Alcoholic Beverages as an Example. Foods 2022, 11, 2165. [Google Scholar] [CrossRef]
- Shao, Y.; Chen, Y.; Zheng, Y.; Qi, X.H.; Zou, M.Q.; Zhang, X.F.; Yang, L.H. Rapid detection of Auramine O in drinks by surface-enhanced raman spectroscopy. Food Ferment. Ind. 2015, 41, 160–163 + 176. [Google Scholar]
- Yan, Z.; Zhang, L.B.; Ren, M.W.; Yang, Z.S.; Bu, Y.N.; Cai, L.P. Fast De termination of Auramine II, Basic Orange II and Metanil Yellow in Bean Products on Surface Enhanced Raman Spectroscopy and Use High Pergormance Liquid Chromatography-Tandem Mass Spectrometry to Verify. Spectrosc. Spectr. Anal. 2016, 36, 1761–1764. [Google Scholar]
- Zhang, W.J.; Qin, H.W.; Liu, Z.; Du, H.X.; Li, H.D.; Fang, L.P.; Chen, Z.L. Quantitative Determination of Auramine O in Bean Curd Sheets by Dispersive Solid Phase Extraction with Dynamic Surfaced-Enhanced Raman Spectroscopy. Anal. Lett. 2020, 53, 1282–1293. [Google Scholar] [CrossRef]
- Li, D.; Lv, D.Y.; Chen, H.; Lu, F.; Chen, Q.; Chu, K.D. Paper-based SERS wiper for detection of the dyed safflower. Chin. J. Pharm. Anal. 2015, 35, 1466–1470. [Google Scholar]
- Li, D.; Zhu, Q.X.; Lv, D.Y.; Zheng, B.X.; Liu, Y.H.; Chai, Y.F.; Lu, F. Silver-nanoparticle-based surface-enhanced Raman scattering wiper for the detection of dye adulteration of medicinal herbs. Anal. Bioanal. Chem. 2015, 407, 6031–6039. [Google Scholar] [CrossRef] [PubMed]
- Adade, S.Y.S.; Lin, H.; Haruna, S.A.; Osei, B.A.; Jiang, H.; Agyekum, A. SERS-based sensor coupled with multivariate models for rapid detection of palm oil adulteration with Sudan II and IV dyes. J. Food Compos. Anal. 2022, 114, 104834. [Google Scholar] [CrossRef]
- Li, H.H.; Luo, X.F.; Haruna, S.A.; Zareef, M.; Chen, Q.S.; Ding, Z.; Yan, Y.Y. Au-Ag OHCs-based SERS sensor coupled with deep learning CNN algorithm to quantify thiram and pymetrozine in tea. Food Chem. 2023, 428, 136798. [Google Scholar] [CrossRef] [PubMed]
- Sha, X.Y.; Fang, G.Q.; Cao, G.X.; Li, S.Z.; Hasi, W.; Han, S. Qualitative and quantitative detection and identification of two benzodiazepines based on SERS and convolutional neural network technology. Analyst 2022, 147, 5785. [Google Scholar] [CrossRef] [PubMed]
- Wu, X.J.; Du, Z.R.; Ma, R.Q.; Zhang, X.; Yang, D.L.; Liu, H.L.; Zhang, Y.G. Qualitative and quantitative studies of phthalates in extra virgin olive oil (EVOO) by surface-enhanced Raman spectroscopy (SERS) combined with long short-term memory (LSTM) neural network. Food Chem. 2024, 433, 137300. [Google Scholar] [CrossRef] [PubMed]
- Luo, X.M.; Chen, R.Q.; Kabir, M.H.; Liu, F.; Tao, Z.Y.; Liu, L.J.; Kong, W.W. Fast Detection of Heavy Metal Content in Fritillaria thunbergii by Laser-Induced Breakdown Spectroscopy with PSO-BP and SSA-BP Analysis. Molecules 2023, 28, 3360. [Google Scholar] [CrossRef]
- Li, P.Y.; Gao, W.X.; Zhang, X.J.; He, M.L.; Ge, C.Y.; Wang, L. Prediction of Peak Velocity of Blasting Vibration based on SSA-BP. Blasting 2023, 1–12. [Google Scholar]
- Li, M.H.; Gu, Y.L.; Ge, S.K.; Zhang, Y.F.; Mou, C.; Zhu, H.C.; Wei, G.F. Classification and identification of mixed gases based on the combination of semiconductor sensor array with SSA-BP neural network. Meas. Sci. Technol. 2023, 34, 085110. [Google Scholar] [CrossRef]
- Zheng, Y.Z.; Li, L.; Qian, L.; Cheng, B.S.; Hou, W.B.; Zhuang, Y. Sine-SSA-BP Ship Trajectory Prediction Based on Chaotic Mapping Improved Sparrow Search Algorithm. Sensors 2023, 23, 704. [Google Scholar] [CrossRef]
- Hao, B.; Liu, L.W.; Gu, J.M. Research on Projectile Range Prediction Based on SSA-BP Algorithm. J. Gun Launch Control 2023, 10, 1–5. [Google Scholar]
- Frens, G. Controlled Nucleation for the Regulation of the Particle Size in Monodisperse Gold Suspensions. Nat. Phys. Sci. 1973, 241, 20–22. [Google Scholar] [CrossRef]
- Xie, J.; Huang, J.H.; Ren, G.X.; Jin, J.; Chen, L.; Zhong, C.; Cai, Y.; Liu, H.; Zhou, R.R.; Qin, Y.H.; et al. Determination of Cultivation Regions and Quality Parameters of Poria cocos by Near-Infrared Spectroscopy and Chemometrics. Foods 2022, 11, 892. [Google Scholar] [CrossRef] [PubMed]
- Zhan, B.S.; Xiao, X.; Pan, F.; Luo, W.; Dong, W.T.; Tian, P.; Zhang, H.L. Determination of SSC and TA content of pear by Vis-NIR spectroscopy combined CARS and RF algorithm. Int. J. Wirel. Mob. Comput. 2021, 21, 41–51. [Google Scholar] [CrossRef]
- Yuan, L.M.; Yang, X.F.; Fu, X.P.; Yang, J.; Chen, X.; Huang, G.Z.; Chen, X.J.; Li, L.M.; Shi, W. Consensual Regression of Lasso-Sparse PLS models for Near-Infrared Spectra of Food. Agriculture 2022, 12, 1804. [Google Scholar] [CrossRef]
- Chen, C.H.; Zhong, Y.S.; Wang, X.Y.; Zhao, Y.K.; Dai, F. Feature Selection Algorithm for Identification of Male and Female Cocoons Based on SVM Bootstrapping ReWeighted Sampling. Spectrosc. Spectr. Anal. 2022, 42, 1173–1178. [Google Scholar]
- Zhang, X.; Xiao, X.; Zheng, W.N.; Zhang, L.J. On Machine Recognition of Tool Breakage Based on SSA-BP Algorithm. Metrol. Meas. Tech. 2023, 50, 57–61 + 64. [Google Scholar]
- Wu, T.; Ling, J.; Zhang, N.; Zan, X.S.; Du, D.R. Optimization of Sparrow Search Algorithm and BP Neural Network for Prediction of Moisture Content in Microwave Drying of Beef. Food Sci. Technol. 2023, 48, 113–120. [Google Scholar]
- Liu, Z.G.; Yu, H.; Jin, W. Adaptive Leakage Protection for Low-Voltage Distribution Systems Based on SSA-BP Neural Network. Appl. Sci. 2023, 13, 9273. [Google Scholar] [CrossRef]
- Hu, G.T.; Shang, H.W.; Tan, R.H.; Xu, X.H.; Pan, W.D. Research on Model Transfer Method of Organic Matter Content Estimation of Different Soils Using VNIR Spectroscopy. Spectrosc. Spectr. Anal. 2022, 42, 3148–3154. [Google Scholar]
- Marcelino, M.R.; Muralha, S.F. Synthetic organic pigments in contemporary Balinese painting: A Raman microscopy study. J. Raman Spectrosc. 2012, 43, 1281–1292. [Google Scholar] [CrossRef]
- Peng, Y.K.; Tian, W.J.; Guo, Q.H.; Zhao, X.L.; Qiao, X. Nondestructive quantitative analysis of acetamiprid in apple based on enhanced raman spectra. Trans. Chin. Soc. Agric. Eng. 2021, 37, 310–316. [Google Scholar]


| Name | Origin | Dataset Size | Calibration Set | Test Set |
|---|---|---|---|---|
| Dendrobium officinale | Taizhou, Zhejiang | 100 | 70 | 30 |
| Saffron | Naqu, Tibet | 85 | n × 5 (n = 1, 2, …, 11) | 30 |
| Curcuma xanthorriza Roxb | Leshan, Sichuan | 90 | m × 5 (m = 1, 2, …, 12) | 30 |
| Name | Formula | Descriptions |
|---|---|---|
| airPLS | , | is the original spectra, is the fitted spectra, is the abscissa of spectral data, is fidelity, is the roughness of the , is the balance parameters, is the weighted penalty least square formula ( is the number of iterations) |
| SG | is the smoothed spectra, is the original spectra, and is the smoothing coefficient, is the number of data in the sliding window, is the window width, . | |
| MSC | , , | is the average spectra, is the spectral number, is the original spectra information of article , is the regression coefficient, b is the regression constant, is the corrected spectra. |
| SNV | is the transformed spectra, is the average value of the spectra of the , = 1, 2, …, m, = 1, 2, …, is the number of the samples. | |
| PLSR | , , , | is the Raman spectra matrix, is the AO matrix, are Principal factor score matrix, is the load matrix, are the fitting residual matrix. |
| SVM | is the weight vector, is the SERS spectrum, is the Lagrange factor, is the kernel function. |
| Wavelength (cm−1) | Assignment |
|---|---|
| 551 cm−1, 649 cm−1 | C-H stretching vibration |
| 735 cm−1 | H-C-H deformation vibration |
| 778 cm−1 | C-N-C deformation vibration |
| 1189 cm−1 | C-C stretching vibration |
| 1438 cm−1, 1481 cm−1 | Benzene ring stretching vibration |
| 1598 cm−1 | C-N twisting vibration |
| Calibration Set | Test Set | Pre-Processing | Rc2 | /mg/mL | Rp2 | /mg/mL | |
|---|---|---|---|---|---|---|---|
| PLSR | 70 | 30 | airPLS + SG + MSC | 0.946 | 0.085 | 0.940 | 0.099 |
| SVM | 70 | 30 | airPLS + SG + SNV | 0.963 | 0.140 | 0.930 | 0.209 |
| SSA-BP | 70 | 30 | airPLS + SNV | 0.977 | 0.054 | 0.962 | 0.080 |
| Calibration Set | Test Set | Pre-Processing | Rc2 | /mg/mL | Rp2 | /mg/mL | |
|---|---|---|---|---|---|---|---|
| PLS | 70 D. officinale | 30 Saffron | SG + MSC | 0.910 | 0.119 | 0.751 | 0.344 |
| SVM | airPLS + SG | 0.919 | 0.241 | 0.714 | 0.662 | ||
| SSA-BP | airPLS + SG + MSC | 0.981 | 0.054 | 0.628 | 0.238 | ||
| PLS | 70 D. officinale | 30 Curcuma | SNV | 0.929 | 0.106 | 0.399 | 0.623 |
| SVM | SG + SNV | 0.937 | 0.202 | 0.229 | 1.257 | ||
| SSA-BP | airPLS + SNV | 0.938 | 0.099 | 0.005 | 0.460 |
| Calibration Set | Test Set | Pre-Processing | Rc2 | /mg/mL | Rp2 | /mg/mL | |
|---|---|---|---|---|---|---|---|
| PLS | 70 D. officinale + 5 Saffron + 5 Curcuma | 30 Saffron | SG + SNV + MSC | 0.811 | 0.169 | 0.394 | 0.353 |
| SVM | SNV | 0.901 | 0.248 | 0.580 | 0.815 | ||
| SSA-BP | SG + SNV | 0.879 | 0.135 | 0.224 | 0.344 | ||
| PLS | 70 D. officinale + 5 Saffron + 5 Curcuma | 30 Curcuma | SNV | 0.894 | 0.127 | 0.210 | 0.620 |
| SVM | SNV | 0.908 | 0.246 | 0.037 | 1.018 | ||
| SSA-BP | SG + SNV | 0.8323 | 0.159 | 0.005 | 0.999 |
| Calibration Set Sample Size | Saffron | Curcuma | ||
|---|---|---|---|---|
| Rp2 | /mg/mL | Rp2 | /mg/mL | |
| 70 + 5 + 5 | 0.751 | 0.549 | 0.494 | 0.428 |
| 70 + 10 + 10 | 0.762 | 0.580 | 0.474 | 0.421 |
| 70 + 15 + 15 | 0.792 | 0.592 | 0.468 | 0.297 |
| 70 + 20 + 20 | 0.754 | 0.604 | 0.493 | 0.289 |
| 70 + 25 + 25 | 0.754 | 0.727 | 0.495 | 0.305 |
| 70 + 30 + 30 | 0.790 | 0.541 | 0.495 | 0.354 |
| 70 + 35 + 35 | 0.791 | 0.668 | 0.477 | 0.384 |
| 70 + 40 + 40 | 0.811 | 0.483 | 0.470 | 0.337 |
| 70 + 45 + 45 | 0.814 | 0.447 | 0.476 | 0.313 |
| 70 + 50 + 50 | 0.807 | 0.411 | 0.493 | 0.299 |
| 70 + 55 + 55 | 0.812 | 0.341 | 0.510 | 0.288 |
| 70 + 55 + 60 | 0.782 | 0.414 | 0.525 | 0.283 |
Disclaimer/Publisher’s Note: The statements, opinions and data contained in all publications are solely those of the individual author(s) and contributor(s) and not of MDPI and/or the editor(s). MDPI and/or the editor(s) disclaim responsibility for any injury to people or property resulting from any ideas, methods, instructions or products referred to in the content. |
© 2023 by the authors. Licensee MDPI, Basel, Switzerland. This article is an open access article distributed under the terms and conditions of the Creative Commons Attribution (CC BY) license (https://creativecommons.org/licenses/by/4.0/).
Share and Cite
Zhang, L.; Zhang, C.; Li, W.; Li, L.; Zhang, P.; Zhu, C.; Ding, Y.; Sun, H. Rapid Indentification of Auramine O Dyeing Adulteration in Dendrobium officinale, Saffron and Curcuma by SERS Raman Spectroscopy Combined with SSA-BP Neural Networks Model. Foods 2023, 12, 4124. https://doi.org/10.3390/foods12224124
Zhang L, Zhang C, Li W, Li L, Zhang P, Zhu C, Ding Y, Sun H. Rapid Indentification of Auramine O Dyeing Adulteration in Dendrobium officinale, Saffron and Curcuma by SERS Raman Spectroscopy Combined with SSA-BP Neural Networks Model. Foods. 2023; 12(22):4124. https://doi.org/10.3390/foods12224124
Chicago/Turabian StyleZhang, Leilei, Caihong Zhang, Wenxuan Li, Liang Li, Peng Zhang, Cheng Zhu, Yanfei Ding, and Hongwei Sun. 2023. "Rapid Indentification of Auramine O Dyeing Adulteration in Dendrobium officinale, Saffron and Curcuma by SERS Raman Spectroscopy Combined with SSA-BP Neural Networks Model" Foods 12, no. 22: 4124. https://doi.org/10.3390/foods12224124
APA StyleZhang, L., Zhang, C., Li, W., Li, L., Zhang, P., Zhu, C., Ding, Y., & Sun, H. (2023). Rapid Indentification of Auramine O Dyeing Adulteration in Dendrobium officinale, Saffron and Curcuma by SERS Raman Spectroscopy Combined with SSA-BP Neural Networks Model. Foods, 12(22), 4124. https://doi.org/10.3390/foods12224124