
The Influence of Probiotic Supplementation on the Obesity Indexes, Neuroinflammatory and Oxidative Stress Markers, Gut Microbial Diversity, and Working Memory in Obese Thai Children
 ,
,  ,
,  , , ,
, , ,  and
and 
Abstract
:1. Introduction
2. Materials and Methods
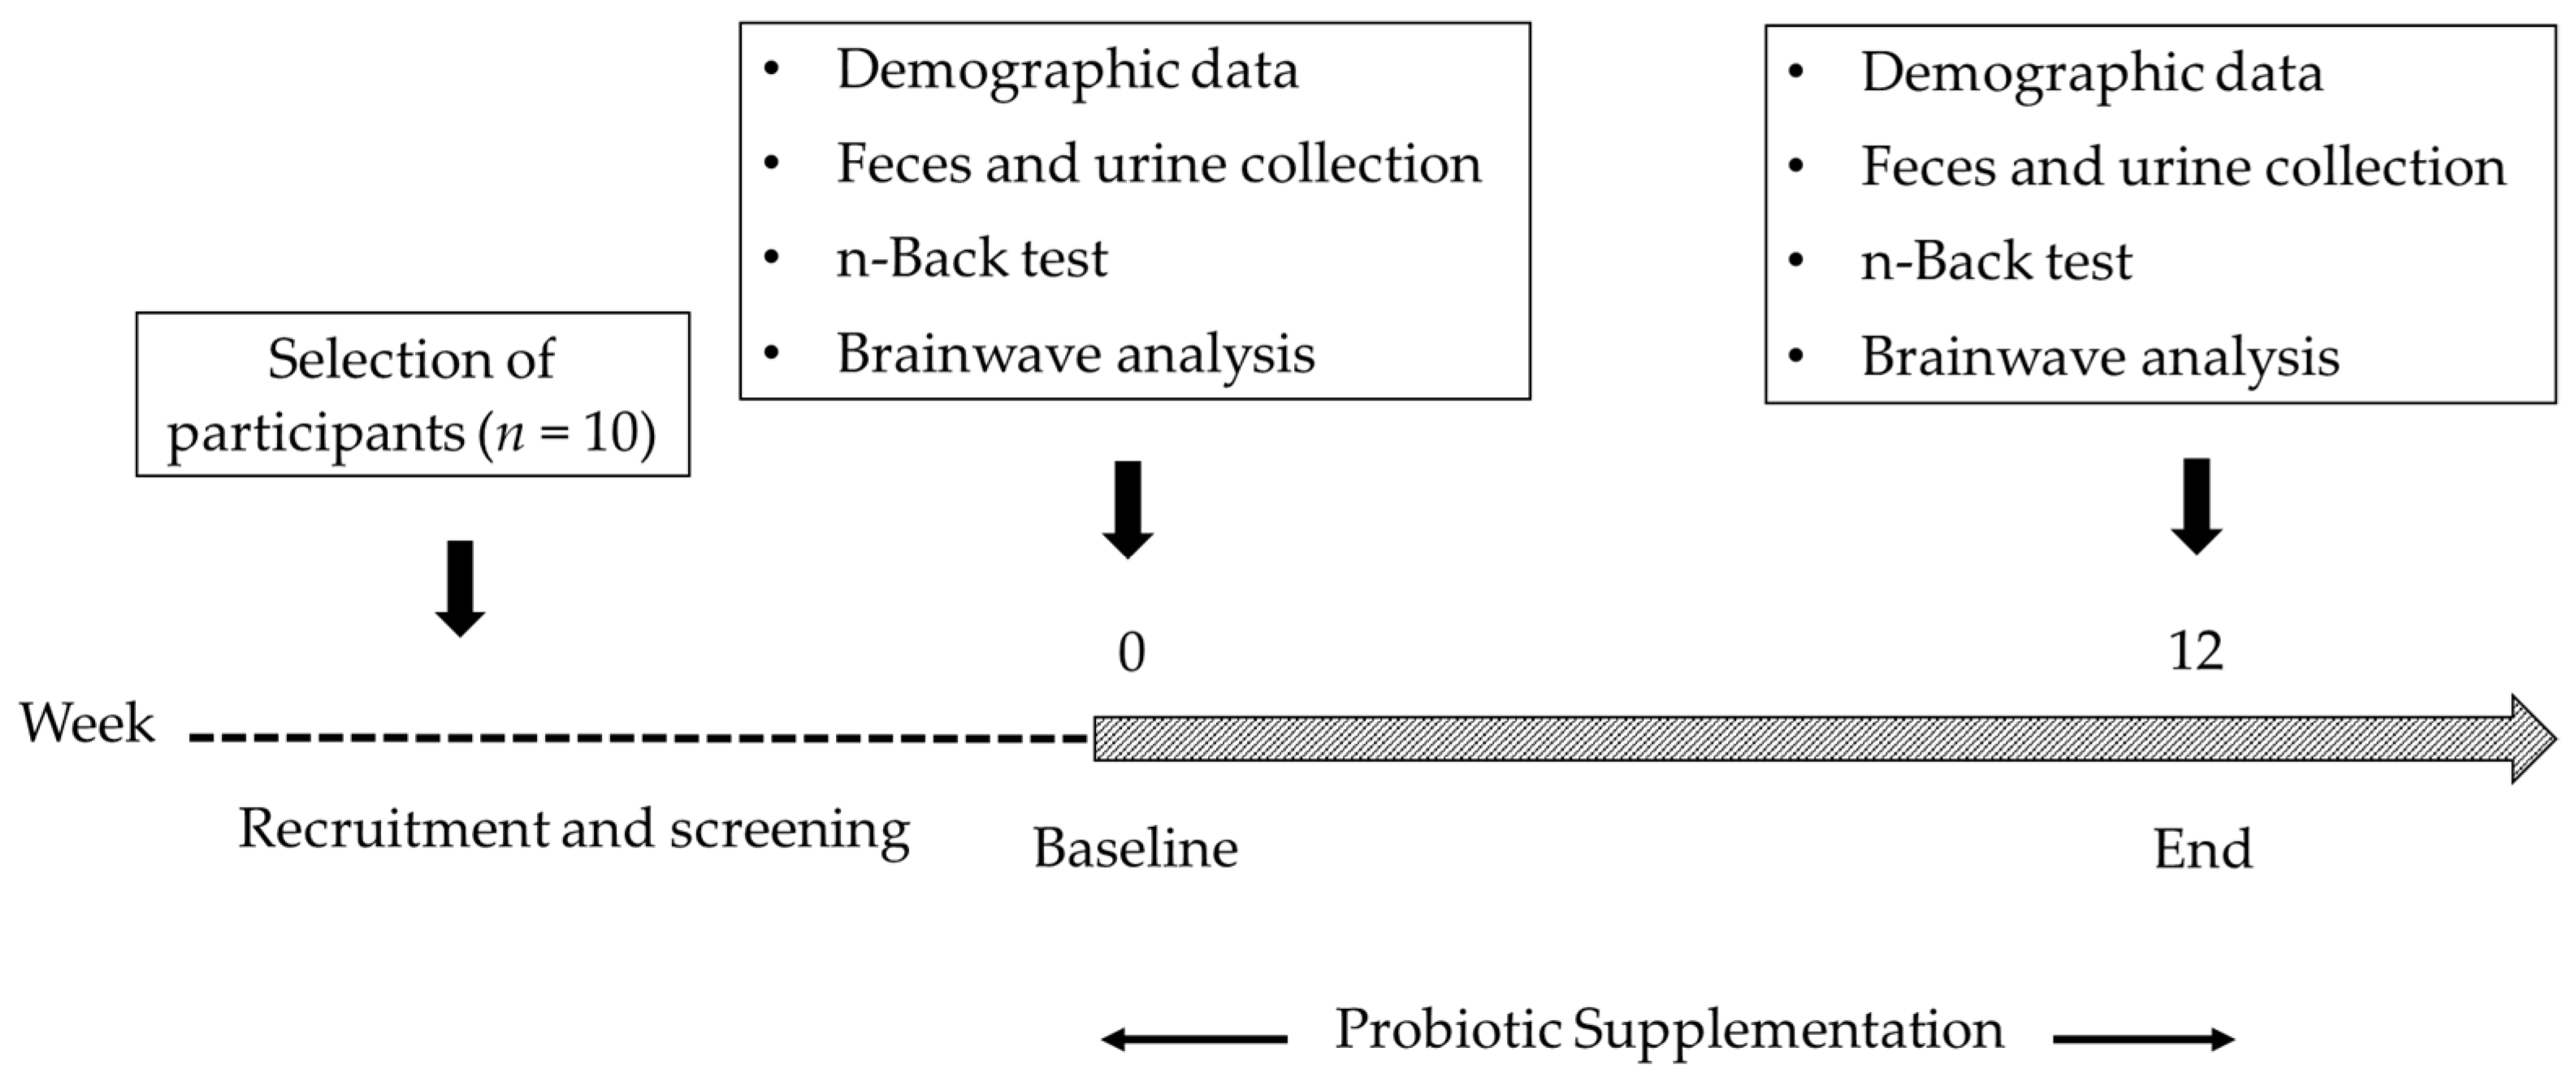
2.1. Study Group
2.2. Probiotic Supplementation
2.3. Demographic Assessments
2.4. Measurement of Gut Microbial Metabolites
2.5. Measurement of Oxidative Stress Markers
2.5.1. Total Antioxidant Capacity (TAC)
2.5.2. Lipid Peroxidation
2.6. Measurement of Neuroinflammatory Markers
2.7. Next-Generation Sequencing (NGS)
2.8. Assessment of Working Memory
2.8.1. Neuropsychological Testing
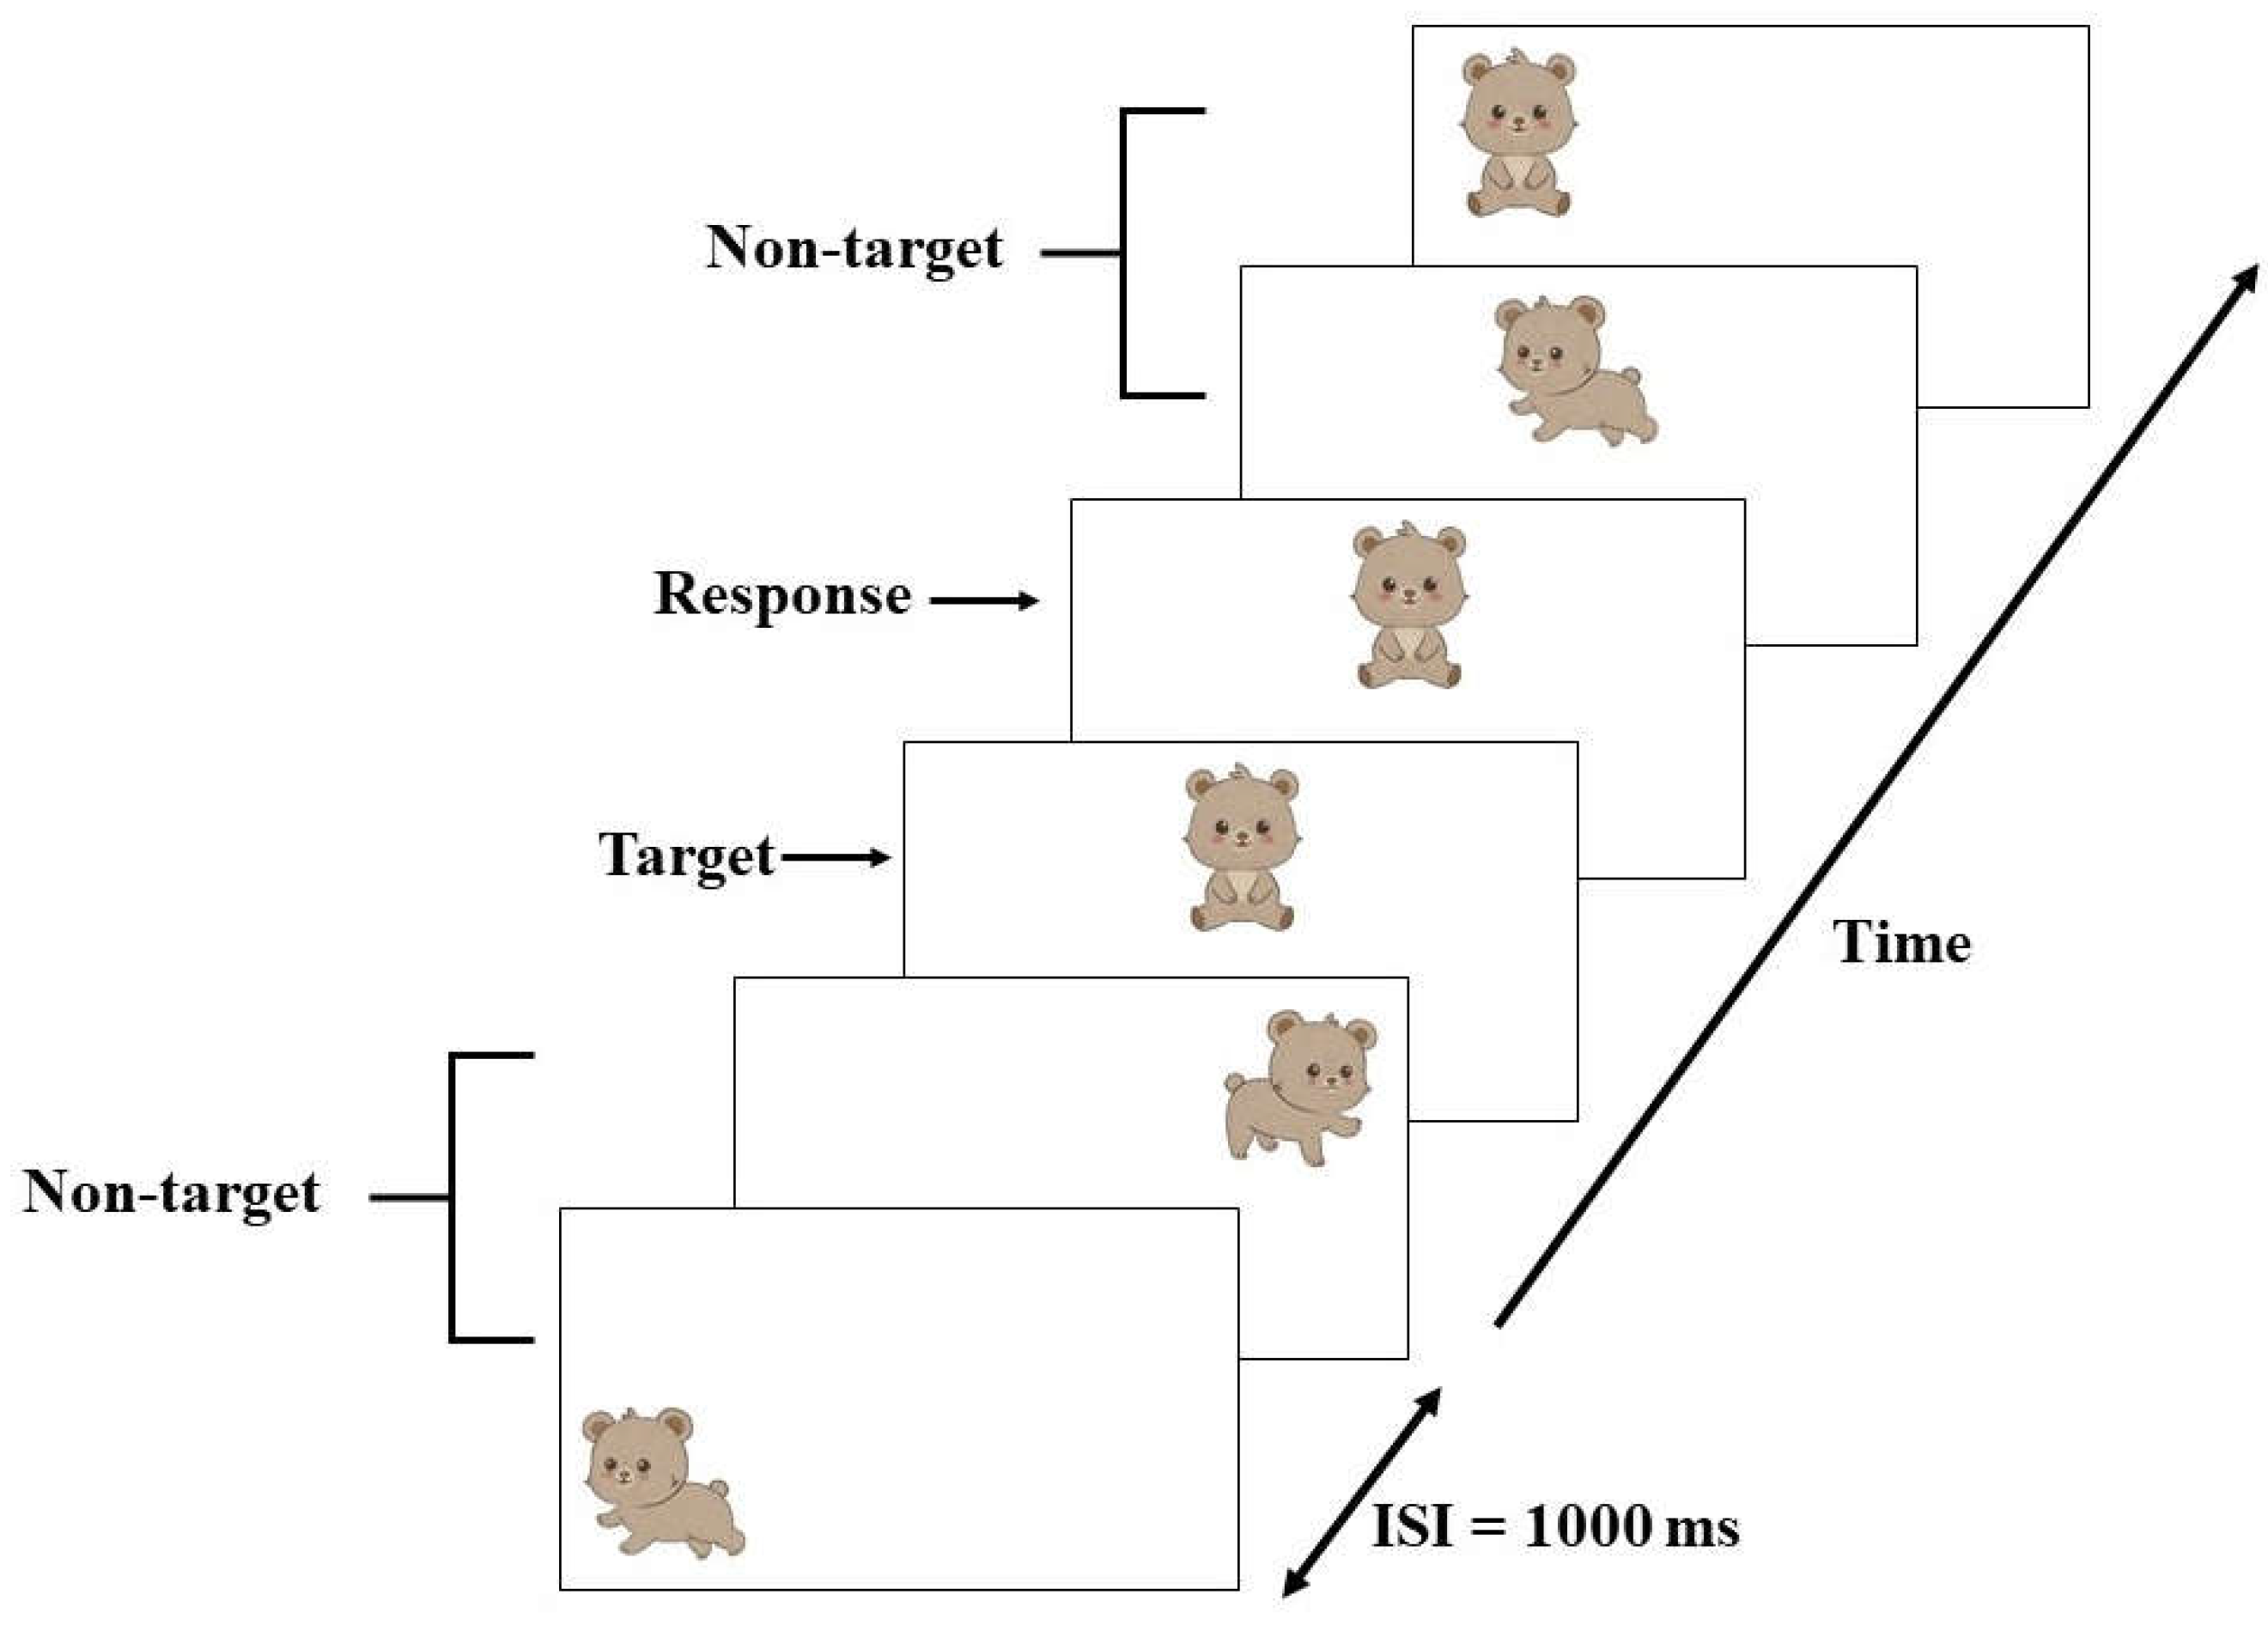
2.8.2. Event-Related Potential (ERP) Recording Procedure
2.9. Statistical Analysis
3. Results
3.1. The Effect on Obesity Index, Gut Microbial Metabolites, Oxidative Stress, and Neuroinflammatory Markers
3.2. Bacterial Sequencing
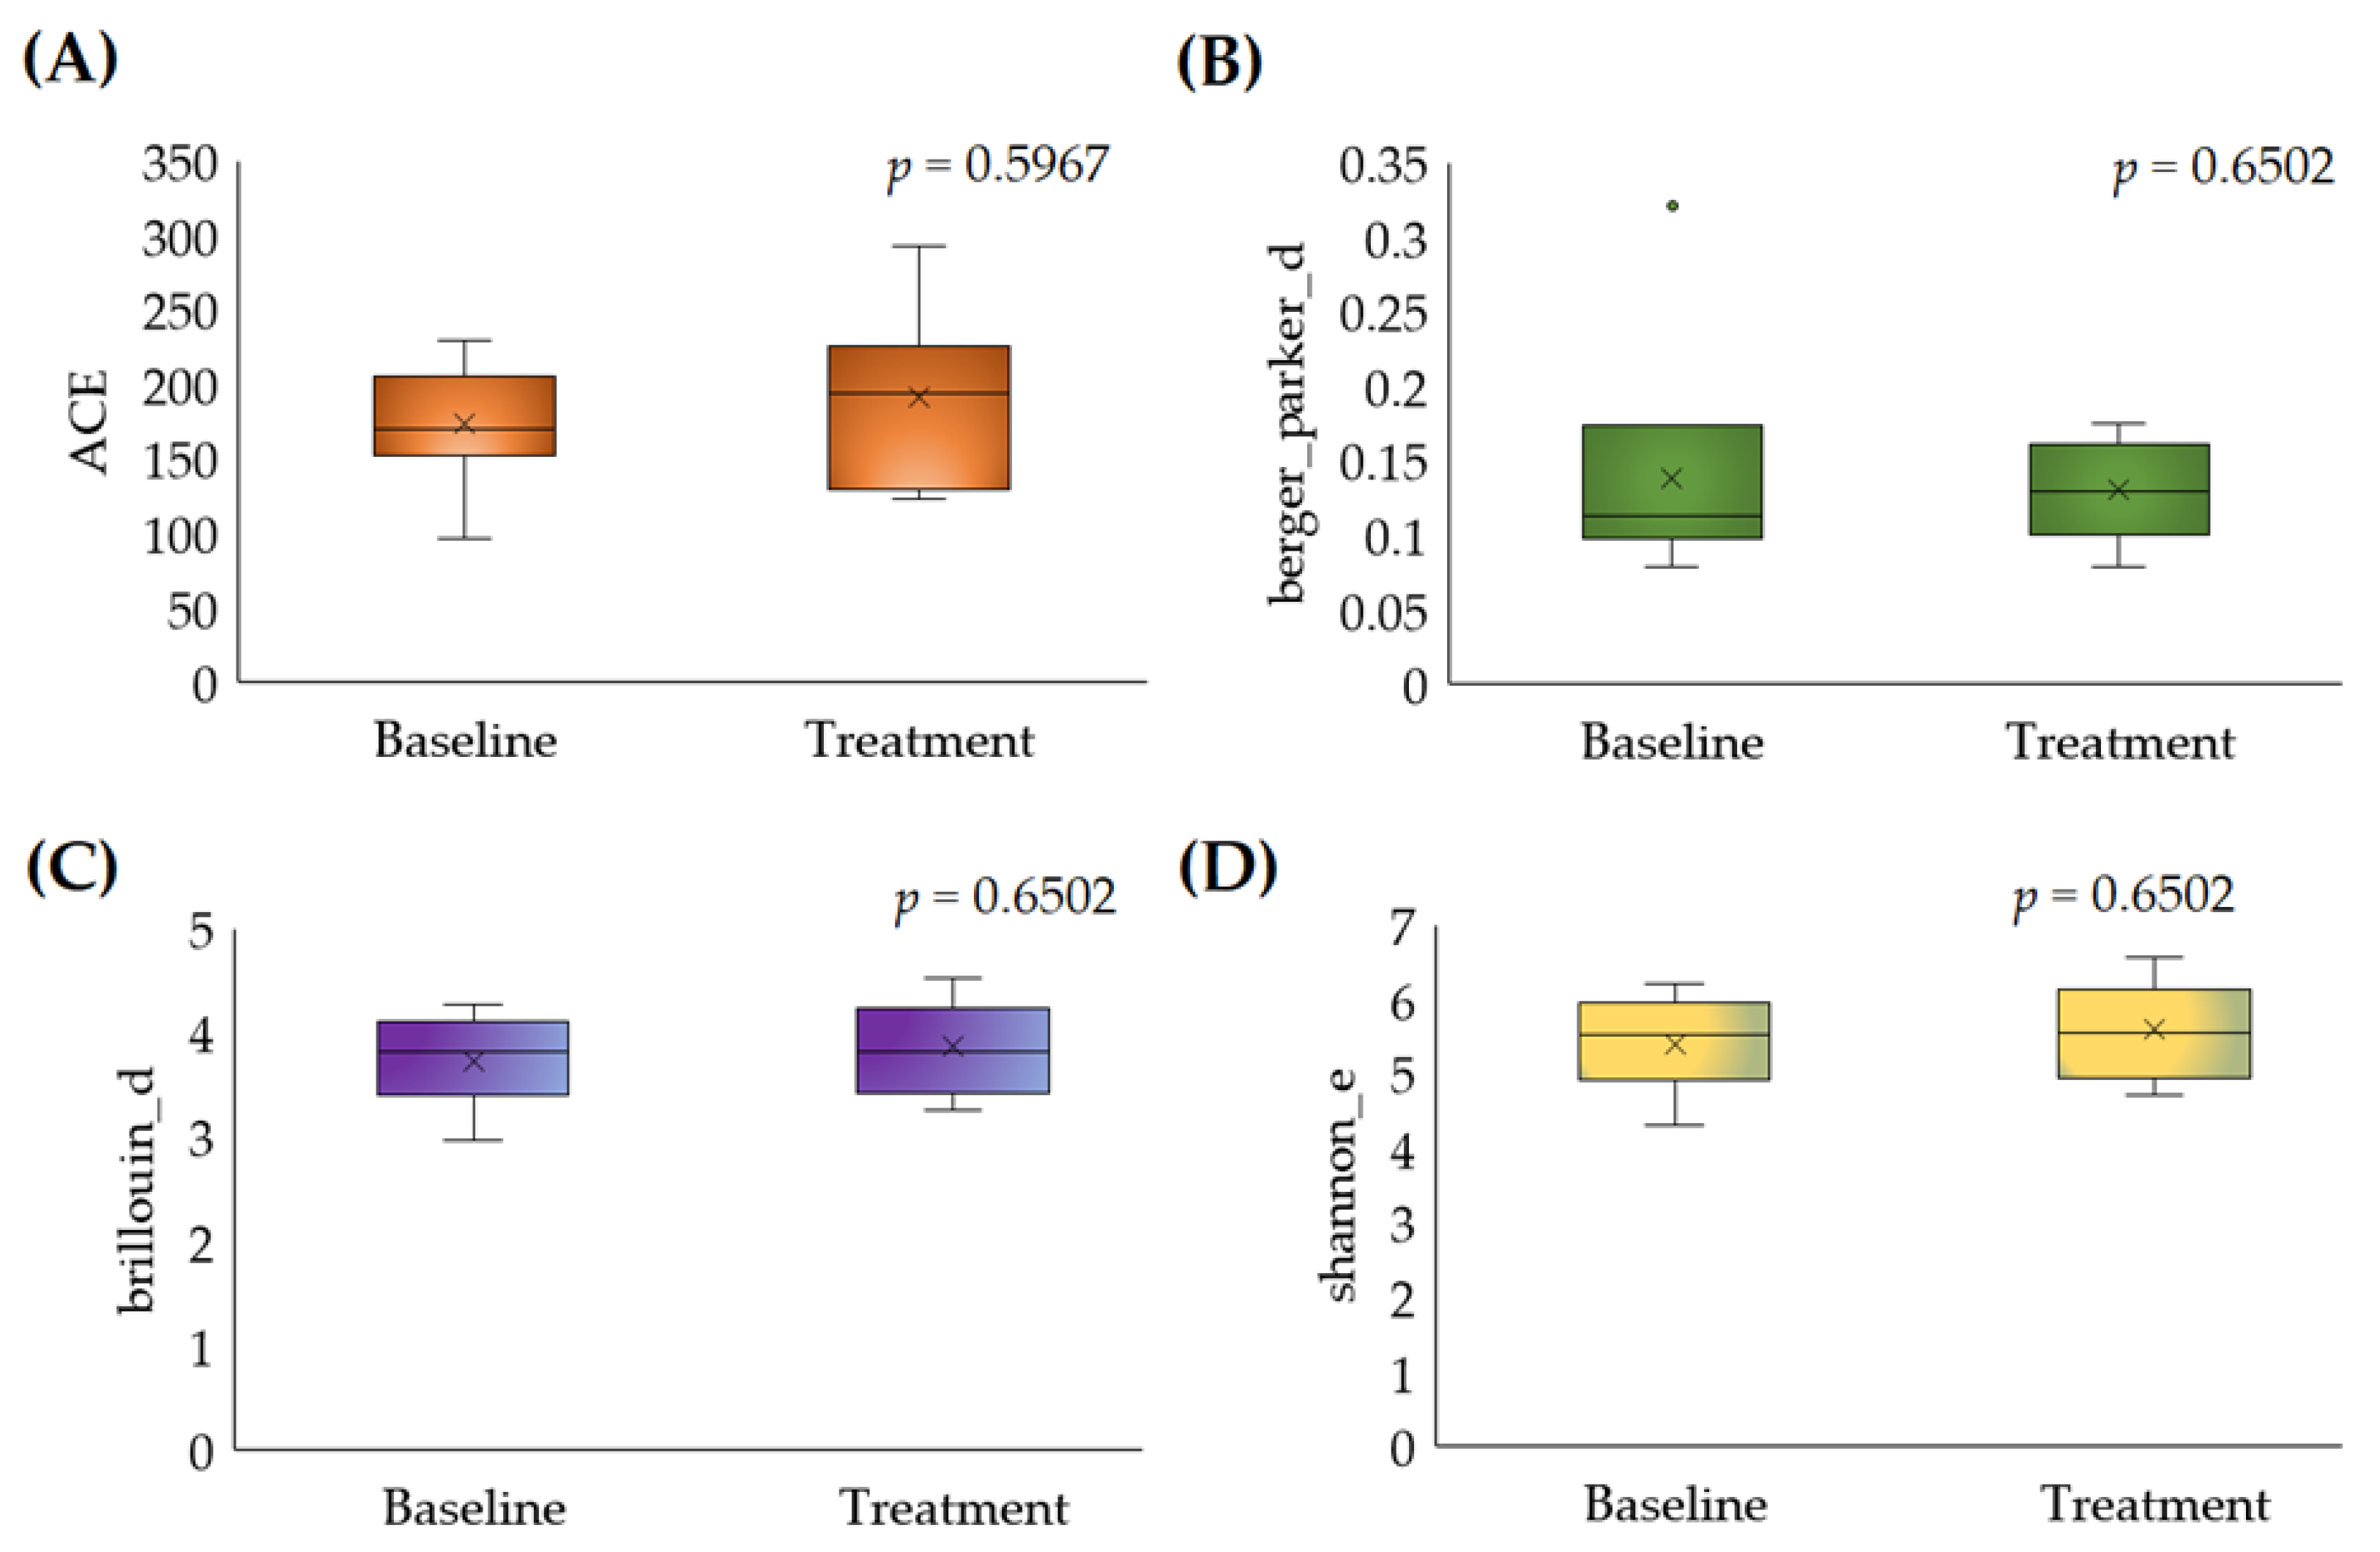
3.2.1. Alpha Diversity
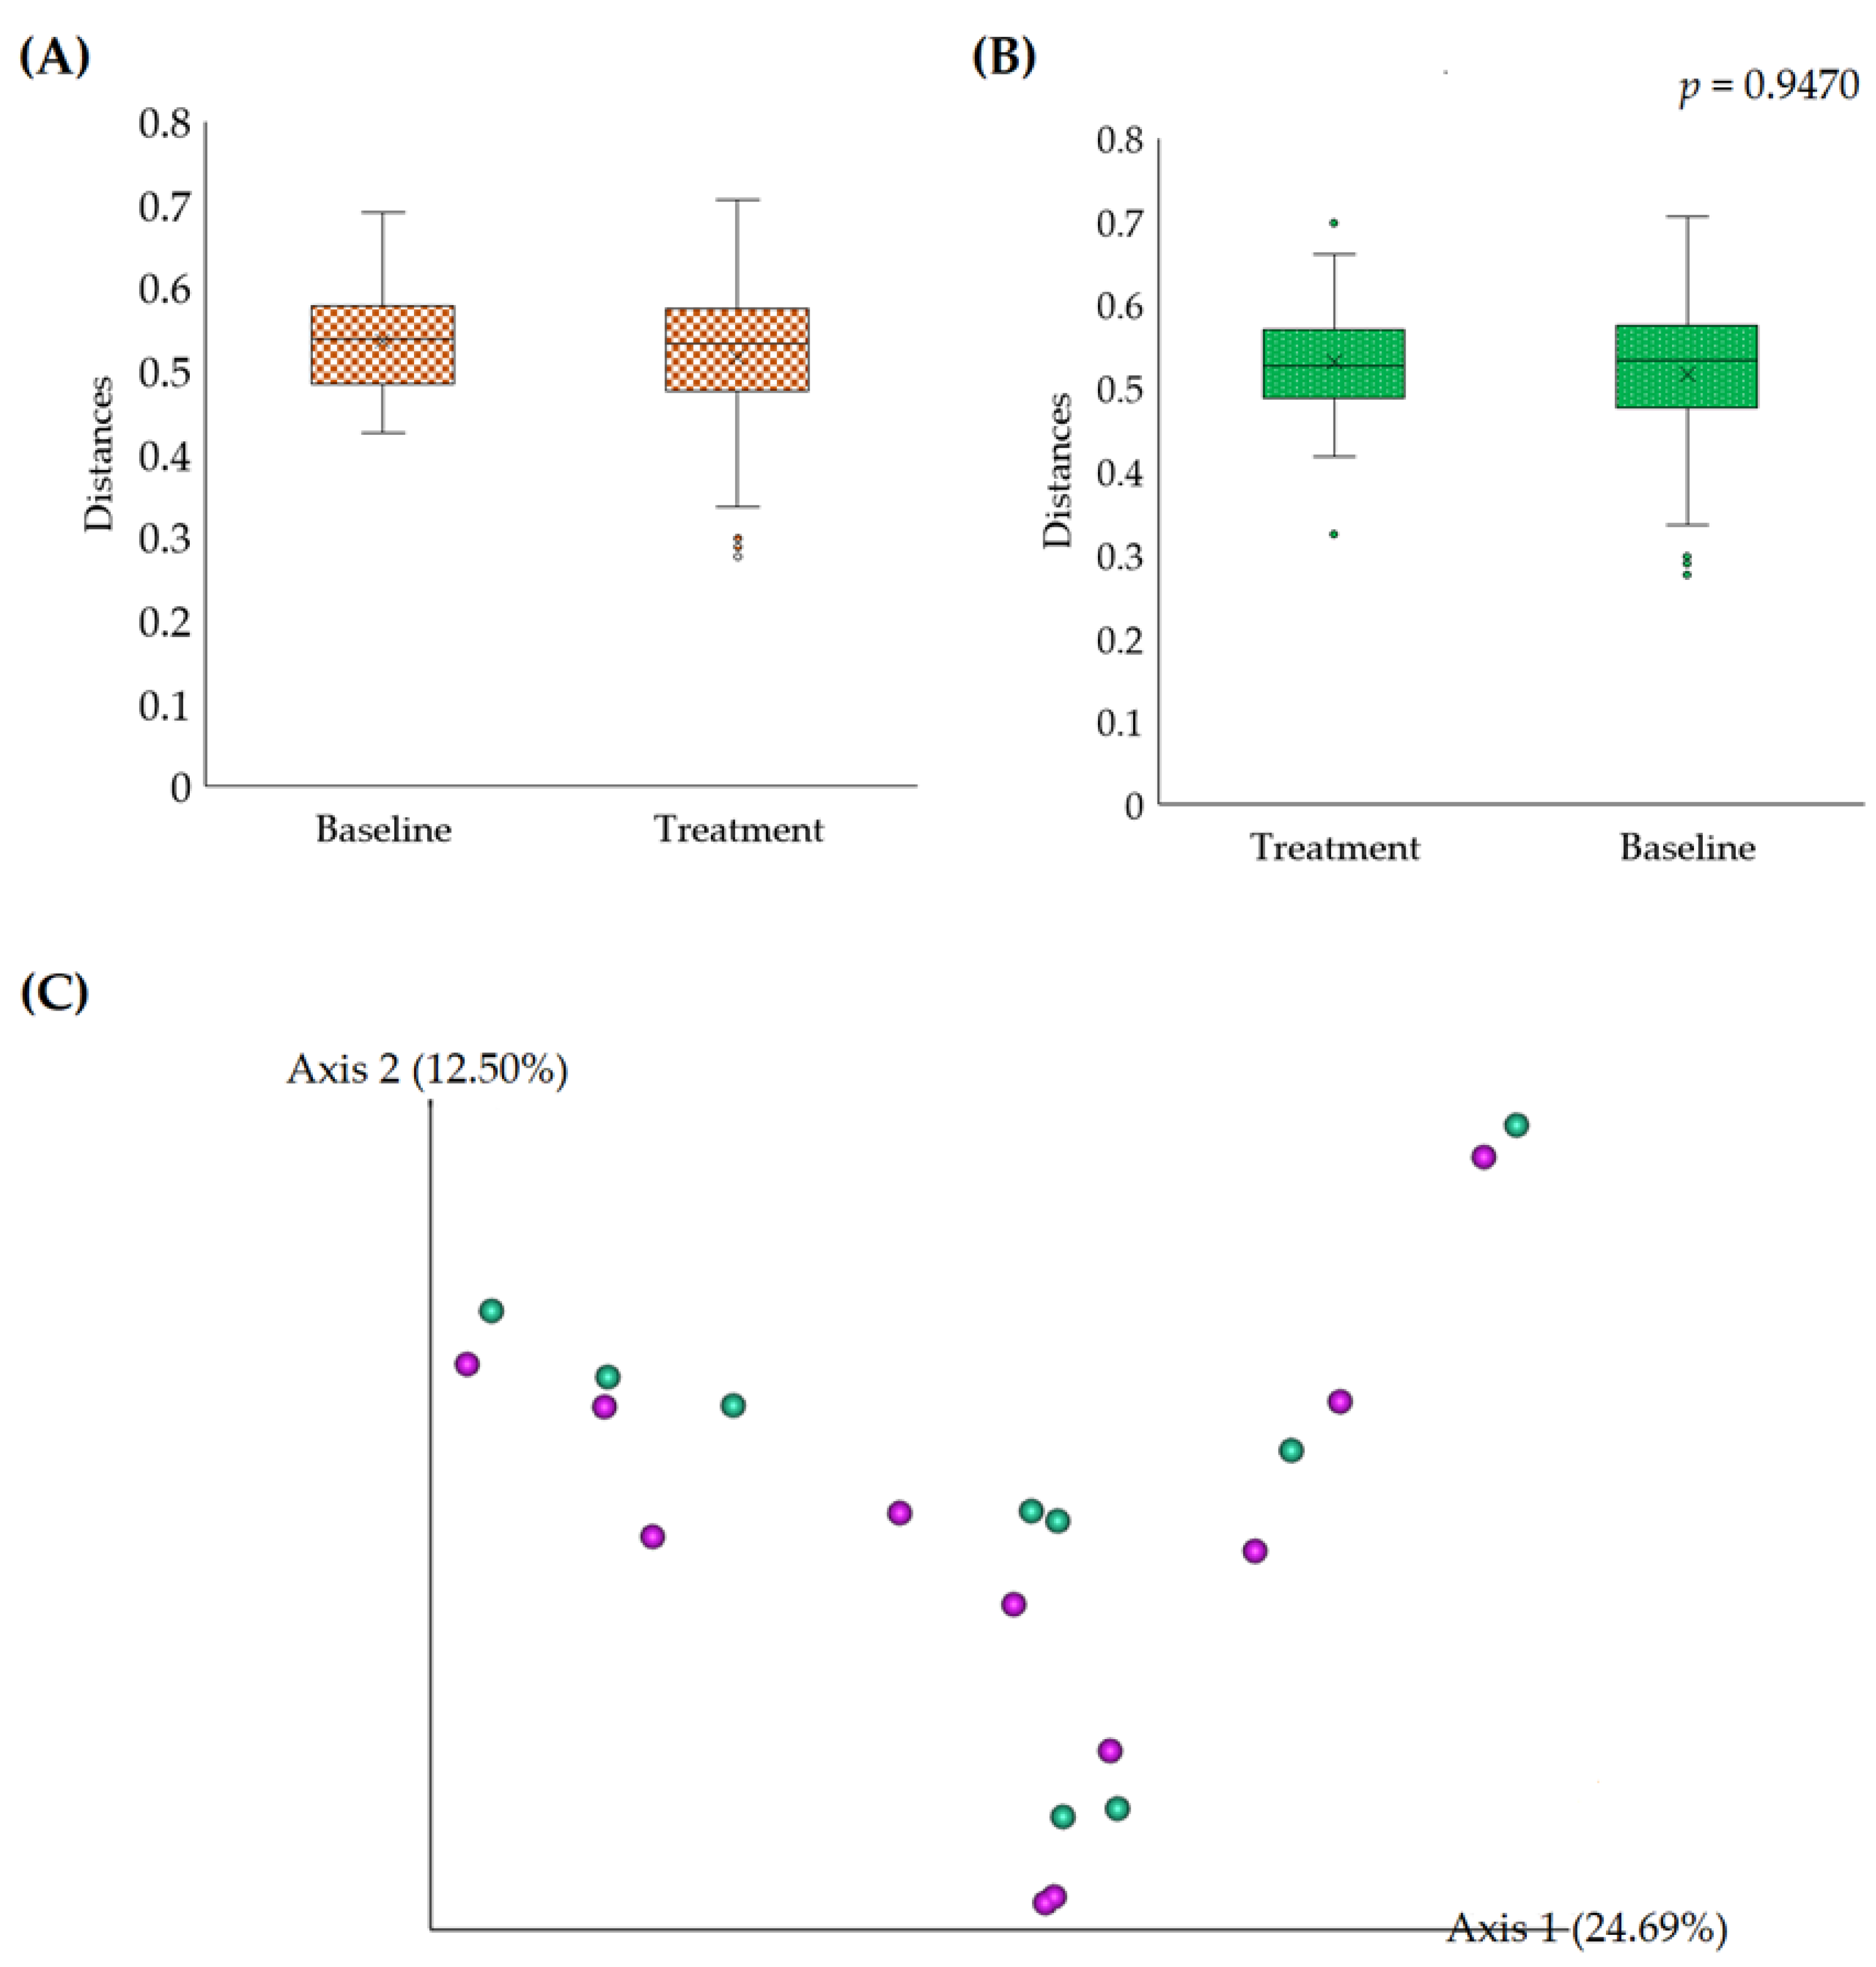
3.2.2. Beta Diversity
3.2.3. Taxonomical Assignment and Quantification
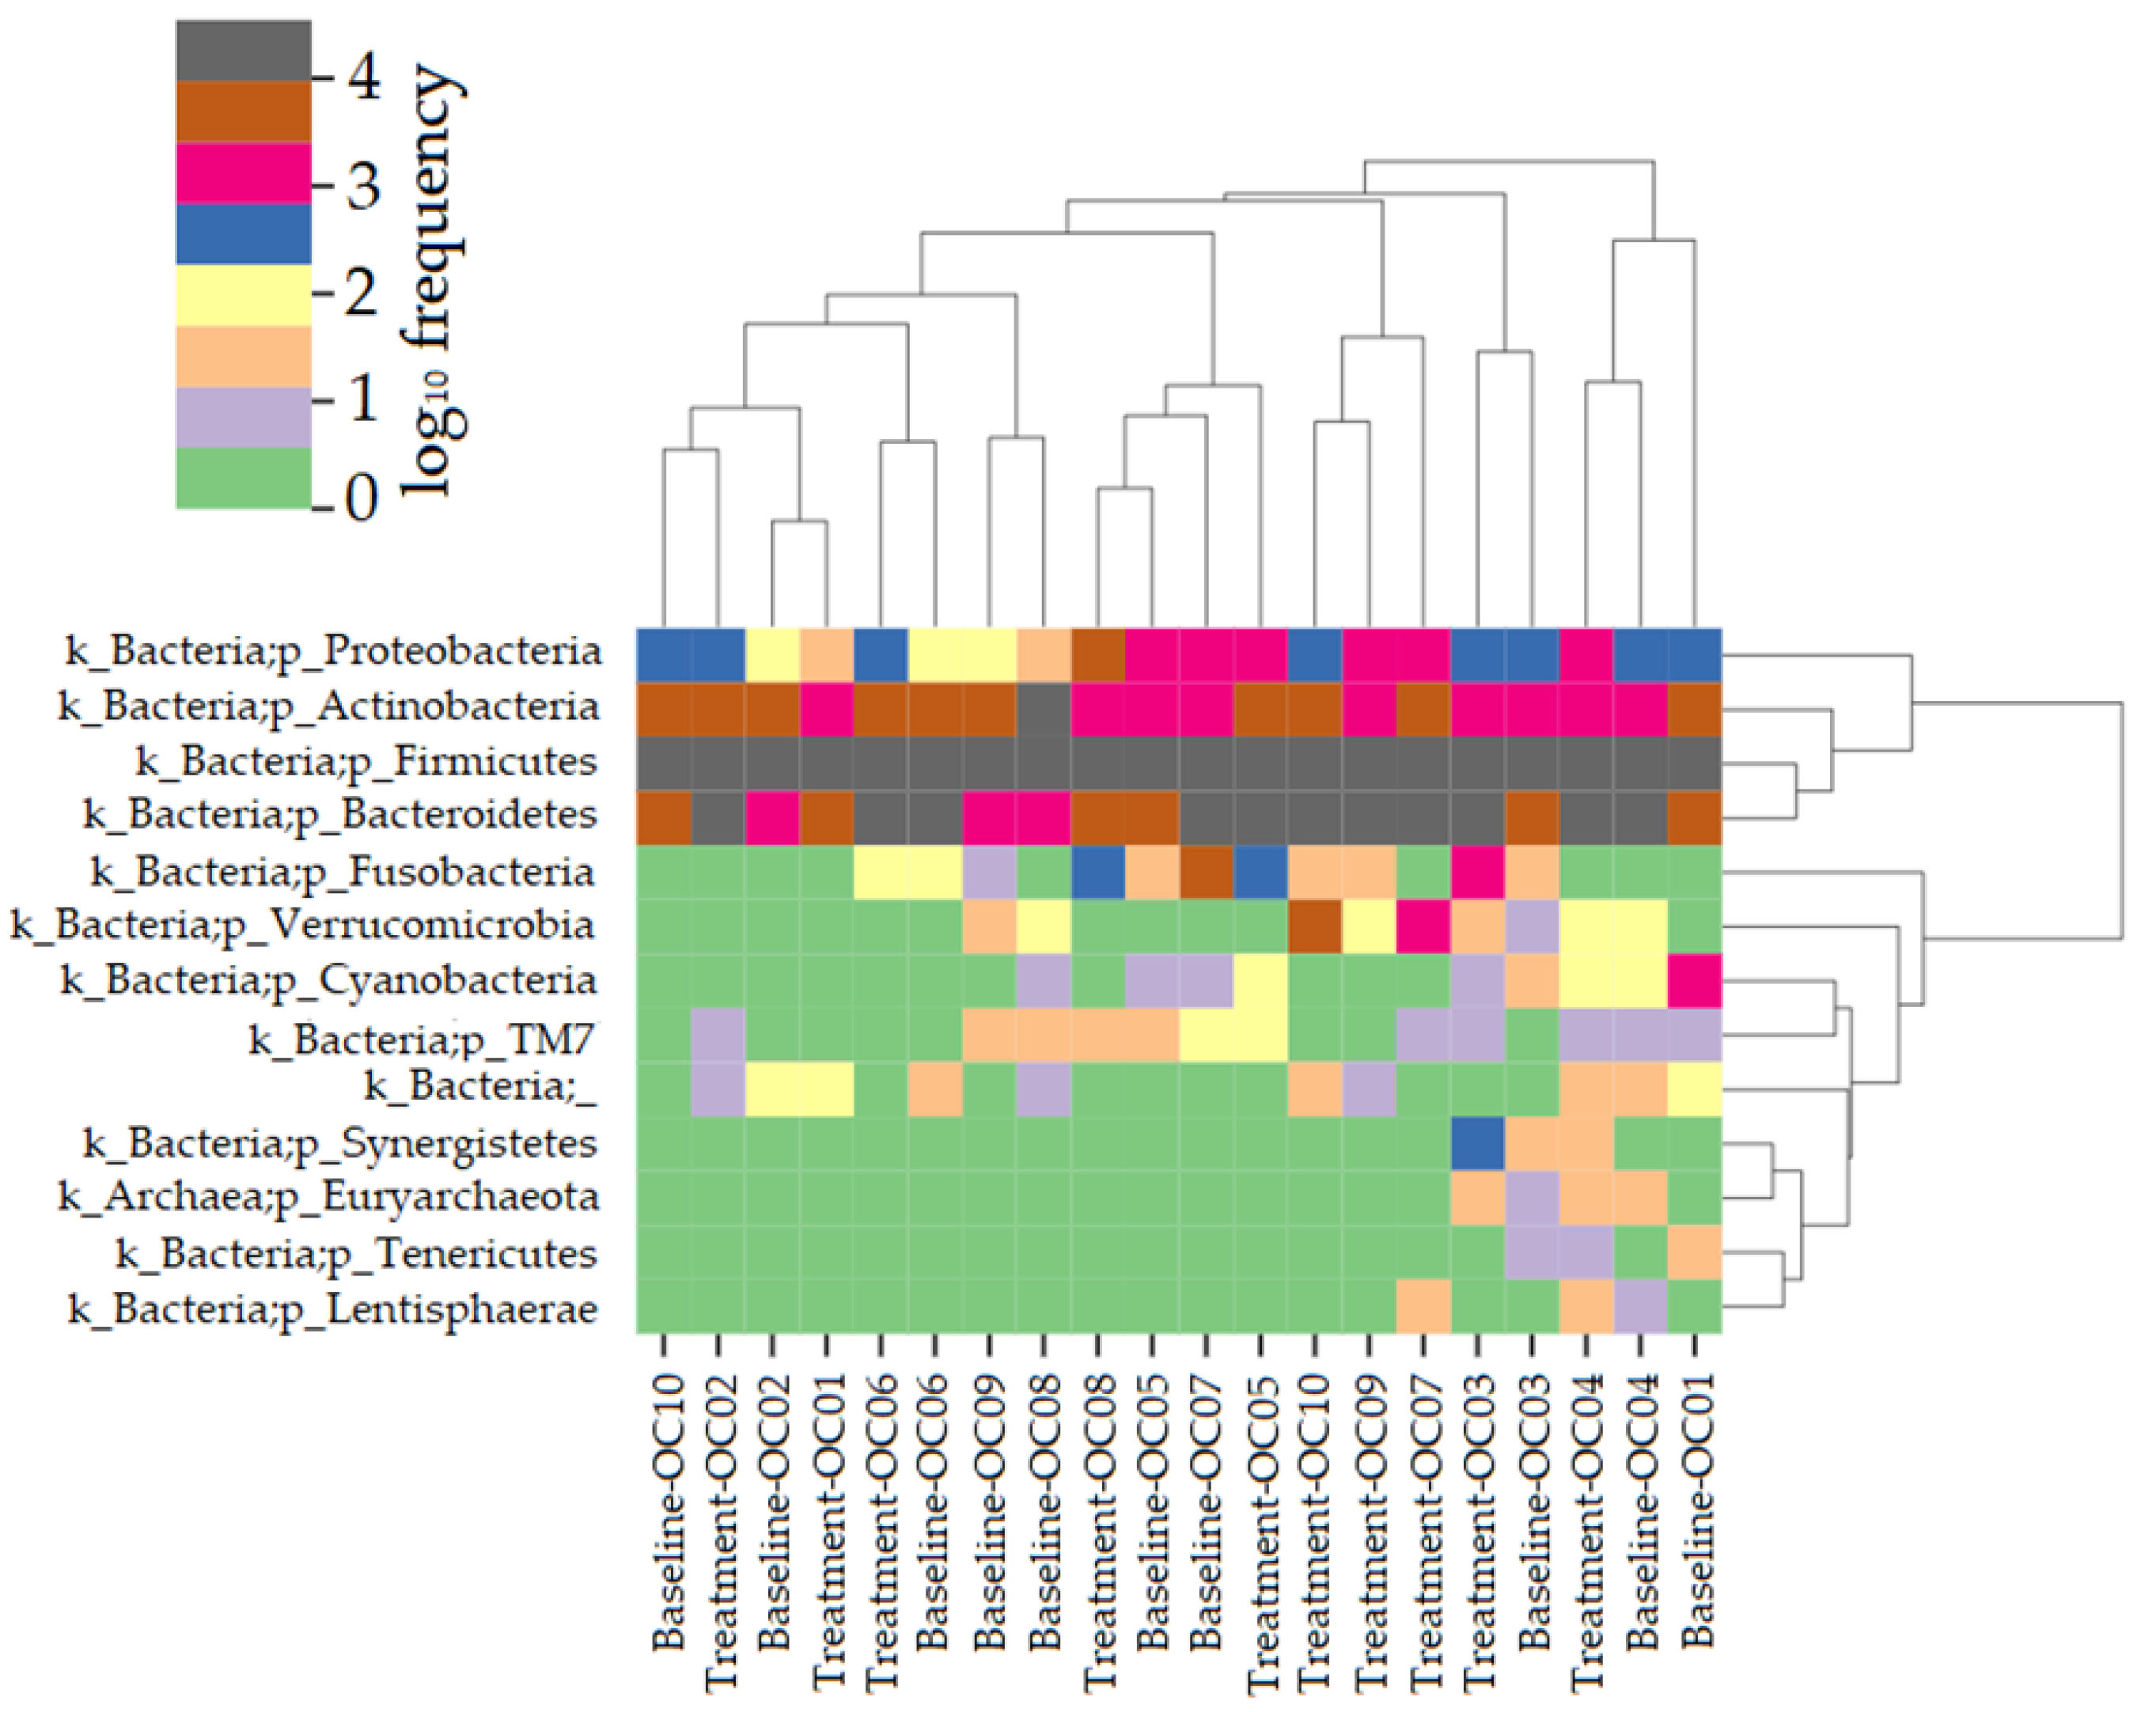
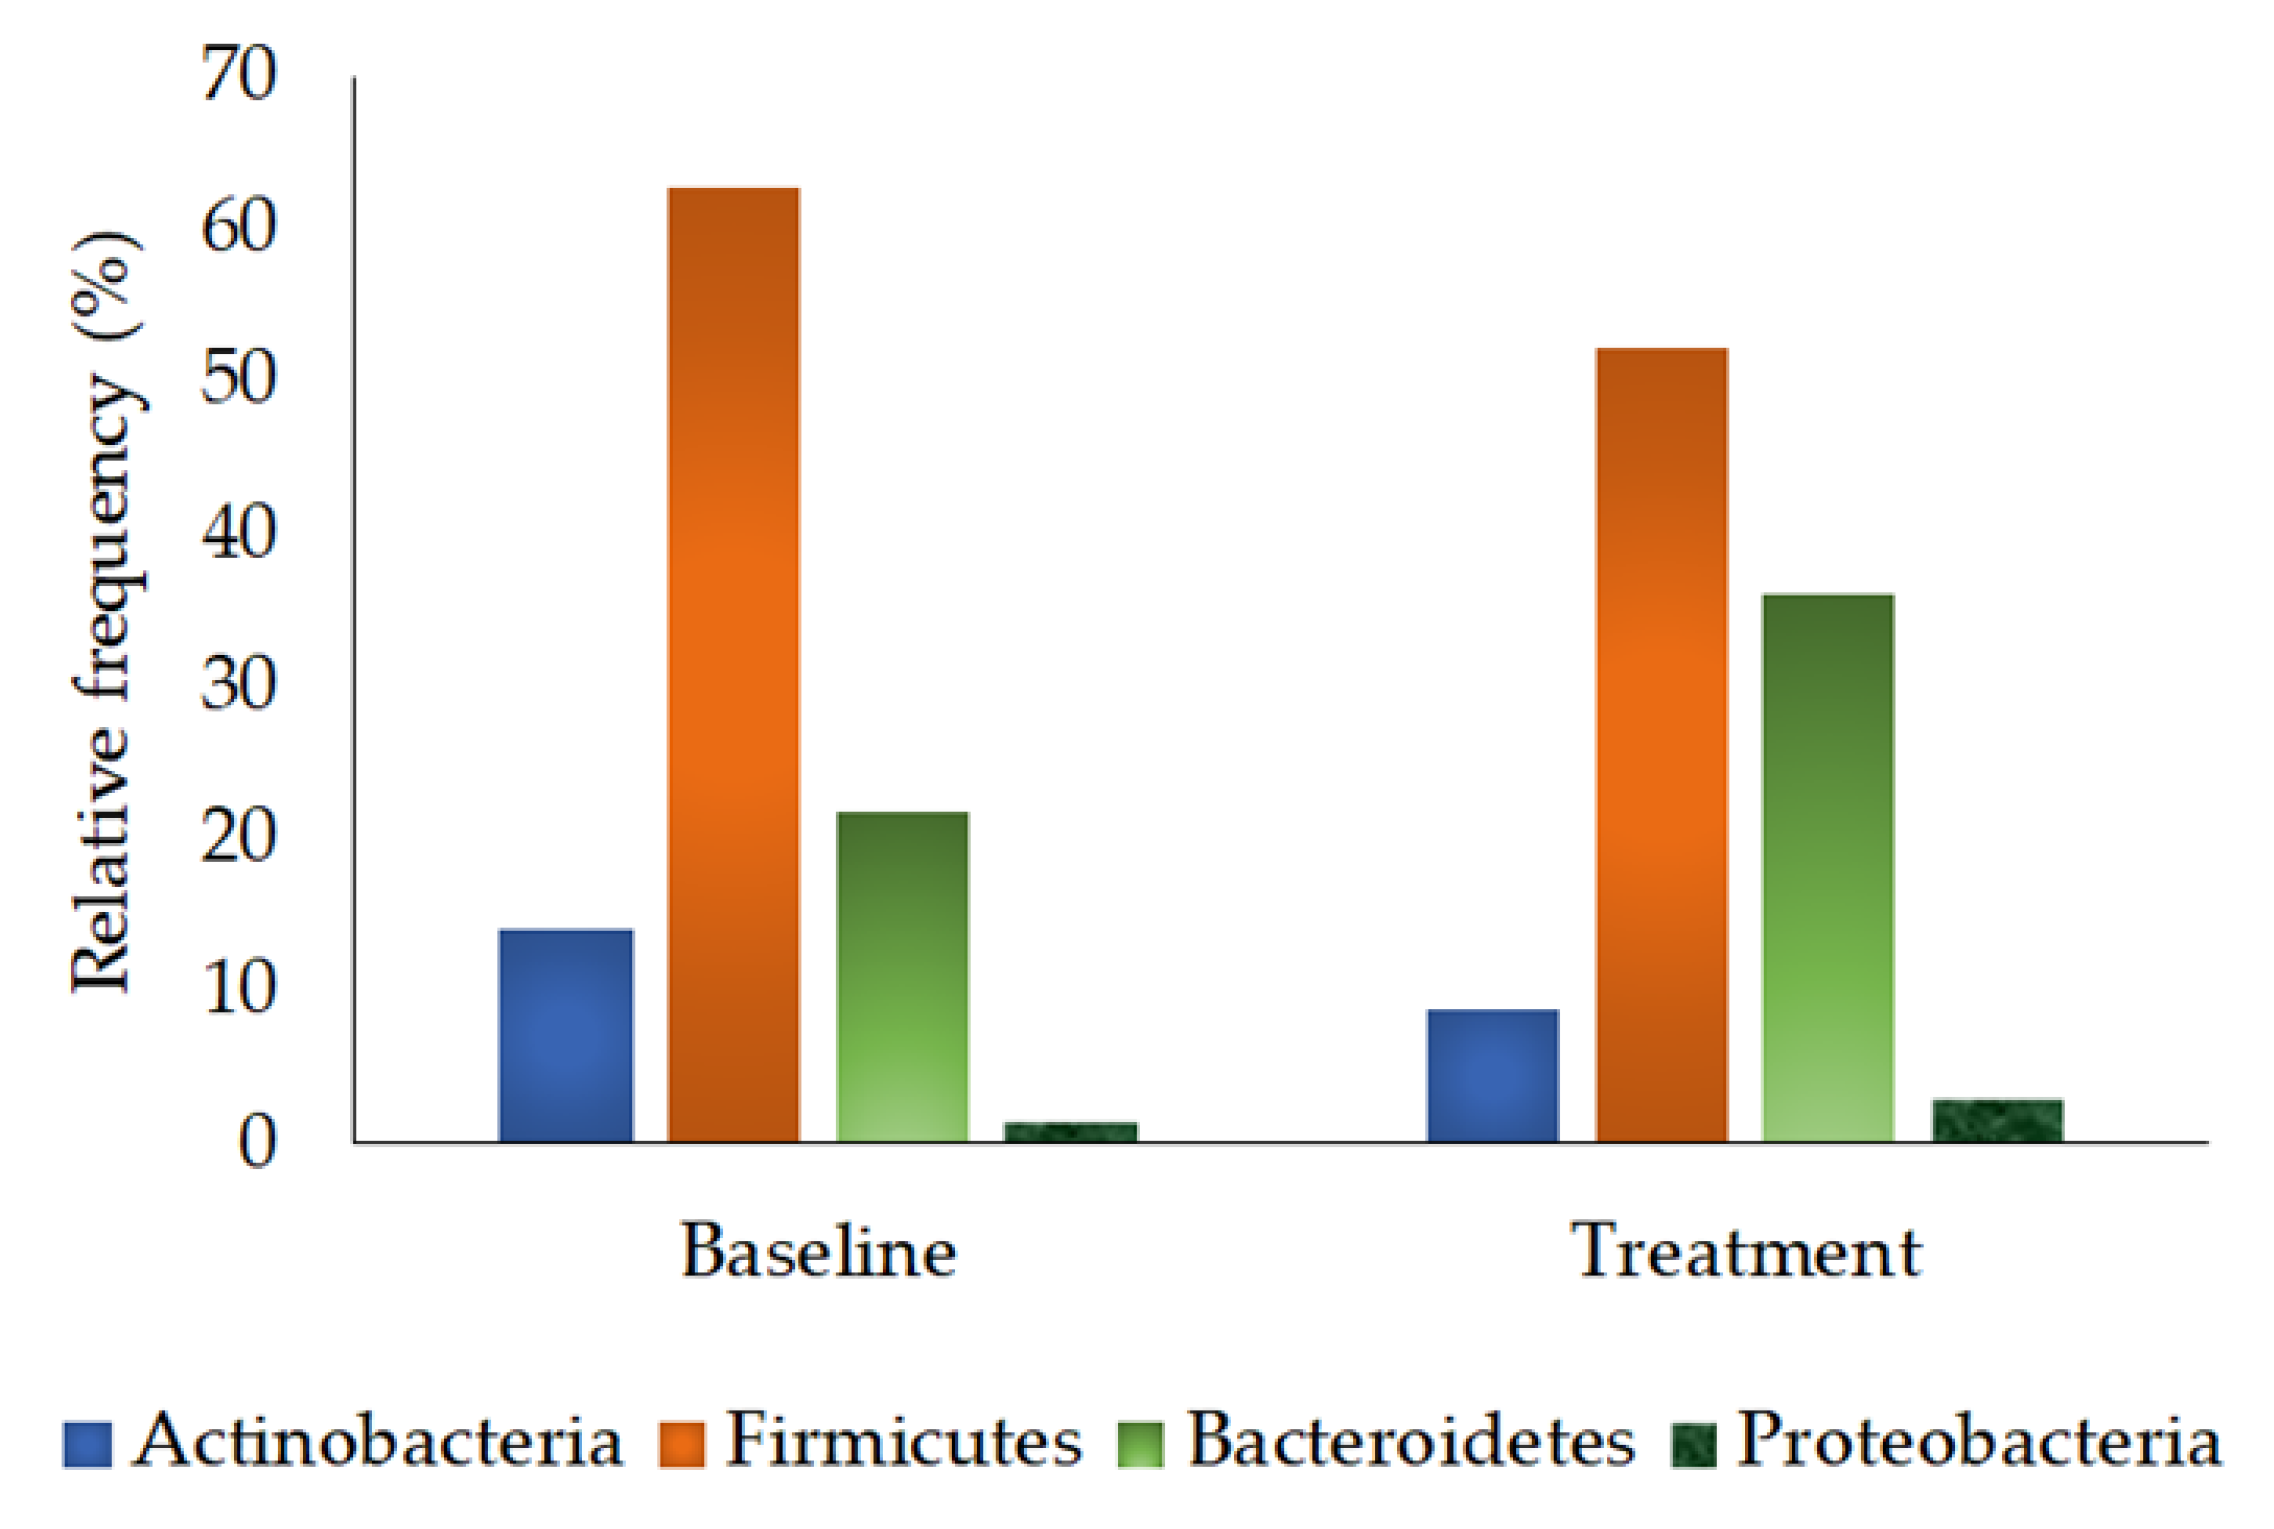
3.2.4. Phylum Quantification
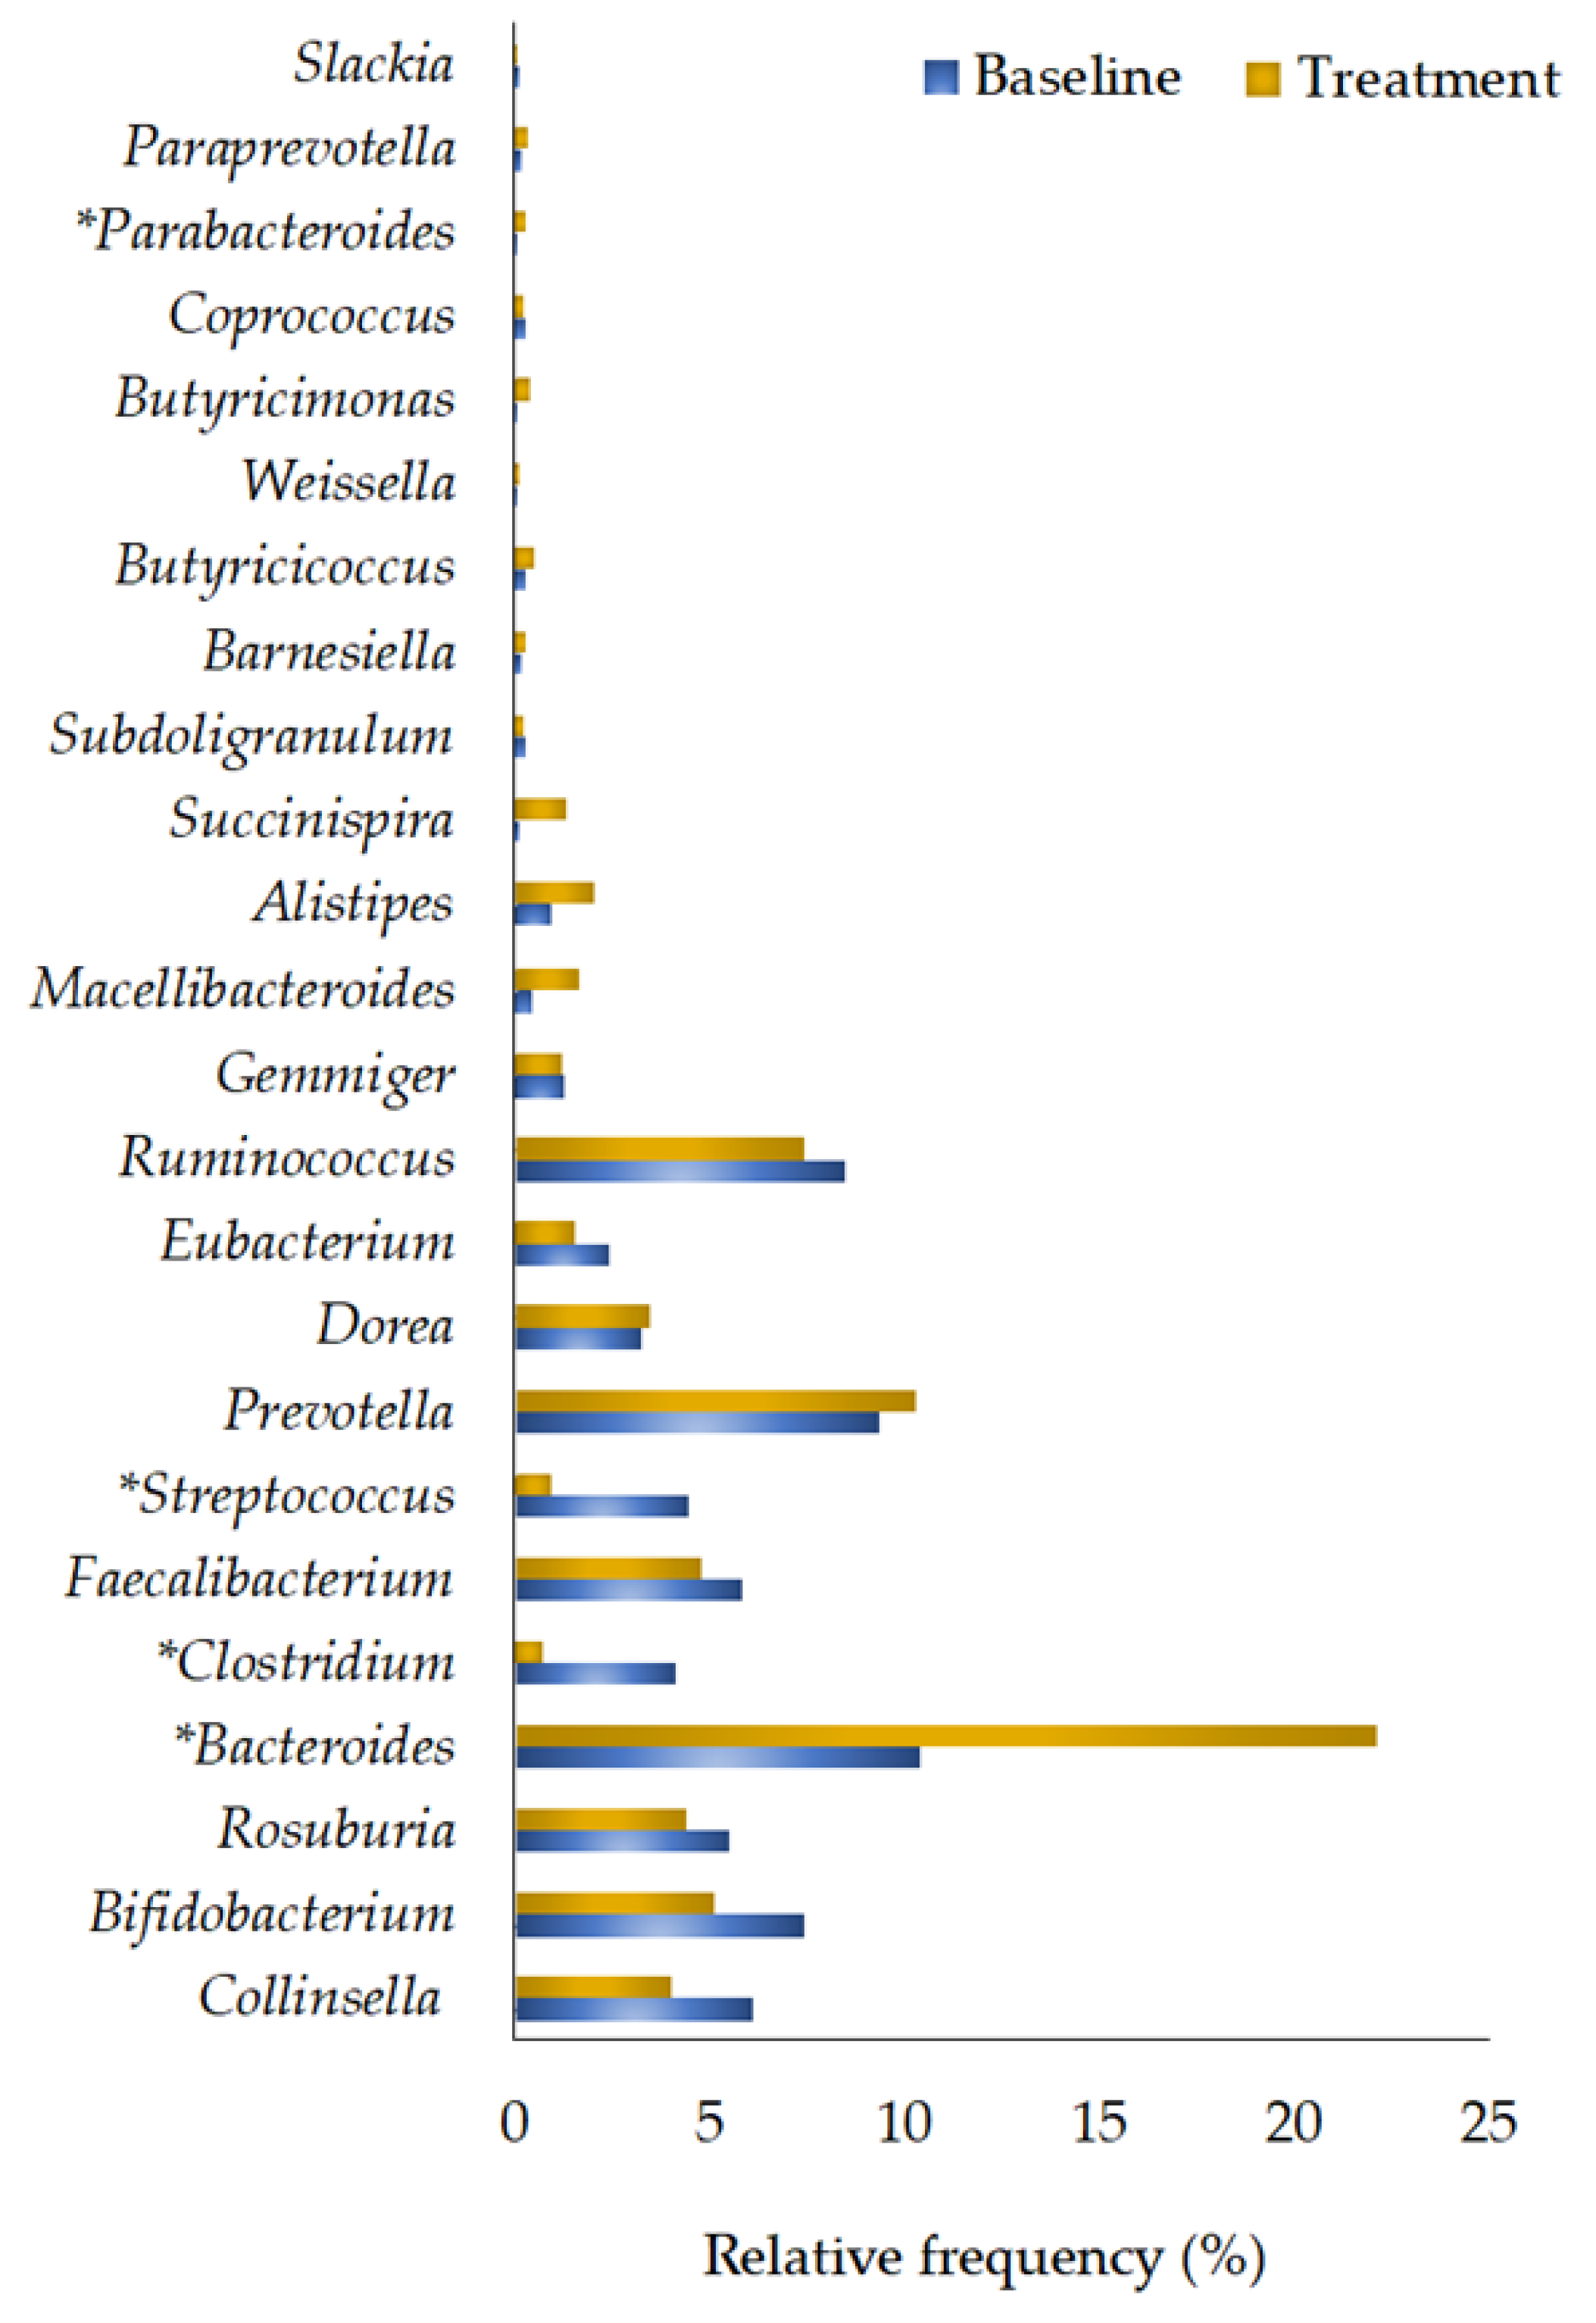
3.2.5. Genera Quantification
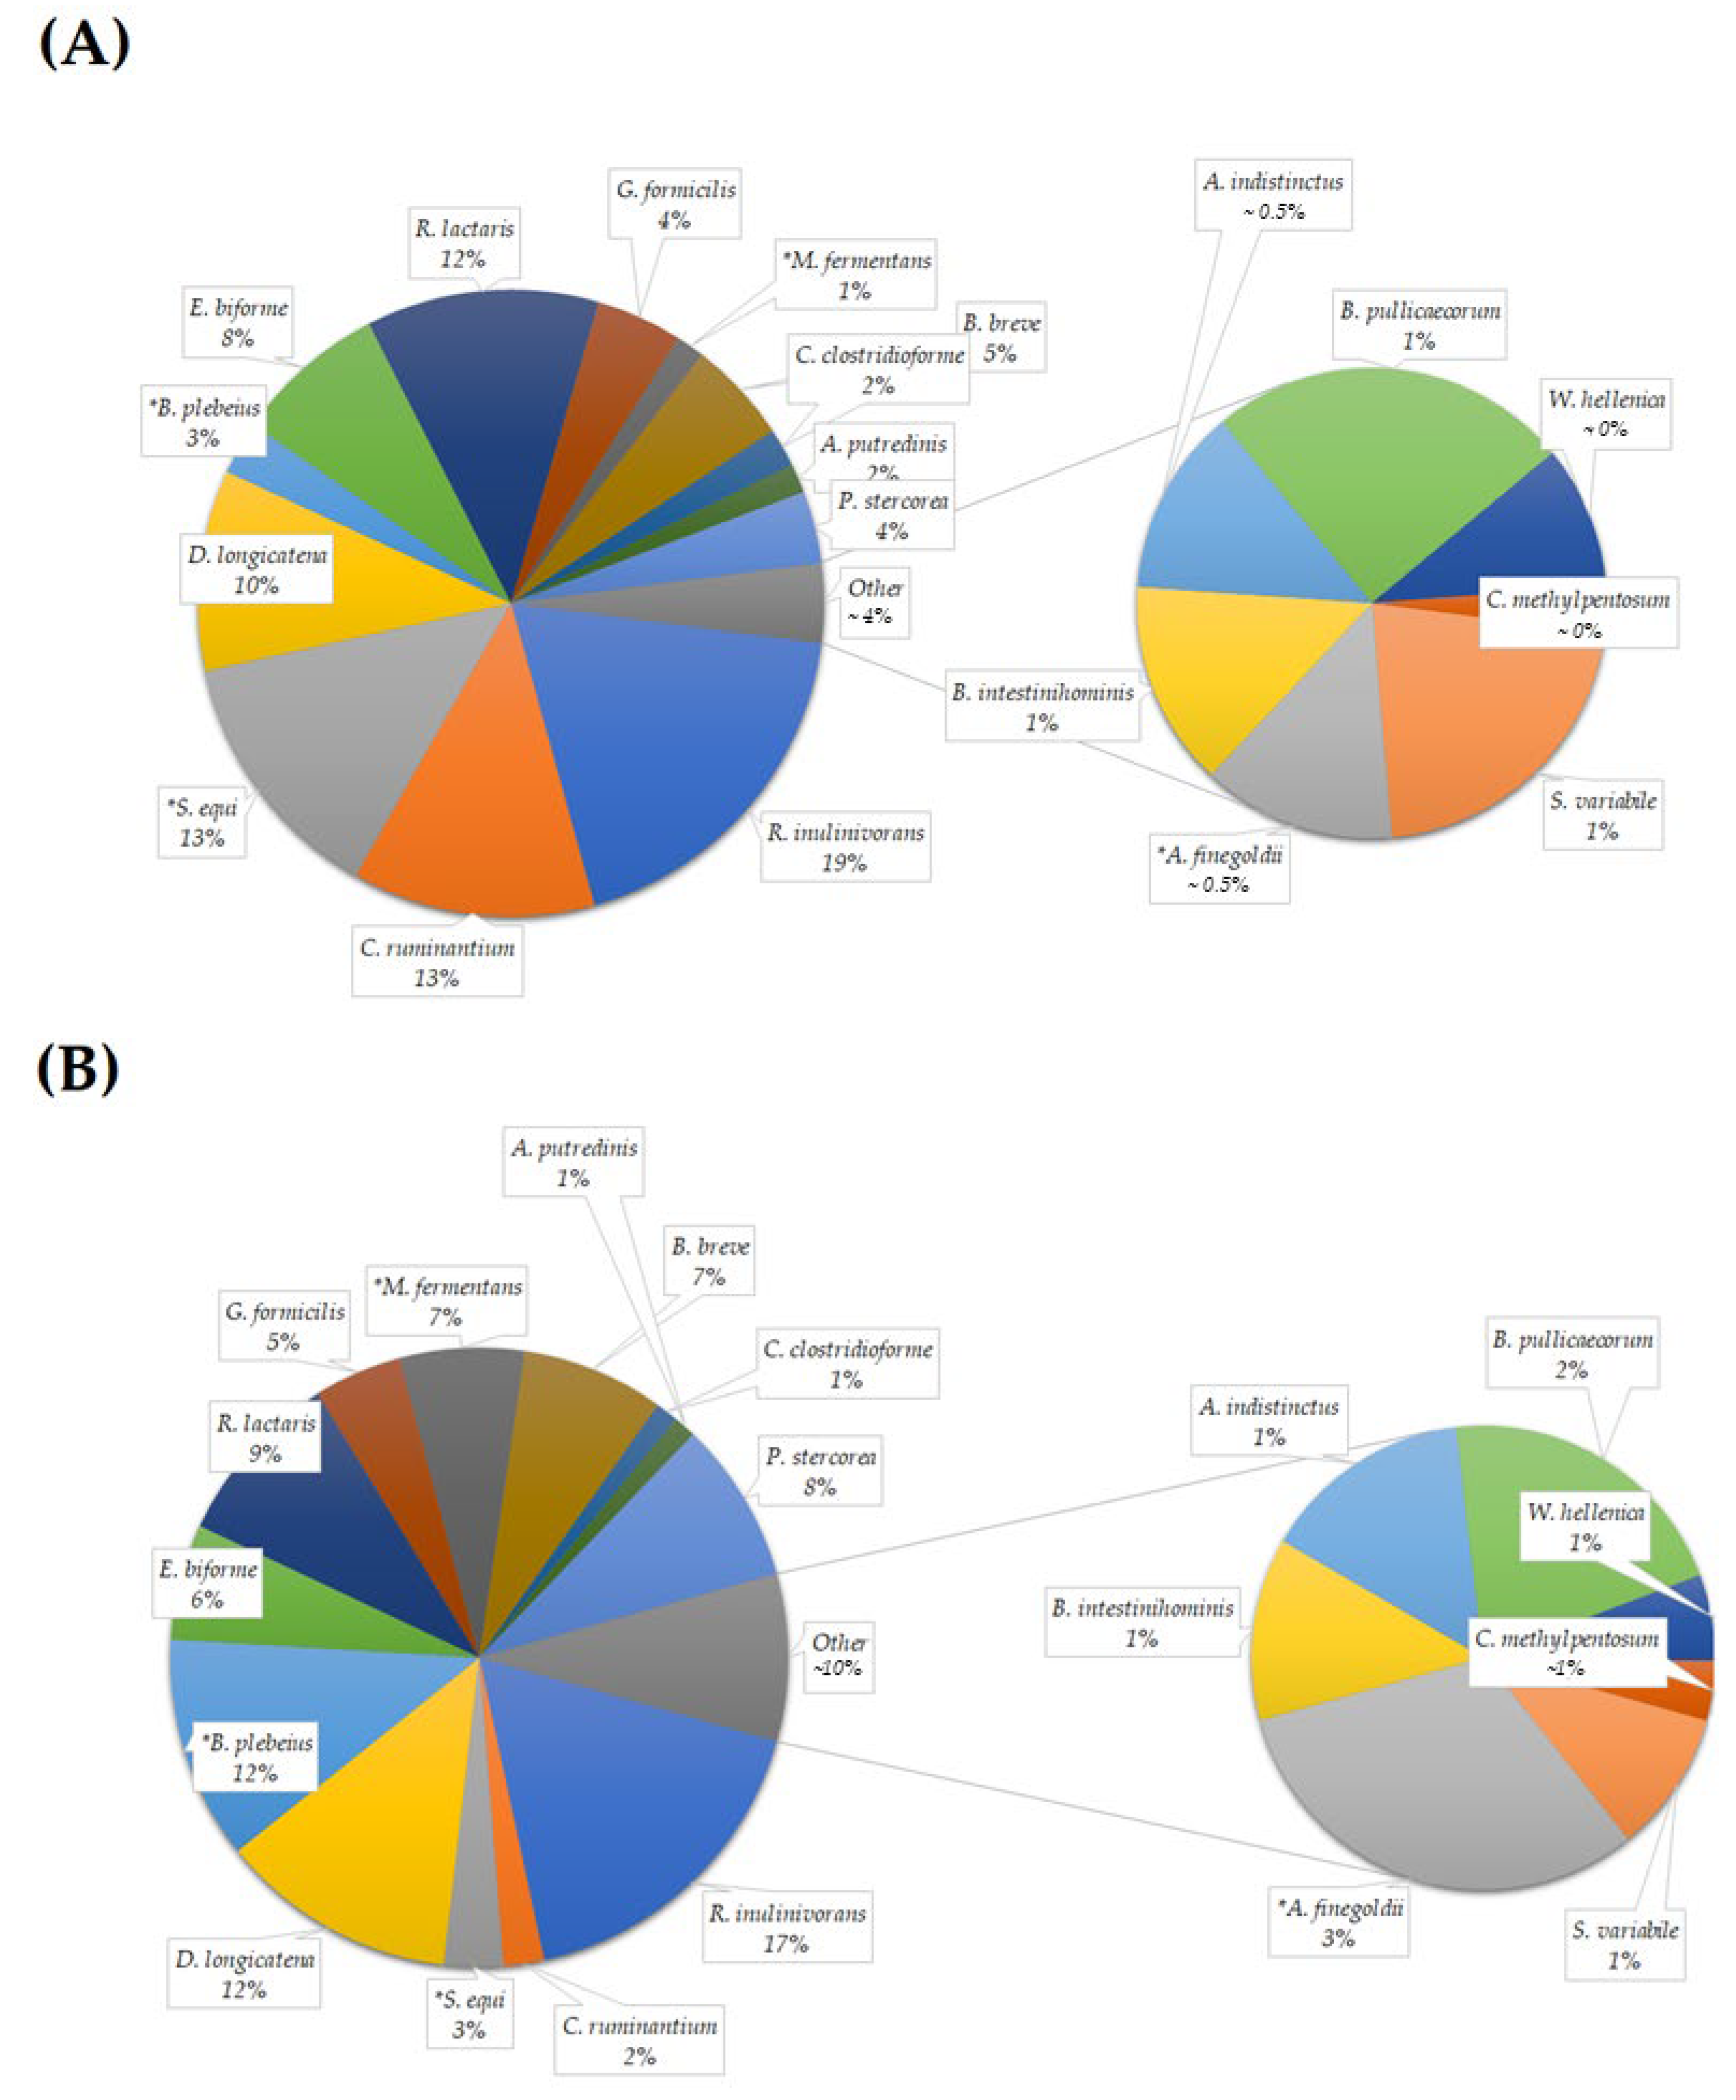
3.2.6. Species Quantification
3.3. Effects of Probiotics on Behavioral Performance
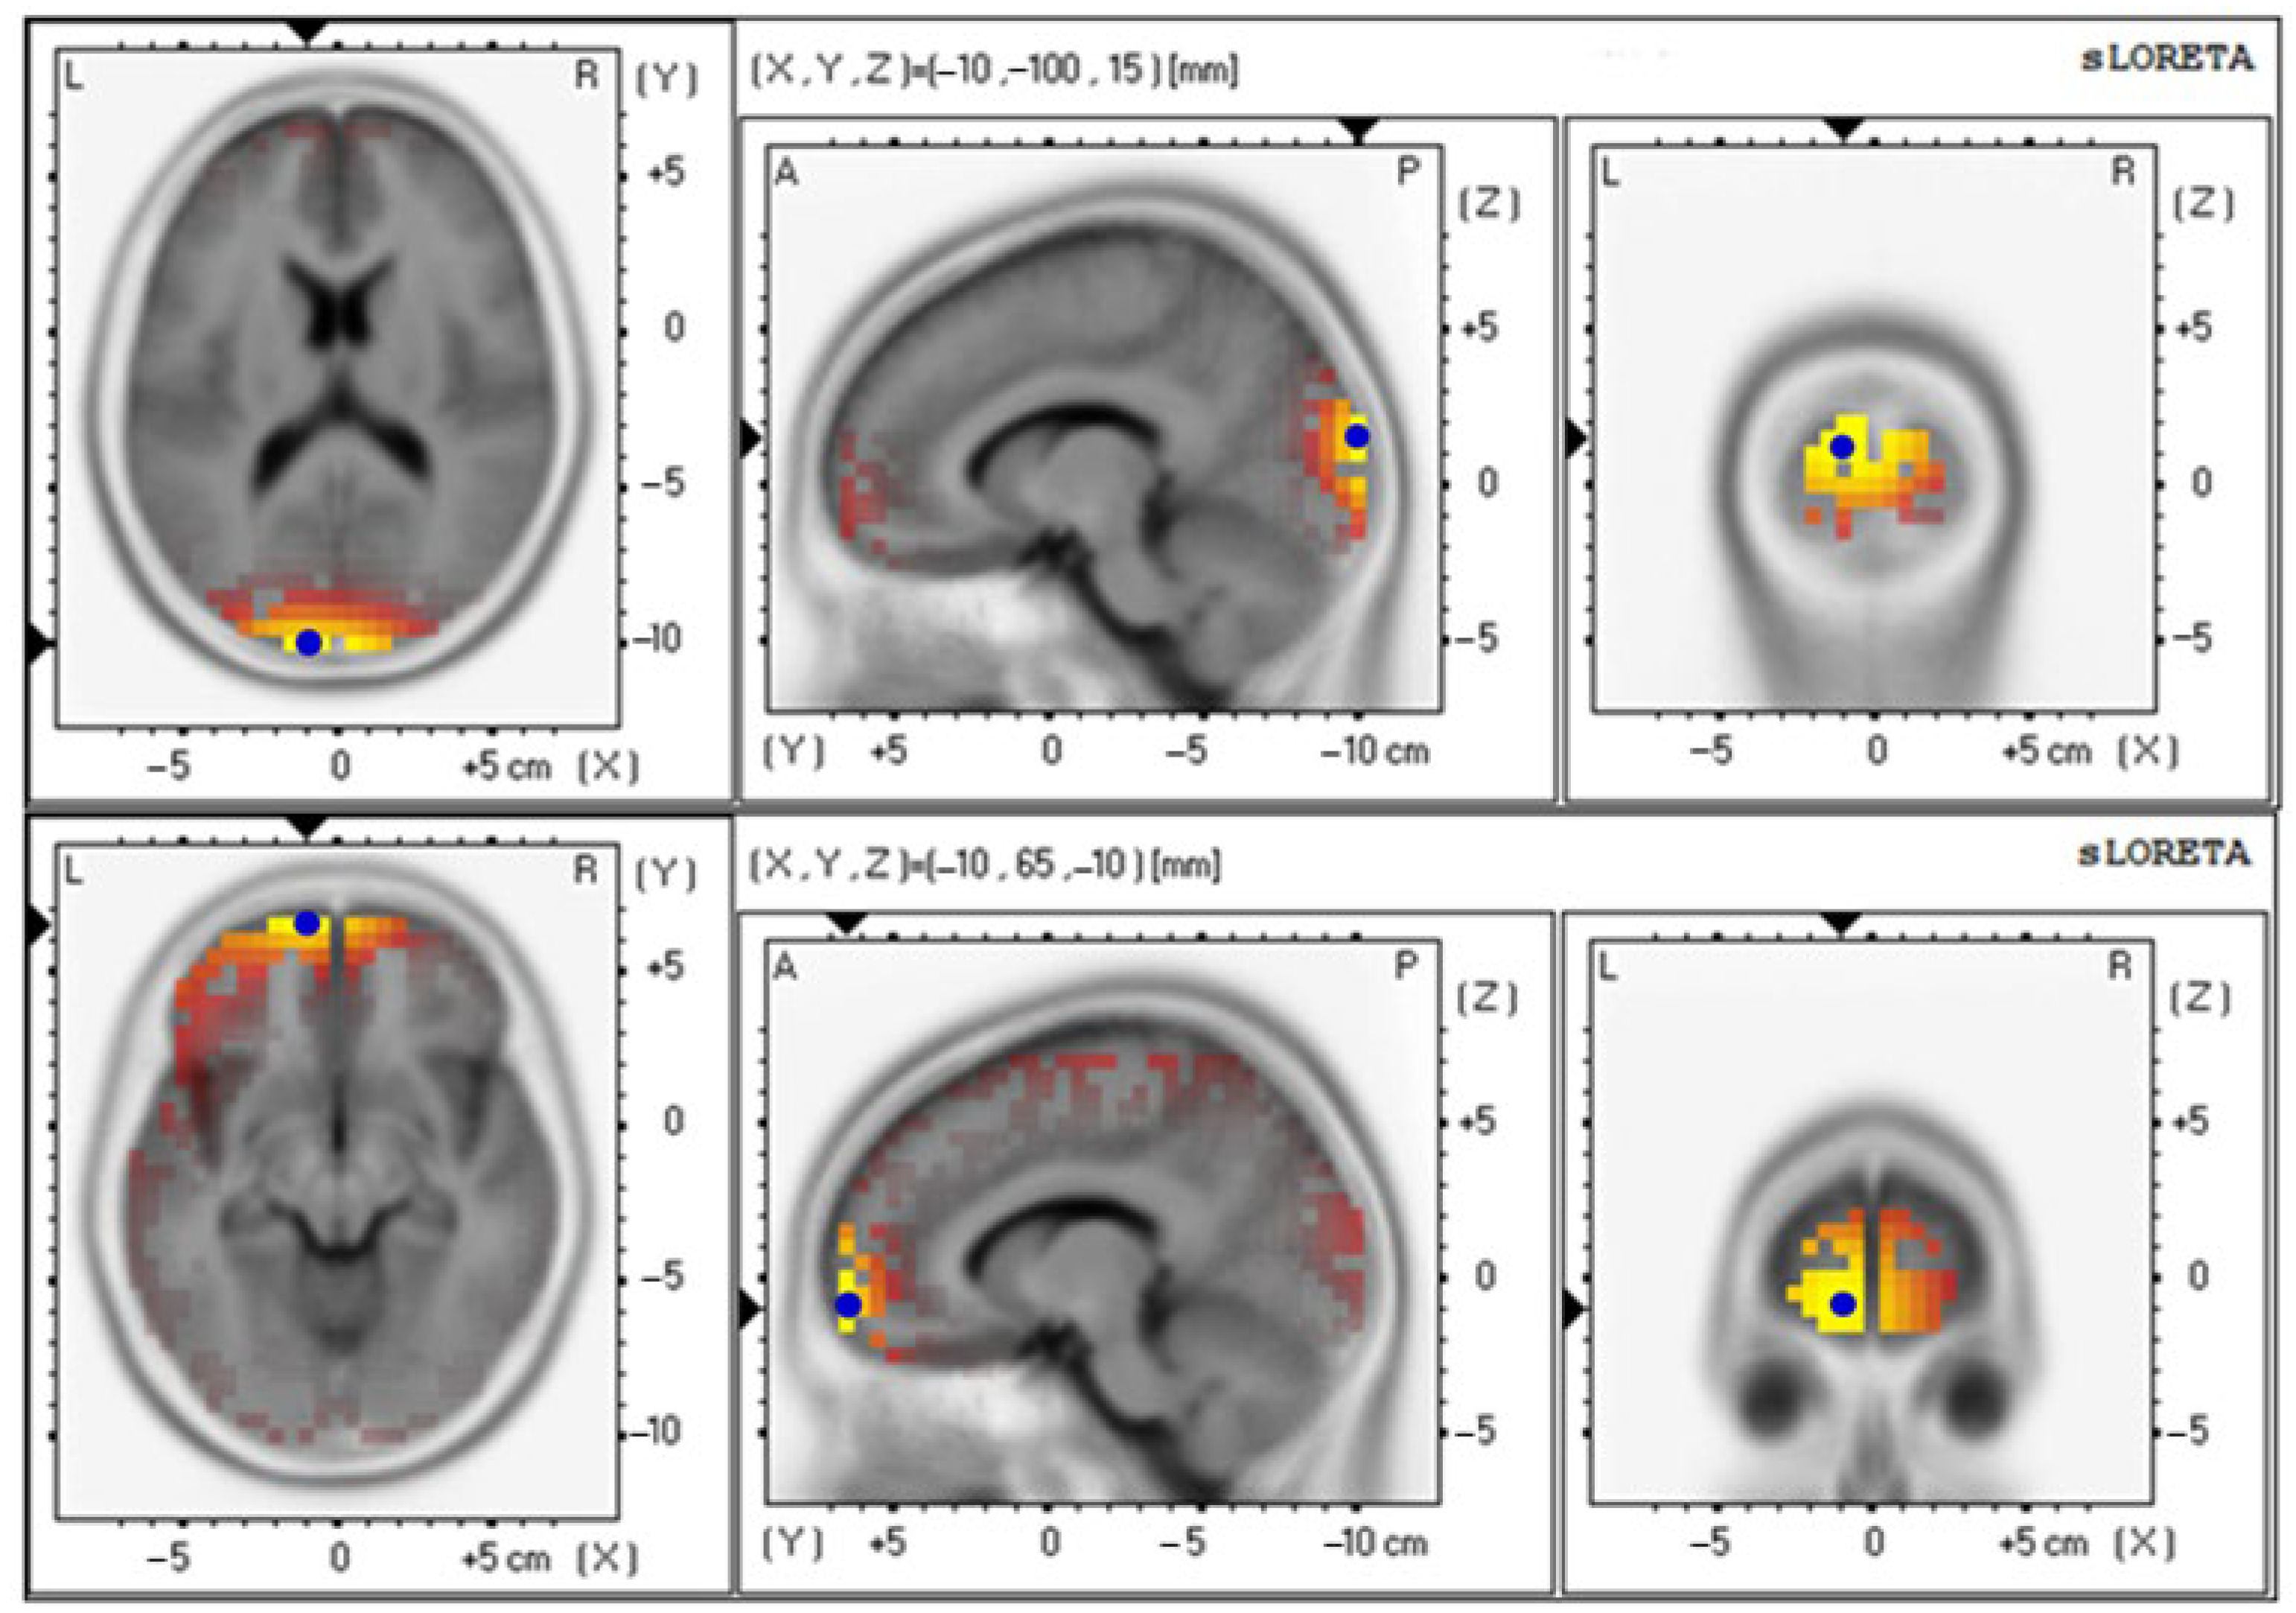
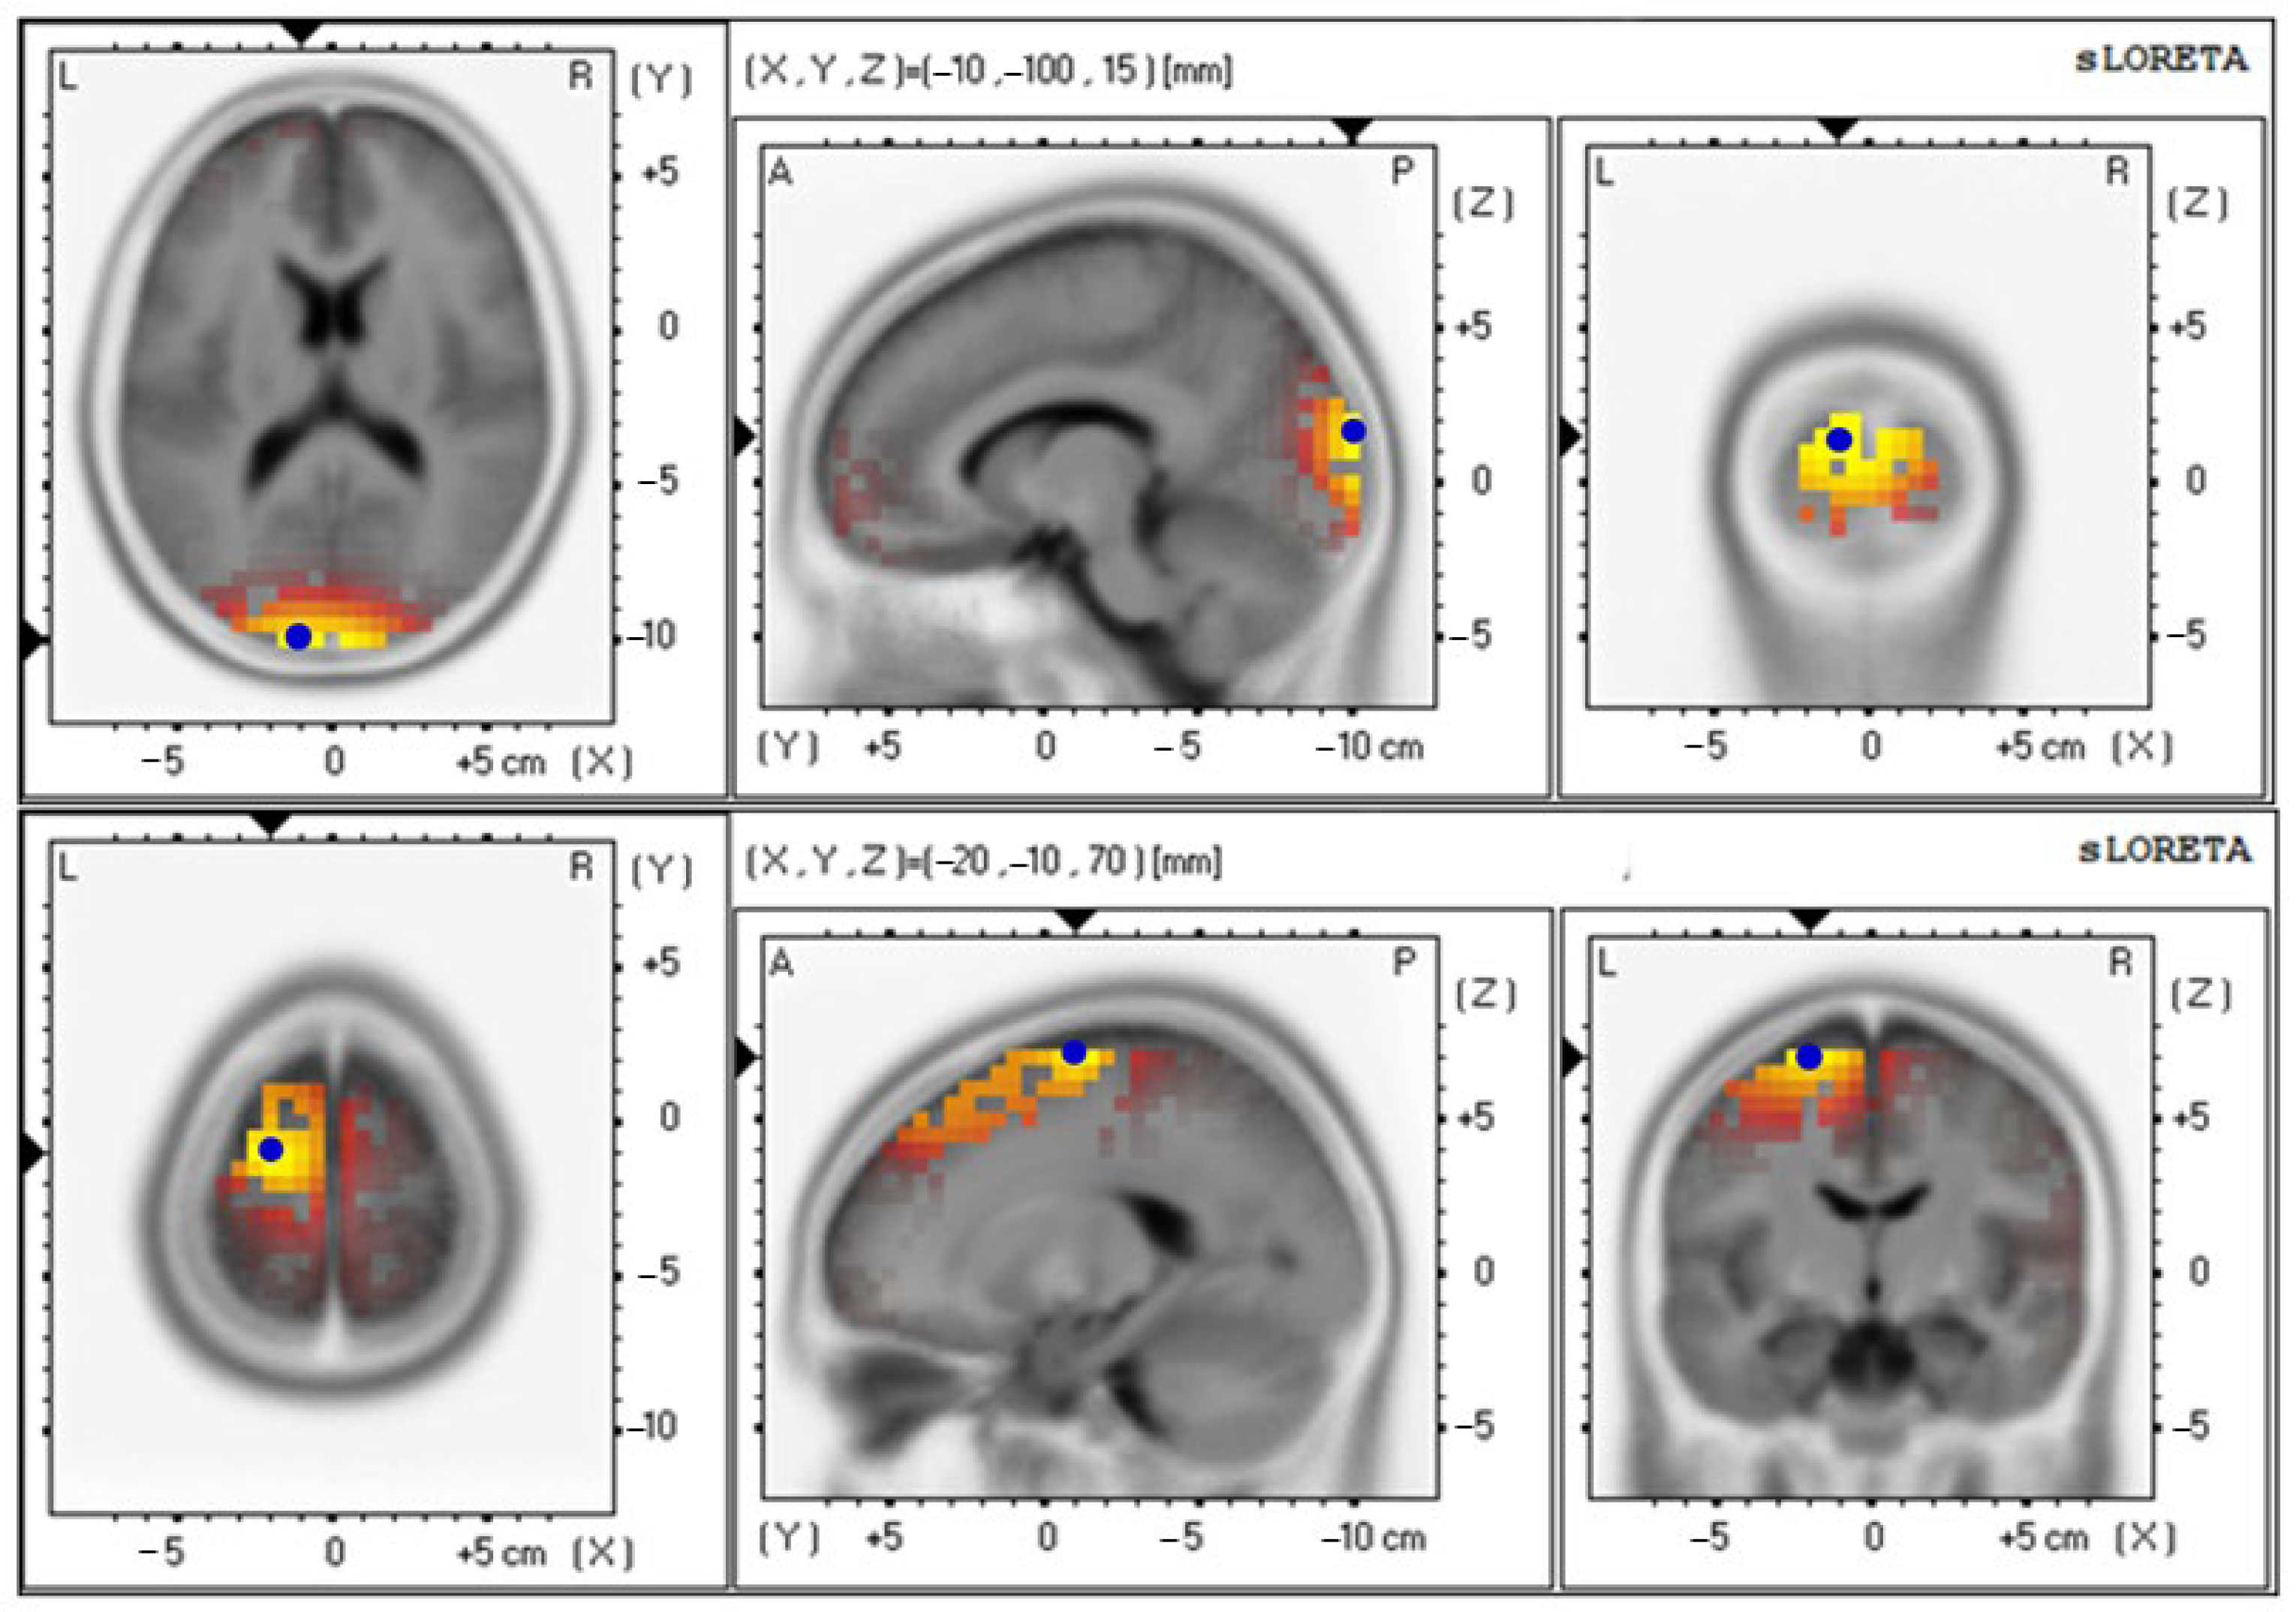
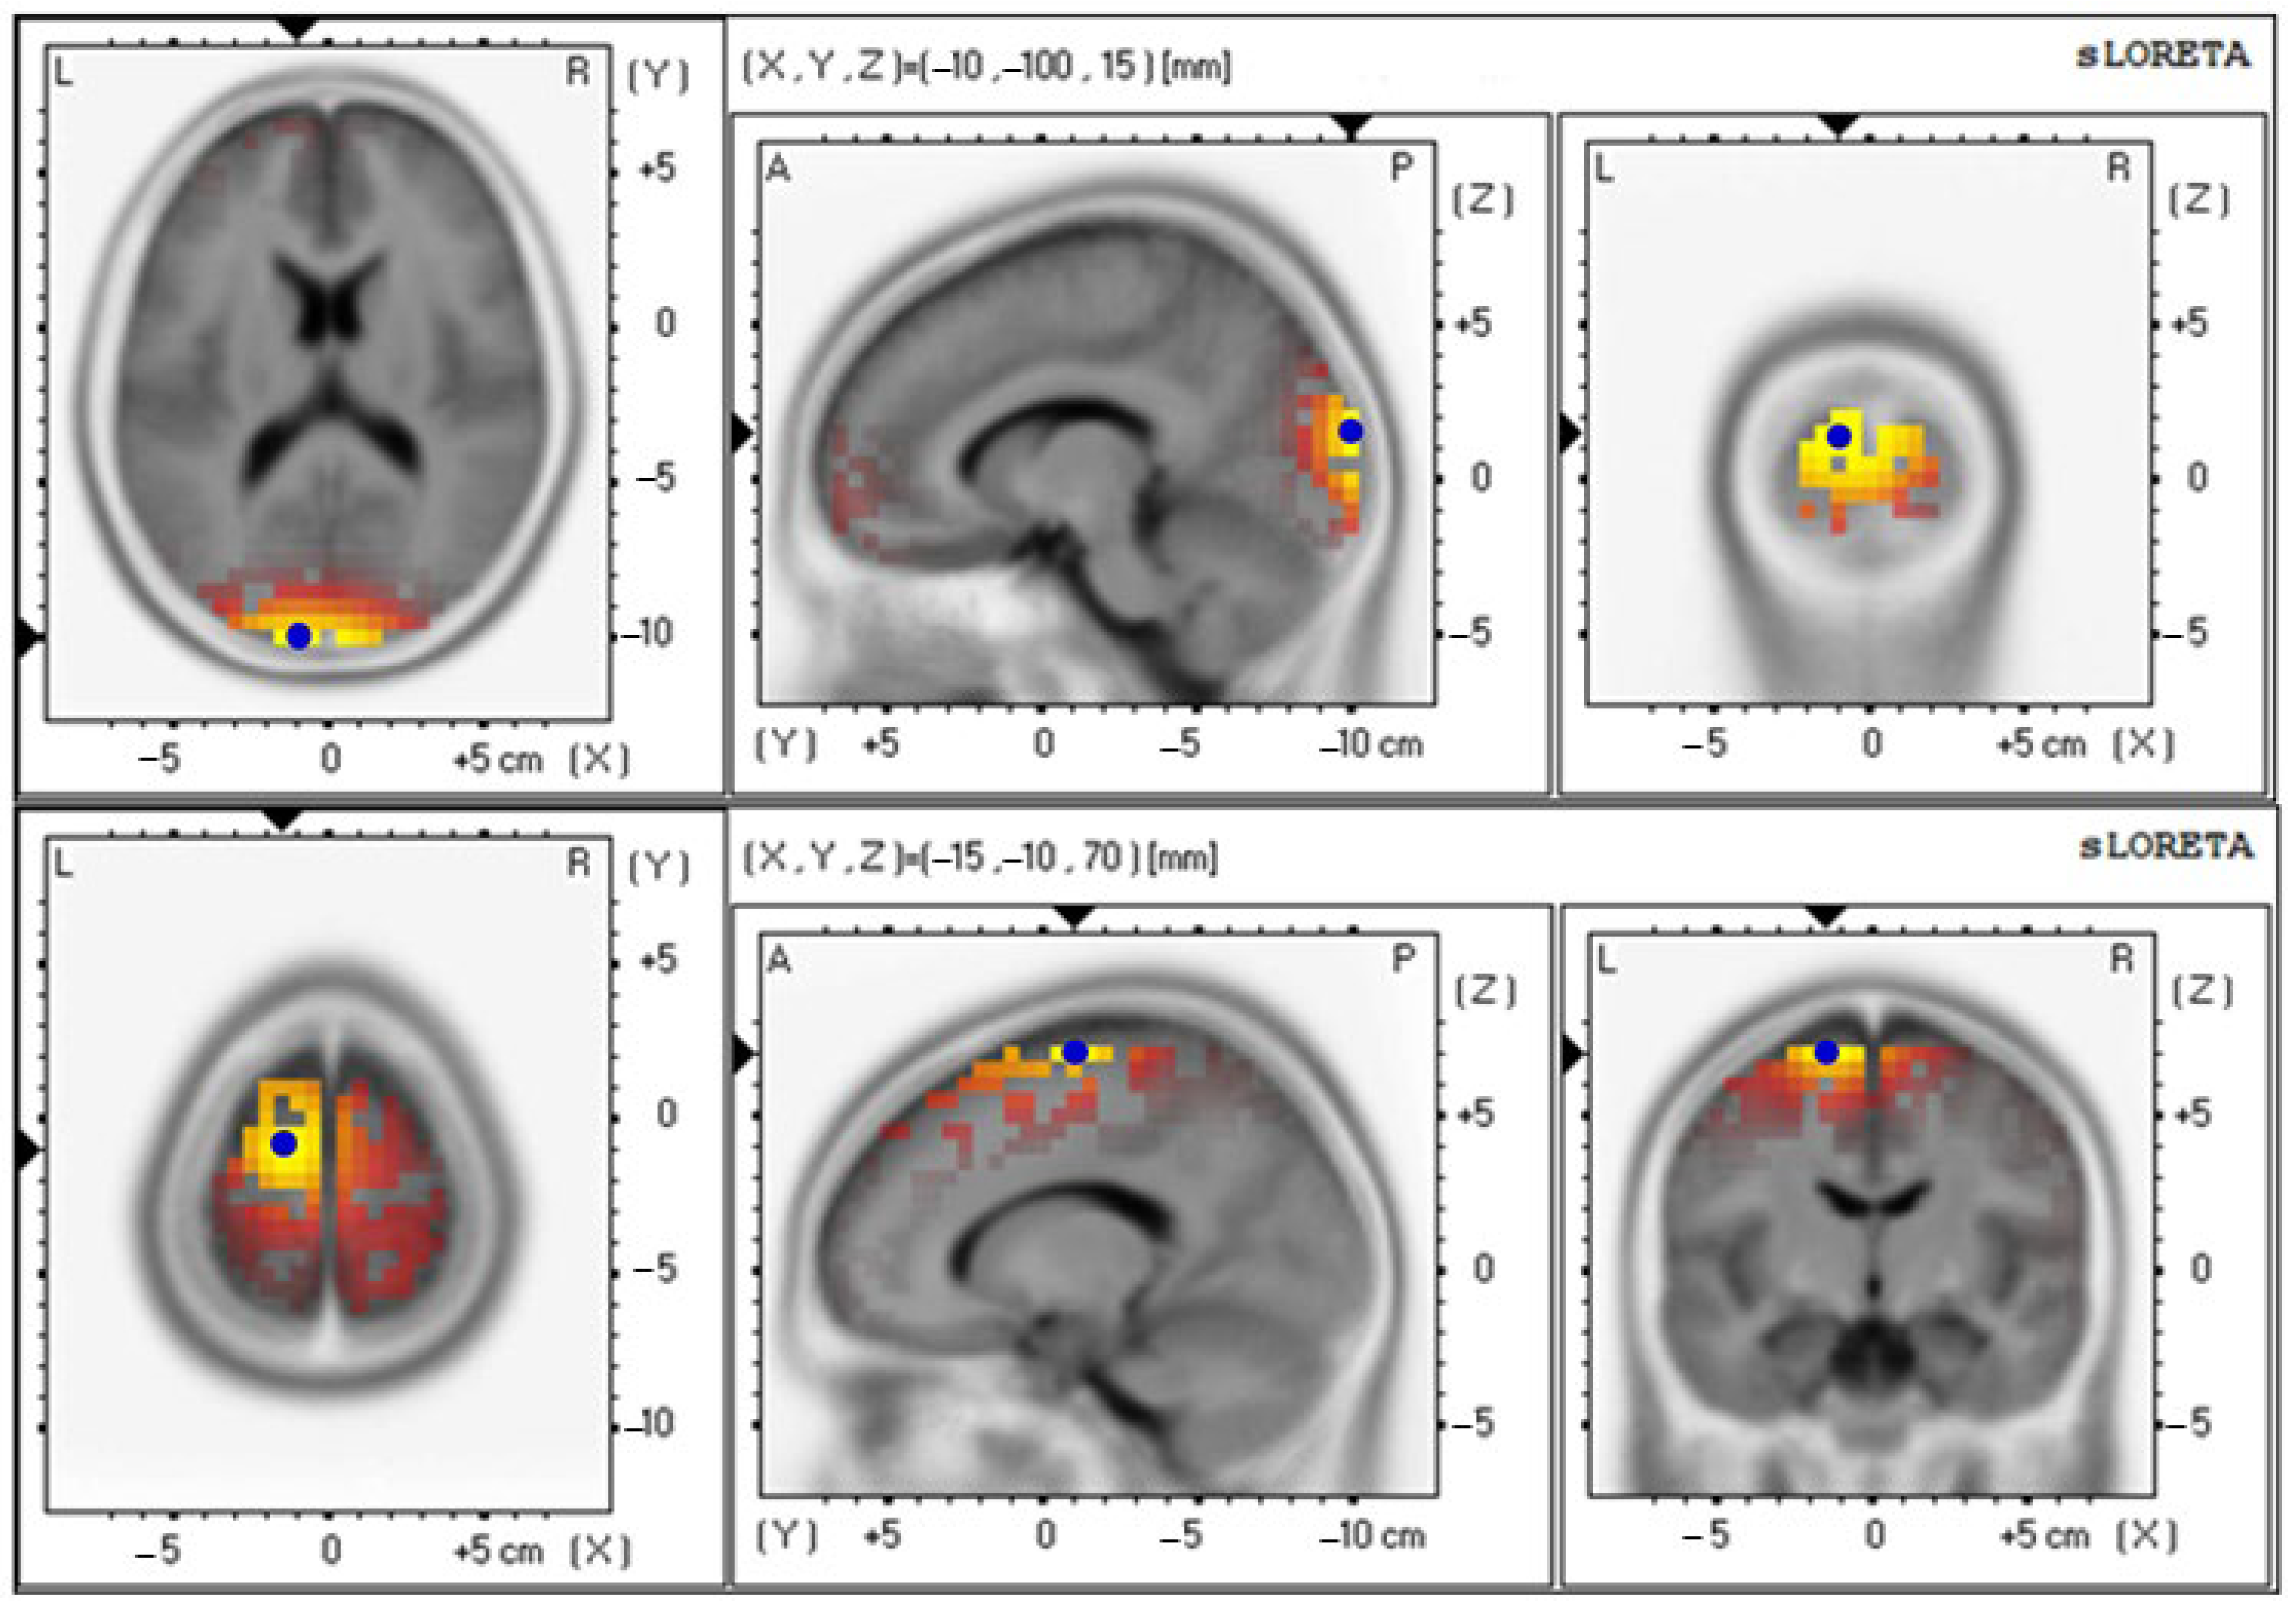
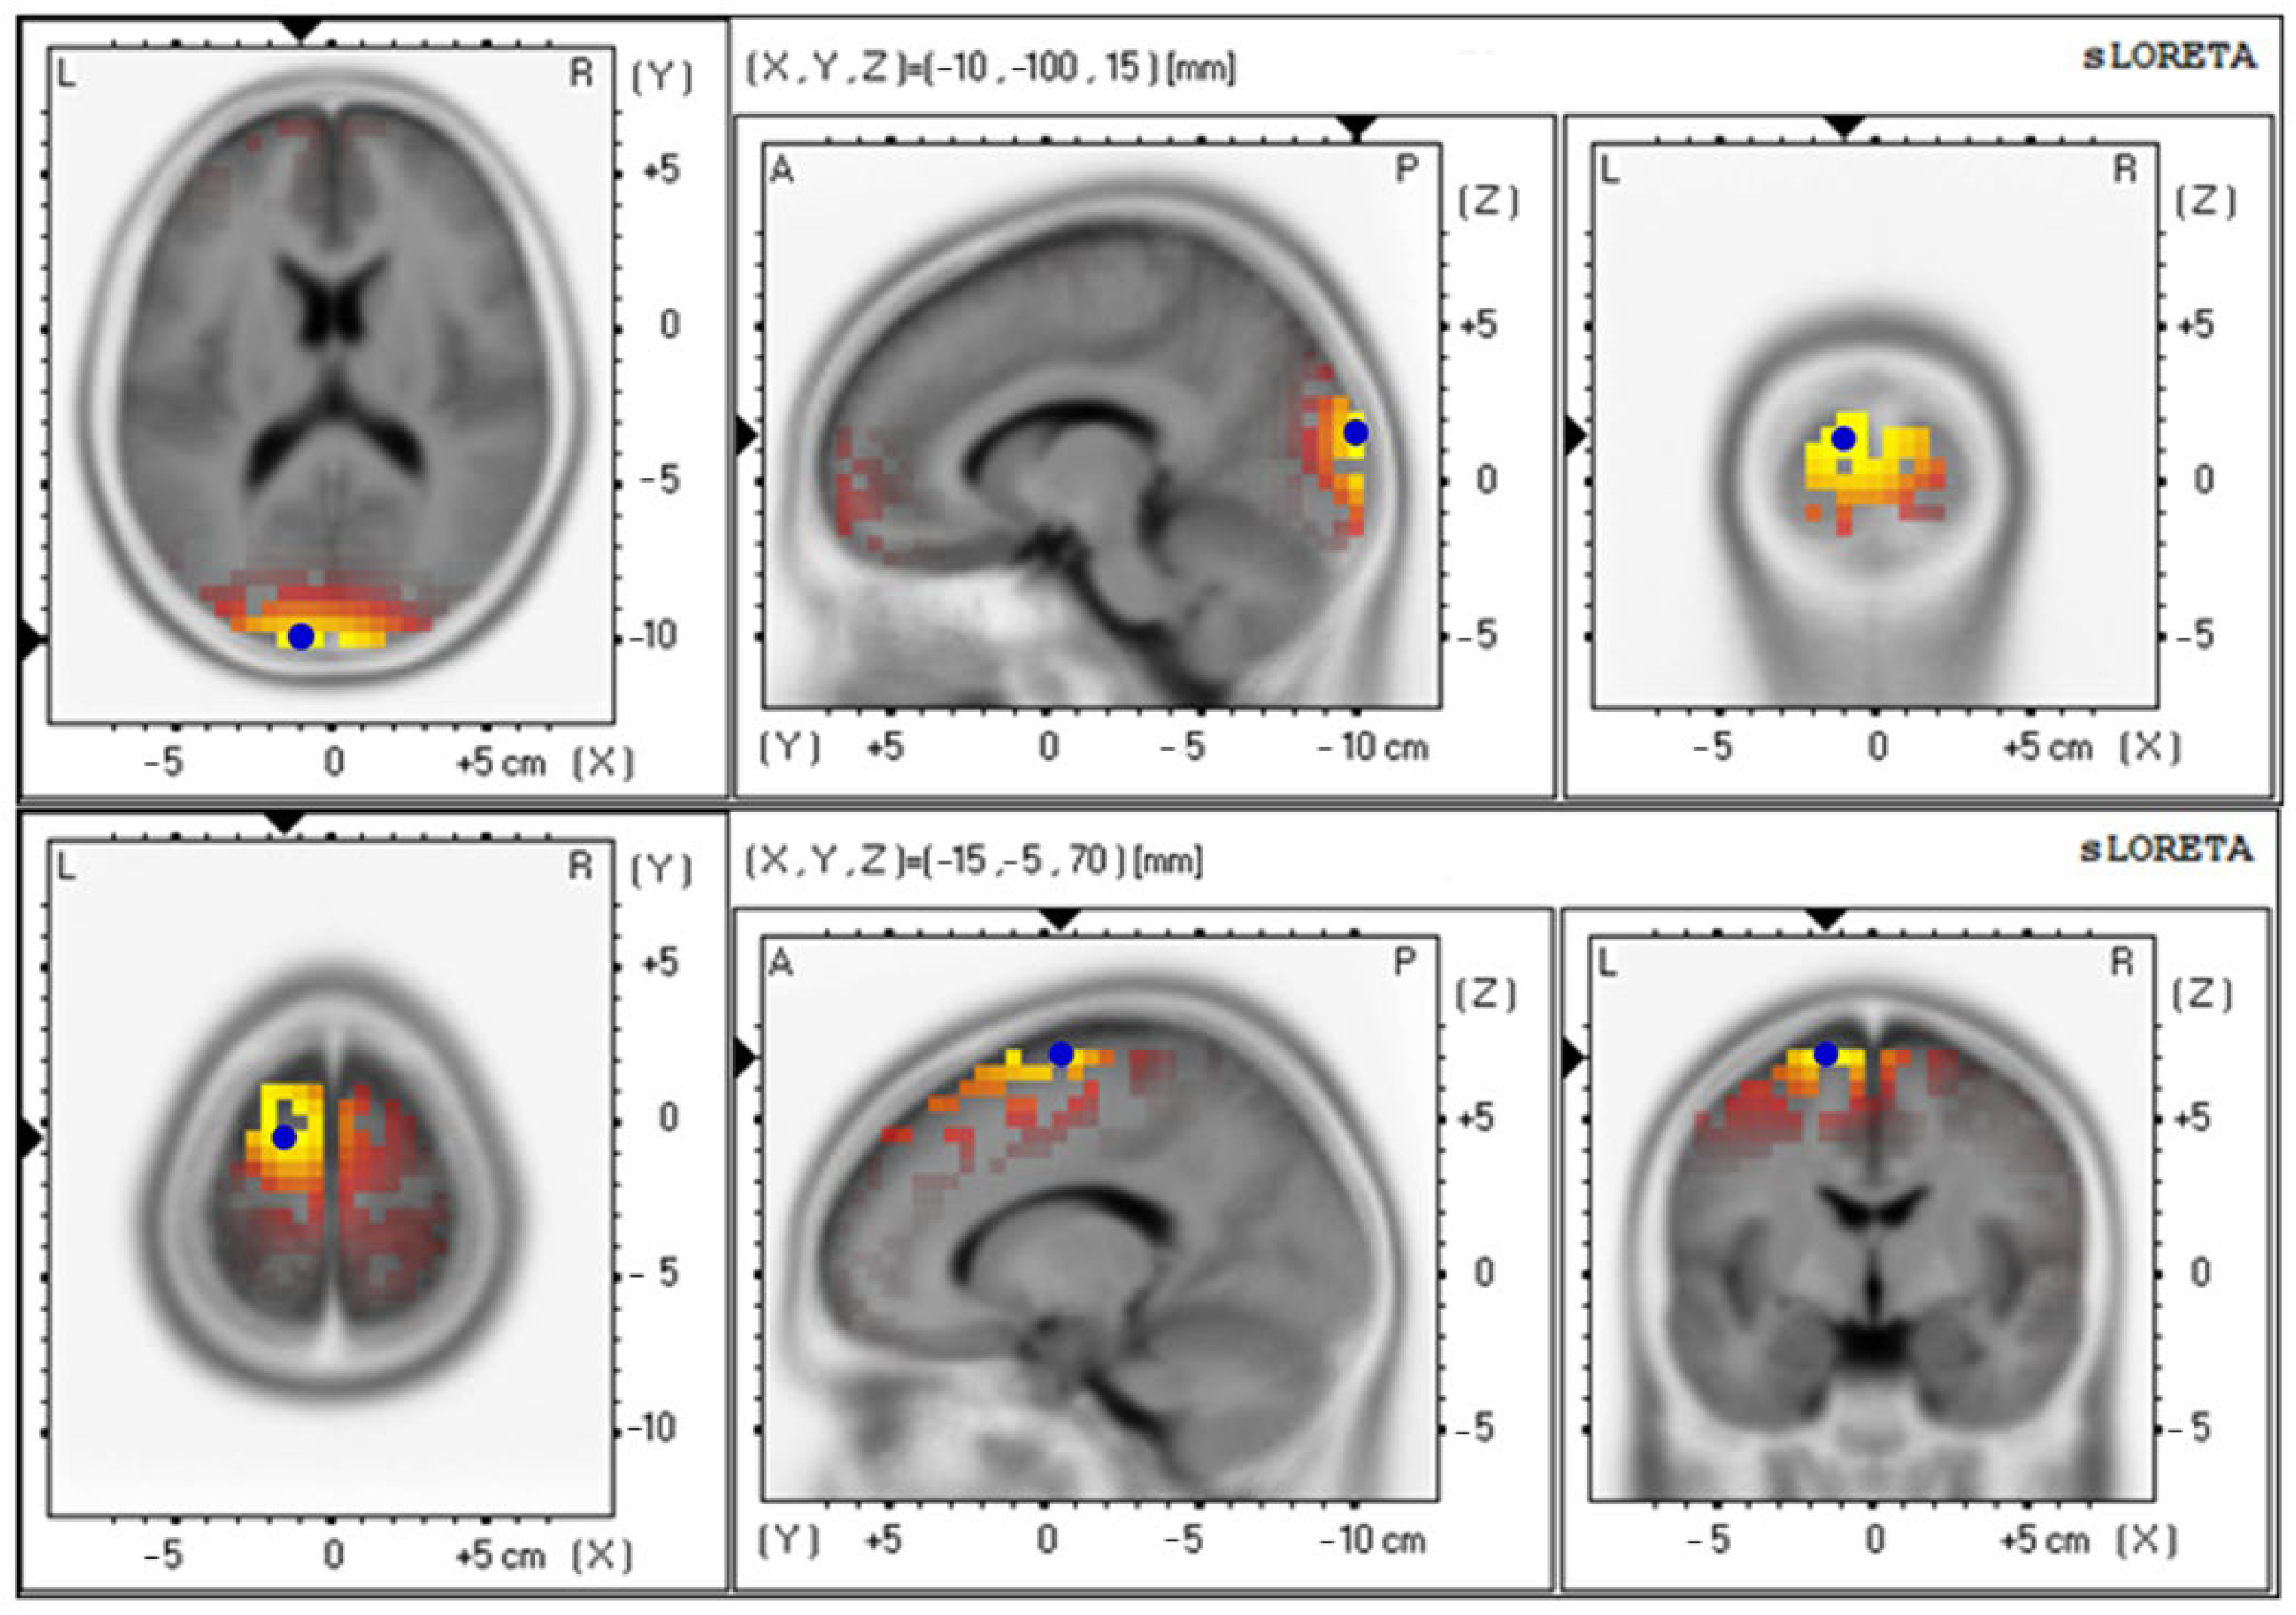
3.4. Effects of Probiotics on Brain Activity
4. Discussion
5. Conclusions
Author Contributions
Funding
Institutional Review Board Statement
Informed Consent Statement
Data Availability Statement
Acknowledgments
Conflicts of Interest
References
- Bagheri, S.; Zolghadri, S.; Stanek, A. Beneficial Effects of Anti-Inflammatory Diet in Modulating Gut Microbiota and Controlling Obesity. Nutrients 2022, 14, 3985. [Google Scholar] [CrossRef] [PubMed]
- World Health Organisation. Available online: https://www.who.int/news-room/fact-sheets/detail/obesity-and-overweight (accessed on 9 December 2022).
- Puhl, R.M.; Heuer, C.A. Obesity Stigma: Important Considerations for Public Health. Am. J. Public Health 2010, 100, 1019–1028. [Google Scholar] [CrossRef] [PubMed]
- Sahoo, K.; Sahoo, B.; Choudhury, A.K.; Sofi, N.Y.; Kumar, R.; Bhadoria, A.S. Childhood Obesity: Causes and Consequences. J. Family Med. Prim. Care 2015, 4, 187–192. [Google Scholar] [PubMed]
- Houtman, T.A.; Eckermann, H.A.; Smidt, H.; de Weerth, C. Gut Microbiota and BMI Throughout Childhood: The Role of Firmicutes, Bacteroidetes, and Short-Chain Fatty Acid Producers. Sci. Rep. 2022, 12, 3140. [Google Scholar] [CrossRef]
- Baothman, O.A.; Zamzami, M.A.; Taher, I.; Abubaker, J.; Abu-Farha, M. The Role of Gut Microbiota in the Development of Obesity and Diabetes. Lipids Health Dis. 2016, 15, 108. [Google Scholar] [CrossRef]
- Pitocco, D.; Di Leo, M.; Tartaglione, L.; De Leva, F.; Petruzziello, C.; Saviano, A.; Pontecorvi, A.; Ojetti, V. The Role of Gut Microbiota in Mediating Obesity and Diabetes Mellitus. Eur. Rev. Med. Pharmacol. Sci. 2020, 24, 1548–1562. [Google Scholar]
- Backhed, F.; Ding, H.; Wang, T.; Hooper, L.V.; Koh, G.Y.; Nagy, A.; Semenkovich, C.F.; Gordon, J.I. The Gut Microbiota as an Environmental Factor that Regulates Fat Storage. Proc. Natl. Acad. Sci. USA 2004, 101, 15718–15723. [Google Scholar] [CrossRef]
- Turnbaugh, P.J.; Ley, R.E.; Mahowald, M.A.; Magrini, V.; Mardis, E.R.; Gordon, J.I. An Obesity-Associated Gut Microbiome with Increased Capacity for Energy Harvest. Nature 2006, 444, 1027–1031. [Google Scholar] [CrossRef]
- Ley, R.E.; Backhed, F.; Turnbaugh, P.; Lozupone, C.A.; Knight, R.D.; Gordon, J.I. Obesity Alters Gut Microbial Ecology. Proc. Natl. Acad. Sci. USA 2005, 102, 11070–11075. [Google Scholar] [CrossRef]
- Turnbaugh, P.J.; Backhed, F.; Fulton, L.; Gordon, J.I. Diet-Induced Obesity is Linked to Marked but Reversible Alterations in the Mouse Distal Gut Microbiome. Cell Host Microbe 2008, 3, 213–223. [Google Scholar] [CrossRef]
- Ley, R.E.; Turnbaugh, P.J.; Klein, S.; Gordon, J.I. Microbial Ecology: Human Gut Microbes Associated with Obesity. Nature 2006, 444, 1022–1023. [Google Scholar] [CrossRef]
- Verdam, F.J.; Fuentes, S.; de Jonge, C.; Zoetendal, E.G.; Erbil, R.; Greve, J.W.; Buurman, W.A.; de Vos, W.M.; Rensen, S.S. Human Intestinal Microbiota Composition is Associated with Local and Systemic Inflammation in Obesity. Obesity 2013, 21, E607–E615. [Google Scholar] [CrossRef] [PubMed]
- Million, M.; Maraninchi, M.; Henry, M.; Armougom, F.; Richet, H.; Carrieri, P.; Valero, R.; Raccah, D.; Vialettes, B.; Raoult, D. Obesity-Associated Gut Microbiota is Enriched in Lactobacillus reuteri and Depleted in Bifidobacterium animalis and Methanobrevibacter smithii. Int. J. Obes. 2012, 36, 817–825. [Google Scholar] [CrossRef] [PubMed]
- Million, M.; Angelakis, E.; Maraninchi, M.; Henry, M.; Giorgi, R.; Valero, R.; Vialettes, B.; Raoult, D. Correlation Between Body Mass Index and Gut Concentrations of Lactobacillus reuteri, Bifidobacterium animalis, Methanobrevibacter smithii and Escherichia coli. Int. J. Obes. 2013, 37, 1460–1466. [Google Scholar] [CrossRef]
- Ley, R.E. Obesity and the Human Microbiome. Curr. Opin Gastroenterol. 2010, 26, 5–11. [Google Scholar] [CrossRef]
- Scheithauer, T.P.M.; Rampanelli, E.; Nieuwdorp, M.; Vallance, B.A.; Verchere, C.B.; van Raalte, D.H.; Herrema, H. Gut Microbiota as a Trigger for Metabolic Inflammation in Obesity and Type 2 Diabetes. Front. Immunol. 2020, 11, 571731. [Google Scholar] [CrossRef]
- Marseglia, L.; Manti, S.; D’Angelo, G.; Nicotera, A.; Parisi, E.; Di Rosa, G.; Gitto, E.; Arrigo, T. Oxidative Stress in Obesity: A Critical Component in Human Diseases. Int. J. Mol. Sci. 2015, 16, 378–400. [Google Scholar] [CrossRef]
- Pihl, E.; Zilmer, K.; Kullisaar, T.; Kairane, C.; Magi, A.; Zilmer, M. Atherogenic Inflammatory and Oxidative Stress Markers in Relation to Overweight Values in Male Former Athletes. Int. J. Obes. 2006, 30, 141–146. [Google Scholar] [CrossRef]
- Chrysohoou, C.; Panagiotakos, D.B.; Pitsavos, C.; Skoumas, I.; Papademetriou, L.; Economou, M.; Stefanadis, C. The Implication of Obesity on Total Antioxidant Capacity in Apparently Healthy Men and Women: The ATTICA Study. Nutr. Metab. Cardiovasc. Dis. 2007, 17, 590–597. [Google Scholar] [CrossRef]
- Nerurkar, P.V.; Johns, L.M.; Buesa, L.M.; Kipyakwai, G.; Volper, E.; Sato, R.; Shah, P.; Feher, D.; Williams, P.G.; Nerurkar, V.R. Momordica charantia (bitter melon) Attenuates High-Fat Diet-Associated Oxidative Stress and Neuroinflammation. J. Neuroinflamm. 2011, 8, 64. [Google Scholar] [CrossRef] [PubMed]
- Oluwagbemigun, K.; Anesi, A.; Ulaszewska, M.; Clarke, G.; Alexy, U.; Schmid, M.; Roden, M.; Herder, C.; Mattivi, F.; Nöthlings, U. Longitudinal Relationship of Amino Acids and Indole Metabolites with Long-Term Body Mass Index and Cardiometabolic Risk Markers in Young Individuals. Sci. Rep. 2020, 10, 6399. [Google Scholar] [CrossRef] [PubMed]
- Favennec, M.; Hennart, B.; Caiazzo, R.; Leloire, A.; Yengo, L.; Verbanck, M.; Arredouani, A.; Marre, M.; Pigeyre, M.; Bessede, A.; et al. The Kynurenine Pathway is Activated in Human Obesity and Shifted Toward Kynurenine Monooxygenase Activation. Obesity 2015, 23, 2066–2074. [Google Scholar] [CrossRef] [PubMed]
- Funahashi, S. Working Memory in the Prefrontal Cortex. Brain Sci. 2017, 7, 49. [Google Scholar] [CrossRef] [PubMed]
- Bangun, S.R.; Wiguna, T.; Ismail, R.I.; Kaligis, F.; Winarsih, N.S. Working Memory and Learning Difficulties: An Evidence-Based Study in a Public Primary School in Jakarta. Int. J. Child Develop. Ment. Health 2019, 7, 11–20. [Google Scholar]
- Holmes, J.; Gathercole, S.E.; Dunning, D.L. Poor Working Memory: Impact and Interventions. Adv. Child Dev. Behav. 2010, 39, 1–43. [Google Scholar] [PubMed]
- Yang, Y.; Shields, G.S.; Wu, Q.; Liu, Y.; Chen, H.; Guo, C. The Association between Obesity and Lower Working Memory is Mediated by Inflammation: Findings From a Nationally Representative Dataset of US Adults. Brain Behav. Immun. 2020, 84, 173–179. [Google Scholar] [CrossRef]
- Arnoriaga-Rodríguez, M.; Mayneris-Perxachs, J.; Burokas, A.; Contreras-Rodríguez, O.; Blasco, G.; Coll, C.; Biarnés, C.; Miranda-Olivos, R.; Latorre, J.; Moreno-Navarrete, J.-M.; et al. Obesity Impairs Short-Term and Working Memory Through Gut Microbial Metabolism of Aromatic Amino Acids. Cell Metab. 2020, 32, 548–560. [Google Scholar] [CrossRef]
- Shields, G.S.; Deer, L.K.; Hastings, P.D.; Hostinar, C.E. Adiposity, Inflammation, and Working Memory: Evidence for a Vicious Cycle. Brain Behav. Immun. Health 2021, 13, 100202. [Google Scholar] [CrossRef]
- Benton, D.; ILSI Europe a.i.s.b.l. The Influence of Children’s Diet on Their Cognition and Behavior. Eur. J. Nutr. 2008, 47, 25–37. [Google Scholar] [CrossRef]
- Papalini, S.; Michels, F.; Kohn, N.; Wegman, J.; van Hemert, S.; Roelofs, K.; Arias-Vasquez, A.; Aarts, E. Stress Matters: Randomized Controlled Trial on the Effect of Probiotics on Neurocognition. Neurobiol. Stress 2019, 10, 100141. [Google Scholar] [CrossRef]
- Handajani, Y.S.; Turana, Y.; Yogiara, Y.; Sugiyono, S.P.; Lamadong, V.; Widjaja, N.T.; Christianto, G.A.; Suwanto, A. Effects of Tempeh Probiotics on Elderly with Cognitive Impairment. Front. Aging Neurosci. 2022, 14, 891773. [Google Scholar] [CrossRef]
- Chaiyasut, C.; Sivamaruthi, B.S.; Kesika, P.; Khongtan, S.; Khampithum, N.; Thangaleela, S.; Peerajan, S.; Bumrungpert, A.; Chaiyasut, K.; Sirilun, S.; et al. Synbiotic Supplementation Improves Obesity Index and Metabolic Biomarkers in Thai Obese Adults: A Randomized Clinical Trial. Foods 2021, 10, 1580. [Google Scholar] [CrossRef] [PubMed]
- Patchsung, M.; Boonla, C.; Amnattrakul, P.; Dissayabutra, T.; Mutirangura, A.; Tosukhowong, P. Long Interspersed Nuclear Element-1 Hypomethylation and Oxidative Stress: Correlation and Bladder Cancer Diagnostic Potential. PLoS ONE 2012, 7, e37009. [Google Scholar] [CrossRef]
- Janaszewska, A.; Bartosz, G. Assay of Total Antioxidant Capacity: Comparison of Four Methods as Applied to Human Blood Plasma. Scand. J. Clin. Lab. Investig. 2002, 62, 231–236. [Google Scholar] [CrossRef] [PubMed]
- Kil, H.N.; Eom, S.Y.; Park, J.D.; Kawamoto, T.; Kim, Y.D.; Kim, H. A Rapid Method for Estimating The Levels of Urinary Thiobarbituric Acid Reactive Substances for Environmental Epidemiologic Survey. Toxicol. Res. 2014, 30, 7–11. [Google Scholar] [CrossRef] [PubMed]
- Lalitsuradej, E.; Sirilun, S.; Sittiprapaporn, P.; Sivamaruthi, B.S.; Pintha, K.; Tantipaiboonwong, P.; Khongtan, S.; Fukngoen, P.; Peerajan, S.; Chaiyasut, C. The Effects of Synbiotics Administration on Stress-Related Parameters in Thai Subjects-A Preliminary Study. Foods 2022, 11, 759. [Google Scholar] [CrossRef]
- Chaiyasut, C.; Sirilun, S.; Juntarachot, N.; Tongpong, P.; Ouparee, W.; Sivamaruthi, B.S.; Peerajan, S.; Waditee-Sirisattha, R.; Prombutara, P.; Klankeo, P.; et al. Effect of Dextranase and Dextranase-and-Nisin-Containing Mouthwashes on Oral Microbial Community of Healthy Adults—A Pilot Study. Appl. Sci. 2022, 12, 1650. [Google Scholar] [CrossRef]
- Sittiprapaporn, P.; Bumrungpert, A.; Suyajai, P.; Stough, C. Effectiveness of Fish Oil-DHA Supplementation for Cognitive Function in Thai Children: A Randomized, Doubled-Blind, Two-Dose, Placebo-Controlled Clinical Trial. Foods 2022, 11, 2595. [Google Scholar] [CrossRef]
- Pelegrina, S.; Lechuga, M.T.; García-Madruga, J.A.; Elosúa, M.R.; Macizo, P.; Carreiras, M.; Fuentes, L.J.; Bajo, M.T. Normative Data on the N-Back Task for Children and Young Adolescents. Front. Psychol. 2015, 6, 1544. [Google Scholar] [CrossRef]
- Liao, K.; McCandliss, B.D.; Carlson, S.E.; Colombo, J.; Shaddy, D.J.; Kerling, E.H.; Lepping, R.J.; Sittiprapaporn, W.; Cheatham, C.L.; Gustafson, K.M. Event-Related Potential Differences in Children Supplemented with Long-Chain Polyunsaturated Fatty Acids During Infancy. Dev. Sci. 2017, 20, e12455. [Google Scholar] [CrossRef]
- Pascual-Marqui, R.D. Standardized Low Resolution Brain Electromagnetic Tomography (sLORETA): Technical Details. Methods Find. Exp. Clin. Pharmacol. 2002, 24 (Suppl. D), 5–12. [Google Scholar] [PubMed]
- Lehmann, D.; Skrandies, W. Principles of Spatial Analysis. In Methods of Analysis of Brain Electrical and Magnetic Signals. Handbook of Electroencephalography and Clinical Neurophysiology, Revised Series; Gevins, A.S., Remond, A., Eds.; Elsevier Science Ltd.: Amsterdam, The Netherlands, 1987; Volume 1, pp. 309–354. [Google Scholar]
- Pascual-Marqui, R.D.; Michel, C.M.; Lehmann, D. Segmentation of Brain Electrical Activity into Microstates: Model Estimation and Validation. IEEE Trans. Biomed. Eng. 1995, 42, 658–665. [Google Scholar] [CrossRef] [PubMed]
- Skrandies, W. Global Field Power and Topographic Similarity. Brain Topogr. 1990, 3, 137–141. [Google Scholar] [CrossRef] [PubMed]
- Bann, S.A.; Herdman, A.T. Event Related Potentials Reveal Early Phonological and Orthographic Processing of Single Letters in Letter-Detection and Letter-Rhyme Paradigms. Front. Hum. Neurosci. 2016, 10, 176. [Google Scholar] [CrossRef] [PubMed]
- Wang, J.; Chen, W.D.; Wang, Y.D. The Relationship between Gut Microbiota and Inflammatory Diseases: The Role of Macrophages. Front. Microbiol. 2020, 11, 1065. [Google Scholar] [CrossRef] [PubMed]
- Forbes, J.D.; Chen, C.Y.; Knox, N.C.; Marrie, R.A.; El-Gabalawy, H.; de Kievit, T.; Alfa, M.; Bernstein, C.N.; Van Domselaar, G. A Comparative Study of the Gut Microbiota in Immune-Mediated Inflammatory Diseases-Does a Common Dysbiosis Exist? Microbiome 2018, 6, 221. [Google Scholar] [CrossRef] [PubMed]
- Meijnikman, A.S.; Gerdes, V.E.; Nieuwdorp, M.; Herrema, H. Evaluating Causality of Gut Microbiota in Obesity and Diabetes in Humans. Endocr. Rev. 2018, 39, 133–153. [Google Scholar] [CrossRef]
- Samuel, B.S.; Shaito, A.; Motoike, T.; Rey, F.E.; Backhed, F.; Manchester, J.K.; Hammer, R.E.; Williams, S.C.; Crowley, J.; Yanagisawa, M.; et al. Effects of the Gut Microbiota on Host Adiposity are Modulated by the Short-Chain Fatty-Acid Binding G Protein-Coupled Receptor, Gpr41. Proc. Natl. Acad. Sci. USA 2008, 105, 16767–16772. [Google Scholar] [CrossRef]
- Holmes, Z.C.; Silverman, J.D.; Dressman, H.K.; Wei, Z.; Dallow, E.P.; Armstrong, S.C.; Seed, P.C.; Rawls, J.F.; David, L.A. Short-Chain Fatty Acid Production by Gut Microbiota from Children with Obesity Differs According to Prebiotic Choice and Bacterial Community Composition. mBio 2020, 11, e00914-20. [Google Scholar] [CrossRef]
- Candeliere, F.; Simone, M.; Leonardi, A.; Rossi, M.; Amaretti, A.; Raimondi, S. Indole and p-cresol in Feces of Healthy Subjects: Concentration, Kinetics, and Correlation with Microbiome. Front. Mol. Med. 2022, 2, 959189. [Google Scholar] [CrossRef]
- Lee, J.H.; Lee, J. Indole as an Intercellular Signal in Microbial Communities. FEMS Microbiol. Rev. 2010, 34, 426–444. [Google Scholar] [CrossRef]
- Marcobal, A.; Kashyap, P.C.; Nelson, T.A.; Aronov, P.A.; Donia, M.S.; Spormann, A.; Fischbach, M.A.; Sonnenburg, J.L. A Metabolomic View of How the Human Gut Microbiota Impacts the Host Metabolome Using Humanized and Gnotobiotic Mice. ISME J. 2013, 7, 1933–1943. [Google Scholar] [CrossRef]
- Waclawikova, B.; El Aidy, S. Role of Microbiota and Tryptophan Metabolites in the Remote Effect of Intestinal Inflammation on Brain and Depression. Pharmaceuticals 2018, 11, 63. [Google Scholar] [CrossRef] [PubMed]
- Jonnakuty, C.; Gragnoli, C. What Do We Know About Serotonin? J. Cell Physiol. 2008, 217, 301–306. [Google Scholar] [CrossRef] [PubMed]
- Afarideh, M.; Behdadnia, A.; Noshad, S.; Mirmiranpour, H.; Mousavizadeh, M.; Khajeh, E.; Rad, M.; Mazaheri, T.; Nakhjavani, M.; Esteghamati, A. Association of Peripheral 5-Hydroxyindole-3-Acetic Acid, A Serotonin Derivative, with Metabolic Syndrome and Low-Grade Inflammation. Endocr. Pract. 2015, 21, 711–718. [Google Scholar] [CrossRef] [PubMed]
- Chaiyasut, C.; Sivamaruthi, B.S.; Lailerd, N.; Sirilun, S.; Khongtan, S.; Fukngoen, P.; Peerajan, S.; Saelee, M.; Chaiyasut, K.; Kesika, P.; et al. Probiotics Supplementation Improves Intestinal Permeability, Obesity Index and Metabolic Biomarkers in Elderly Thai Subjects: A Randomized Controlled Trial. Foods 2022, 11, 268. [Google Scholar] [CrossRef]
- Cervantes Gracia, K.; Llanas-Cornejo, D.; Husi, H. CVD and Oxidative Stress. J. Clin. Med. 2017, 6, 22. [Google Scholar] [CrossRef]
- Darenskaya, M.A.; Kolesnikova, L.I.; Rychkova, L.V.; Kravtsova, O.V.; Semenova, N.V.; Kolesnikov, S.I. Relationship between Lipid Metabolism State, Lipid Peroxidation and Antioxidant Defense System in Girls with Constitutional Obesity. AIMS Mol. Sci. 2021, 8, 117–126. [Google Scholar] [CrossRef]
- Alcazar, M.; Escribano, J.; Ferré, N.; Closa-Monasterolo, R.; Selma-Royo, M.; Feliu, A.; Castillejo, G.; Luque, V.; Feliu-Rovira, A.; Muñoz-Hernando, J.; et al. Gut Microbiota is Associated with Metabolic Health in Children with Obesity. Clin Nutr. 2022, 41, 1680–1688. [Google Scholar] [CrossRef]
- Petraroli, M.; Castellone, E.; Patianna, V.; Esposito, S. Gut Microbiota and Obesity in Adults and Children: The State of the Art. Front Pediatr. 2021, 9, 657020. [Google Scholar] [CrossRef]
- Davis, C.D. The Gut Microbiome and Its Role in Obesity. Nutr. Today 2016, 51, 167–174. [Google Scholar] [CrossRef]
- Kalliomaki, M.; Collado, M.C.; Salminen, S.; Isolauri, E. Early Differences in Fecal Microbiota Composition in Children may Predict Overweight. Am. J. Clin. Nutr. 2008, 87, 534–538. [Google Scholar] [CrossRef]
- Karlsson, C.L.; Onnerfalt, J.; Xu, J.; Molin, G.; Ahrne, S.; Thorngren-Jerneck, K. The Microbiota of the Gut in Preschool Children with Normal and Excessive Body Weight. Obesity 2012, 20, 2257–2261. [Google Scholar] [CrossRef]
- Bervoets, L.; Van Hoorenbeeck, K.; Kortleven, I.; Van Noten, C.; Hens, N.; Vael, C.; Goossens, H.; Desager, K.N.; Vankerckhoven, V. Differences in Gut Microbiota Composition Between Obese and Lean Children: A Cross-Sectional Study. Gut Pathog. 2013, 5, 10. [Google Scholar] [CrossRef] [PubMed]
- Koleva, P.T.; Bridgman, S.L.; Kozyrskyj, A.L. The Infant Gut Microbiome: Evidence for Obesity Risk and Dietary Intervention. Nutrients 2015, 7, 2237–2260. [Google Scholar] [CrossRef] [PubMed]
- Schwiertz, A.; Taras, D.; Schäfer, K.; Beijer, S.; Bos, N.A.; Donus, C.; Hardt, P.D. Microbiota and SCFA in Lean and Overweight Healthy Subjects. Obesity 2010, 18, 190–195. [Google Scholar] [CrossRef]
- Wen, X.; Xiaoyue, D.; Longkun, D.; Yue, X.; Man, Y.; Min, Z.; Liang, W.; Chengxue, Y.; Huaxi, X. Three Main Short-Chain Fatty Acids Inhibit the Activation of THP-1 cells by Mycoplasma pneumoniae. Biosci. Biotechnol. Biochem. 2021, 85, 923–930. [Google Scholar] [CrossRef] [PubMed]
- Xiong, R.-G.; Zhou, D.-D.; Wu, S.-X.; Huang, S.-Y.; Saimaiti, A.; Yang, Z.-J.; Shang, A.; Zhao, C.-N.; Gan, R.-Y.; Li, H.-B. Health Benefits and Side Effects of Short-Chain Fatty Acids. Foods 2022, 11, 2863. [Google Scholar] [CrossRef]
- Portincasa, P.; Bonfrate, L.; Vacca, M.; De Angelis, M.; Farella, I.; Lanza, E.; Khalil, M.; Wang, D.Q.-H.; Sperandio, M.; Di Ciaula, A. Gut Microbiota and Short Chain Fatty Acids: Implications in Glucose Homeostasis. Int. J. Mol. Sci. 2022, 23, 1105. [Google Scholar] [CrossRef]
- Macfarlane, S.; Macfarlane, G.T. Regulation of Short-Chain Fatty Acid Production. Proc. Nutr. Soc. 2003, 62, 67–72. [Google Scholar] [CrossRef]
- Dalile, B.; Van Oudenhove, L.; Vervliet, B.; Verbeke, K. The Role of Short-Chain Fatty Acids in Microbiota-Gut-Brain Communication. Nat. Rev. Gastroenterol. Hepatol. 2019, 16, 461–478. [Google Scholar] [CrossRef]
- Salonen, A.; Lahti, L.; Salojärvi, J.; Holtrop, G.; Korpela, K.; Duncan, S.H.; Date, P.; Farquharson, F.; Johnstone, A.M.; Lobley, G.E.; et al. Impact of Diet and Individual Variation on Intestinal Microbiota Composition and Fermentation Products in Obese Men. ISME J. 2014, 8, 2218–2230. [Google Scholar] [CrossRef]
- Kasai, C.; Sugimoto, K.; Moritani, I.; Tanaka, J.; Oya, Y.; Inoue, H.; Tameda, M.; Shiraki, K.; Ito, M.; Takei, Y.; et al. Comparison of the Gut Microbiota Composition Between Obese and Non-Obese Individuals in a Japanese Population, As Analyzed by Terminal Restriction Fragment Length Polymorphism and Next-Generation Sequencing. BMC Gastroenterol. 2015, 15, 100. [Google Scholar] [CrossRef]
- Kim, K.N.; Yao, Y.; Ju, S.Y. Short-Chain Fatty Acids and Fecal Microbiota Abundance in Humans with Obesity: A Systematic Review and Meta-Analysis. Nutrients 2019, 11, 2512. [Google Scholar] [CrossRef]
- Morais, L.H.; Schreiber, H.L.; Mazmanian, S.K. The Gut Microbiota–Brain Axis in Behaviour and Brain Disorders. Nat. Rev. Microbiol. 2021, 19, 241–255. [Google Scholar] [CrossRef] [PubMed]
- Bostick, J.W.; Schonhoff, A.M.; Mazmanian, S.K. Gut Microbiome-Mediated Regulation of Neuroinflammation. Curr. Opin. Immunol. 2022, 76, 102177. [Google Scholar] [CrossRef]
- Lokken, K.L.; Boeka, A.G.; Austin, H.M.; Gunstad, J.; Harmon, C.M. Evidence of Executive Dysfunction in Extremely Obese Adolescents: A Pilot Study. Surg. Obes. Relat. Dis. 2009, 5, 547–552. [Google Scholar] [CrossRef] [PubMed]
- Smith, E.; Hay, P.; Campbell, L.; Trollor, J.N. A Review of the Association between Obesity and Cognitive Function across the Lifespan: Implications for Novel Approaches to Prevention and Treatment. Obes. Rev. 2011, 12, 740–755. [Google Scholar] [CrossRef]
- Sorrakayala, S.; Rao, M.V. Short-Term Memory in Obese and Non-Obese Female School Children. Natl. J. Physiol. Pharm. Pharmacol. 2017, 7, 733. [Google Scholar] [CrossRef]
- Wu, N.; Chen, Y.; Yang, J.; Li, F. Childhood Obesity and Academic Performance: The Role of Working Memory. Front. Psychol. 2017, 8, 611. [Google Scholar] [CrossRef] [PubMed]
- Chai, W.J.; Abd Hamid, A.I.; Abdullah, J.M. Working Memory from the Psychological and Neurosciences Perspectives: A Review. Front. Psychol. 2018, 9, 401. [Google Scholar] [CrossRef] [PubMed]
- Jacola, L.M.; Willard, V.W.; Ashford, J.M.; Ogg, R.J.; Scoggins, M.A.; Jones, M.M.; Wu, S.; Conklin, H.M. Clinical Utility of the N-Back Task in Functional Neuroimaging Studies of Working Memory. J. Clin. Exp. Neuropsychol. 2014, 36, 875–886. [Google Scholar] [CrossRef] [PubMed]
- Heinzel, S.; Lorenz, R.C.; Pelz, P.; Heinz, A.; Walter, H.; Kathmann, N.; Rapp, M.A.; Stelzel, C. Neural Correlates of Training and Transfer Effects in Working Memory in Older Adults. Neuroimage 2016, 134, 236–249. [Google Scholar] [CrossRef]
- Yuan, Y.; Leung, A.W.; Duan, H.; Zhang, L.; Zhang, K.; Wu, J.; Qin, S. The Effects of Long-Term Stress on Neural Dynamics of Working Memory Processing: An Investigation Using ERP. Sci. Rep. 2016, 6, 23217. [Google Scholar] [CrossRef] [PubMed]
- Manelis, A.; Halchenko, Y.O.; Bonar, L.; Stiffler, R.S.; Satz, S.; Miceli, R.; Ladouceur, C.D.; Bebko, G.; Iyengar, S.; Swartz, H.A.; et al. Working Memory Updating in Individuals with Bipolar and Unipolar Depression: fMRI Study. Transl. Psychiatry 2022, 12, 441. [Google Scholar] [CrossRef]
- Fraga, F.J.; Mamani, G.Q.; Johns, E.; Tavares, G.; Falk, T.H.; Phillips, N.A. Early Diagnosis of Mild Cognitive Impairment and Alzheimer’s with Event-Related Potentials and Event-Related Desynchronization in N-Back Working Memory Tasks. Comput. Methods Programs Biomed. 2018, 164, 1–13. [Google Scholar] [CrossRef]
- Kane, M.J.; Conway, A.R.; Miura, T.K.; Colflesh, G.J. Working Memory, Attention Control, and the N-Back Task: A Question of Construct Validity. J. Exp. Psychol. Learn. Mem. Cogn. 2007, 33, 615. [Google Scholar] [CrossRef]
- Gilmour, G.; Porcelli, S.; Bertaina-Anglade, V.; Arce, E.; Dukart, J.; Hayen, A.; Lobo, A.; Lopez-Anton, R.; Pich, E.M.; Pemberton, D.J.; et al. Relating Constructs of Attention and Working Memory to Social Withdrawal in Alzheimer’s Disease and Schizophrenia: Issues Regarding Paradigm Selection. Neurosci. Biobehav. Rev. 2019, 97, 47–69. [Google Scholar] [CrossRef]
- Gevins, A.; Smith, M.E.; McEvoy, L.; Yu, D. High-Resolution EEG Mapping of Cortical Activation Related to Working Memory: Effects of Task Difficulty, Type of Processing, and Practice. Cereb. Cortex. 1997, 7, 374–385. [Google Scholar] [CrossRef]
- Malaguarnera, M.; Greco, F.; Barone, G.; Gargante, M.P.; Malaguarnera, M.; Toscano, M.A. Bifidobacterium longum with Fructo-oligosaccharide (FOS) Treatment in Minimal Hepatic Encephalopathy: A Randomized, Double-Blind, Placebo-Controlled Study. Dig. Dis. Sci. 2007, 52, 3259–3265. [Google Scholar] [CrossRef]
- Schneider, E.; Doll, J.P.; Schweinfurth, N.; Kettelhack, C.; Schaub, A.-C.; Yamanbaeva, G.; Varghese, N.; Mählmann, L.; Brand, S.; Eckert, A.; et al. Effect of Short-Term, High-Dose Probiotic Supplementation on Cognition, Related Brain Functions and BDNF in Patients with Depression: A Secondary Analysis of A Randomized Controlled Trial. J. Psychiatry Neurosci. 2023, 48, E23–E33. [Google Scholar] [CrossRef] [PubMed]
- Ng, Q.X.; Peters, C.; Ho, C.Y.X.; Lim, D.Y.; Yeo, W.S. A meta-analysis of the use of probiotics to alleviate depressive symptoms. J. Affect. Disord. 2018, 228, 13–19. [Google Scholar] [CrossRef]
- Cardona, D.; Roman, P.; Cañadas, F.; Sánchez-Labraca, N. The Effect of Multiprobiotics on Memory and Attention in Fibromyalgia: A Pilot Randomized Controlled Trial. Int. J. Environ. Res. Public Health 2021, 18, 3543. [Google Scholar] [CrossRef]
- Yang, C.Y.; Huang, C.K. Working-Memory Evaluation Based on EEG Signals during N-Back Tasks. J. Integr. Neurosci. 2018, 17, 695–707. [Google Scholar] [CrossRef] [PubMed]
- Lamichhane, B.; Westbrook, A.; Cole, M.W.; Braver, T.S. Exploring Brain-Behavior Relationships in the N-Back Task. Neuroimage 2020, 212, 116683. [Google Scholar] [CrossRef] [PubMed]
- Miró-Padilla, A.; Bueichekú, E.; Ávila, C. Locating Neural Transfer Effects of N-Back Training on the Central Executive: A Longitudinal fMRI Study. Sci. Rep. 2020, 10, 5226. [Google Scholar] [CrossRef]
- Shalchy, M.A.; Pergher, V.; Pahor, A.; Van Hulle, M.M.; Seitz, A.R. N-Back Related ERPs Depend on Stimulus Type, Task Structure, Pre-processing, and Lab Factors. Front. Hum. Neurosci. 2020, 14, 549966. [Google Scholar] [CrossRef]
- Hempel, S.; Newberry, S.; Ruelaz, A.; Wang, Z.; Miles, J.N.V.; Suttorp, M.J.; Johnsen, B.; Shanman, R.; Slusser, W.; Fu, N.; et al. Safety of Probiotics Used to Reduce Risk and Prevent or Treat Disease. Evid. Rep. Technol. Assess. (Full Rep.) 2011, 200, 1–645. [Google Scholar]
- Sung, J.J.Y.; Wong, S.H. What is Unknown in Using Microbiota as a Therapeutic? J. Gastroenterol. Hepatol. 2022, 37, 39–44. [Google Scholar] [CrossRef]
- Ng, Q.X.; Lim, Y.L.; Yaow, C.Y.L.; Ng, W.K.; Thumboo, J.; Liew, T.M. Effect of Probiotic Supplementation on Gut Microbiota in Patients with Major Depressive Disorders: A Systematic Review. Nutrients 2023, 15, 1351. [Google Scholar] [CrossRef]


| Parameters | Baseline (n = 10) |
|---|---|
| Age (years) | 9 * |
| Gender | |
| Male, n (%) | 6 (60.00) ** |
| Female, n (%) | 4 (40.00) ** |
| Height, cm | 139.65 ± 3.26 |
| Body weight, kg | 56.02 ± 5.15 |
| Body mass index, kg/m2 | 28.30 ± 1.82 |
| Body fat, % | 33.57 ± 3.19 |
| Visceral fat, % | 9.60 ± 1.66 |
| Arm circumference, cm | 30.42 ± 1.64 |
| Waist circumference, cm | 89.28 ± 3.17 |
| Hip circumference, cm | 93.30 ± 3.62 |
| Waist/Hip ratio | 0.96 ± 0.02 |
| Parameters | Probiotic (n = 10) | p-Value | |
|---|---|---|---|
| Baseline | 12 Weeks | ||
| Obesity index | |||
| Body weight, kg | 56.02 ± 5.15 | 56.48 ± 5.31 | 0.116 a |
| Body mass index, kg/m2 | 28.30 ± 1.82 | 28.45 ± 1.87 | 0.256 a |
| Body fat, % | 33.57 ± 3.19 | 34.52 ± 3.28 | 0.115 a |
| Visceral fat, % | 9.60 ± 1.66 | 9.90 ± 1.73 | 0.180 b |
| Gut microbial metabolites | |||
| Butyric acid (µmol/g) | 50.24 ± 6.06 | 87.29 ± 14.36 | 0.047 b* |
| Propionic acid (µmol/g) | 192.72 ± 42.73 | 319.79 ± 51.77 | 0.047 b* |
| Acetic acid (µmol/g) | 32.30 ± 5.17 | 25.03 ± 2.55 | 0.241 b |
| Lactic acid (µmol/g) | 25.14 ± 6.64 | 40.30 ± 7.64 | 0.066 b |
| Cresol (µmol/g) | 0.28 ± 0.06 | 0.20 ± 0.06 | 0.182 b |
| Indole (µmol/g) | 0.28 ± 0.10 | 0.19 ± 0.04 | 0.879 b |
| Skatole (µmol/g) | 0.07 ± 0.03 | 0.04 ± 0.03 | 0.465 b |
| Oxidative stress | |||
| TAC (mM) | 2.04 ± 0.30 | 3.01 ± 0.19 | <0.001 a* |
| MDA (µM) | 2.26 ± 0.43 | 1.38 ± 0.26 | 0.114 b |
| Neuroinflammation | |||
| Quinolinic acid (ng/mL) | 26.77 ± 1.06 | 15.10 ± 0.57 | <0.001 a* |
| 5-HIAA (mg/L) | 2.91 ± 0.39 | 14.91 ± 1.26 | <0.001 a* |
| QA/5-HIAA ratio | 0.011 ± 0.001 | 0.001 ± 0.000 | <0.001 a* |
| Sample-Id | Input | Filtered | Denoised | Merged | Non-Chimeric |
|---|---|---|---|---|---|
| Baseline | |||||
| Baseline-OC01 | 57,721 | 49,835 | 49,496 | 48,744 | 47,911 |
| Baseline-OC02 | 45,004 | 40,334 | 40,123 | 39,633 | 38,867 |
| Baseline-OC03 | 44,222 | 37,735 | 37,514 | 36,937 | 36,239 |
| Baseline-OC04 | 43,130 | 37,412 | 37,151 | 36,568 | 33,009 |
| Baseline-OC05 | 51,124 | 43,104 | 42,832 | 42,179 | 41,559 |
| Baseline-OC06 | 44,351 | 35,481 | 35,286 | 34,736 | 34,558 |
| Baseline-OC07 | 57,499 | 41,437 | 41,311 | 40,900 | 40,239 |
| Baseline-OC08 | 36,116 | 33,065 | 32,952 | 32,602 | 32,236 |
| Baseline-OC09 | 50,255 | 41,731 | 41,406 | 40,808 | 40,736 |
| Baseline-OC10 | 47,199 | 43,279 | 43,081 | 42,487 | 42,154 |
| 12 weeks | |||||
| Treament-OC01 | 58,045 | 42,586 | 42,265 | 41,461 | 41,069 |
| Treatment-OC02 | 46,048 | 37,025 | 36,825 | 36,097 | 35,665 |
| Treatment-OC03 | 51,452 | 40,552 | 40,247 | 39,379 | 38,933 |
| Treatment-OC04 | 40,492 | 33,874 | 33,541 | 32,704 | 32,250 |
| Treatment-OC05 | 49,330 | 37,242 | 36969 | 36,427 | 35,999 |
| Treatment-OC06 | 47,891 | 41,815 | 41,668 | 41,180 | 40,941 |
| Treatment-OC07 | 53,532 | 46,425 | 46,182 | 45,344 | 44,892 |
| Treatment-OC08 | 48,991 | 40,714 | 40,492 | 39,917 | 39,335 |
| Treatment-OC09 | 54,958 | 46,479 | 46,287 | 45,612 | 43,170 |
| Treatment-OC10 | 49,859 | 38,559 | 38,348 | 37,689 | 37,603 |
| Taxonomy | Baseline (Week 0) | After Treatment (Week 12) | p-Value |
|---|---|---|---|
| Phylum | |||
| Actinobacteria | 14.12 ± 5.25 | 8.74 ± 1.80 | 0.721 |
| Firmicutes | 62.69 ± 5.09 | 52.27 ± 5.33 | 0.235 |
| Bacteroidetes | 21.72 ± 5.68 | 36.00 ± 4.93 | 0.059 |
| Proteobacteria | 1.47 ± 0.71 | 2.99 ± 1.15 | 0.286 |
| Genus | |||
| Collinsella | 6.15 ± 1.90 | 4.05 ± 1.00 | 0.445 |
| Bifidobacterium | 7.45 ± 4.20 | 5.13 ± 1.95 | 0.959 |
| Roseburia | 5.50 ± 2.20 | 4.40 ± 1.50 | 0.879 |
| Bacteroides | 10.39 ± 3.93 | 22.11 ± 4.23 | 0.009 * |
| Clostridium | 3.23 ± 1.08 | 0.67 ± 0.12 | 0.018 * |
| Faecalibacterium | 5.87 ± 1.33 | 4.80 ± 1.19 | 0.721 |
| Streptococcus | 4.48 ± 1.26 | 0.98 ± 0.25 | 0.017 * |
| Prevotella | 9.35 ± 5.57 | 10.32 ± 4.83 | 0.647 |
| Dorea | 3.26 ± 1.11 | 3.49 ± 1.61 | 0.508 |
| Eubacterium | 2.45 ± 1.03 | 1.57 ± 0.55 | 0.608 |
| Ruminococcus | 2.83 ± 0.48 | 2.49 ± 0.73 | 0.082 |
| Gemmiger | 1.26 ± 0.34 | 1.23 ± 0.40 | 0.610 |
| Macellibacteroides | 0.45 ± 0.16 | 1.70 ± 0.64 | 0.059 |
| Alistipes | 0.93 ± 0.30 | 2.06 ± 0.55 | 0.114 |
| Succinispira | 0.13 ± 0.06 | 1.32 ± 1.14 | 0.108 |
| Subdoligranulum | 0.28 ± 0.08 | 0.25 ± 0.11 | 0.508 |
| Barnesiella | 0.16 ± 0.09 | 0.31 ± 0.17 | 0.262 |
| Butyricicoccus | 0.28 ± 0.06 | 0.50 ± 0.18 | 0.575 |
| Weissella | 0.09 ± 0.06 | 0.12 ± 0.04 | 0.356 |
| Butyricimonas | 0.08 ± 0.03 | 0.39 ± 0.19 | 0.218 |
| Coprococcus | 0.28 ± 0.09 | 0.27 ± 0.10 | 1.000 |
| Parabacteroides | 0.04 ± 0.02 | 0.29 ± 0.14 | 0.018 * |
| Paraprevotella | 0.17 ± 0.07 | 0.38 ± 0.12 | 0.126 |
| Slackia | 0.13 ± 0.06 | 0.07 ± 0.02 | 0.356 |
| Species | |||
| Roseburia inulinivorans | 6.58 ± 2.44 | 5.42 ± 1.76 | 0.879 |
| Clostridium ruminantium | 4.43 ± 2.38 | 0.67 ± 0.22 | 0.114 |
| Streptococcus equi | 4.68 ± 1.51 | 0.97 ± 0.31 | 0.028 * |
| Dorea longicatena | 3.66 ± 1.24 | 3.90 ± 1.61 | 0.879 |
| Bacteroides plebeius | 0.96 ± 0.54 | 3.66 ± 1.61 | 0.028 * |
| Eubacterium biforme | 2.78 ± 1.10 | 1.90 ± 0.71 | 0.222 |
| Ruminococcus lactaris | 4.24 ± 0.91 | 2.90 ± 0.76 | 0.114 |
| Gemmiger formicilis | 1.57 ± 0.40 | 1.44 ± 0.45 | 0.307 |
| Macellibacteroides fermentans | 0.52 ± 0.18 | 2.04 ± 0.70 | 0.037 * |
| Bifidobacterium breve | 1.87 ± 0.82 | 2.34 ± 1.33 | 0.799 |
| Clostridium clostridioforme | 0.70 ± 0.26 | 0.37 ± 0.09 | 0.333 |
| Alistipes putredinis | 0.53 ± 0.32 | 0.37 ± 0.18 | 0.758 |
| Prevotella stercorea | 1.31 ± 0.94 | 2.65 ± 1.40 | 0.182 |
| Subdoligranulum variabile | 0.31 ± 0.10 | 0.27 ± 0.11 | 0.445 |
| Alistipes finegoldii | 0.19 ± 0.06 | 0.86 ± 0.33 | 0.047 * |
| Barnesiella intestinihominis | 0.20 ± 0.11 | 0.35 ± 0.19 | 0.262 |
| Alistipes indistinctus | 0.19 ± 0.08 | 0.40 ± 0.19 | 0.203 |
| Butyricicoccus pullicaecorum | 0.36 ± 0.09 | 0.58 ± 0.18 | 0.575 |
| Weissella hellenica | 0.14 ± 0.09 | 0.16 ± 0.07 | 0.356 |
| Clostridium methylpentosum | 0.05 ± 0.01 | 0.11 ± 0.04 | 0.151 |
| Parameters | Probiotic (n = 10) | p-Value | |
|---|---|---|---|
| Baseline | 12 Weeks | ||
| correct non-target (%) | 93.20 ± 3.44 | 96.40 ± 1.76 | 0.355 a |
| error non-target (%) | 6.80 ± 3.44 | 3.60 ± 1.76 | 0.367 b |
| correct target (%) | 93.20 ± 3.63 | 94.00 ± 2.81 | 0.770 a |
| omission error (%) | 6.80 ± 3.63 | 6.00 ± 2.81 | 0.826 b |
| response time (ms) | 501.55 ± 36.28 | 537.92 ± 34.38 | 0.244 a |
| Parameters | Electrical Activities (Mean ± SE) | Brodmann Area (BA) (x, y, z) | Lateralization |
|---|---|---|---|
| Delta wave | |||
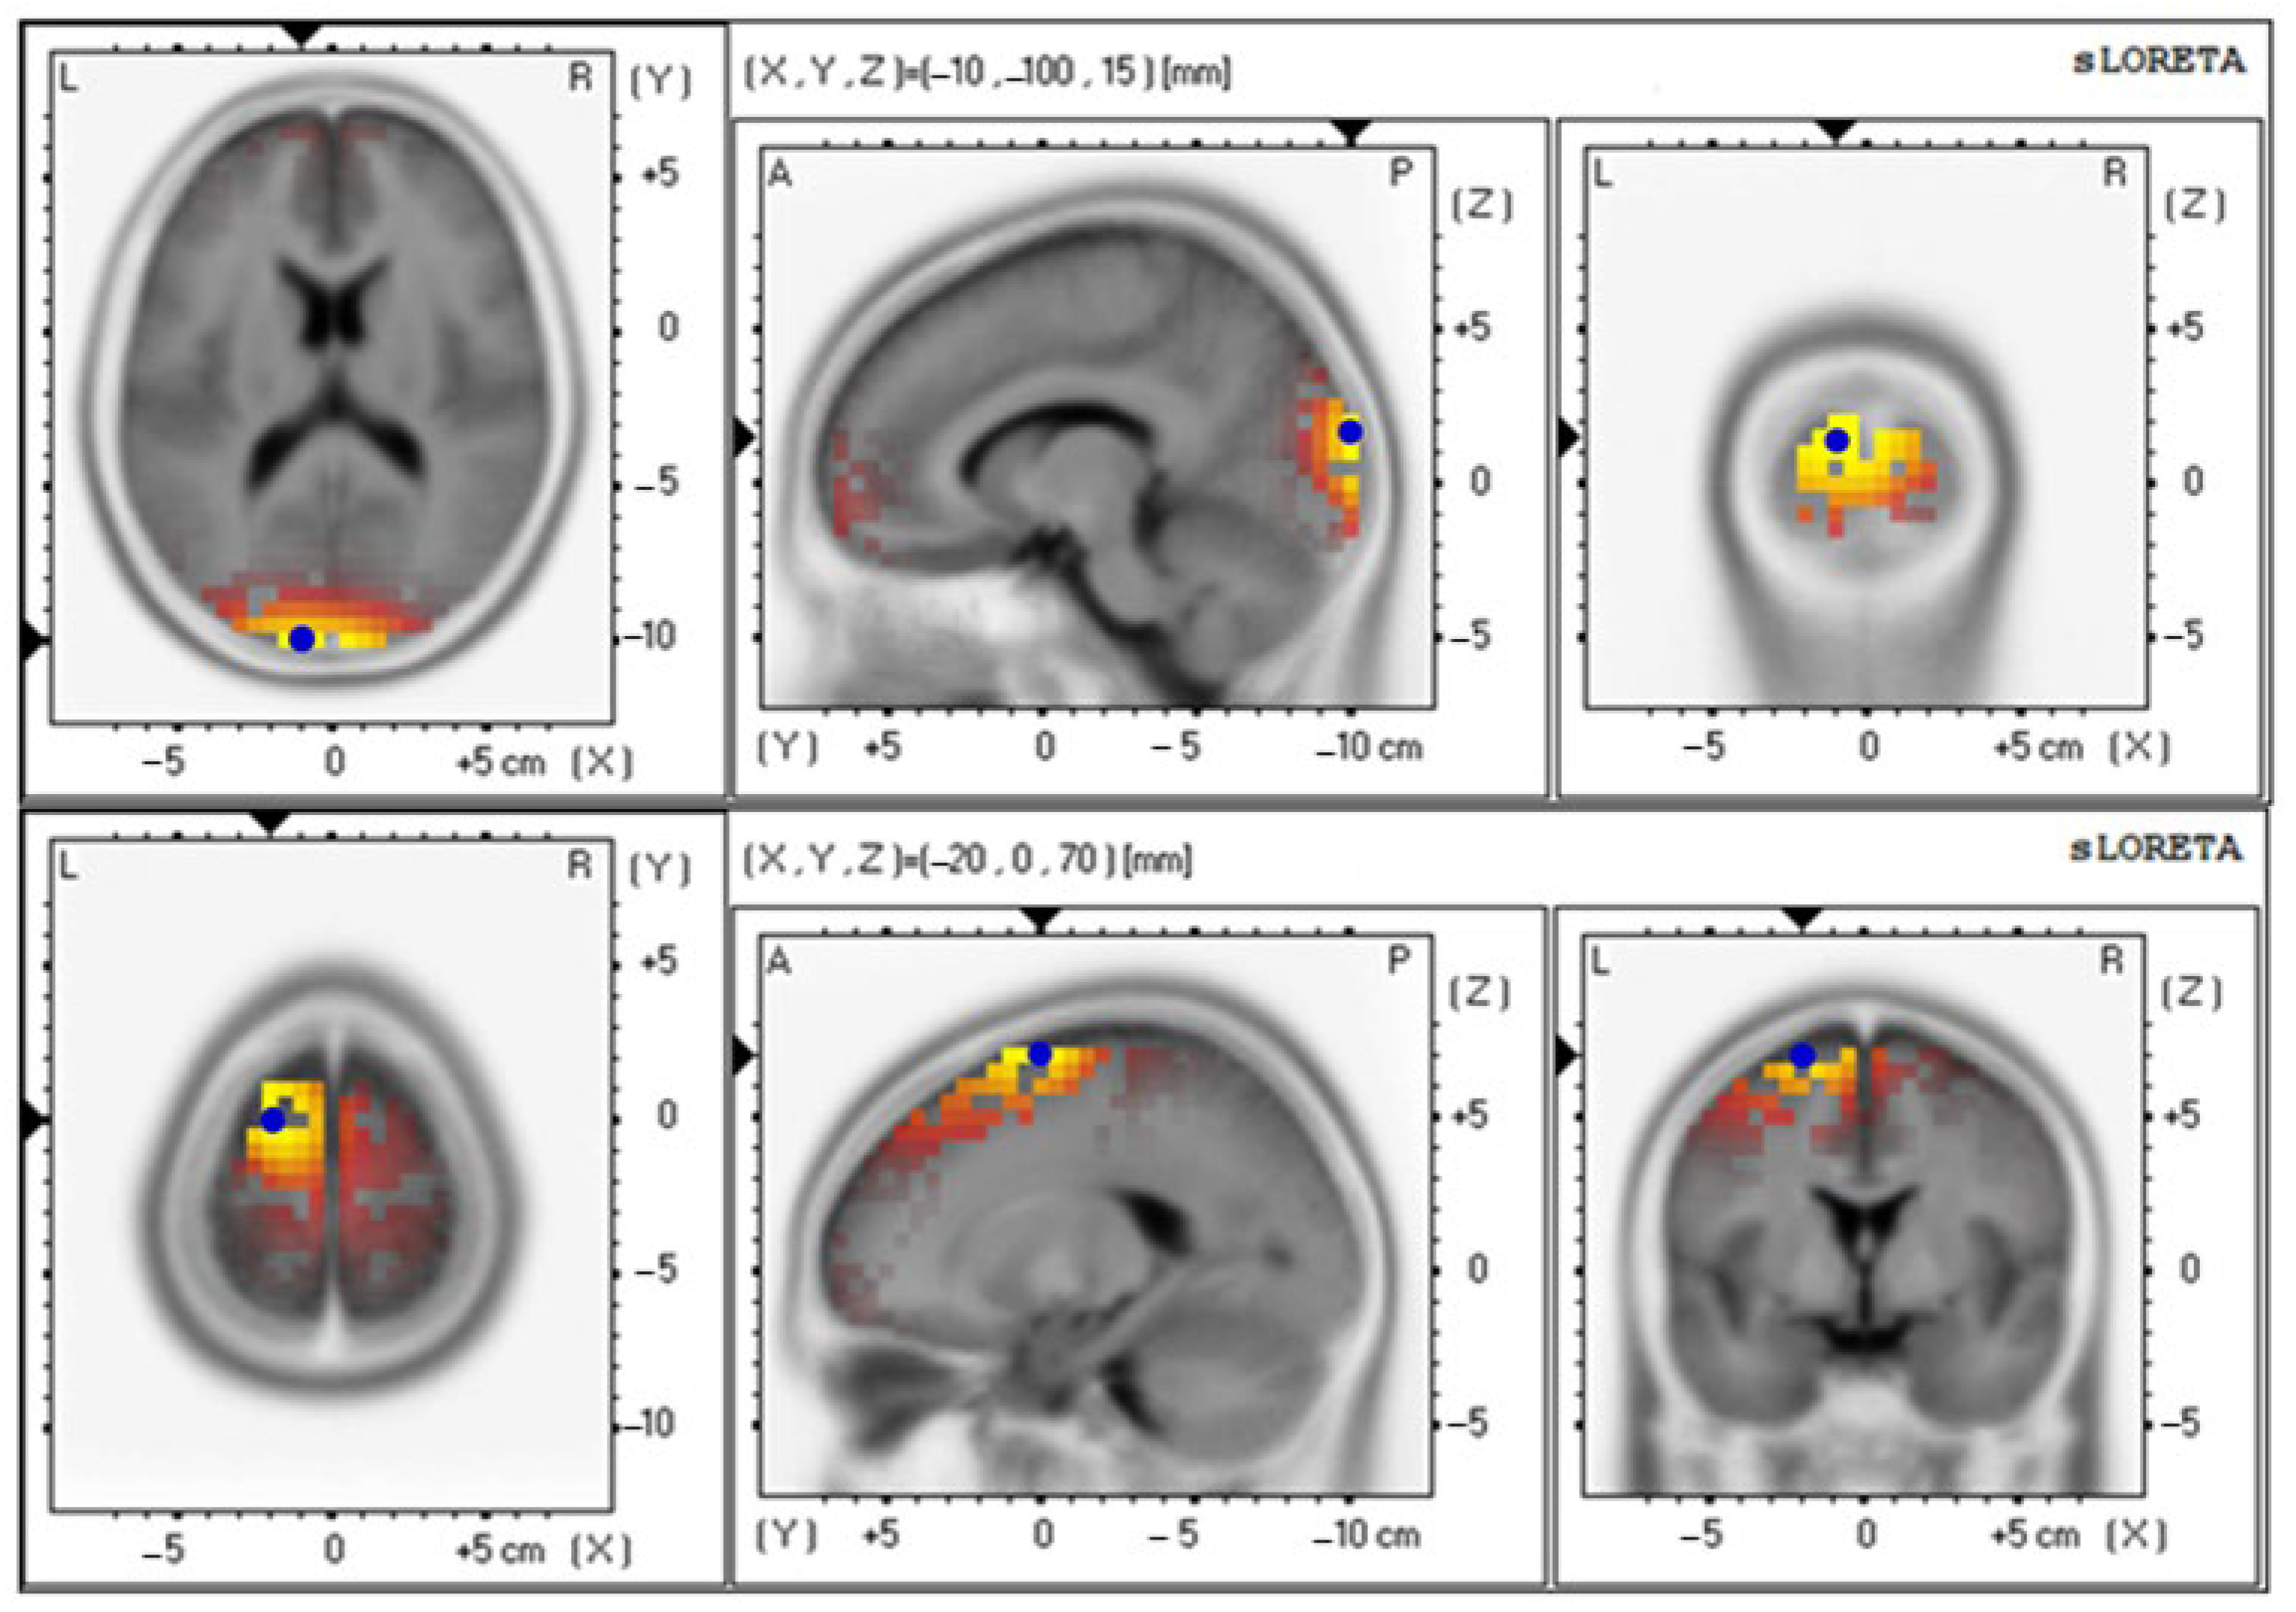
| Baseline | 4.85 ± 0.92 | 18 (−10, −100, 15) | Cuneus–Left Occipital Lobe |
| 12th week | 4.71 ± 0.87 | 6 (−20, −10, 70) | Superior Frontal Gyrus–Left Frontal Lobe |
| Theta wave | |||
| Baseline | 3.19 ± 0.65 | 18 (−10, −100, 15) | Cuneus–Left Occipital Lobe |
| 12th week | 3.91 ± 0.86 | 6 (−15, −10, 70) | Superior Frontal Gyrus–Left Frontal Lobe |
| Alpha wave | |||
| Baseline | 2.66 ± 0.70 | 18 (−10, −100, 15) | Cuneus–Left Occipital Lobe |
| 12th week | 4.05 ± 0.89 | 6 (−15, −5, 70) | Superior Frontal Gyrus–Left Frontal Lobe |
| Beta wave | |||
| Baseline | 4.42 ± 0.89 | 18 (−10, −100, 15) | Cuneus–Left Occipital Lobe |
| 12th week | 3.74 ± 0.87 | 6 (−20, 0, 70) | Superior Frontal Gyrus–Left Frontal Lobe |
| Gamma wave | |||
| Baseline | 3.69 ± 0.70 | 18 (−10, −100, 15) | Cuneus–Left Occipital Lobe |
| 12th week | 3.70 ± 0.64 | 11 (−10, 65, −10) | Superior Frontal Gyrus–Left Frontal Lobe |
Disclaimer/Publisher’s Note: The statements, opinions and data contained in all publications are solely those of the individual author(s) and contributor(s) and not of MDPI and/or the editor(s). MDPI and/or the editor(s) disclaim responsibility for any injury to people or property resulting from any ideas, methods, instructions or products referred to in the content. |
© 2023 by the authors. Licensee MDPI, Basel, Switzerland. This article is an open access article distributed under the terms and conditions of the Creative Commons Attribution (CC BY) license (https://creativecommons.org/licenses/by/4.0/).
Share and Cite
Khongtan, S.; Sivamaruthi, B.S.; Thangaleela, S.; Kesika, P.; Bharathi, M.; Sirilun, S.; Choeisoongnern, T.; Peerajan, S.; Sittiprapaporn, P.; Chaiyasut, C. The Influence of Probiotic Supplementation on the Obesity Indexes, Neuroinflammatory and Oxidative Stress Markers, Gut Microbial Diversity, and Working Memory in Obese Thai Children. Foods 2023, 12, 3890. https://doi.org/10.3390/foods12213890
Khongtan S, Sivamaruthi BS, Thangaleela S, Kesika P, Bharathi M, Sirilun S, Choeisoongnern T, Peerajan S, Sittiprapaporn P, Chaiyasut C. The Influence of Probiotic Supplementation on the Obesity Indexes, Neuroinflammatory and Oxidative Stress Markers, Gut Microbial Diversity, and Working Memory in Obese Thai Children. Foods. 2023; 12(21):3890. https://doi.org/10.3390/foods12213890
Chicago/Turabian StyleKhongtan, Suchanat, Bhagavathi Sundaram Sivamaruthi, Subramanian Thangaleela, Periyanaina Kesika, Muruganantham Bharathi, Sasithorn Sirilun, Thiwanya Choeisoongnern, Sartjin Peerajan, Phakkharawat Sittiprapaporn, and Chaiyavat Chaiyasut. 2023. "The Influence of Probiotic Supplementation on the Obesity Indexes, Neuroinflammatory and Oxidative Stress Markers, Gut Microbial Diversity, and Working Memory in Obese Thai Children" Foods 12, no. 21: 3890. https://doi.org/10.3390/foods12213890
APA StyleKhongtan, S., Sivamaruthi, B. S., Thangaleela, S., Kesika, P., Bharathi, M., Sirilun, S., Choeisoongnern, T., Peerajan, S., Sittiprapaporn, P., & Chaiyasut, C. (2023). The Influence of Probiotic Supplementation on the Obesity Indexes, Neuroinflammatory and Oxidative Stress Markers, Gut Microbial Diversity, and Working Memory in Obese Thai Children. Foods, 12(21), 3890. https://doi.org/10.3390/foods12213890