
Combined Effect of Drying Temperature and Varied Gelatin Concentration on Physicochemical and Antioxidant Properties of Ginger Oil Incorporated Chitosan Based Edible Films


 ,
,  ,
,  , , and
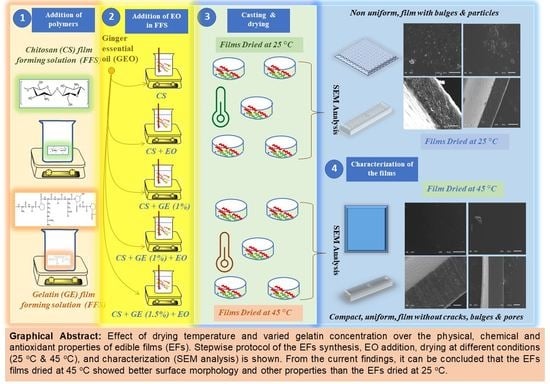
Abstract
1. Introduction
2. Materials and Methods
2.1. Materials
2.2. Preparation of CS-GE-GEO Films
2.3. Thermogravimetric (TGA) Analysis
2.4. X-ray Diffraction (XRD)
2.5. Microscope Observations
2.6. FTIR Spectra Analysis
2.7. Thickness
2.8. Mechanical Properties
2.9. Water Vapor Permeability (WVP)
2.10. Water Solubility (WS)
2.11. Moisture Content
2.12. Swelling Degree
2.13. Light Transmission
2.14. Total Phenol Content
2.15. Antioxidant Assays
2.15.1. DPPH Radical Scavenging Assay
2.15.2. ABTS Assay
2.16. Statistical Analysis
3. Results and Discussion
3.1. Visual Appearance of the EFs
3.2. Thermogravimetric Analysis
3.3. X-ray Diffraction (XRD)
3.4. Scanning Electron Microscopy
3.5. Fourier Transform Infrared Spectroscopy
3.6. Thickness of the EFs
3.7. Mechanical Properties
3.8. Water Vapor Permeability (WVP)
3.9. Water Solubility
3.10. Moisture Content
3.11. Swelling Factor
3.12. Transparency
3.13. Total Phenol Content
3.14. Antioxidant Assay
4. Conclusions
Author Contributions
Funding
Data Availability Statement
Acknowledgments
Conflicts of Interest
References
- Díaz-Montes, E.; Castro-Muñoz, R. Edible Films and Coatings as Food-Quality Preservers: An Overview. Foods 2021, 10, 249. [Google Scholar] [CrossRef] [PubMed]
- Abe, M.; Martins, J.; Sanvezzo, P.; Macedo, J.; Branciforti, M.; Halley, P.; Botaro, V.; Brienzo, M. Advantages and Disadvantages of Bioplastics Production from Starch and Lignocellulosic Components. Polymers 2021, 13, 2484. [Google Scholar] [CrossRef]
- Jridi, M.; Hajji, S.; Ayed, H.B.; Lassoued, I.; Mbarek, A.; Kammoun, M.; Souissi, N.; Nasri, M. Physical, structural, antioxidant and antimicrobial properties of gelatin–chitosan composite edible films. Int. J. Biol. Macromol. 2014, 67, 373–379. [Google Scholar] [CrossRef] [PubMed]
- Dhumal, C.V.; Sarkar, P. Composite edible films and coatings from food-grade biopolymers. J. Food Sci. Technol. 2018, 55, 4369–4383. [Google Scholar] [CrossRef] [PubMed]
- Souza, V.G.L.; Pires, J.R.A.; Rodrigues, C.; Coelhoso, I.M.; Fernando, A.L. Chitosan Composites in Packaging Industry—Current Trends and Future Challenges. Polymers 2020, 12, 417. [Google Scholar] [CrossRef]
- Kołodziejska, I.; Piotrowska, B. The water vapour permeability, mechanical properties and solubility of fish gelatin–chitosan films modified with transglutaminase or 1-ethyl-3-(3-dimethylaminopropyl) carbodiimide (EDC) and plasticized with glycerol. Food Chem. 2007, 103, 295–300. [Google Scholar] [CrossRef]
- Cai, L.; Shi, H.; Cao, A.; Jia, J. Characterization of gelatin/chitosan ploymer films integrated with docosahexaenoic acids fabricated by different methods. Sci. Rep. 2019, 9, 8375. [Google Scholar] [CrossRef]
- Sancakli, A.; Basaran, B.; Arican, F.; Polat, O. Effects of bovine gelatin viscosity on gelatin-based edible film mechanical, physical and morphological properties. SN Appl. Sci. 2021, 3, 8. [Google Scholar] [CrossRef]
- Fakhouri, F.M.; Martelli, S.M.; Caon, T.; Velasco, J.I.; Mei, L.H.I. Edible films and coatings based on starch/gelatin: Film properties and effect of coatings on quality of refrigerated Red Crimson grapes. Postharvest Biol. Technol. 2015, 109, 57–64. [Google Scholar] [CrossRef]
- Ramos, M.; Valdés, A.; Beltrán, A.; Garrigós, M.D.C. Gelatin-Based Films and Coatings for Food Packaging Applications. Coatings 2016, 6, 41. [Google Scholar] [CrossRef]
- The, D.P.; Debeaufort, F.; Voilley, A.; Luu, D. Biopolymer interactions affect the functional properties of edible films based on agar, cassava starch and arabinoxylan blends. J. Food Eng. 2009, 90, 548–558. [Google Scholar] [CrossRef]
- Rojas-Graü, M.A.; Avena-Bustillos, R.J.; Olsen, C.; Friedman, M.; Henika, P.R.; Martín-Belloso, O.; Pan, Z.; McHugh, T.H. Effects of plant essential oils and oil compounds on mechanical, barrier and antimicrobial properties of alginate–apple puree edible films. J. Food Eng. 2007, 81, 634–641. [Google Scholar] [CrossRef]
- Atarés, L.; Bonilla, J.; Chiralt, A. Characterization of sodium caseinate-based edible films incorporated with cinnamon or ginger essential oils. J. Food Eng. 2010, 100, 678–687. [Google Scholar] [CrossRef]
- Jeevahan, J.J.; Chandrasekaran, M.; Venkatesan, S.P.; Sriram, V.; Joseph, G.B.; Mageshwaran, G.; Durairaj, R.B. Scaling up difficulties and commercial aspects of edible films for food packaging: A review. Trends Food Sci. Technol. 2020, 100, 210–222. [Google Scholar] [CrossRef]
- Homez-Jara, A.; Daza, L.D.; Aguirre, D.M.; Muñoz, J.A.; Solanilla, J.F.; Váquiro, H.A. Characterization of chitosan edible films obtained with various polymer concentrations and drying temperatures. Int. J. Biol. Macromol. 2018, 113, 1233–1240. [Google Scholar] [CrossRef]
- Hanani, Z.N.; O’Mahony, J.A.; Roos, Y.H.; Oliveira, P.M.; Kerry, J. Extrusion of gelatin-based composite films: Effects of processing temperature and pH of film forming solution on mechanical and barrier properties of manufactured films. Food Packag. Shelf Life 2014, 2, 91–101. [Google Scholar] [CrossRef]
- Al-Harrasi, A.; Bhatia, S.; Al-Azri, M.S.; Ullah, S.; Najmi, A.; Albratty, M.; Meraya, A.M.; Mohan, S.; Aldawsari, M.F. Effect of Drying Temperature on Physical, Chemical, and Antioxidant Properties of Ginger Oil Loaded Gelatin-Sodium Alginate Edible Films. Membranes 2022, 12, 862. [Google Scholar] [CrossRef]
- ASTM. Standard test method for tensile properties of thin plastic sheeting. In Annual Book of ASTM Standards; ASTM: West Conshohocken, PA, USA, 1995; Volume 8, pp. 182–190. [Google Scholar]
- ASTM International. Annual Book of ASTM Standards; ASTM International: West Conshohocken, PA, USA, 2003. [Google Scholar]
- Singh, T.P.; Chatli, M.K.; Sahoo, J. Development of chitosan based edible films: Process optimization using response surface methodology. J. Food Sci. Technol. 2014, 52, 2530–2543. [Google Scholar] [CrossRef]
- Turhan, K.N.; Şahbaz, F. Water vapor permeability, tensile properties and solubility of methylcellulose-based edible films. J. Food Eng. 2004, 61, 459–466. [Google Scholar] [CrossRef]
- Basiak, E.; Galus, S.; Lenart, A. Characterisation of composite edible films based on wheat starch and whey-protein isolate. Int. J. Food Sci. Technol. 2014, 50, 372–380. [Google Scholar] [CrossRef]
- Singleton, V.L.; Rossi, J.A. Colorimetry of total phenolics with phosphomolybdic-phosphotungstic acid reagents. Am. J. Enol. Vitic. 1965, 16, 144–158. [Google Scholar]
- Gómez-Estaca, J.; Bravo, L.; Gómez-Guillén, M.; Alemán, A.; Montero, P. Antioxidant properties of tuna-skin and bovine-hide gelatin films induced by the addition of oregano and rosemary extracts. Food Chem. 2009, 112, 18–25. [Google Scholar] [CrossRef]
- Ruiz-Navajas, Y.; Viuda-Martos, M.; Sendra, E.; Perez-Alvarez, J.; Fernández-López, J. In vitro antibacterial and antioxidant properties of chitosan edible films incorporated with Thymus moroderi or Thymus piperella essential oils. Food Control. 2013, 30, 386–392. [Google Scholar] [CrossRef]
- Re, R.; Pellegrini, N.; Proteggente, A.; Pannala, A.; Yang, M.; Rice-Evans, C. Antioxidant activity applying an improved ABTS radical cation decolorization assay. Free Radic. Biol. Med. 1999, 26, 1231–1237. [Google Scholar] [CrossRef] [PubMed]
- Zhang, Y.; Zhang, H.; Wang, F.; Wang, L.-X. Preparation and Properties of Ginger Essential Oil β-Cyclodextrin/Chitosan Inclusion Complexes. Coatings 2018, 8, 305. [Google Scholar] [CrossRef]
- Lima, M.D.M.; Carneiro, L.C.; Bianchini, D.; Dias, A.R.G.; Zavareze, E.D.R.; Prentice, C.; Moreira, A.D.S. Structural, Thermal, Physical, Mechanical, and Barrier Properties of Chitosan Films with the Addition of Xanthan Gum. J. Food Sci. 2017, 82, 698–705. [Google Scholar] [CrossRef]
- Kerch, G.; Korkhov, V. Effect of storage time and temperature on structure, mechanical and barrier properties of chitosan-based films. Eur. Food Res. Technol. 2010, 232, 17–22. [Google Scholar] [CrossRef]
- Wang, S.; Marcone, M.F.; Barbut, S.; Lim, L.-T. Fortification of dietary biopolymers-based packaging material with bioactive plant extracts. Food Res. Int. 2012, 49, 80–91. [Google Scholar] [CrossRef]
- Nagahama, H.; Maeda, H.; Kashiki, T.; Jayakumar, R.; Furuike, T.; Tamura, H. Preparation and characterization of novel chitosan/gelatin membranes using chitosan hydrogel. Carbohydr. Polym. 2009, 76, 255–260. [Google Scholar] [CrossRef]
- Olad, A.; Azhar, F.F. The synergetic effect of bioactive ceramic and nanoclay on the properties of chitosan–gelatin/nanohydroxyapatite–montmorillonite scaffold for bone tissue engineering. Ceram. Int. 2014, 40, 10061–10072. [Google Scholar] [CrossRef]
- Liu, F.; Chang, W.; Chen, M.; Xu, F.; Ma, J.; Zhong, F. Tailoring physicochemical properties of chitosan films and their protective effects on meat by varying drying temperature. Carbohydr. Polym. 2019, 212, 150–159. [Google Scholar] [CrossRef] [PubMed]
- Roy, S.; Rhim, J.-W. Fabrication of bioactive binary composite film based on gelatin/chitosan incorporated with cinnamon essential oil and rutin. Colloids Surf. B Biointerfaces 2021, 204, 111830. [Google Scholar] [CrossRef] [PubMed]
- Xu, D.; Chen, T.; Liu, Y. The physical properties, antioxidant and antimicrobial activity of chitosan–gelatin edible films incorporated with the extract from hop plant. Polym. Bull. 2021, 78, 3607–3624. [Google Scholar] [CrossRef]
- Bagde, P.; Nadanathangam, V. Mechanical, antibacterial and biodegradable properties of starch film containing bacteriocin immobilized crystalline nanocellulose. Carbohydr. Polym. 2019, 222, 115021. [Google Scholar] [CrossRef]
- Nandiyanto, A.B.D.; Oktiani, R.; Ragadhita, R. How to Read and Interpret FTIR Spectroscope of Organic Material. Indones. J. Sci. Technol. 2019, 4, 97–118. [Google Scholar] [CrossRef]
- Roy, S.; Rhim, J.-W. Preparation of Gelatin/Carrageenan-Based Color-Indicator Film Integrated with Shikonin and Propolis for Smart Food Packaging Applications. ACS Appl. Bio Mater. 2020, 4, 770–779. [Google Scholar] [CrossRef]
- Roy, S.; Van Hai, L.; Kim, H.C.; Zhai, L.; Kim, J. Preparation and characterization of synthetic melanin-like nanoparticles reinforced chitosan nanocomposite films. Carbohydr. Polym. 2019, 231, 115729. [Google Scholar] [CrossRef]
- Liang, J.; Yan, H.; Zhang, J.; Dai, W.; Gao, X.; Zhou, Y.; Wan, X.; Puligundla, P. Preparation and characterization of antioxidant edible chitosan films incorporated with epigallocatechin gallate nanocapsules. Carbohydr. Polym. 2017, 171, 300–306. [Google Scholar] [CrossRef]
- Al-Harrasi, A.; Bhtaia, S.; Al-Azri, M.S.; Makeen, H.A.; Albratty, M.; Alhazmi, H.A.; Mohan, S.; Sharma, A.; Behl, T. Development and characterization of chitosan and porphyran based composite edible films containing ginger essential oil. Polymers 2022, 14, 1782. [Google Scholar] [CrossRef]
- Ahmad, M.; Benjakul, S.; Prodpran, T.; Agustini, T.W. Physico-mechanical and antimicrobial properties of gelatin film from the skin of unicorn leatherjacket incorporated with essential oils. Food Hydrocoll. 2012, 28, 189–199. [Google Scholar] [CrossRef]
- Said, N.S.; Sarbon, N.M. Physical and Mechanical Characteristics of Gelatin-Based Films as a Potential Food Packaging Material: A Review. Membranes 2022, 12, 442. [Google Scholar] [CrossRef] [PubMed]
- Bonilla, J.; Sobral, P.J. Investigation of the physicochemical, antimicrobial and antioxidant properties of gelatin-chitosan edible film mixed with plant ethanolic extracts. Food Biosci. 2016, 16, 17–25. [Google Scholar] [CrossRef]
- Sarbon, N.M.; Badii, F.; Howell, N.K. Preparation and characterisation of chicken skin gelatin as an alternative to mammalian gelatin. Food Hydrocoll. 2013, 30, 143–151. [Google Scholar] [CrossRef]
- Singh, G.P.; Bangar, S.P.; Yang, T.; Trif, M.; Kumar, V.; Kumar, D. Effect on the Properties of Edible Starch-Based Films by the Incorporation of Additives: A Review. Polymers 2022, 14, 1987. [Google Scholar] [CrossRef]
- Du, W.-X.; Avena-Bustillos, R.J.; Hua, S.S.T.; McHugh, T.H. Antimicrobial volatile essential oils in edible films for food safety. Sci. Against Microb. Pathog. Commun. Curr. Res. Technol. Adv. 2011, 2, 1124–1134. [Google Scholar]
- Yilmaz, H.; Gultekin Subasi, B.; ÇELEBİOĞLU, H.; Ozdal, T.; Çapanoğlu Güven, E. Chemistry of Protein-Phenolic Interactions Toward the Microbiota and Microbial Infections. Front. Nutr. 2022, 9, 160. [Google Scholar] [CrossRef] [PubMed]
- Ghoshal, G.; Chopra, H. Impact of apricot oil incorporation in tamarind starch/gelatin based edible coating on shelf life of grape fruit. J. Food Meas. Charact. 2022, 16, 1274–1290. [Google Scholar] [CrossRef]
- Siracusa, V.; Rocculi, P.; Romani, S.; Rosa, M.D. Biodegradable polymers for food packaging: A review. Trends Food Sci. Technol. 2008, 19, 634–643. [Google Scholar] [CrossRef]
- Morillon, V.; Debeaufort, F.; Blond, G.; Capelle, M.; Voilley, A. Factors Affecting the Moisture Permeability of Lipid-Based Edible Films: A Review. Crit. Rev. Food Sci. Nutr. 2002, 42, 67–89. [Google Scholar] [CrossRef]
- Ollé Resa, C.P.; Jagus, R.J.; Gerschenson, L.N. Do fillers improve the physicochemical properties of antimicrobial tapioca starch edible films? J. Food Saf. 2021, 41, e12880. [Google Scholar] [CrossRef]
- De’Nobili, M.D.; Bernhardt, D.C.; Basanta, M.F.; Rojas, A.M. Sunflower (Helianthus annuus L.) Seed Hull Waste: Composition, Antioxidant Activity, and Filler Performance in Pectin-Based Film Composites. Front. Nutr. 2021, 8, 1–14. [Google Scholar] [CrossRef] [PubMed]
- Kavas, N.; Kavas, G.; Saygili, D. Use of ginger essential oil-fortified edible coatings in Kashar cheese and its effects onEscherichia coliO157:H7 andStaphylococcus aureus. CyTA J. Food 2016, 14, 317–323. [Google Scholar] [CrossRef]
- Rui, L.; Xie, M.; Hu, B.; Zhou, L.; Yin, D.; Zeng, X. A comparative study on chitosan/gelatin composite films with conjugated or incorporated gallic acid. Carbohydr. Polym. 2017, 173, 473–481. [Google Scholar] [CrossRef] [PubMed]
- Perez-Gago, M.B.; Krochta, J.M. Drying Temperature Effect on Water Vapor Permeability and Mechanical Properties of Whey Protein−Lipid Emulsion Films. J. Agric. Food Chem. 2000, 48, 2687–2692. [Google Scholar] [CrossRef] [PubMed]
- Cao, N.; Fu, Y.; He, J. Preparation and physical properties of soy protein isolate and gelatin composite films. Food Hydrocoll. 2007, 21, 1153–1162. [Google Scholar] [CrossRef]
- McHugh, T.H.; Avena-Bustillos, R.; Krochta, J. Hydrophilic Edible Films: Modified Procedure for Water Vapor Permeability and Explanation of Thickness Effects. J. Food Sci. 1993, 58, 899–903. [Google Scholar] [CrossRef]
- Kim, K.M.; Son, J.H.; Kim, S.-K.; Weller, C.L.; Hanna, M.A. Properties of Chitosan Films as a Function of pH and Solvent Type. J. Food Sci. 2006, 71, E119–E124. [Google Scholar] [CrossRef]
- Hanani, Z.N.; Roos, Y.; Kerry, J. Use and application of gelatin as potential biodegradable packaging materials for food products. Int. J. Biol. Macromol. 2014, 71, 94–102. [Google Scholar] [CrossRef]
- Galus, S.; Kadzińska, J. Moisture Sensitivity, Optical, Mechanical and Structural Properties of Whey Protein-Based Edible Films Incorporated with Rapeseed Oil. Food Technol. Biotechnol. 2016, 54, 78–89. [Google Scholar] [CrossRef]
- Koc, F.E.; Altıncekic, T.G. Investigation of gelatin/chitosan as potential biodegradable polymer films on swelling behavior and methylene blue release kinetics. Polym. Bull. 2020, 78, 3383–3398. [Google Scholar] [CrossRef]
- Šuput, D.; Lazić, V.; Pezo, L.; Markov, S.; Vaštag, Ž.; Popović, L.; Radulović, A.; Ostojic, S.; Zlatanovic, S.; Popović, S. Characterization of Starch Edible Films with Different Essential Oils Addition. Pol. J. Food Nutr. Sci. 2016, 66, 277–285. [Google Scholar] [CrossRef]
- Sánchez-González, L.; Vargas, M.; González-Martínez, C.; Chiralt, A.; Cháfer, M. Characterization of edible films based on hydroxypropylmethylcellulose and tea tree essential oil. Food Hydrocoll. 2009, 23, 2102–2109. [Google Scholar] [CrossRef]
- Simona, J.; Dani, D.; Petr, S.; Marcela, N.; Jakub, T.; Bohuslava, T. Edible Films from Carrageenan/Orange Essential Oil/Trehalose—Structure, Optical Properties, and Antimicrobial Activity. Polymers 2021, 13, 332. [Google Scholar] [CrossRef]
- Hermanto, S.; Fatimah, W. Differentiation of bovine and porcine gelatin based on spectroscopic and electrophoretic analysis. J. Food Pharm. Sci. 2013, 1, 68–73. [Google Scholar]
- Moradi, M.; Tajik, H.; Rohani, S.M.R.; Oromiehie, A.R.; Malekinejad, H.; Aliakbarlu, J.; Hadian, M. Characterization of antioxidant chitosan film incorporated with Zataria multiflora Boiss essential oil and grape seed extract. LWT Food Sci. Technol. 2012, 46, 477–484. [Google Scholar] [CrossRef]
- Madrau, M.A.; Piscopo, A.; Sanguinetti, A.M.; Del Caro, A.; Poiana, M.; Romeo, F.V.; Piga, A. Effect of drying temperature on polyphenolic content and antioxidant activity of apricots. Eur. Food Res. Technol. 2008, 228, 441–448. [Google Scholar] [CrossRef]
- Pawar, N.; Pai, S.; Nimbalkar, M.; Dixit, G. RP-HPLC analysis of phenolic antioxidant compound 6-gingerol from different ginger cultivars. Food Chem. 2011, 126, 1330–1336. [Google Scholar] [CrossRef]
- Ao, J.; Li, B. Amino acid composition and antioxidant activities of hydrolysates and peptide fractions from porcine collagen. Food Sci. Technol. Int. 2012, 18, 425–434. [Google Scholar] [CrossRef]


| Sample Codes | Films Composition | Drying Temperature |
|---|---|---|
| FL1 | CS (1%) | 25 °C |
| FL2 | CS (1%) + GEO (1.5%) | |
| FL3 | CS (1%) + GE (1%) | |
| FL4 | CS (1%) + GE (1%) + GEO (1.5%) | |
| FL5 | CS (1%) + GE (1.5%) + GEO (1.5%) | |
| FL6 | CS (1%) | 45 °C |
| FL7 | CS (1%) + GEO (1.5%) | |
| FL8 | CS (1%) + GE (1%) | |
| FL9 | CS (1%) + GE (1%) + GEO (1.5%) | |
| FL10 | CS (1%) + GE (1.5%) + GEO (1.5%) |
| Sample Codes | Components | Drying Temperature | Visual Attributes |
|---|---|---|---|
| FL1 | CS | Films dried at 25 °C | Less transparent than FL6, inflexible, fragile, non-sticky, difficult to peel, brittle, stiff |
| FL2 | CS-GEO | Same characteristics as FL1 except slight yellowness in appearance | |
| FL3 | CS-GE | Less transparent than FL8 and FL1, sticky, shrinkage, difficult to peel and handle | |
| FL4 | CS-GE(1%)-GEO | Showed same characteristics as FL3 | |
| FL5 | CS-GE(1.5%)-GEO | Poor transparency, cracks, pores, brittle, fragile and difficult to peel out, slightly adhesive | |
| FL6 | CS | Films dried at 45 °C | More transparent and flexible than FL1, less fragile, brittle, and stiff, easy to peel and non-sticky |
| FL7 | CS-GEO | Same characteristics as FL6 except slight yellowness in appearance | |
| FL8 | CS-GE | More transparent than FL3, however, transparency was less than FL6 and less sticky, brittle and fragile, more flexible than FL3, easy to peel and handle | |
| FL9 | CS-GE(1%)-GEO | More transparent than FL4, non-brittle, non-fragile, flexible, easy to peel, less sticky, showed no shrinkage from edge | |
| FL10 | CS-GE(1.5%)-GEO | More transparent than FL5, no cracks, pores, easy to peel out, non-sticky |
| Formulations | Thickness (μm) | TS (MPa) | EAB (%) | Ym (MPa) | WVP (×10−12 g·cm/cm2·s·Pa) | WS (%) | MC (%) | SD (%) | Transparency (%) |
|---|---|---|---|---|---|---|---|---|---|
| FL1 | 56.12 ± 1.1 b | 42.11 ± 1.33 c | 21.22 ± 5.12 f | 82.21 ± 5.11 a | 4.73 ±0.05 a | 38.26± 5.17 b | 40.21 ± 3.05 a | 89.21 ± 6.03 d | 43.21 ± 3.17 c |
| FL2 | 58.11 ± 2.1 b | 40.77 ± 2.41 c | 28.34 ± 3.17 e | 73.11 ± 3.10 b | 3.56 ± 0.02 b | 26.24 ± 5.22 d | 35.11 ± 2.11 b | 121.17 ± 4.05 c | 17.11 ± 1.01 f |
| FL3 | 55.22 ± 1.5 b | 44.14 ± 2.32 c | 29.11 ± 1.20 e | 67.55 ± 4.16 c | 3.82 ± 0.03 b | 31.26± 3.15 c | 41.55 ± 3.08 a | 117.37 ± 7.13 c | 26.55 ± 2.02 d |
| FL4 | 65.11 ± 1.2 a | 42.11 ± 1.23 c | 47.11 ± 2.10 c | 35.89 ± 6.10 e | 3.14 ± 0.01 c | 26.58 ± 2.10 d | 28.89. ± 1.01 c | 151.32 ± 2.55 b | 16.89. ± 1.01 f |
| FL5 | 68.77 ± 1.6 a | 43.38 ± 1.88 c | 51.24 ± 4.11 c | 33.47 ± 2.20 e | 3.03 ± 0.04 c | 23.26± 1.19 d | 30.47 ± 1.22 c | 177.11 ± 8.11 a | 18.47 ± 1.07 f |
| FL6 | 41.23 ± 2.4 d | 66.24 ± 3.17 a | 24.26 ± 3.17 e | 77.22 ± 6.22 b | 4.57 ± 0.04 a | 46.22 ± 5.21 a | 30.22 ± 3.18 c | 67.16 ± 2.01 g | 64.22 ± 2.21 a |
| FL7 | 47.77 ± 1.4 d | 54.21 ± 1.34 b | 44.24 ± 2.10 d | 61.47 ± 3.24 c | 3.49 ± 0.02 b | 32.34 ± 8.23 c | 25.87 ± 2.14 d | 82.11 ± 7.18 e | 43.47 ± 4.17 c |
| FL8 | 42.23 ± 1.3 d | 68.87 ± 4.01 a | 61.26 ± 3.01 b | 48.22 ± 4.12 d | 1.21 ± 0.02 d | 43.11 ± 6.11 a | 29.22 ± 1.18 c | 75.16 ± 4.08 f | 51.22 ± 2.05 b |
| FL9 | 47.77 ± 2.1 c | 55.11 ± 5.36 b | 82.24 ± 6.1 a | 32.47 ± 5.11 e | 1.13 ± 0.02 d | 27.11 ± 3.24 d | 24.47 ± 2.10 d | 91.11 ± 3.01 d | 29.47 ± 1.12 d |
| FL10 | 51.11 ± 1.5 c | 58.32 ± 3.48 b | 87.26 ± 3.12 a | 25.22 ± 1.11 f | 1.11 ± 0.05 d | 24.14 ± 2.12 d | 23.22 ± 1.05 d | 128.16 ± 5.22 c | 20.22 ± 1.05 e |
Disclaimer/Publisher’s Note: The statements, opinions and data contained in all publications are solely those of the individual author(s) and contributor(s) and not of MDPI and/or the editor(s). MDPI and/or the editor(s) disclaim responsibility for any injury to people or property resulting from any ideas, methods, instructions or products referred to in the content. |
© 2023 by the authors. Licensee MDPI, Basel, Switzerland. This article is an open access article distributed under the terms and conditions of the Creative Commons Attribution (CC BY) license (https://creativecommons.org/licenses/by/4.0/).
Share and Cite
Bhatia, S.; Al-Harrasi, A.; Ullah, S.; Al-Azri, M.S.; Bekhit, A.E.-D.A.; Karam, L.; Albratty, M.; Aldawsari, M.F.; Anwer, M.K. Combined Effect of Drying Temperature and Varied Gelatin Concentration on Physicochemical and Antioxidant Properties of Ginger Oil Incorporated Chitosan Based Edible Films. Foods 2023, 12, 364. https://doi.org/10.3390/foods12020364
Bhatia S, Al-Harrasi A, Ullah S, Al-Azri MS, Bekhit AE-DA, Karam L, Albratty M, Aldawsari MF, Anwer MK. Combined Effect of Drying Temperature and Varied Gelatin Concentration on Physicochemical and Antioxidant Properties of Ginger Oil Incorporated Chitosan Based Edible Films. Foods. 2023; 12(2):364. https://doi.org/10.3390/foods12020364
Chicago/Turabian StyleBhatia, Saurabh, Ahmed Al-Harrasi, Sana Ullah, Mohammed Said Al-Azri, Alaa El-Din Ahmed Bekhit, Layal Karam, Mohammed Albratty, Mohammed F. Aldawsari, and Md. Khalid Anwer. 2023. "Combined Effect of Drying Temperature and Varied Gelatin Concentration on Physicochemical and Antioxidant Properties of Ginger Oil Incorporated Chitosan Based Edible Films" Foods 12, no. 2: 364. https://doi.org/10.3390/foods12020364
APA StyleBhatia, S., Al-Harrasi, A., Ullah, S., Al-Azri, M. S., Bekhit, A. E.-D. A., Karam, L., Albratty, M., Aldawsari, M. F., & Anwer, M. K. (2023). Combined Effect of Drying Temperature and Varied Gelatin Concentration on Physicochemical and Antioxidant Properties of Ginger Oil Incorporated Chitosan Based Edible Films. Foods, 12(2), 364. https://doi.org/10.3390/foods12020364