

Analysis of Endocrine Disrupting Nonylphenols in Foods by Gas Chromatography-Mass Spectrometry


Abstract
1. Introduction
2. Materials and Methods
2.1. Chemicals and Reagents
2.2. Sample Selection and Preparation
2.3. Food Matrix Types
2.4. Preparation of Standards
2.5. Analysis Methods for Each Matrix
2.6. Evaluation of Procedural Blanks
2.7. Instrument Analysis
2.8. Validation Method
2.9. Identification and Quantification of Branched NPs
2.10. Statistical Analysis
3. Results and Discussion
3.1. Method Validation
3.2. Procedural Blanks
3.3. NP Monitoring in Diverse Food Samples
4. Conclusions
Supplementary Materials
Author Contributions
Funding
Institutional Review Board Statement
Informed Consent Statement
Data Availability Statement
Conflicts of Interest
References
- Günther, K.; Räcker, T.; Böhme, R. An Isomer-Specific Approach to Endocrine-Disrupting Nonylphenol in Infant Food. J. Agri. Food Chem. 2017, 65, 1247–1254. [Google Scholar] [CrossRef]
- Lu, J.; Wu, J.; Stoffella, P.J.; Wilson, P.C. Analysis of Bisphenol A, Nonylphenol, and Natural Estrogens in Vegetables and Fruits Using Gas Chromatography–Tandem Mass Spectrometry. J. Agri. Food Chem. 2013, 61, 84–89. [Google Scholar] [CrossRef]
- Grelska, A.; Noszczyńska, M. White rot fungi can be a promising tool for removal of bisphenol A, bisphenol S, and nonylphenol from wastewater. Environ. Sci. Pollut. Res. 2020, 27, 39958–39976. [Google Scholar] [CrossRef] [PubMed]
- Raecker, T.; Thiele, B.; Boehme, R.M.; Guenther, K. Endocrine disrupting nonyl- and octylphenol in infant food in Germany: Considerable daily intake of nonylphenol for babies. Chemosphere 2011, 82, 1533–1540. [Google Scholar] [CrossRef] [PubMed]
- Ringbeck, B.; Bury, D.; Hayen, H.; Weiss, T.; Brüning, T.; Koch, H.M. Determination of specific urinary nonylphenol metabolites by online-SPE-LC-MS/MS as novel human exposure biomarkers. J. Chromatogr. B 2021, 1177, 122794. [Google Scholar] [CrossRef] [PubMed]
- Shan, J.; Jiang, B.; Yu, B.; Li, C.; Sun, Y.; Guo, H.; Wu, J.; Klumpp, E.; Schäffer, A.; Ji, R. Isomer-specific degradation of branched and linear 4-nonylphenol isomers in an oxic soil. Environ. Sci. Technol. 2011, 45, 8283–8289. [Google Scholar] [CrossRef]
- She, Y.; Wang, J.; Zheng, Y.; Cao, W.; Wang, R.; Dong, F.; Liu, X.; Qian, M.; Zhang, H.; Wu, L. Determination of nonylphenol ethoxylate metabolites in vegetables and crops by high performance liquid chromatography–tandem mass spectrometry. Food Chem. 2012, 132, 502–507. [Google Scholar] [CrossRef]
- Chen, G.; Ding, W.; Ku, H.; Chao, H.; Chen, H.; Huang, M.; Wang, S. Alkylphenols in human milk and their relations to dietary habits in central Taiwan. Food Chem. Toxicol. 2010, 48, 1939–1944. [Google Scholar] [CrossRef] [PubMed]
- Vargas-Berrones, K.; Bernal-Jácome, L.; de León-Martínez, L.D.; Flores-Ramírez, R. Emerging pollutants (EPs) in Latin América: A critical review of under-studied EPs, case of study-Nonylphenol. Sci. Total Environ. 2020, 726, 138493. [Google Scholar] [CrossRef]
- Chung, S.; Ding, W. Isotope-dilution gas chromatography-mass spectrometry coupled with injection-port butylation for the determination of 4-t-octylphenol, 4-nonylphenols and bisphenol A in human urine. J. Pharm. Biomed. Anal. 2018, 149, 572–576. [Google Scholar] [CrossRef]
- Salgueiro-González, N.; Castiglioni, S.; Zuccato, E.; Turnes-Carou, I.; López-Mahía, P.; Muniategui-Lorenzo, S. Recent advances in analytical methods for the determination of 4-alkylphenols and bisphenol A in solid environmental matrices: A critical review. Anal. Chim. Acta 2018, 1024, 39–51. [Google Scholar] [CrossRef] [PubMed]
- Li, C.; Jin, F.; Snyder, S.A. Recent advancements and future trends in analysis of nonylphenol ethoxylates and their degradation product nonylphenol in food and environment. TrAC Trends Anal. Chem. 2018, 107, 78–90. [Google Scholar] [CrossRef]
- Wu, P.; Zhang, L.; Yang, D.; Zhang, J.; Hu, Z.; Wang, L.; Ma, B. Isotope dilution gas chromatography with mass spectrometry for the analysis of 4-octyl phenol, 4-nonylphenol, and bisphenol A in vegetable oils. J. Sep. Sci. 2016, 39, 904–909. [Google Scholar] [CrossRef]
- Chokwe, T.B.; Okonkwo, J.O.; Sibali, L.L. Distribution, exposure pathways, sources and toxicity of nonylphenol and nonylphenol ethoxylates in the environment. Water SA 2017, 43, 529–542. [Google Scholar] [CrossRef]
- Lu, Z.; Gan, J. Analysis, toxicity, occurrence and biodegradation of nonylphenol isomers: A review. Environ. Int. 2014, 73, 334–345. [Google Scholar] [CrossRef]
- Eganhouse, R.P.; Pontolillo, J.; Gaines, R.B.; Frysinger, G.S.; Gabriel, F.L.; Kohler, H.E.; Giger, W.; Barber, L.B. Isomer-specific determination of 4-nonylphenols using comprehensive two-dimensional gas chromatography/time-of-flight mass spectrometry. Environ. Sci. Technol. 2009, 43, 9306–9313. [Google Scholar] [CrossRef]
- Li, W.; Cohen, L.H. Quantitation of endogenous analytes in biofluid without a true blank matrix. Anal. Chem. 2003, 75, 5854–5859. [Google Scholar] [CrossRef] [PubMed]
- Ruczyńska, W.; Szlinder-Richert, J.; Nermer, T. The occurrence and distribution of nonylphenols and nonylphenol ethoxylates in different species of fish. Environ. Sci. Process. Impacts 2020, 22, 1057–1070. [Google Scholar] [CrossRef]
- Tavazzi, S.; Benfenati, E.; Barcelo, D. Accelerated solvent extraction then liquid chromatography coupled with mass spectrometry for determination of 4-t-octylphenol, 4-nonylphenols, and bisphenol A in fish liver. Chromatographia 2002, 56, 463–467. [Google Scholar] [CrossRef]
- Lee, C.; Jiang, L.; Kuo, Y.; Chen, C.; Hsieh, C.; Hung, C.; Tien, C. Characteristics of nonylphenol and bisphenol A accumulation by fish and implications for ecological and human health. Sci. Total Environ. 2015, 502, 417–425. [Google Scholar] [CrossRef]
- Lye, C.M.; Bentley, M.G.; Galloway, T. Effects of 4-nonylphenol on the endocrine system of the shore crab, Carcinus maenas. Environ. Toxicol. 2008, 23, 309–318. [Google Scholar] [CrossRef]
- Xu, E.G.; Morton, B.; Lee, J.H.; Leung, K.M. Environmental fate and ecological risks of nonylphenols and bisphenol A in the Cape D’Aguilar Marine Reserve, Hong Kong. Mar. Pollut. Bull. 2015, 91, 128–138. [Google Scholar] [CrossRef] [PubMed]
- Yang, C.; Zhao, J.; Wang, J.; Yu, H.; Piao, X.; Li, D. Water-based gas purge microsyringe extraction coupled with liquid chromatography for determination of alkylphenols from sea food Laminaria japonica Aresh. J. Chromatogr. B 2013, 1300, 38–42. [Google Scholar] [CrossRef]
- Datta, S.; Loyo-Rosales, J.E.; Rice, C.P. A simple method for the determination of trace levels of alkylphenolic compounds in fish tissue using pressurized fluid extraction, solid phase cleanup, and high-performance liquid chromatography fluorescence detection. J. Agri. Food Chem. 2002, 50, 1350–1354. [Google Scholar] [CrossRef] [PubMed]
- Shang, D.Y.; Macdonald, R.W.; Ikonomou, M.G. Persistence of nonylphenol ethoxylate surfactants and their primary degradation products in sediments from near a municipal outfall in the Strait of Georgia, British Columbia, Canada. Environ. Sci. Technol. 1999, 33, 1366–1372. [Google Scholar] [CrossRef]
- Bodziach, K.; Staniszewska, M.; Falkowska, L.; Nehring, I.; Ożarowska, A.; Zaniewicz, G.; Meissner, W. Distribution paths of endocrine disrupting phenolic compounds in waterbirds (Mergus merganser, Alca torda, Clangula hyemalis) from the Southern Baltic. Sci. Total Environ. 2021, 793, 148556. [Google Scholar] [CrossRef]
- Bina, B.; Mohammadi, F.; Amin, M.M.; Pourzamani, H.R.; Yavari, Z. Determination of 4-nonylphenol and 4-tert-octylphenol compounds in various types of wastewater and their removal rates in different treatment processes in nine wastewater treatment plants of Iran. Chin. J. Chem. Eng. 2018, 26, 183–190. [Google Scholar] [CrossRef]
- Guenther, K.; Heinke, V.; Thiele, B.; Kleist, E.; Prast, H.; Raecker, T. Endocrine disrupting nonylphenols are ubiquitous in food. Environ. Sci. Technol. 2002, 36, 1676–1680. [Google Scholar] [CrossRef]
- Kawamura, Y.; Ogawa, Y.; Mutsuga, M. Migration of nonylphenol and plasticizers from polyvinyl chloride stretch film into food simulants, rapeseed oil, and foods. Food Sci. Nutr. 2017, 5, 390–398. [Google Scholar] [CrossRef]
- Daidoji, T.; Ozawa, M.; Sakamoto, H.; Sako, T.; Inoue, H.; Kurihara, R.; Hashimoto, S.; Yokota, H. Slow elimination of nonylphenol from rat intestine. Drug Metab. Dispos. 2006, 34, 184–190. [Google Scholar] [CrossRef] [PubMed]
- Shao, B.; Han, H.; Li, D.; Ma, Y.; Tu, X.; Wu, Y. Analysis of alkylphenol and bisphenol A in meat by accelerated solvent extraction and liquid chromatography with tandem mass spectrometry. Food Chem. 2007, 105, 1236–1241. [Google Scholar] [CrossRef]
- Sjöström, Å.E.; Collins, C.D.; Smith, S.R.; Shaw, G. Degradation and plant uptake of nonylphenol (NP) and nonylphenol-12-ethoxylate (NP12EO) in four contrasting agricultural soils. Environ. Pollut. 2008, 156, 1284–1289. [Google Scholar] [CrossRef]
- De Bruin, W.; Kritzinger, Q.; Bornman, R.; Korsten, L. Occurrence, fate and toxic effects of the industrial endocrine disrupter, nonylphenol, on plants-a review. Ecotoxicol. Environ. Saf. 2019, 181, 419–427. [Google Scholar] [CrossRef] [PubMed]
- Gyllenhammar, I.; Glynn, A.; Darnerud, P.O.; Lignell, S.; van Delft, R.; Aune, M. 4-Nonylphenol and bisphenol A in Swedish food and exposure in Swedish nursing women. Environ. Int. 2012, 43, 21–28. [Google Scholar] [CrossRef] [PubMed]
- Fang, K.; Jiang, Z.; Wang, J.; She, Y.; Jin, M.; Jin, F.; Yang, M. Simulation of nonylphenol degradation in leafy vegetables using a deuterated tracer. Environ. Sci. Process. Impacts 2015, 17, 1323–1330. [Google Scholar] [CrossRef]
- Mezcua, M.; Martínez-Uroz, M.A.; Gómez-Ramos, M.M.; Gómez, M.J.; Navas, J.M.; Fernández-Alba, A.R. Analysis of synthetic endocrine-disrupting chemicals in food: A review. Talanta 2012, 100, 90–106. [Google Scholar] [CrossRef] [PubMed]


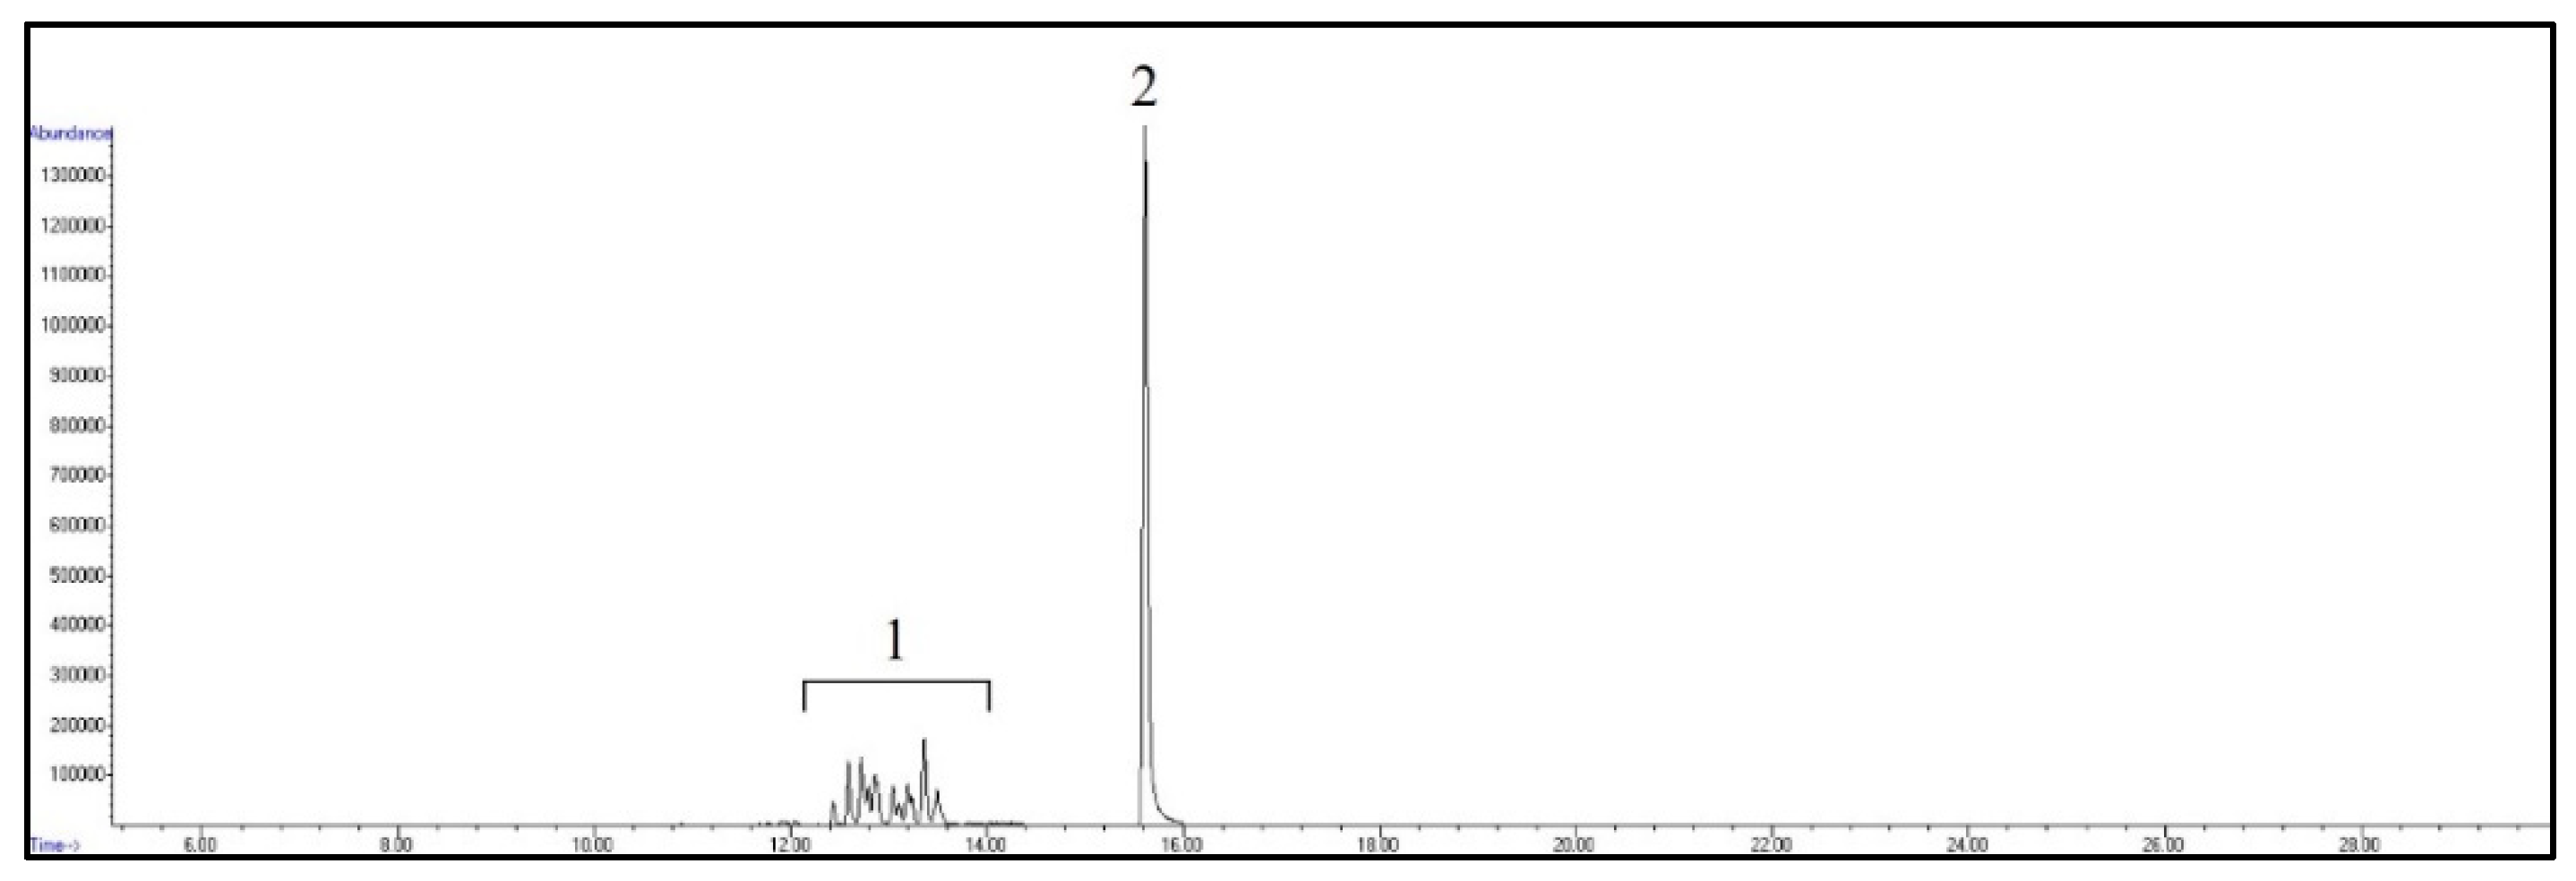
| Compound | Abbreviation | Retention Times | Qualifier Ions | Quantifier Ions |
|---|---|---|---|---|
| Nonylphenol | NP | 12.0–13.7 | 121, 149, 163 | 135 |
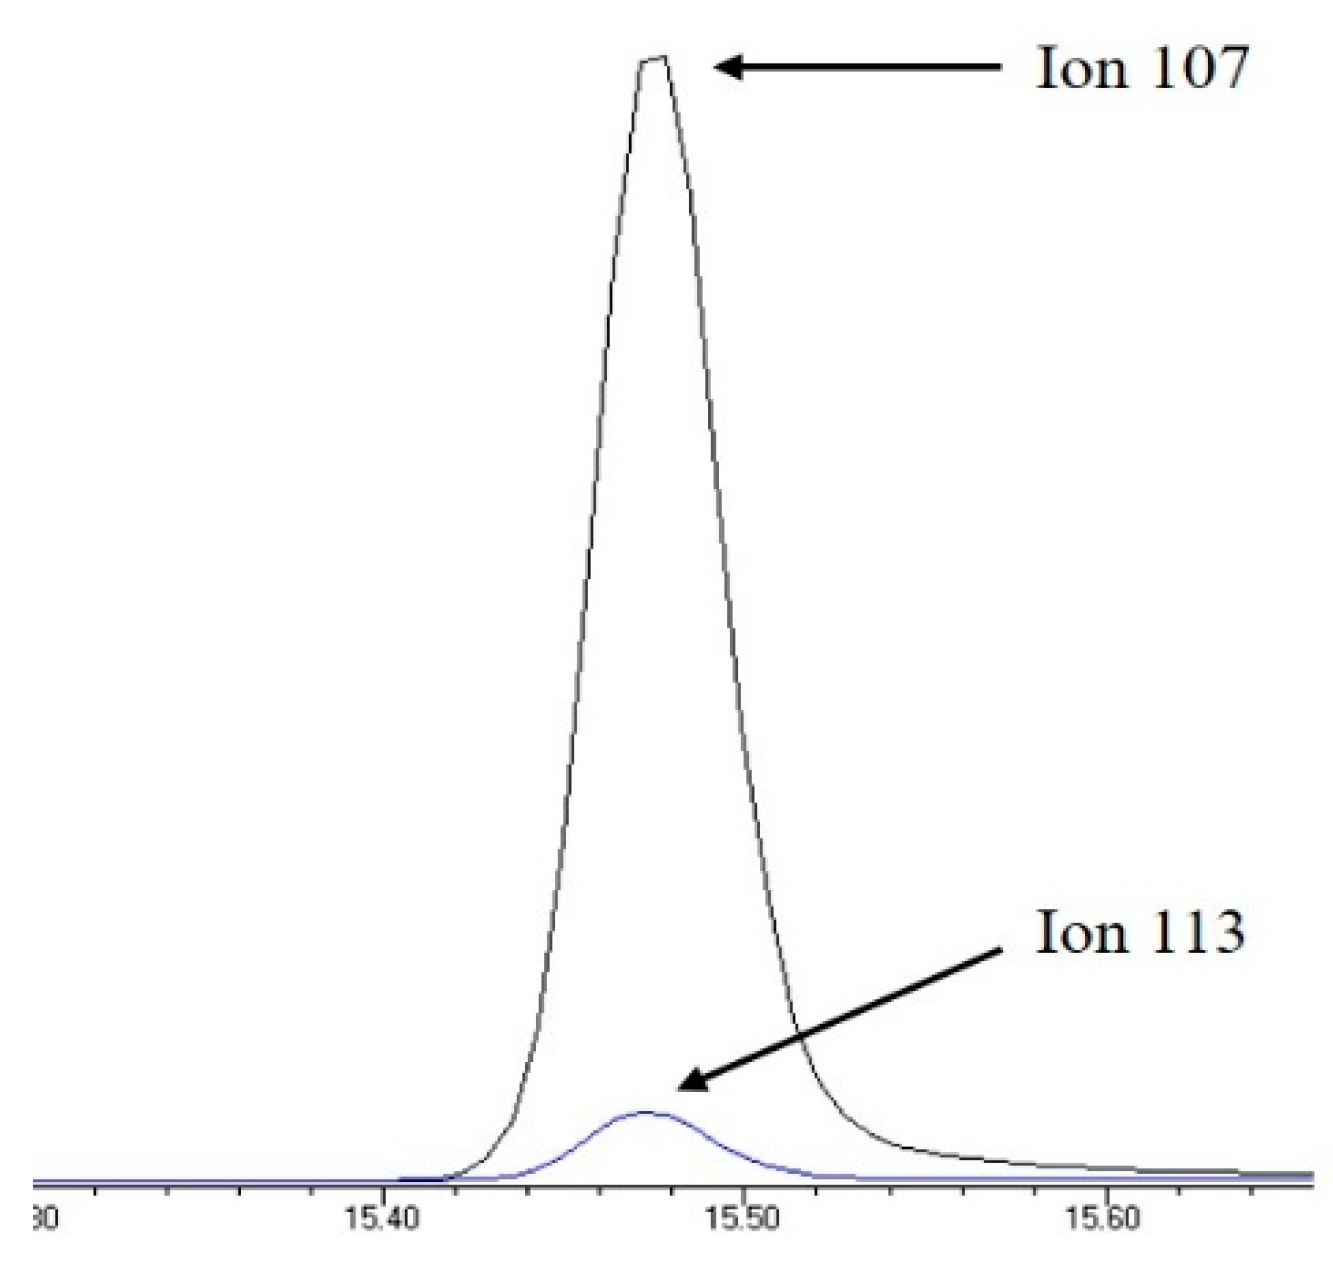
| 4-n-nonylphenol | 4-n-NP | 15.6 | 220 | 107 |
| 4-n-nonylphenol 13C6 * | 4-n-NP 13C6 | 15.6 | 226 | 113 |
| Food Type | Matrix | Standard Curve | Linearity (R2) | LOD (μg/kg) | LOQ (μg/kg) |
|---|---|---|---|---|---|
| High-fat | Infant puree | y = 2.85 x + 1.72 × 10⁻¹ | 9.98 × 10⁻¹ | 1.79 | 5.41 |
| Olive oil | y = 2.95 x + 8.98 × 10⁻³ | 9.99 × 10⁻¹ | 6.39 × 10⁻¹ | 1.94 | |
| Low-fat | Enoki mushroom | y = 1.96 x + 5.04 × 10⁻² | 9.98 × 10⁻¹ | 3.66 × 10⁻¹ | 1.11 |
| 7% ethanol | y = 2.31 x + 8.86 × 10⁻² | 9.99 × 10⁻¹ | 3.82 × 10⁻¹ | 1.16 |
| Matrix | Nominal Concentration (ng/mL) | Intraday 1 | Intraday 2 | Intraday 3 | Interday | ||||
|---|---|---|---|---|---|---|---|---|---|
| Accuracy (%) | Precision (% RSD) | Accuracy (%) | Precision (% RSD) | Accuracy (%) | Precision (% RSD) | Accuracy (%) | Precision (% RSD) | ||
| Puree | 500 | 97.2 | 7.68 | 92.8 | 7.19 | 93.9 | 6.05 | 94.6 | 6.43 |
| 1000 | 95.9 | 4.12 | 93.0 | 4.95 | 101.0 | 5.23 | 96.6 | 5.53 | |
| 2000 | 103.7 | 7.16 | 97.7 | 4.07 | 104.2 | 3.41 | 101.9 | 5.42 | |
| Olive oil | 500 | 97.1 | 9.68 | 91.8 | 4.25 | 97.7 | 2.51 | 95.5 | 6.23 |
| 1000 | 95.4 | 2.00 | 97.7 | 7.72 | 99.8 | 7.10 | 97.6 | 5.74 | |
| 2000 | 98.0 | 2.64 | 108.6 | 1.80 | 97.4 | 2.98 | 101.3 | 5.80 | |
| Enoki mushroom | 100 | 102.5 | 11.32 | 88.7 | 0.67 | 86.8 | 6.44 | 92.6 | 10.45 |
| 500 | 107.3 | 6.45 | 99.8 | 11.83 | 93.9 | 6.12 | 100.3 | 9.36 | |
| 1000 | 92.9 | 5.88 | 97.9 | 8.19 | 103.3 | 4.68 | 98.0 | 7.16 | |
| 7% EtOH | 100 | 100.5 | 2.08 | 100.7 | 1.76 | 99.1 | 1.14 | 100.1 | 1.65 |
| 500 | 102.8 | 2.72 | 99.3 | 4.60 | 101.9 | 3.80 | 101.3 | 3.61 | |
| 1000 | 100.3 | 4.30 | 99.6 | 1.50 | 101.0 | 1.63 | 100.3 | 2.49 | |
| Food Category | NPs (µg/kg) | |
|---|---|---|
| Mean | Min~Max | |
| Shellfish | 21.27 | N.D. *~72.80 |
| Cephalopods | 4.65 | N.D.~41.89 |
| Crustaceans | 58.64 | N.D.~252.65 |
| Fresh water and saltwater fish | 11.44 | N.D.~68.78 |
| Marine algae * | 75.62 | N.D.~269.07 |
| Poultry | 14.02 | N.D.~50.59 |
| Livestock | 18.36 | N.D.~227.06 |
| Eggs | 2.17 | N.D.~7.36 |
| Oils and fats | 0.15 | N.D.~1.14 |
| Whole grains | 7.34 | 3.26~23.08 |
| Legumes | 16.28 | 5.32~36.58 |
| Root and tuber crops | 34.70 | 9.54~69.27 |
| Vegetables | 19.88 | 2.68~123.91 |
| Mushrooms | 7.88 | N.D.~39.22 |
| Fruits | 7.92 | 3.17~31.68 |
| Nuts | 3.82 | N.D.~14.30 |
| Food Samples | Lipid Contents (%) * | Average NP Level (µg/kg) |
|---|---|---|
| Chicken wings | 10.5 | 13.0 |
| Chicken breast | 1.00 | 2.17 |
| Chicken legs | 7.70 | 19.8 |
| Duck | 21.0 | 21.1 |
Disclaimer/Publisher’s Note: The statements, opinions and data contained in all publications are solely those of the individual author(s) and contributor(s) and not of MDPI and/or the editor(s). MDPI and/or the editor(s) disclaim responsibility for any injury to people or property resulting from any ideas, methods, instructions or products referred to in the content. |
© 2023 by the authors. Licensee MDPI, Basel, Switzerland. This article is an open access article distributed under the terms and conditions of the Creative Commons Attribution (CC BY) license (https://creativecommons.org/licenses/by/4.0/).
Share and Cite
Lee, S.M.; Cheong, D.; Kim, M.; Kim, Y.-S. Analysis of Endocrine Disrupting Nonylphenols in Foods by Gas Chromatography-Mass Spectrometry. Foods 2023, 12, 269. https://doi.org/10.3390/foods12020269
Lee SM, Cheong D, Kim M, Kim Y-S. Analysis of Endocrine Disrupting Nonylphenols in Foods by Gas Chromatography-Mass Spectrometry. Foods. 2023; 12(2):269. https://doi.org/10.3390/foods12020269
Chicago/Turabian StyleLee, Sang Mi, Daeun Cheong, Meehye Kim, and Young-Suk Kim. 2023. "Analysis of Endocrine Disrupting Nonylphenols in Foods by Gas Chromatography-Mass Spectrometry" Foods 12, no. 2: 269. https://doi.org/10.3390/foods12020269
APA StyleLee, S. M., Cheong, D., Kim, M., & Kim, Y.-S. (2023). Analysis of Endocrine Disrupting Nonylphenols in Foods by Gas Chromatography-Mass Spectrometry. Foods, 12(2), 269. https://doi.org/10.3390/foods12020269