

Preliminary Estimation of Nutritional Quality of the Meat, Liver, and Fat of the Indigenous Yakutian Cattle Based on Their Fatty Acid Profiles

 ,
,  , , and
Abstract
:
1. Introduction
2. Materials and Methods
2.1. Collecting Samples of Pasture Plants Constituting the Diet of the Yakutian Cattle
2.2. The Design of the Experiment with Pasture Plants
2.3. Analysis of Fatty Acids of Pasture Plants
2.4. Harvesting the Tissues of the Yakutian Cattle
2.5. Analysis of Fatty Acids in Yakutian Cattle Tissues
2.6. Statistical Analysis
3. Results
4. Discussion
5. Conclusions
Author Contributions
Funding
Data Availability Statement
Acknowledgments
Conflicts of Interest
References
- Simopoulos, A.P. Human requirement for n–3 polyunsaturated fatty acids. Poult. Sci. 2000, 79, 961–970. [Google Scholar] [CrossRef]
- Schmitz, G.; Ecker, J. The opposing effects of n–3 and n–6 fatty acids. Prog. Lipid Res. 2008, 47, 147–155. [Google Scholar] [CrossRef]
- Wang, Z.; Zhao, J.; Wang, Y.; Zhang, T.; Liu, R.; Chang, M.; Wang, X. Advances in EPA-GPLs: Structural features, mechanisms of nutritional functions and sources. Trends Food Sci. Technol. 2021, 114, 521–529. [Google Scholar] [CrossRef]
- Tocher, D.R.; Dick, J.R.; MacGlaughlin, P.; Bell, J.G. Effect of diets enriched in Δ6 desaturated fatty acids (18:3n−6 and 18:4n−3), on growth, fatty acid composition and highly unsaturated fatty acid synthesis in two populations of Arctic charr (Salvelinus alpinus L.). Comp. Biochem. Physiol. Part B Biochem. Mol. Biol. 2006, 144, 245–253. [Google Scholar] [CrossRef] [PubMed]
- Malcicka, M.; Visser, B.; Ellers, J. An Evolutionary Perspective on Linoleic Acid Synthesis in Animals. Evol. Biol. 2018, 45, 15–26. [Google Scholar] [CrossRef] [PubMed]
- Gladyshev, M.I.; Sushchik, N.N.; Makhutova, O.N. Production of EPA and DHA in aquatic ecosystems and their transfer to the land. Prostaglandins Other Lipid Mediat. 2013, 107, 117–126. [Google Scholar] [CrossRef]
- Makhutova, O.N.; Gladyshev, M.I. Essential PUFA in Physiology and Metabolism of Fish and Human: Functions, Needs, Sources. Russ. J. Physiol. 2020, 106, 601–621. [Google Scholar] [CrossRef]
- Pauly, D.; Christensen, V.; Guénette, S.; Pitcher, T.J.; Sumaila, U.R.; Walters, C.J.; Watson, R.; Zeller, D. Towards sustainability in world fisheries. Nature 2002, 418, 689–695. [Google Scholar] [CrossRef] [PubMed]
- Worm, B.; Barbier, E.B.; Beaumont, N.; Duffy, J.E.; Folke, C.; Halpern, B.S.; Jackson, J.B.; Lotze, H.K.; Micheli, F.; Palumbi, S.R.; et al. Impacts of biodiversity loss on ocean ecosystem services. Science 2006, 314, 787–790. [Google Scholar] [CrossRef]
- FAO. 2016. Food and Agriculture Organization. The State of World Fisheries and Aquaculture 2016. Rome, FAO. Available online: https://www.fao.org/3/i5555e/i5555e.pdf (accessed on 15 June 2023).
- Davis, B.C.; Kris-Etherton, P.M. Achieving optimal essential fatty acid status in vegetarians: Current knowledge and practical implications. Am. J. Clin. Nutr. 2003, 78, 640S–646S. [Google Scholar] [CrossRef]
- Colombo, S.M.; Wacker, A.; Parrish, C.C.; Kainz, M.J.; Arts, M.T. A fundamental dichotomy in long-chain polyunsaturated fatty acid abundance between and within marine and terrestrial ecosystems. Environ. Rev. 2016, 25, 163–174. [Google Scholar] [CrossRef]
- Crawford, M.A. Fatty-acid ratios in free-living and domestic animals. Possible implications for atheroma. Lancet 1968, 1, 1329–1333. [Google Scholar] [CrossRef] [PubMed]
- Belaunzaran, X.; Bessa, R.J.; Lavín, P.; Mantecón, A.R.; Kramer, J.K.; Aldai, N. Horse-meat for human consumption - Current research and future opportunities. Meat Sci. 2015, 108, 74–81. [Google Scholar] [CrossRef]
- Ferjak, E.N.; Cavinder, C.A.; Sukumaran, A.T.; Burnett, D.D.; Lemley, C.O.; Dinh, T.T.N. Fatty acid composition of mesenteric, cardiac, abdominal, intermuscular, and subcutaneous adipose tissues from horses of three body condition scores. Livest. Sci. 2019, 223, 116–123. [Google Scholar] [CrossRef]
- Enser, M.; Hallett, K.; Hewitt, B.; Fursey, G.A.; Wood, J.D. Fatty acid content and composition of english beef, lamb and pork at retail. Meat Sci. 1996, 42, 443–456. [Google Scholar] [CrossRef]
- Fisher, A.V.; Enser, M.; Richardson, R.I.; Wood, J.D.; Nute, G.R.; Kurt, E.; Sinclair, L.A.; Wilkinson, R.G. Fatty acid composition and eating quality of lamb types derived from four diverse breed × production systems. Meat Sci. 2000, 55, 141–147. [Google Scholar] [CrossRef]
- Rule, D.C.; Broughton, K.S.; Shellito, S.M.; Maiorano, G. Comparison of muscle fatty acid profiles and cholesterol concentrations of bison, beef cattle, elk, and chicken. J. Anim. Sci. 2002, 80, 1202–1211. [Google Scholar] [CrossRef]
- Kouba, M.; Enser, M.; Whittington, F.M.; Nute, G.R.; Wood, J.D. Effect of a high-linolenic acid diet on lipogenic enzyme activities, fatty acid composition, and meat quality in the growing pig. J. Anim. Sci. 2003, 81, 1967–1979. [Google Scholar] [CrossRef]
- Polak, T.; Rajar, A.; Gašperlin, L.; Zlender, B. Cholesterol concentration and fatty acid profile of red deer (Cervus elaphus) meat. Meat Sci. 2008, 80, 864–869. [Google Scholar] [CrossRef] [PubMed]
- Petrov, K.A.; Dudareva, L.V.; Nokhsorov, V.V.; Stoyanov, K.N.; Makhutova, O.N. Fatty Acid Content and Composition of the Yakutian Horses and Their Main Food Source: Living in Extreme Winter Conditions. Biomolecules 2020, 10, 315. [Google Scholar] [CrossRef] [PubMed]
- Clauss, M.; Grum, C.; Hatt, J.-M. Fatty acid status of captive wild animals: A review. Zool. Gart. 2007, 76, 382–401. [Google Scholar] [CrossRef]
- Kim, K.-W.; Kim, H.-J.; Kim, H.-J.; Lee, S.-S.; Lee, E.-D.; Kim, D.-K.; Lee, S.-H.; Jang, A.; Lee, J. Effect of Feeding Regime on Meat Quality of Elk Deer Loin during Aging. J. Food Nutr. Res. 2020, 8, 355. [Google Scholar] [CrossRef]
- Petrov, K.A.; Perk, A.A.; Chepalov, V.A.; Sofronova, V.E.; Ilyin, A.N.; Ivanov, R.V. Eco-physiological and biochemical bases of the green cryo-feed forming in Yakutia. Agric. Biol. 2017, 52, 1129–1138. [Google Scholar] [CrossRef]
- Talle, M.; Deak, B.; Poschlod, P.; Valko, O.; Westerberg, L.; Milberg, P. Grazing vs. mowing: A meta-analysis of biodiversity benefits for grassland management. Agric. Ecosyst. Environ. 2016, 222, 200–212. [Google Scholar] [CrossRef]
- Yang, Z.; Minggagud, H.; Baoyin, T.; Li, F.Y. Plant production decreases whereas nutrients concentration increases in response to the decrease of mowing stubble height. J. Environ. Manag. 2020, 253, 109745. [Google Scholar] [CrossRef]
- Kilar, J.; Kasprzyk, A. Fatty Acids and Nutraceutical Properties of Lipids in Fallow Deer (Dama dama) Meat Produced in Organic and Conventional Farming Systems. Foods 2021, 10, 2290. [Google Scholar] [CrossRef] [PubMed]
- Kok, M.T.J.; Alkemade, R.; Bakkenes, M.; van Eerdt, M.; Janse, J.; Mandryk, M.; Kram, T.; Lazarova, T.; Meijer, J.; van Oorschot, M.; et al. Pathways for agriculture and forestry to contribute to terrestrial biodiversity conservation: A global scenario-study. Biol. Conserv. 2018, 221, 137–150. [Google Scholar] [CrossRef]
- Soini, K.; Ovaska, U.; Kantanen, J. Spaces of Conservation of Local Breeds: The Case of Yakutian Cattle. Sociol. Rural. 2012, 52, 170–191. [Google Scholar] [CrossRef]
- Tapio, I.; Tapio, M.; Li, M.H.; Popov, R.; Ivanova, Z.; Kantanen, J. Estimation of relatedness among non-pedigreed Yakutian cryo-bank bulls using molecular data: Implications for conservation and breed management. Genet Sel. Evol. 2010, 42, 28. [Google Scholar] [CrossRef] [PubMed]
- Li, M.H.; Nogovitsina, E.; Ivanova, Z.; Erhardt, C.; Vilkki, J.; Popov, R.; Ammosov, I.; Kiselyova, T.; Kantanen, J. Genetic Contribution of Indigenous Yakutian Cattle to Two Hybrid Populations, Revealed by Microsatellite Variation. Asian-Australas. J. Anim. Sci. 2005, 18, 613. [Google Scholar] [CrossRef]
- Egorov, A.D.; Potapov, V.Y.; Romanov, P.A. Zonal’no-Biokhimicheskie Osobennosti Kormovykh Rastenii iakutii i Nekotorye Problemy Razvitiia Zhivotnovodstva (Zonal-Biochemical Characteristics of Fodder Plants in Yakutia and Some Problems in the Development of Animal Husbandry); Yakutsk Book Publishing House: Yakutsk, Russia, 1962; 51p. [Google Scholar]
- Potapov, V.Y. Uglevody i Lignin v Kormovykh Travakh Iakutii (Carbohydrates and Lignin in the Fodder Grasses of Yakutia); Nauka Publishing House: Moscow, Russia, 1967; 173p. [Google Scholar]
- Petrov, K.A.; Dudareva, L.V.; Nokhsorov, V.V.; Perk, A.A.; Chepalov, V.A.; Sophronova, V.E.; Voinikov, V.K.; Zulfugarov, I.S.; Lee, C.-H. The role of plant fatty acids in regulation of the adaptation of organisms to the cold climate in cryolithic zone of Yakutia. J. Life Sci. 2016, 26, 519–530. [Google Scholar] [CrossRef]
- Christie, W.W. Preparation of ester derivatives of fatty acids for chromatographic analysis. Adv. Lipid Methodol. 1993, 2, 69–111. [Google Scholar]
- Nokhsorov, V.V.; Dudareva, L.V.; Senik, S.V.; Chirikova, N.K.; Petrov, K.A. Influence of Extremely Low Temperatures of the Pole of Cold on the Lipid and Fatty-Acid Composition of Aerial Parts of the Horsetail Family (Equisetaceae). Plants 2021, 10, 996. [Google Scholar] [CrossRef] [PubMed]
- Christie, W.W.; Han, X. Gas chromatographic analysis of fatty acid derivatives. In Lipid Analysis, Isolation, Separation, Identification, and Lipidomic Analysis; Woodhead Publishing Ltd.: Cambridge, UK, 2010; pp. 159–180. [Google Scholar]
- Ulbricht, T.L.; Southgate, D.A. Coronary heart disease: Seven dietary factors. Lancet 1991, 338, 985–992. [Google Scholar] [CrossRef] [PubMed]
- Chen, J.; Liu, H. Nutritional Indices for Assessing Fatty Acids: A Mini-Review. Int. J. Mol. Sci. 2020, 21, 5695. [Google Scholar] [CrossRef]
- R. Core Team, R: A Language and Environment for Statistical Computing. 2013. Available online: https://www.r-project.org/ (accessed on 10 May 2023).
- Wickham, H.; Averick, M.; Bryan, J.; Chang, W.; McGowan, L.D.; François, R.; Grolemund, G.; Hayes, A.; Henry, L.; Hester, J. Welcome to the Tidyverse. J. Open Source Softw. 2019, 4, 1686. [Google Scholar] [CrossRef]
- Kassambara, A.; Mundt, F. Package ‘Factoextra.’ Extract and Visualize the Results of Multivariate Data Analyses 76. 2017. Available online: https://cran.r-project.org/package=factoextra (accessed on 12 May 2023).
- Lê, S.; Josse, J.; Husson, F. FactoMineR: An R Package for Multivariate Analysis. J. Stat. Soft. 2008, 25, 1–18. [Google Scholar] [CrossRef]
- Graves, S.; Piepho, H.P.; Selzer, M.L. Package ‘multcompView.’ Visualizations of Paired Comparisons. 2015. Available online: https://cran.r-project.org/package=multcompView (accessed on 12 May 2023).
- Kassambara, A.; Kassambara, M.A. Package “ggpubr.” R Package Version 0.1 6. 2020. Available online: https://cran.r-project.org/package=ggpubr (accessed on 12 May 2023).
- Gladyshev, M.I.; Makhutova, O.N.; Gubanenko, G.A.; Rechkina, E.A.; Kalachova, G.S.; Sushchik, N.N. Livers of terrestrial production animals as a source of long-chain polyunsaturated fatty acids for humans: An alternative to fish? Eur. J. Lipid Sci. Technol. 2015, 117, 1417–1421. [Google Scholar] [CrossRef]
- World Health Organization. (2003). Diet, Nutrition and the Prevention of chronic Diseases: Report of a Joint WHO/FAO Expert Consultation, Geneva, 28 January—1 February 2002. World Health Organization. Available online: https://apps.who.int/iris/handle/10665/42665 (accessed on 19 May 2023).
- Omri, B.; Chalghoumi, R.; Izzo, L.; Ritieni, A.; Lucarini, M.; Durazzo, A.; Abdouli, H.; Santini, A. Effect of Dietary Incorporation of Linseed Alone or Together with Tomato-Red Pepper Mix on Laying Hens’ Egg Yolk Fatty Acids Profile and Health Lipid Indexes. Nutrients 2019, 11, 813. [Google Scholar] [CrossRef] [PubMed]
- Alvarenga, A.L.; Sousa, R.V.; Parreira, G.G.; Chiarini-Garcia, H.; Almeida, F.R. Fatty acid profile, oxidative stability of pork lipids and meat quality indicators are not affected by birth weight. Anim. Int. J. Anim. Biosci. 2014, 8, 660–666. [Google Scholar] [CrossRef]
- Łuczyńska, J.; Paszczyk, B.; Nowosad, J.; Łuczyński, M.J. Mercury, Fatty Acids Content and Lipid Quality Indexes in Muscles of Freshwater and Marine Fish on the Polish Market. Risk Assessment of Fish Consumption. Int. J. Environ. Res. Public Health 2017, 14, 1120. [Google Scholar] [CrossRef] [PubMed]
- Mir, N.A.; Tyagi, P.K.; Biswas, A.K.; Tyagi, P.K.; Mandal, A.B.; Kumar, F.; Sharma, D.; Biswas, A.; Verma, A.K. Inclusion of Flaxseed, Broken Rice, and Distillers Dried Grains with Solubles (DDGS) in Broiler Chicken Ration Alters the Fatty Acid Profile, Oxidative Stability, and Other Functional Properties of Meat. Eur. J. Lipid Sci. Technol. 2018, 120, 1700470. [Google Scholar] [CrossRef]
- Santos-Silva, J.; Mendes, I.A.; Bessa, R.J.B. The effect of genotype, feeding system and slaughter weight on the quality of light lambs 1. Growth, carcass composition and meat quality. Livest Prod Sci. 2002, 76, 17–25. [Google Scholar] [CrossRef]
- Mierliță, D.S. Effects of diets containing hemp seeds or hemp cake on fatty acid composition and oxidative stability of sheep milk. Afr. J. Anim. Sci. 2018, 48, 504. [Google Scholar] [CrossRef]
- Chen, S.; Bobe, G.; Zimmerman, S.; Hammond, E.G.; Luhman, C.M.; Boylston, T.D.; Freeman, A.E.; Beitz, D.C. Physical and sensory properties of dairy products from cows with various milk fatty acid compositions. J. Agric. Food Chem. 2004, 52, 3422–3428. [Google Scholar] [CrossRef]
- Ghandour, R.A.; Colson, C.; Giroud, M.; Maurer, S.; Rekima, S.; Ailhaud, G.; Klingenspor, M.; Amri, E.Z.; Pisani, D.F. Impact of dietary ω3 polyunsaturated fatty acid supplementation on brown and brite adipocyte function. J. Lipid Res. 2018, 59, 452–461. [Google Scholar] [CrossRef]
- Pisani, D.F.; Ailhaud, G. Involvement of polyunsaturated fatty acids in the control of energy storage and expenditure. Oilseeds Fats Crop. Lipids 2019, 26, 37. [Google Scholar] [CrossRef]
- Enser, M.; Hallett, K.G.; Hewett, B.; Fursey, G.A.; Wood, J.D.; Harrington, G. Fatty acid content and composition of UK beef and lamb muscle in relation to production system and implications for human nutrition. Meat Sci. 1998, 49, 329–341. [Google Scholar] [CrossRef]
- Wood, J.D.; Richardson, R.I.; Nute, G.R.; Fisher, A.V.; Campo, M.M.; Kasapidou, E.; Sheard, P.R.; Enser, M. Effects of fatty acids on meat quality: A review. Meat Sci. 2004, 66, 21–32. [Google Scholar] [CrossRef]
- Smith, S.B.; Gill, C.A.; Lunt, D.K.; Brooks, M.A. Regulation of Fat and Fatty Acid Composition in Beef Cattle. Asian-Australas. J. Anim. Sci. 2009, 22, 1225. [Google Scholar] [CrossRef]
- Khan, N.A.; Cone, J.W.; Fievez, V.; Hendriks, W.H. Causes of variation in fatty acid content and composition in grass and maize silages. Anim. Feed Sci. Technol. 2012, 174, 36–45. [Google Scholar] [CrossRef]
- Ozolina, N.V.; Kapustina, I.S.; Gurina, V.V.; Nurminsky, V.N. Role of tonoplast microdomains in plant cell protection against osmotic stress. Planta 2022, 255, 65. [Google Scholar] [CrossRef] [PubMed]
- Sushchik, N.N.; Makhutova, O.N.; Rudchenko, A.E.; Glushchenko, L.A.; Shulepina, S.P.; Kolmakova, A.A.; Gladyshev, M.I. Comparison of Fatty Acid Contents in Major Lipid Classes of Seven Salmonid Species from Siberian Arctic Lakes. Biomolecules 2020, 10, 419. [Google Scholar] [CrossRef] [PubMed]
- Wood, J.D.; Enser, M.; Fisher, A.V.; Nute, G.R.; Sheard, P.R.; Richardson, R.I.; Hughes, S.I.; Whittington, F.M. Fat deposition, fatty acid composition and meat quality: A review. Meat Sci. 2008, 78, 343. [Google Scholar] [CrossRef]


| № | Species | Family | Stages of Development (July 1) | Sample |
|---|---|---|---|---|
| 1 | Calamagrostis neglecta (Ehrh.) Gaertn., B. Mey. & Schreb. | Poaceae | Stem elongation | leaves |
| 2 | Calamagrostis langsdorffii (Link) Trin. | Poaceae | Tillering | leaves |
| 3 | Arctophila fulva (Trin.) Andersson | Poaceae | Stem elongation | leaves |
| 4 | Glyceria aquatica (L.) Wahlb., nom. illeg. | Poaceae | Ear emergence | leaves |
| 5 | Beckmannia syzigachne (Steud.) Fernald | Poaceae | Tillering | leaves |
| Sampling Date | Daily Average Air Temperature, °C * | Total Precipitation, mm ** | Photoperiod, h |
|---|---|---|---|
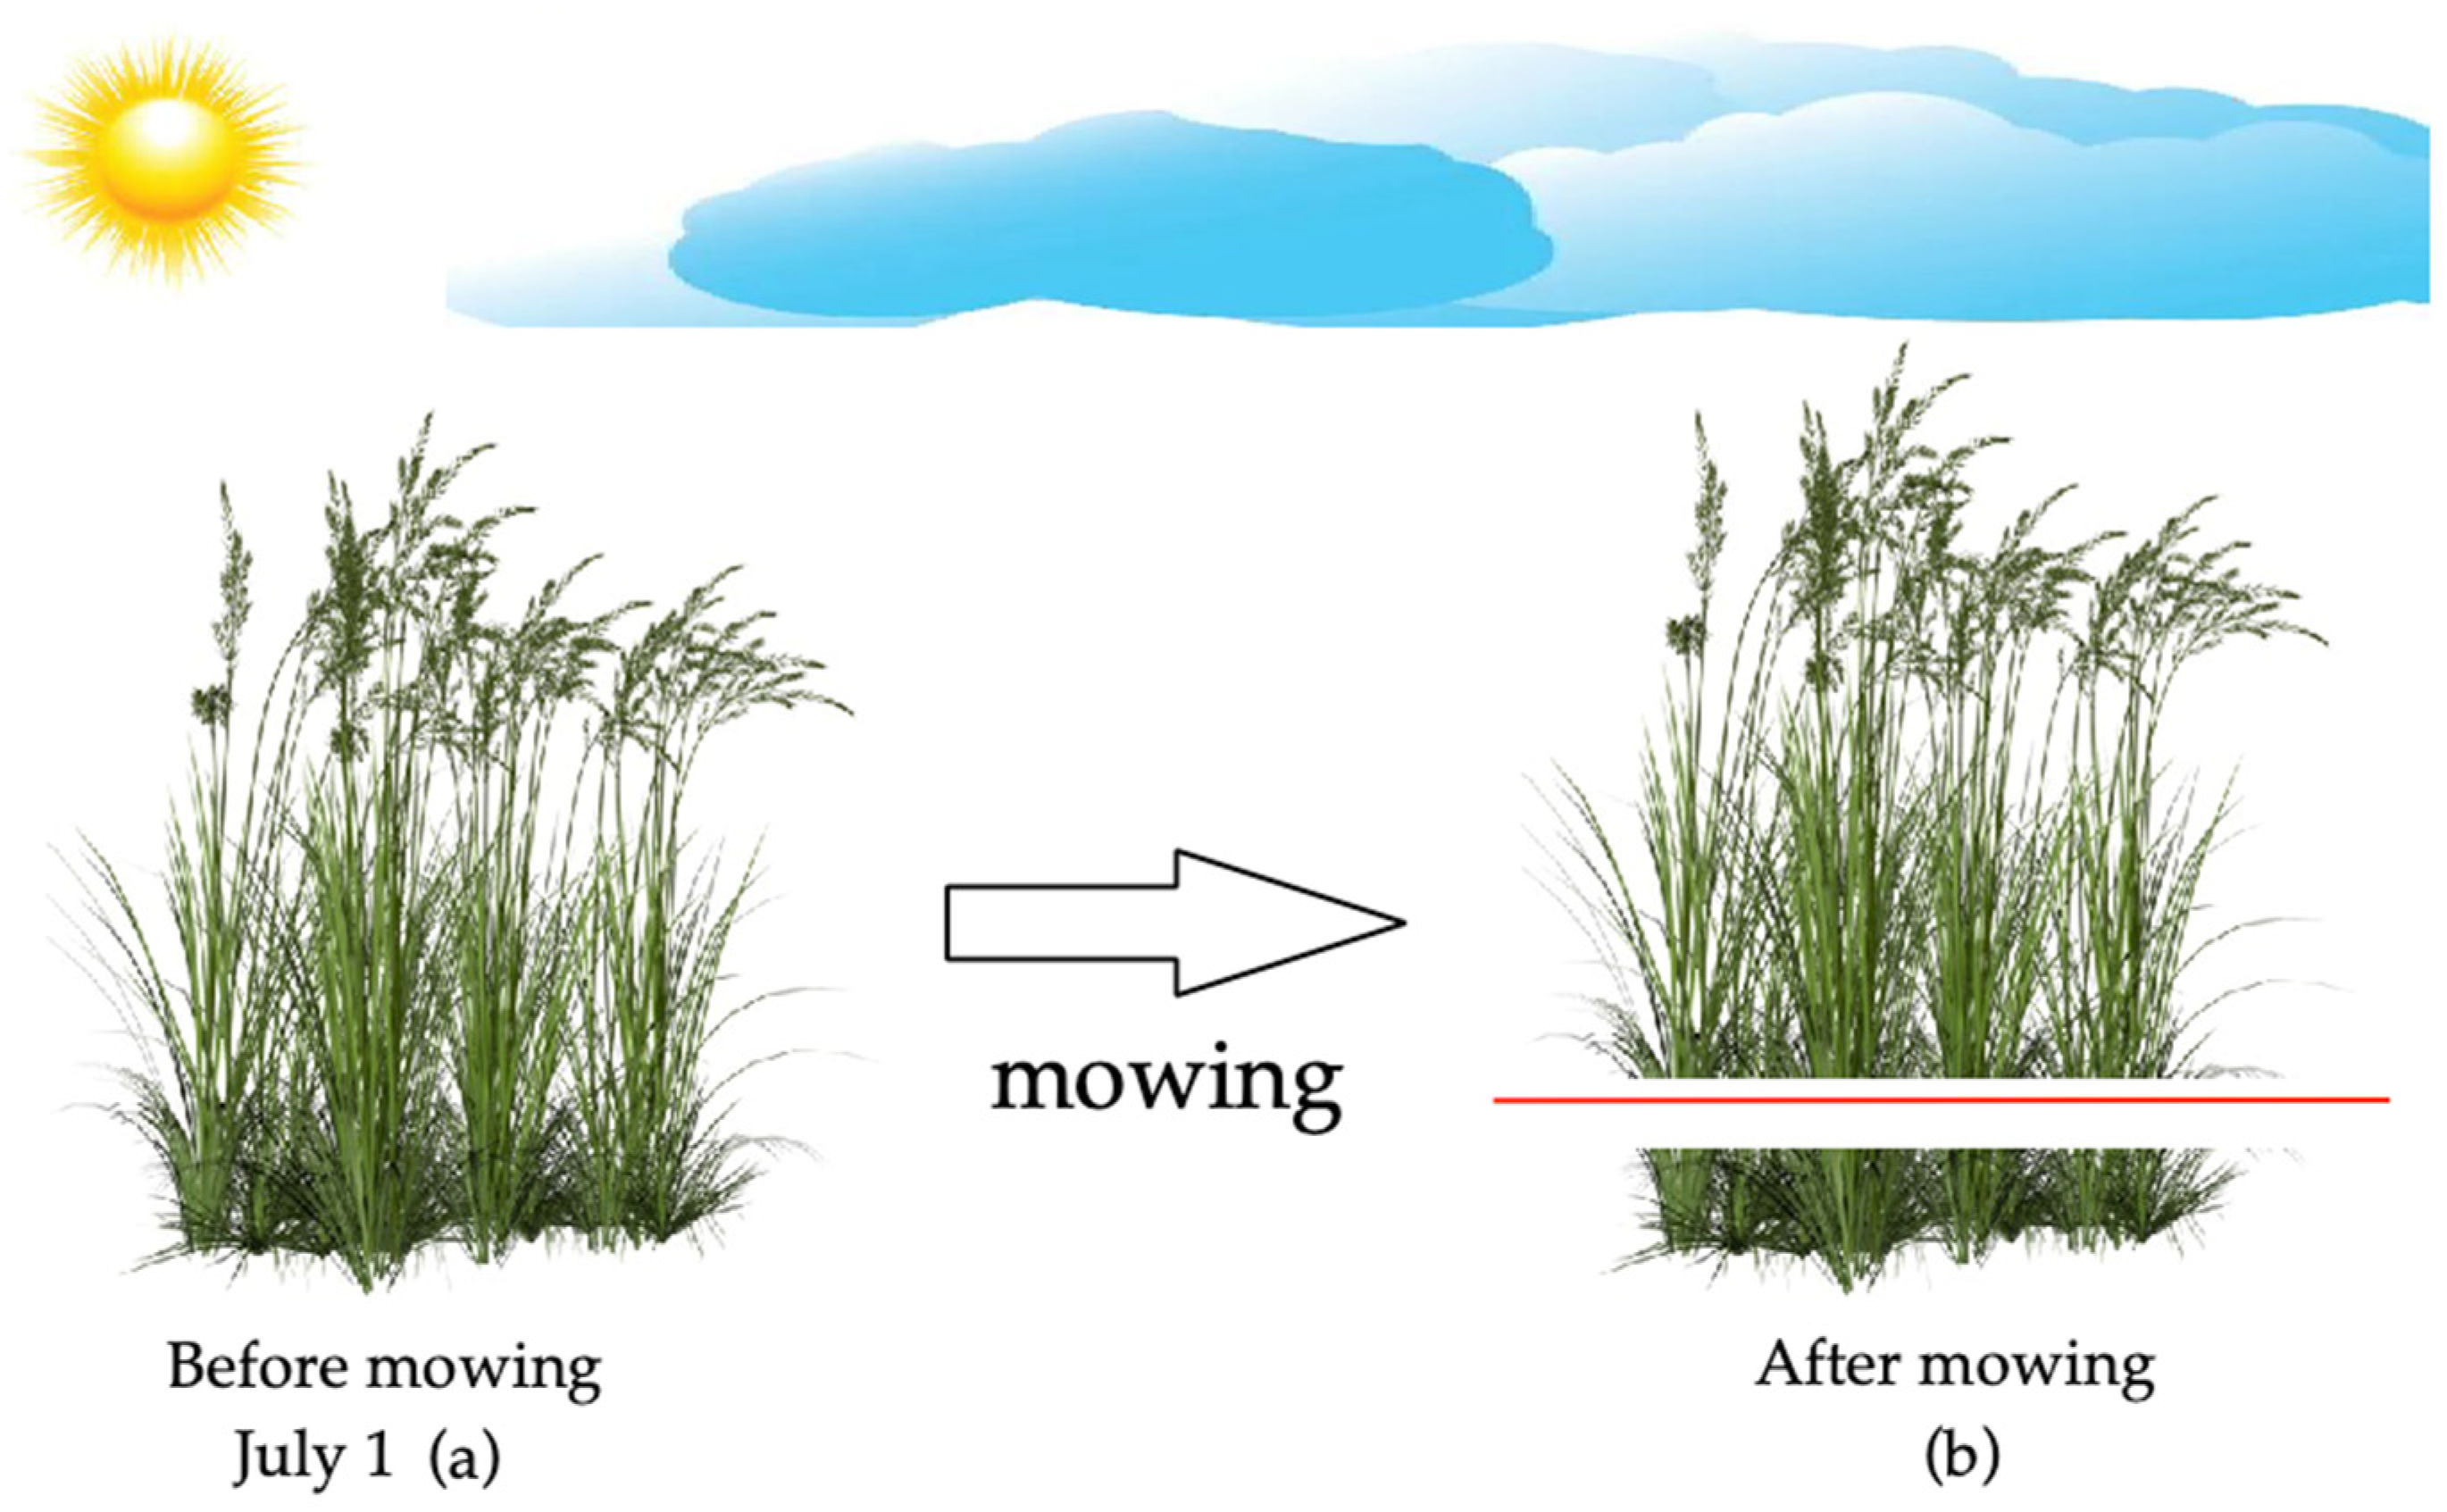
| 1 July (Before mowing) | 19.2 ± 5.5 | 9.0 | 21.0 |
| 2 July | 21.7 ± 9.0 | 7.6 | 20.1 |
| 3 July | 24.3 ± 7.9 | 5.0 | 20.1 |
| 4 July (After mowing 72 h) | 20.2 ± 6.7 | 0.5 | 20.0 |
| Before Mowing, n = 4 | After Mowing, n = 4 | |||
|---|---|---|---|---|
| FA | mg/g DW | % of Total FA | mg/g DW | % of Total FA |
| 12:0 | trace | 0.5 ± 0.0 B | 0.1 ± 0.0 | 1.2 ± 0.2 A |
| 14:0 | trace | 0.8 ± 0.2 B | 0.1 ± 0.1 | 2.7 ± 0.1 A |
| 15:0 | trace | 0.3 ± 0.1 A | trace | 0.7 ± 0.2 A |
| 16:0 | 2.4 ± 0.0 a | 22.5 ± 1.4 B | 1.8 ± 0.7 a | 34.1 ± 0.6 A |
| 16:1n–9 | 0.1 ± 0.0 a | 0.6 ± 0.2 B | 0.1 ± 0.0 a | 1.8 ± 0.1 A |
| 16:1n–5 | 0.3 ± 0.0 a | 2.5 ± 0.0 A | 0.1 ± 0.0 b | 1.0 ± 0.2 B |
| 17:0 | trace | 0.2 ± 0.0 B | trace | 0.7 ± 0.1 A |
| 18:0 | 0.2 ± 0.0 a | 1.9 ± 0.2 B | 0.3 ± 0.2 a | 5.7 ± 0.8 A |
| 18:1n–9 | 0.2 ± 0.0 a | 2.2 ± 0.2 B | 0.2 ± 0.1 a | 4.4 ± 0.5 A |
| 18:1n–7 | 0.1 ± 0.0 a | 0.8 ± 0.0 B | 0.1 ± 0.1 a | 2.4 ± 0.5 A |
| 18:2n–6 | 1.1 ± 0.0 a | 10.0 ± 0.1 A | 0.4 ± 0.1 b | 8.1 ± 1.1 B |
| 18:3n–3 | 5.8 ± 0.5 a | 54.9 ± 1.9 A | 1.8 ± 0.6 a | 33.5 ± 1.3 B |
| 20:0 | 0.1 ± 0.0 a | 1.1 ± 0.2 A | 0.1 ± 0.0 a | 1.7 ± 0.3 A |
| 22:0 | 0.2 ± 0.0 a | 1.8 ± 0.4 A | 0.1 ± 0.0 a | 1.9 ± 0.3 A |
| SFA | 3.1 ± 0.1 a | 29.1 ± 2.2 B | 2.6 ± 1.1 a | 48.7 ± 1.3 A |
| UFA | 7.5 ± 0.7 a | 70.9 ± 2.2 A | 2.7 ± 1.0 b | 51.3 ± 1.3 B |
| Total FA | 10.6 ± 0.6 a | 5.3 ± 2.1 b | ||
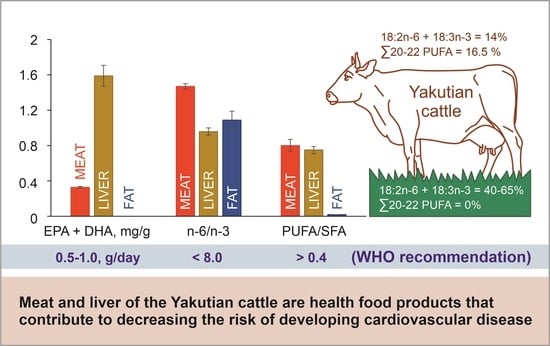
| Parameters | Meat | Liver | Fat |
|---|---|---|---|
| IA * | 0.39 ± 0.03 B | 0.25 ±0.02 C | 1.17 ± 0.08 A |
| IT * | 0.65 ± 0.05 B | 0.62 ± 0.03 B | 3.13 ±0.28 A |
| HH | 3.05 ± 0.18 B | 4.25 ± 0.25 A | 0.94 ±0.08 C |
| HPI | 2.91 ± 0.19 B | 4.07 ± 0.29 A | 0.89 ± 0.07 C |
| n–6/n–3 | 1.47 ± 0.03 A | 0.96 ± 0.04 B | 1.09 ± 0.10 B |
| PUFA/SFA | 0.80 ± 0.07 A | 0.75 ± 0.04 A | 0.02 ± 0.002 B |
| EPA + DHA, mg/g WW | 0.33 ± 0.01 B | 1.59 ± 0.12 A | 0.00 ± 0.00 C |
Disclaimer/Publisher’s Note: The statements, opinions and data contained in all publications are solely those of the individual author(s) and contributor(s) and not of MDPI and/or the editor(s). MDPI and/or the editor(s) disclaim responsibility for any injury to people or property resulting from any ideas, methods, instructions or products referred to in the content. |
© 2023 by the authors. Licensee MDPI, Basel, Switzerland. This article is an open access article distributed under the terms and conditions of the Creative Commons Attribution (CC BY) license (https://creativecommons.org/licenses/by/4.0/).
Share and Cite
Makhutova, O.N.; Nokhsorov, V.V.; Stoyanov, K.N.; Dudareva, L.V.; Petrov, K.A. Preliminary Estimation of Nutritional Quality of the Meat, Liver, and Fat of the Indigenous Yakutian Cattle Based on Their Fatty Acid Profiles. Foods 2023, 12, 3226. https://doi.org/10.3390/foods12173226
Makhutova ON, Nokhsorov VV, Stoyanov KN, Dudareva LV, Petrov KA. Preliminary Estimation of Nutritional Quality of the Meat, Liver, and Fat of the Indigenous Yakutian Cattle Based on Their Fatty Acid Profiles. Foods. 2023; 12(17):3226. https://doi.org/10.3390/foods12173226
Chicago/Turabian StyleMakhutova, Olesia N., Vasiliy V. Nokhsorov, Kirill N. Stoyanov, Lyubov V. Dudareva, and Klim A. Petrov. 2023. "Preliminary Estimation of Nutritional Quality of the Meat, Liver, and Fat of the Indigenous Yakutian Cattle Based on Their Fatty Acid Profiles" Foods 12, no. 17: 3226. https://doi.org/10.3390/foods12173226
APA StyleMakhutova, O. N., Nokhsorov, V. V., Stoyanov, K. N., Dudareva, L. V., & Petrov, K. A. (2023). Preliminary Estimation of Nutritional Quality of the Meat, Liver, and Fat of the Indigenous Yakutian Cattle Based on Their Fatty Acid Profiles. Foods, 12(17), 3226. https://doi.org/10.3390/foods12173226