
Rapid Prediction of Adulteration Content in Atractylodis rhizoma Based on Data and Image Features Fusions from Near-Infrared Spectroscopy and Hyperspectral Imaging Techniques

Abstract
:1. Introduction
2. Materials and Methods
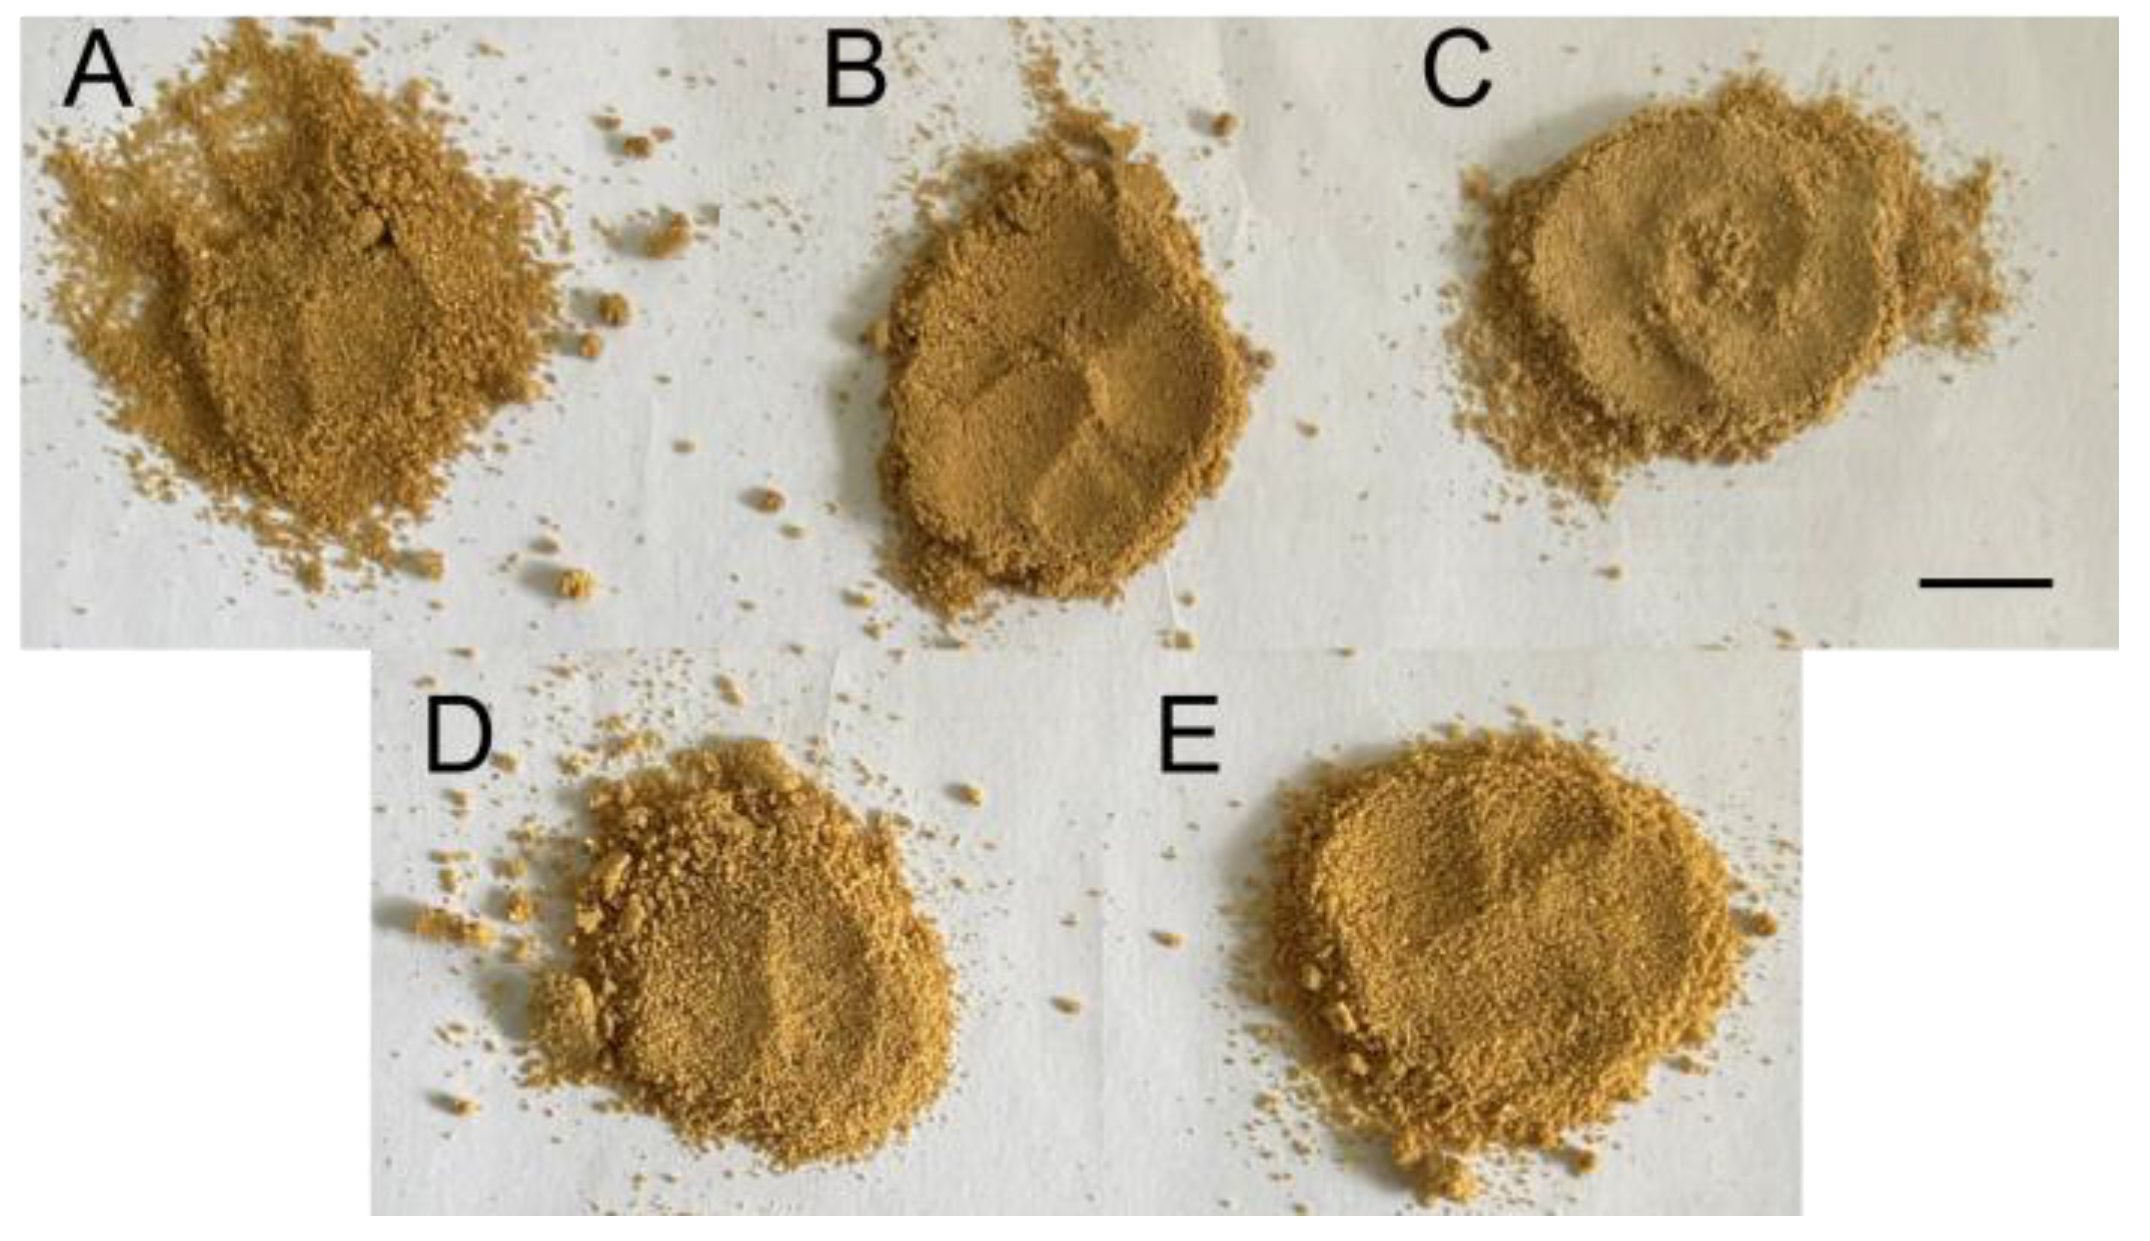
2.1. Sample Collection and Processing
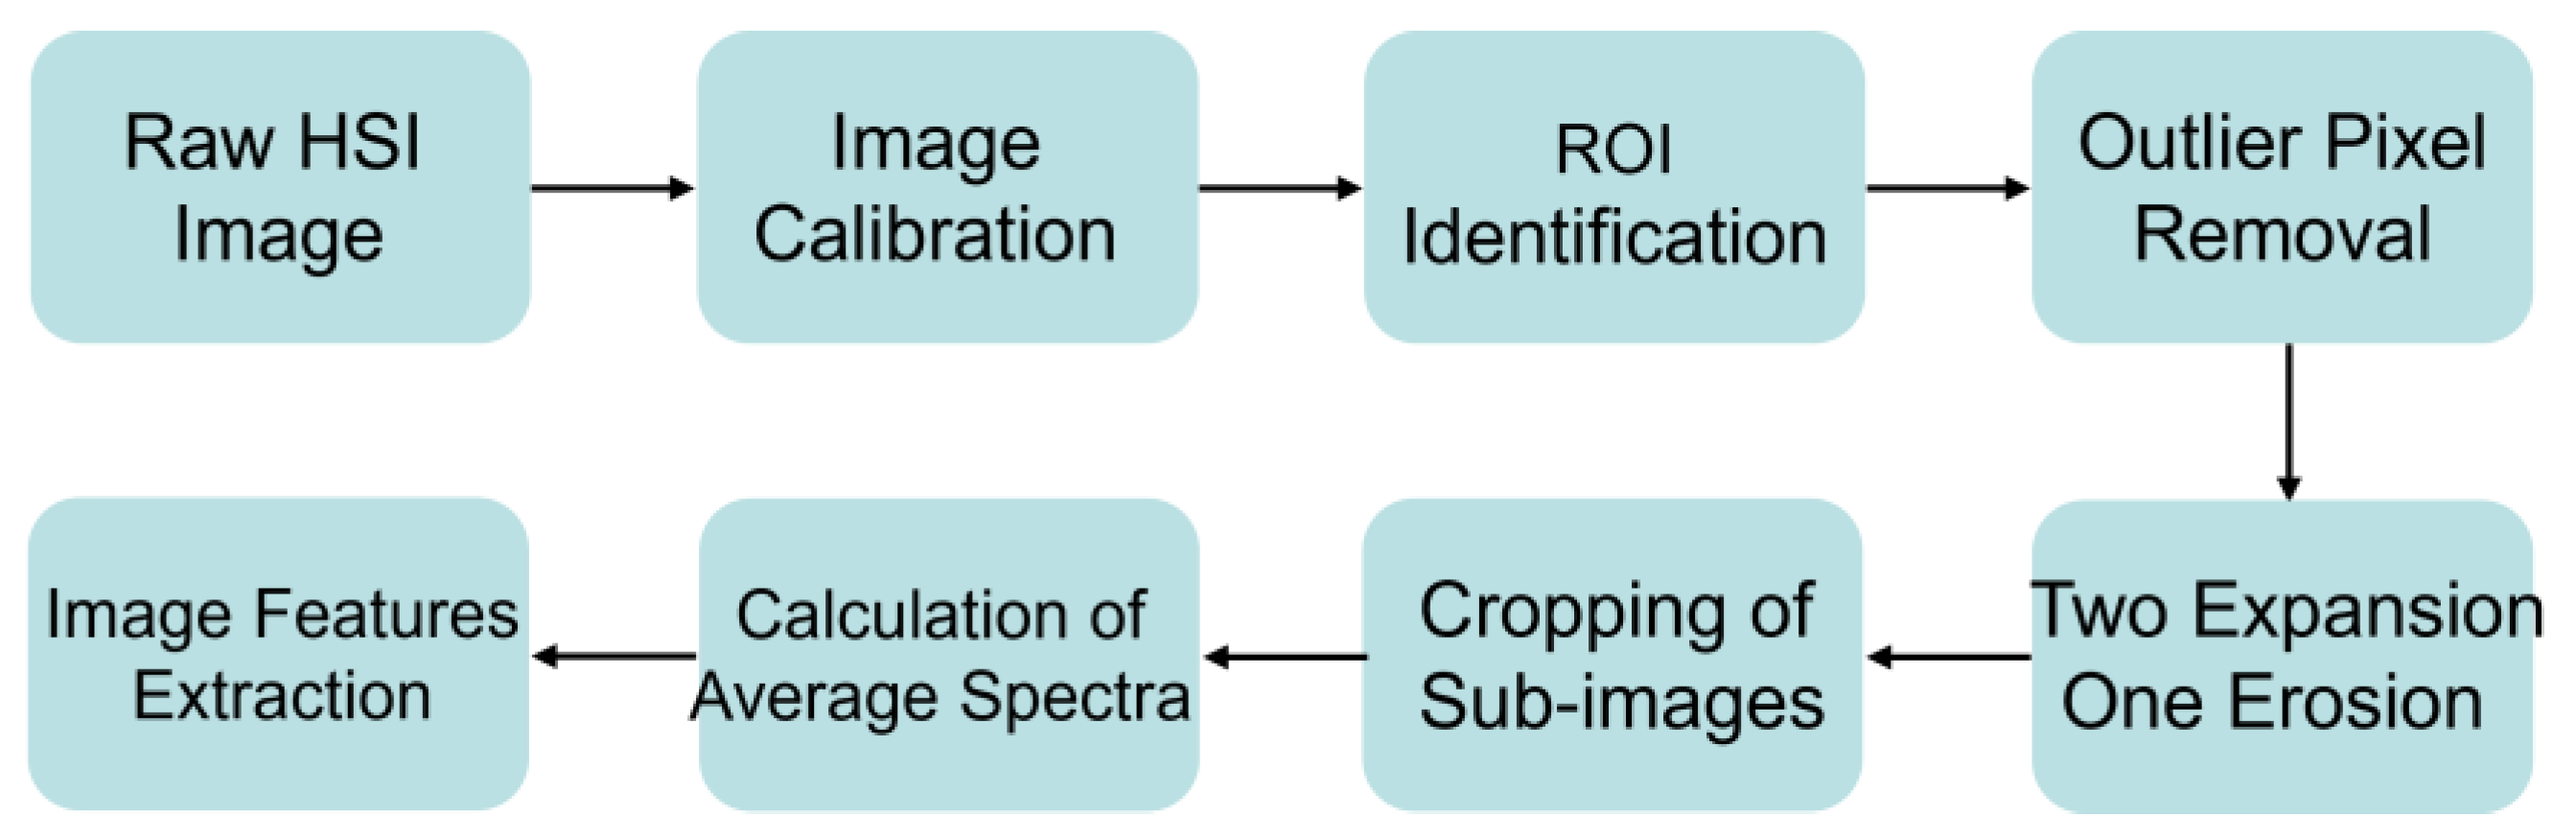
2.2. Spectral Acquisition and Image Feature Extraction
2.3. Preprocessing and Feature Variable Extraction
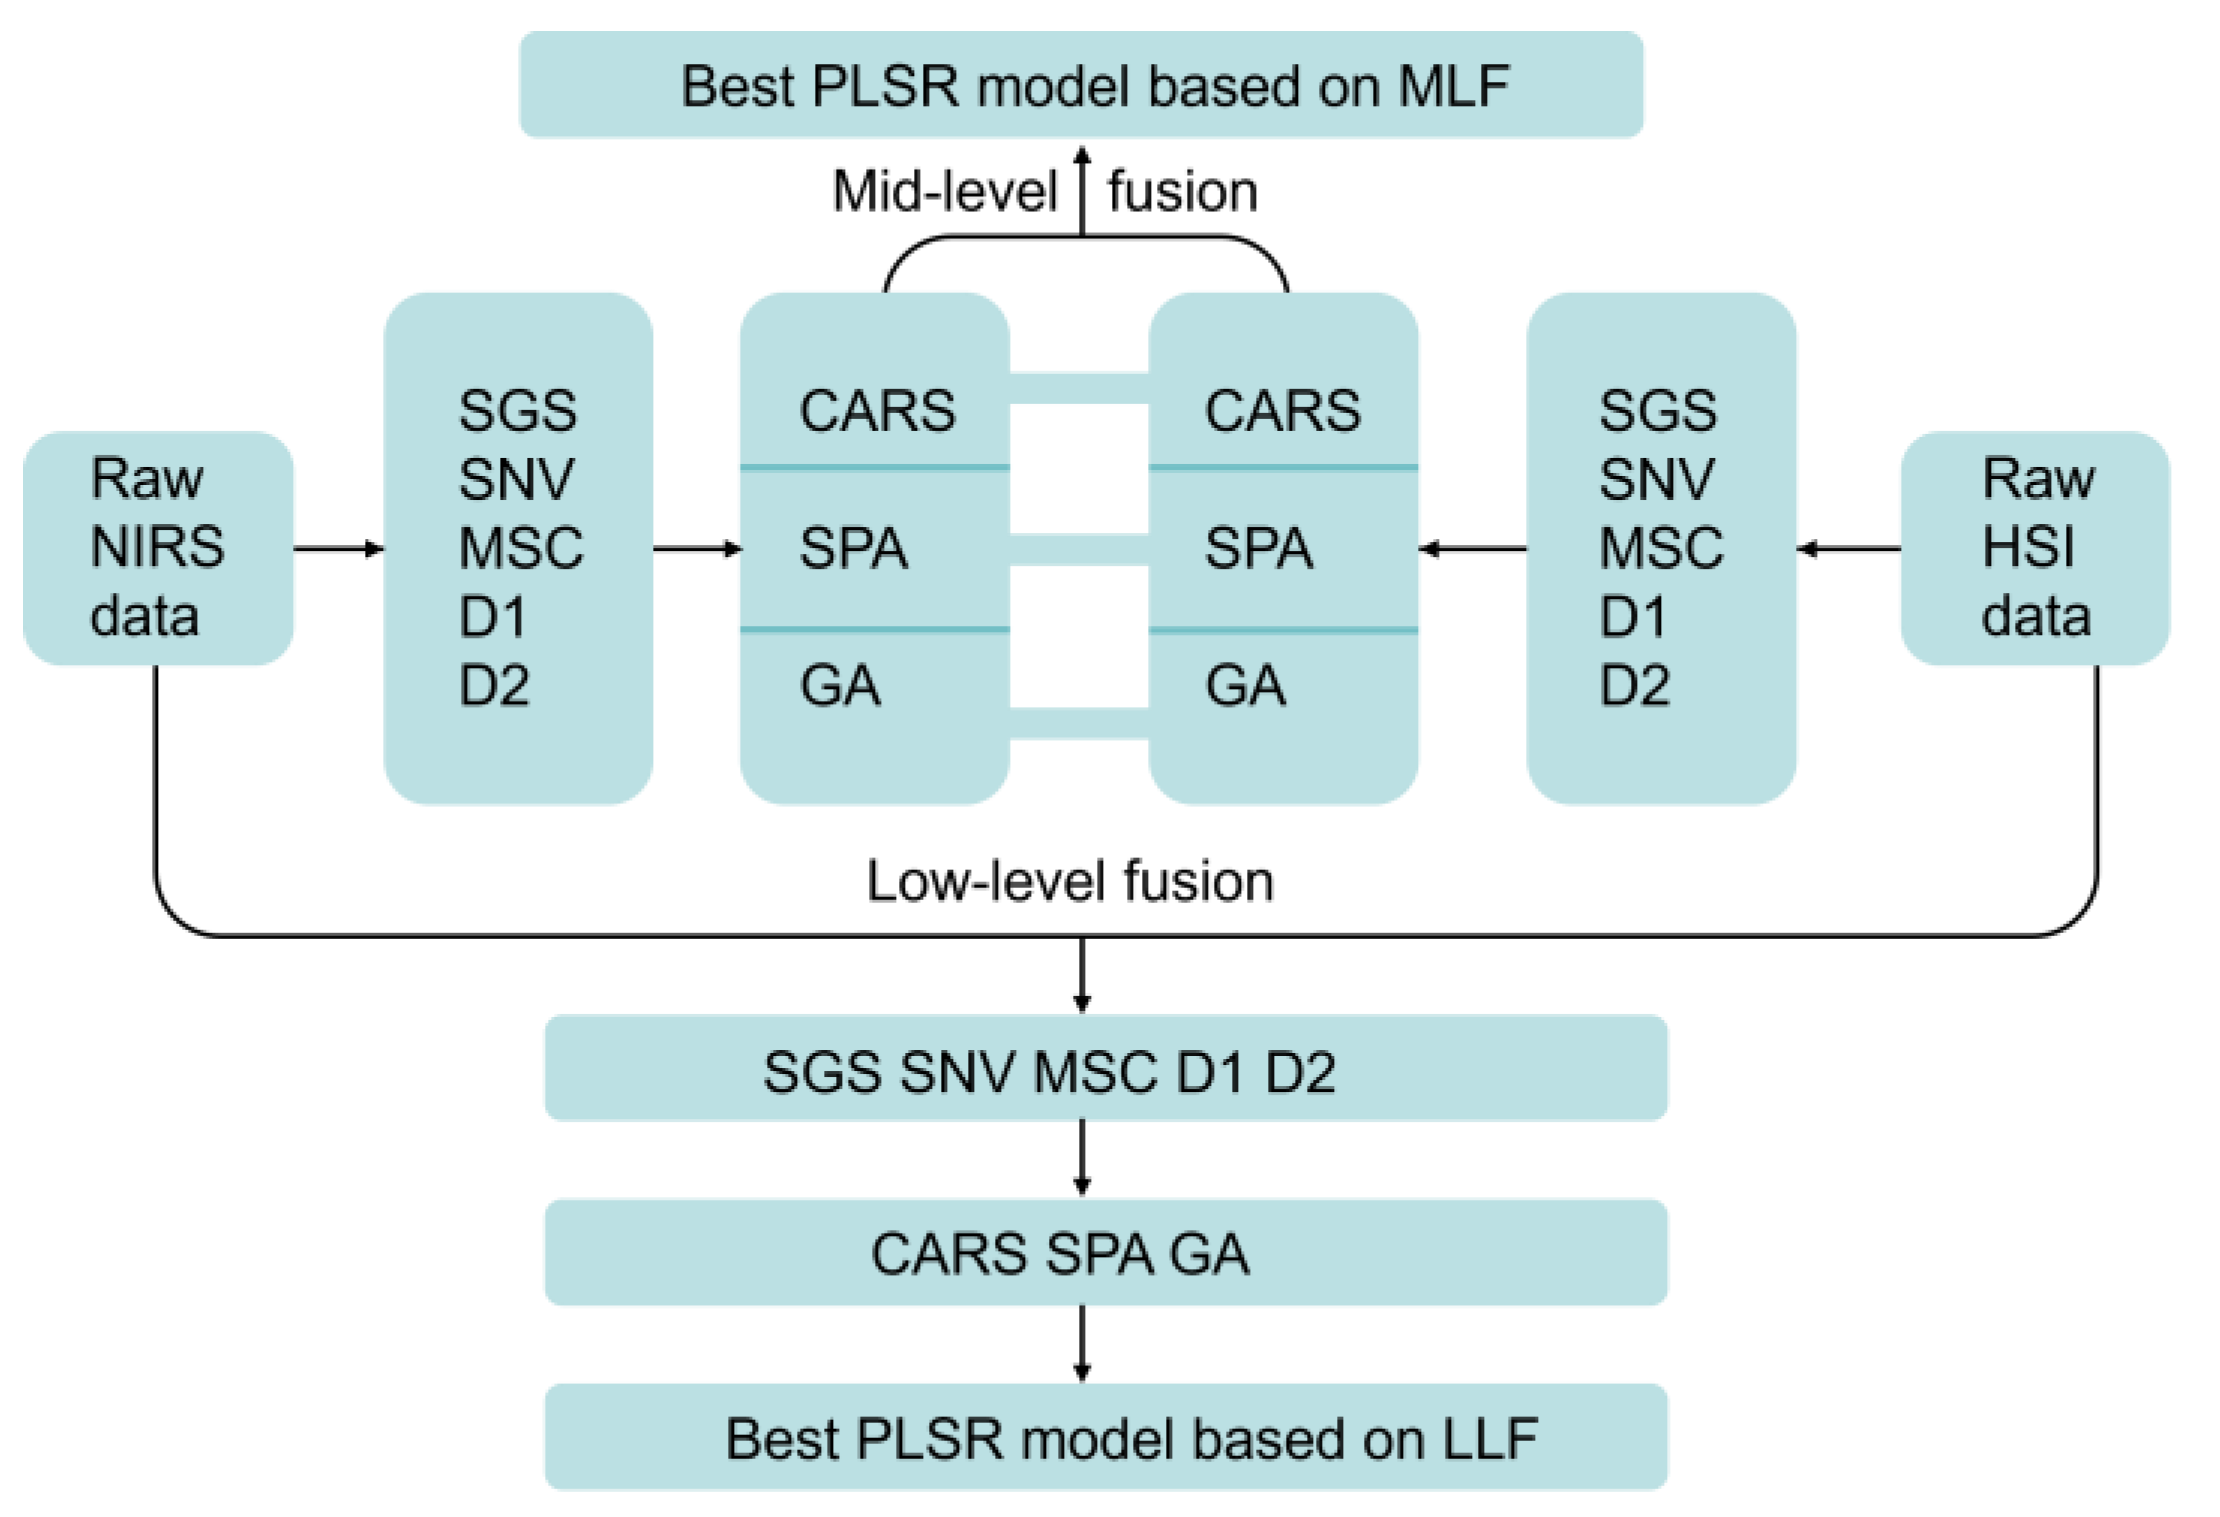
2.4. Data and Image Feature Fusions
2.5. Data Set Partitioning and Quantitative Analysis Methods
2.6. Software
3. Results and Discussion
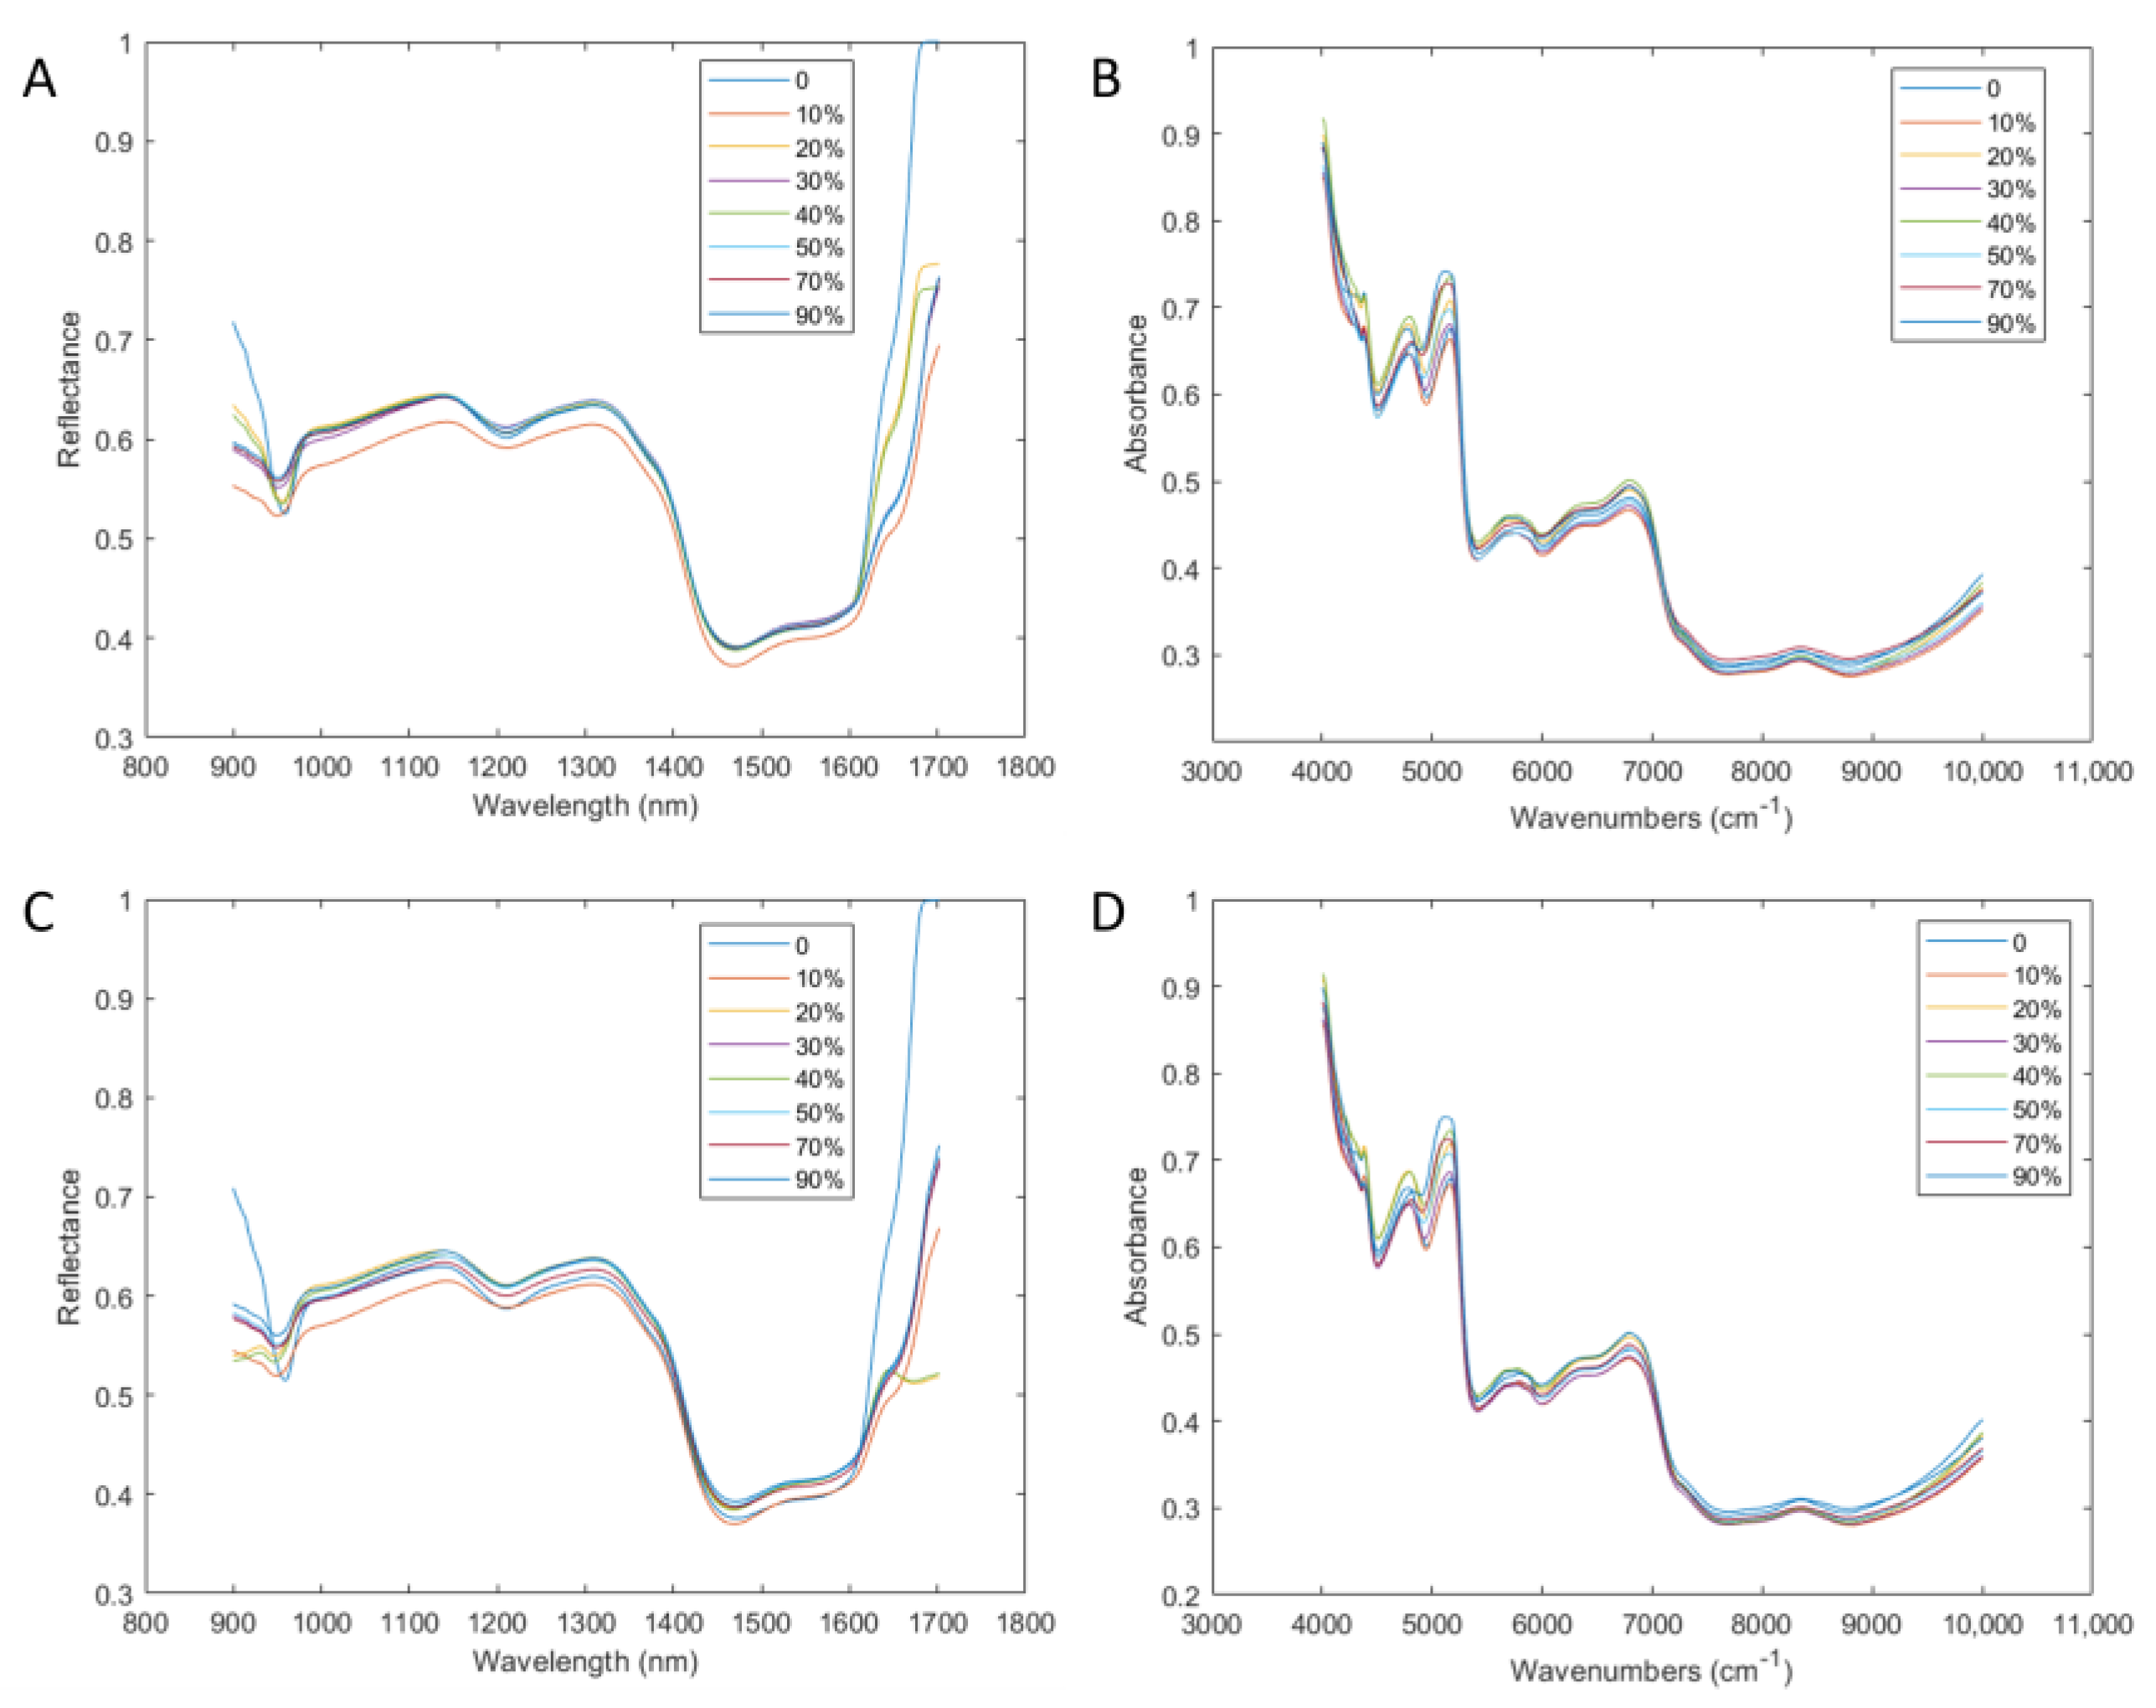
3.1. Sample and Spectral Analysis
3.2. Quantitative Analysis Based on NIRS Data and Image Features
3.3. Quantitative Analysis Based on HSI Data and Image Features
3.4. Quantitative Analysis Based on LLF Data and Image Features
3.5. Quantitative Analysis Based on MLF Data and Image Features
3.6. Analysis of Feature Variables
4. Conclusions
Supplementary Materials
Author Contributions
Funding
Data Availability Statement
Conflicts of Interest
References
- Liu, C.; Song, C.; Wang, Y.; Xiao, Y.; Zhou, Z.; Cao, G.; Sun, X.; Liu, Y. Deep-fried Atractylodes lancea rhizome alleviates spleen deficiency diarrhea–induced short-chain fatty acid metabolic disorder in mice by remodeling the intestinal flora. J. Ethnopharmacol. 2023, 303, 115967. [Google Scholar] [CrossRef] [PubMed]
- Zhang, Q.; Yang, C.; Ma, S.; Guo, S.; Hu, X.; Zhou, Z.; Liu, Y.; Zhang, X.; Jiang, R.; Zhang, Z.; et al. Shiwei Qingwen decoction regulates TLR4/NF-κB signaling pathway and NLRP3 inflammasome to reduce inflammatory response in lipopolysaccharide-induced acute lung injury. J. Ethnopharmacol. 2023, 313, 116615. [Google Scholar] [CrossRef]
- Li, C.; Wang, C.; Guo, Y.; Wen, R.; Yan, L.; Zhang, F.; Gong, Q.; Yu, H. Research on the effect and underlying molecular mechanism of Cangzhu in the treatment of gouty arthritis. Eur. J. Pharmacol. 2022, 927, 175044. [Google Scholar] [CrossRef]
- Xu, W.; Lu, R.; Li, J.; Xia, M.; Chen, G.; Li, P. Comparative plastome analyses and evolutionary relationships of all species and cultivars within the medicinal plant genus Atractylodes. Ind. Crops Prod. 2023, 201, 116974. [Google Scholar] [CrossRef]
- Liu, Y.; Zhang, B.; Cai, Q. Study on the pharmacodynamics and metabolomics of five medicinal species in Atractylodes DC. on rats with rheumatoid arthritis. Biomed. Pharmacother. 2020, 131, 110554. [Google Scholar] [CrossRef] [PubMed]
- Gu, X.; Jin, Y.; Dong, F.; Cai, Y.; You, Z.; You, J.; Zhang, L.; Du, S. Toward rapid analysis, forecast and discovery of bioactive compounds from herbs by jointly using thin layer chromatography and ratiometric surface-enhanced Raman spectroscopy technique. J. Pharm. Biomed. Anal. 2018, 153, 9–15. [Google Scholar] [CrossRef] [PubMed]
- Zhao, Y.; Chang, X.; Gu, X.; Li, Y.; Zheng, Y.; Fang, H. Predictive analysis of quality markers of Atractylodis Rhizoma based on fingerprint and network pharmacology. J. AOAC Int. 2023, 106, qsad059. [Google Scholar] [CrossRef]
- Xin, T.; Xu, Z.; Jia, J.; Leon, C.; Hu, S.; Lin, Y.; Ragupathy, S.; Song, J.; Newmaster, S.G. Biomonitoring for traditional herbal medicinal products using DNA metabarcoding and single molecule, real-time sequencing. Acta Pharm. Sin. B 2018, 8, 488–497. [Google Scholar] [CrossRef]
- Yu, D.; Guo, S.; Zhang, X.; Yan, H.; Zhang, Z.; Chen, X.; Chen, J.; Jin, S.; Yang, J.; Duan, J. Rapid detection of adulteration in powder of ginger (Zingiber officinale Roscoe) by FT-NIR spectroscopy combined with chemometrics. Food Chem. X 2022, 15, 100450. [Google Scholar] [CrossRef]
- Shi, X.; Gan, X.; Wang, X.; Peng, J.; Li, Z.; Wu, X.; Shao, Q.; Zhang, A. Rapid detection of Ganoderma lucidum spore powder adulterated with dyed starch by NIR spectroscopy and chemometrics. LWT 2022, 167, 113829. [Google Scholar] [CrossRef]
- Yang, H.; Bao, L.; Liu, Y.; Luo, S.; Zhao, F.; Chen, G.; Liu, F. Identification and quantitative analysis of salt-adulterated honeysuckle using infrared spectroscopy coupled with multi-chemometrics. Microchem. J. 2021, 171, 106829. [Google Scholar] [CrossRef]
- Steene, J.; Ruyssinck, J.; Fernandez-Pierna, J.; Vandermeersch, L.; Maes, A.; Langenhove, H.; Walgraeve, C.; Demeestere, K.; Meulenaer, B.; Jacxsens, L.; et al. Authenticity analysis of oregano: Development, validation and fitness for use of several food fingerprinting techniques. Food Res. Int. 2022, 162, 111962. [Google Scholar] [CrossRef]
- Hashemi-Nasab, F.S.; Talebian, S.; Parastar, H. Multiple adulterants detection in turmeric powder using Vis-SWNIR hyperspectral imaging followed by multivariate curve resolution and classification techniques. Microchem. J. 2023, 185, 108203. [Google Scholar] [CrossRef]
- Hashemi-Nasab, F.S.; Parastar, H. Vis-NIR hyperspectral imaging coupled with independent component analysis for saffron authentication. Food Chem. 2022, 393, 133450. [Google Scholar] [CrossRef] [PubMed]
- Steene, J.; Ruyssinck, J.; Fernandez-Pierna, J.; Vandermeersch, L.; Maes, A.; Langenhove, H.; Walgraeve, C.; Demeestere, K.; Meulenaer, B.; Jacxsens, L.; et al. Fingerprinting methods for origin and variety assessment of rice: Development, validation and data fusion experiments. Food Control 2023, 151, 109780. [Google Scholar] [CrossRef]
- Esquerre, C.A.; Achata, E.M.; García-Vaquero, M.; Zhang, Z.; Tiwari, B.K.; O’Donnell, C.P. Use of an NIR MEMS spectrophotometer and visible/NIR hyperspectral imaging systems to predict quality parameters of treated ground peppercorns. LWT 2020, 131, 109761. [Google Scholar] [CrossRef]
- Ye, W.; Xu, W.; Yan, T.; Yan, J.; Gao, P.; Zhang, C. Application of near-infrared spectroscopy and hyperspectral imaging combined with machine learning algorithms for quality inspection of grape: A Review. Foods 2023, 12, 132. [Google Scholar] [CrossRef]
- Jiang, Z.; Jin, K.; Zhong, L.; Zheng, Y.; Shao, Q.; Zhang, A. Near-infrared spectroscopy combined with machine learning for rapid identification of Atractylodis rhizoma decoction pieces. Ind. Crops Prod. 2023, 197, 116579. [Google Scholar] [CrossRef]
- Lei, L.; Ke, C.; Xiao, K.; Qu, L.; Lin, X.; Zhan, X.; Tu, J.; Xu, K.; Liu, Y. Identification of different bran-fried Atractylodis Rhizoma and prediction of atractylodin content based on multivariate data mining combined with intelligent color recognition and near-infrared spectroscopy. Spectrochim. Acta. A Mol. Biomol. Spectrosc. 2021, 262, 120119. [Google Scholar] [CrossRef] [PubMed]
- Wang, H.P.; Chen, P.; Dai, J.W.; Liu, D.; Li, J.Y.; Xu, Y.P.; Chu, X.L. Recent advances of chemometric calibration methods in modern spectroscopy: Algorithms, strategy, and related issues. TrAC Trends Anal. Chem. 2022, 153, 116648. [Google Scholar] [CrossRef]
- Li, X.; Cai, M.; Li, M.; Wei, X.; Liu, Z.; Wang, J.; Jia, K.; Han, Y. Combining Vis-NIR and NIR hyperspectral imaging techniques with a data fusion strategy for the rapid qualitative evaluation of multiple qualities in chicken. Food Control 2023, 145, 109416. [Google Scholar] [CrossRef]
- Jiang, X.; Tian, J.; Huang, H.; Hu, X.; Han, L.; Huang, D.; Luo, H. Nondestructive visualization and quantification of total acid and reducing sugar contents in fermented grains by combining spectral and color data through hyperspectral imaging. Food Chem. 2022, 386, 132779. [Google Scholar] [CrossRef]
- Rady, A.M.; Adedeji, A.; Watson, N.J. Feasibility of utilizing color imaging and machine learning for adulteration detection in minced meat. J. Agric. Food Res. 2021, 6, 100251. [Google Scholar] [CrossRef]
- ElManawy, A.; Sun, D.; Abdalla, A.; Zhu, Y.; Cen, H. HSI-PP: A flexible open-source software for hyperspectral imaging-based plant phenotyping. Comput. Electron. Agric. 2022, 200, 107248. [Google Scholar] [CrossRef]
- He, H.; Chen, Y.; Li, G.; Wang, Y.; Ou, X.; Guo, J. Hyperspectral imaging combined with chemometrics for rapid detection of talcum powder adulterated in wheat flour. Food Control 2023, 144, 109378. [Google Scholar] [CrossRef]
- Dong, J.E.; Li, J.; Liu, H.; Wang, Y.Z. Machine learning and deep learning based on the small FT-MIR dataset for fine-grained sampling site recognition of boletus tomentipes. Food Res. Int. 2023, 167, 112679. [Google Scholar] [CrossRef] [PubMed]
- Xu, S.; Zhao, Y.; Wang, M.; Shi, X. Determination of rice root density from Vis–NIR spectroscopy by support vector machine regression and spectral variable selection techniques. Catena 2017, 157, 12–23. [Google Scholar] [CrossRef]
- Yu, H.D.; Qing, L.W.; Yan, D.T.; Xia, G.; Zhang, C.; Yun, Y.H.; Zhang, W. Hyperspectral imaging in combination with data fusion for rapid evaluation of tilapia fillet freshness. Food Chem. 2021, 348, 129129. [Google Scholar] [CrossRef]
- Wu, S.; Wang, L.; Zhou, G.; Liu, C.; Ji, Z.; Li, Z.; Li, W. Strategies for the content determination of capsaicin and the identification of adulterated pepper powder using a hand-held near-infrared spectrometer. Food Res. Int. 2023, 163, 112192. [Google Scholar] [CrossRef] [PubMed]
- Wang, C.; Sun, Y.; Zhou, Y.; Cui, Y.; Yao, W.; Yu, H.; Guo, Y.; Xie, Y. Dynamic monitoring oxidation process of nut oils through Raman technology combined with PLSR and RF-PLSR model. LWT 2021, 146, 111290. [Google Scholar] [CrossRef]
- Zhu, J.; Fan, X.; Han, L.; Zhang, C.; Wang, J.; Pan, L.; Tu, K.; Peng, J.; Zhang, M. Quantitative analysis of caprolactam in sauce-based food using infrared spectroscopy combined with data fusion strategies. J. Food Compos. Anal. 2021, 104, 104130. [Google Scholar] [CrossRef]
- Tian, S.; Liu, W.; Xu, H. Improving the prediction performance of soluble solids content (SSC) in kiwifruit by means of near-infrared spectroscopy using slope/bias correction and calibration updating. Food Res. Int. 2023, 170, 112988. [Google Scholar] [CrossRef]
- Saha, D.; Senthilkumar, T.; Singh, C.B.; Manickavasagan, A. Quantitative detection of metanil yellow adulteration in chickpea flour using line-scan near-infrared hyperspectral imaging with partial least square regression and one-dimensional convolutional neural network. J. Food Compos. Anal. 2023, 120, 105290. [Google Scholar] [CrossRef]
- Torres, I.; Sánchez, M.; Vega-Castellote, M.; Pérez-Marín, D. Fraud detection in batches of sweet almonds by portable near-infrared spectral devices. Foods 2021, 10, 1221. [Google Scholar] [CrossRef] [PubMed]
- Zhao, T.; Chen, M.; Jiang, X.; Shen, F.; He, X.; Fang, Y.; Liu, Q.; Hu, Q. Integration of spectra and image features of Vis/NIR hyperspectral imaging for prediction of deoxynivalenol contamination in whole wheat flour. Infrared Phys. Technol. 2020, 109, 103426. [Google Scholar] [CrossRef]
- Azadnia, R.; Rajabipour, A.; Jamshidi, B.; Omid, M. New approach for rapid estimation of leaf nitrogen, phosphorus, and potassium contents in apple-trees using Vis/NIR spectroscopy based on wavelength selection coupled with machine learning. Comput. Electron. Agric. 2023, 207, 107746. [Google Scholar] [CrossRef]
- An, H.; Zhai, C.; Zhang, F.; Ma, Q.; Sun, J.; Tang, Y.; Wang, W. Quantitative analysis of Chinese steamed bread staling using NIR, MIR, and Raman spectral data fusion. Food Chem. 2023, 405, 134821. [Google Scholar] [CrossRef]
- Xu, P.; Fu, L.; Xu, K.; Sun, W.; Tan, Q.; Zhang, Y.; Zha, X.; Yang, R. Investigation into maize seed disease identification based on deep learning and multi-source spectral information fusion techniques. J. Food Compos. Anal. 2023, 119, 105254. [Google Scholar] [CrossRef]
- Khamsopha, D.; Woranitta, S.; Teerachaichayut, S. Utilizing near infrared hyperspectral imaging for quantitatively predicting adulteration in tapioca starch. Food Control 2021, 123, 107781. [Google Scholar] [CrossRef]
- Pudełko, A.; Chodak, M.; Roemer, J.; Uhl, T. Application of FT-NIR spectroscopy and NIR hyperspectral imaging to predict nitrogen and organic carbon contents in mine soils. Measurement 2020, 164, 108117. [Google Scholar] [CrossRef]
- Cai, Z.; Huang, Z.; He, M.; Li, C.; Qi, H.; Peng, J.; Zhou, F.; Zhang, C. Identification of geographical origins of Radix Paeoniae Alba using hyperspectral imaging with deep learning-based fusion approaches. Food Chem. 2023, 422, 136169. [Google Scholar] [CrossRef] [PubMed]
- Castro, R.C.; Ribeiro, D.S.M.; Santos, J.L.M.; Páscoa, R.N.M.J. Authentication/discrimination, identification and quantification of cinnamon adulterants using NIR spectroscopy and different chemometric tools: A tutorial to deal with counterfeit samples. Food Control 2023, 147, 109619. [Google Scholar] [CrossRef]
- Assis, C.; Gama, E.M.; Nascentes, C.C.; Oliveira, L.S.; Anzanello, M.J.; Sena, M.M. A data fusion model merging information from near infrared spectroscopy and X-ray fluorescence. Searching for atomic-molecular correlations to predict and characterize the composition of coffee blends. Food Chem. 2020, 325, 126953. [Google Scholar] [CrossRef] [PubMed]
- Arndt, M.; Rurik, M.; Drees, A.; Bigdowski, K.; Kohlbacher, O.; Fischer, M. Comparison of different sample preparation techniques for NIR screening and their influence on the geographical origin determination of almonds (Prunus dulcis MILL.). Food Control 2020, 115, 107302. [Google Scholar] [CrossRef]

| Object | Data | Method | Principal Components Number | Variables Number | R2T (%) | RMSET (%) | R2P (%) | RMSEP (%) |
|---|---|---|---|---|---|---|---|---|
| Adulterated AC | NIRS | Raw data | 21 | 1557 | 95.32 | 8.63 | 95.00 | 8.89 |
| SGS | 20 | 1557 | 97.21 | 6.79 | 96.82 | 6.83 | ||
| SNV | 21 | 1557 | 97.72 | 6.20 | 95.88 | 7.51 | ||
| MSC | 20 | 1557 | 97.76 | 5.82 | 96.90 | 7.73 | ||
| 1 Der | 15 | 1557 | 99.77 | 1.94 | 97.61 | 6.60 | ||
| 2 Der | 9 | 1557 | 99.98 | 0.60 | 87.45 | 15.53 | ||
| 1 Der + CARS | 10 | 76 | 99.04 | 3.91 | 97.34 | 6.88 | ||
| 1 Der + SPA | 4 | 74 | 93.96 | 9.93 | 86.49 | 14.25 | ||
| 1 Der + GA | 7 | 24 | 95.87 | 8.45 | 90.33 | 9.90 | ||
| 1 Der + CARS + CF | 15 | 85 | 99.06 | 3.87 | 98.50 | 5.14 | ||
| 1 Der + CARS + TF | 32 | 124 | 98.99 | 4.09 | 98.07 | 5.31 | ||
| 1 Der + CARS + C-TF | 42 | 133 | 98.96 | 4.14 | 97.77 | 5.81 | ||
| HSI | Raw data | 22 | 512 | 81.92 | 16.39 | 79.99 | 17.24 | |
| SGS | 21 | 512 | 81.68 | 16.39 | 81.42 | 17.15 | ||
| SNV | 21 | 512 | 83.71 | 15.30 | 77.17 | 19.58 | ||
| MSC | 20 | 512 | 83.69 | 15.70 | 81.27 | 16.47 | ||
| 1 Der | 12 | 512 | 86.90 | 14.31 | 84.44 | 14.62 | ||
| 2 Der | 9 | 512 | 88.25 | 12.97 | 88.35 | 15.39 | ||
| 2 Der + CARS | 5 | 29 | 85.66 | 14.32 | 85.06 | 15.78 | ||
| 2 Der + SPA | 10 | 76 | 89.99 | 12.65 | 85.59 | 15.16 | ||
| 2 Der + GA | 3 | 10 | 84.59 | 14.93 | 80.86 | 18.00 | ||
| 2 Der + SPA + CF | 19 | 85 | 93.46 | 9.58 | 90.48 | 14.59 | ||
| 2 Der + SPA + TF | 15 | 124 | 88.13 | 13.39 | 81.30 | 17.62 | ||
| 2 Der + SPA + C-TF | 11 | 133 | 90.39 | 11.83 | 86.13 | 16.38 | ||
| LLF | Raw data | 24 | 2069 | 96.00 | 7.89 | 95.55 | 8.80 | |
| SGS | 27 | 2069 | 97.36 | 6.50 | 96.58 | 7.52 | ||
| SNV | 21 | 2069 | 98.53 | 4.90 | 97.14 | 7.36 | ||
| MSC | 29 | 2069 | 98.70 | 4.60 | 95.19 | 8.86 | ||
| 1 Der | 27 | 2069 | 99.92 | 1.15 | 97.71 | 6.73 | ||
| 2 Der | 15 | 2069 | 99.72 | 2.14 | 91.63 | 11.58 | ||
| 1 Der + CARS | 10 | 22 | 96.54 | 7.61 | 94.87 | 8.12 | ||
| 1 Der + SPA | 24 | 117 | 99.12 | 5.56 | 96.37 | 7.91 | ||
| 1 Der + GA | 15 | 75 | 98.02 | 5.63 | 94.03 | 10.73 | ||
| 1 Der + SPA + CF | 26 | 126 | 98.52 | 4.93 | 96.16 | 8.07 | ||
| 1 Der + SPA +TF | 35 | 165 | 98.26 | 5.56 | 95.07 | 8.85 | ||
| 1 Der + SPA + C-TF | 34 | 174 | 98.31 | 5.20 | 97.31 | 6.95 | ||
| MLF | CARS | 10 | 105 | 99.15 | 3.61 | 98.17 | 6.55 | |
| SPA | 9 | 150 | 96.44 | 7.61 | 86.24 | 15.81 | ||
| GA | 10 | 34 | 96.58 | 7.50 | 95.40 | 8.30 | ||
| CARS + CF | 16 | 114 | 99.09 | 3.75 | 98.53 | 5.28 | ||
| CARS + TF | 39 | 153 | 99.22 | 3.56 | 98.03 | 5.58 | ||
| CARS + C-TF | 41 | 162 | 99.85 | 1.25 | 98.61 | 5.06 | ||
| Adulterated AL | NIRS | Raw data | 21 | 1557 | 97.81 | 5.93 | 92.45 | 11.73 |
| SGS | 30 | 1557 | 99.66 | 2.24 | 97.60 | 7.08 | ||
| SNV | 29 | 1557 | 99.87 | 1.43 | 96.37 | 8.47 | ||
| MSC | 27 | 1557 | 99.92 | 1.10 | 92.76 | 11.78 | ||
| 1 Der | 11 | 1557 | 98.67 | 4.74 | 82.63 | 14.20 | ||
| 2 Der | 10 | 1557 | 99.90 | 1.26 | 68.16 | 21.09 | ||
| SGS + CARS | 9 | 14 | 91.69 | 11.19 | 86.63 | 15.42 | ||
| SGS + SPA | 10 | 95 | 98.74 | 4.39 | 96.06 | 10.35 | ||
| SGS + GA | 7 | 63 | 97.02 | 6.76 | 93.19 | 12.40 | ||
| SGS + SPA + CF | 11 | 104 | 99.33 | 3.23 | 95.03 | 10.05 | ||
| SGS + SPA + TF | 10 | 143 | 96.19 | 7.53 | 88.57 | 15.05 | ||
| SGS + SPA + C-TF | 13 | 152 | 99.65 | 2.32 | 92.16 | 12.14 | ||
| HSI | Raw data | 21 | 512 | 89.66 | 12.25 | 88.77 | 15.61 | |
| SGS | 23 | 512 | 91.79 | 11.43 | 79.02 | 17.12 | ||
| SNV | 21 | 512 | 94.34 | 9.43 | 87.54 | 14.25 | ||
| MSC | 22 | 512 | 91.11 | 11.83 | 84.70 | 14.98 | ||
| 1 Der | 9 | 512 | 93.43 | 10.11 | 87.15 | 14.23 | ||
| 2 Der | 9 | 512 | 99.12 | 3.69 | 91.66 | 11.58 | ||
| 2 Der + CARS | 6 | 35 | 93.10 | 10.39 | 87.09 | 14.48 | ||
| 2 Der + SPA | 8 | 94 | 98.01 | 5.60 | 88.73 | 13.97 | ||
| 2 Der + GA | 4 | 16 | 86.67 | 13.52 | 85.03 | 17.71 | ||
| 2 Der + SPA + CF | 10 | 103 | 99.66 | 2.38 | 83.00 | 17.21 | ||
| 2 Der + SPA + TF | 9 | 142 | 99.66 | 2.26 | 86.52 | 16.78 | ||
| 2 Der + SPA + C-TF | 9 | 151 | 86.32 | 14.54 | 76.61 | 17.66 | ||
| LLF | Raw data | 36 | 2069 | 98.16 | 5.47 | 91.95 | 12.29 | |
| SGS | 40 | 2069 | 99.81 | 1.75 | 97.19 | 6.37 | ||
| SNV | 33 | 2069 | 99.92 | 1.10 | 95.55 | 10.20 | ||
| MSC | 44 | 2069 | 99.91 | 1.19 | 95.80 | 10.56 | ||
| 1 Der | 11 | 2069 | 99.49 | 2.90 | 92.68 | 10.78 | ||
| 2 Der | 8 | 2069 | 99.14 | 3.72 | 88.86 | 13.27 | ||
| SGS + CARS | 13 | 44 | 93.27 | 10.31 | 86.60 | 14.98 | ||
| SGS + SPA | 30 | 110 | 99.05 | 3.86 | 92.82 | 12.16 | ||
| SGS + GA | 15 | 116 | 98.50 | 4.83 | 92.27 | 13.10 | ||
| SGS + SPA + CF | 24 | 119 | 99.30 | 3.42 | 90.24 | 12.05 | ||
| SGS + SPA + TF | 19 | 158 | 99.51 | 2.79 | 90.94 | 17.42 | ||
| SGS + SPA + C-TF | 20 | 167 | 98.69 | 4.47 | 86.25 | 16.38 | ||
| MLF | CARS | 15 | 49 | 95.80 | 8.11 | 94.34 | 10.07 | |
| SPA | 23 | 189 | 99.62 | 2.37 | 96.22 | 11.00 | ||
| GA | 20 | 79 | 97.95 | 5.54 | 95.13 | 11.17 | ||
| SPA + CF | 23 | 198 | 99.62 | 2.37 | 98.53 | 5.28 | ||
| SPA + TF | 28 | 237 | 99.76 | 2.02 | 97.87 | 5.85 | ||
| SPA + C-TF | 34 | 246 | 99.92 | 1.16 | 99.00 | 2.16 |
Disclaimer/Publisher’s Note: The statements, opinions and data contained in all publications are solely those of the individual author(s) and contributor(s) and not of MDPI and/or the editor(s). MDPI and/or the editor(s) disclaim responsibility for any injury to people or property resulting from any ideas, methods, instructions or products referred to in the content. |
© 2023 by the authors. Licensee MDPI, Basel, Switzerland. This article is an open access article distributed under the terms and conditions of the Creative Commons Attribution (CC BY) license (https://creativecommons.org/licenses/by/4.0/).
Share and Cite
Jiang, Z.; Lv, A.; Zhong, L.; Yang, J.; Xu, X.; Li, Y.; Liu, Y.; Fan, Q.; Shao, Q.; Zhang, A. Rapid Prediction of Adulteration Content in Atractylodis rhizoma Based on Data and Image Features Fusions from Near-Infrared Spectroscopy and Hyperspectral Imaging Techniques. Foods 2023, 12, 2904. https://doi.org/10.3390/foods12152904
Jiang Z, Lv A, Zhong L, Yang J, Xu X, Li Y, Liu Y, Fan Q, Shao Q, Zhang A. Rapid Prediction of Adulteration Content in Atractylodis rhizoma Based on Data and Image Features Fusions from Near-Infrared Spectroscopy and Hyperspectral Imaging Techniques. Foods. 2023; 12(15):2904. https://doi.org/10.3390/foods12152904
Chicago/Turabian StyleJiang, Zhiwei, Aimin Lv, Lingjiao Zhong, Jingjing Yang, Xiaowei Xu, Yuchan Li, Yuchen Liu, Qiuju Fan, Qingsong Shao, and Ailian Zhang. 2023. "Rapid Prediction of Adulteration Content in Atractylodis rhizoma Based on Data and Image Features Fusions from Near-Infrared Spectroscopy and Hyperspectral Imaging Techniques" Foods 12, no. 15: 2904. https://doi.org/10.3390/foods12152904
APA StyleJiang, Z., Lv, A., Zhong, L., Yang, J., Xu, X., Li, Y., Liu, Y., Fan, Q., Shao, Q., & Zhang, A. (2023). Rapid Prediction of Adulteration Content in Atractylodis rhizoma Based on Data and Image Features Fusions from Near-Infrared Spectroscopy and Hyperspectral Imaging Techniques. Foods, 12(15), 2904. https://doi.org/10.3390/foods12152904