
Analysis of Volatile Markers and Their Biotransformation in Raw Chicken during Staphylococcus aureus Early Contamination

Abstract
1. Introduction
2. Materials and Methods
2.1. Materials and Chemicals
2.2. Pretreatment of Chicken
2.3. Volatile Component Analysis by HS-GC-IMS
2.4. HS-SPME-GC-MS Analysis
2.5. Statistical Analysis
3. Results and Discussion
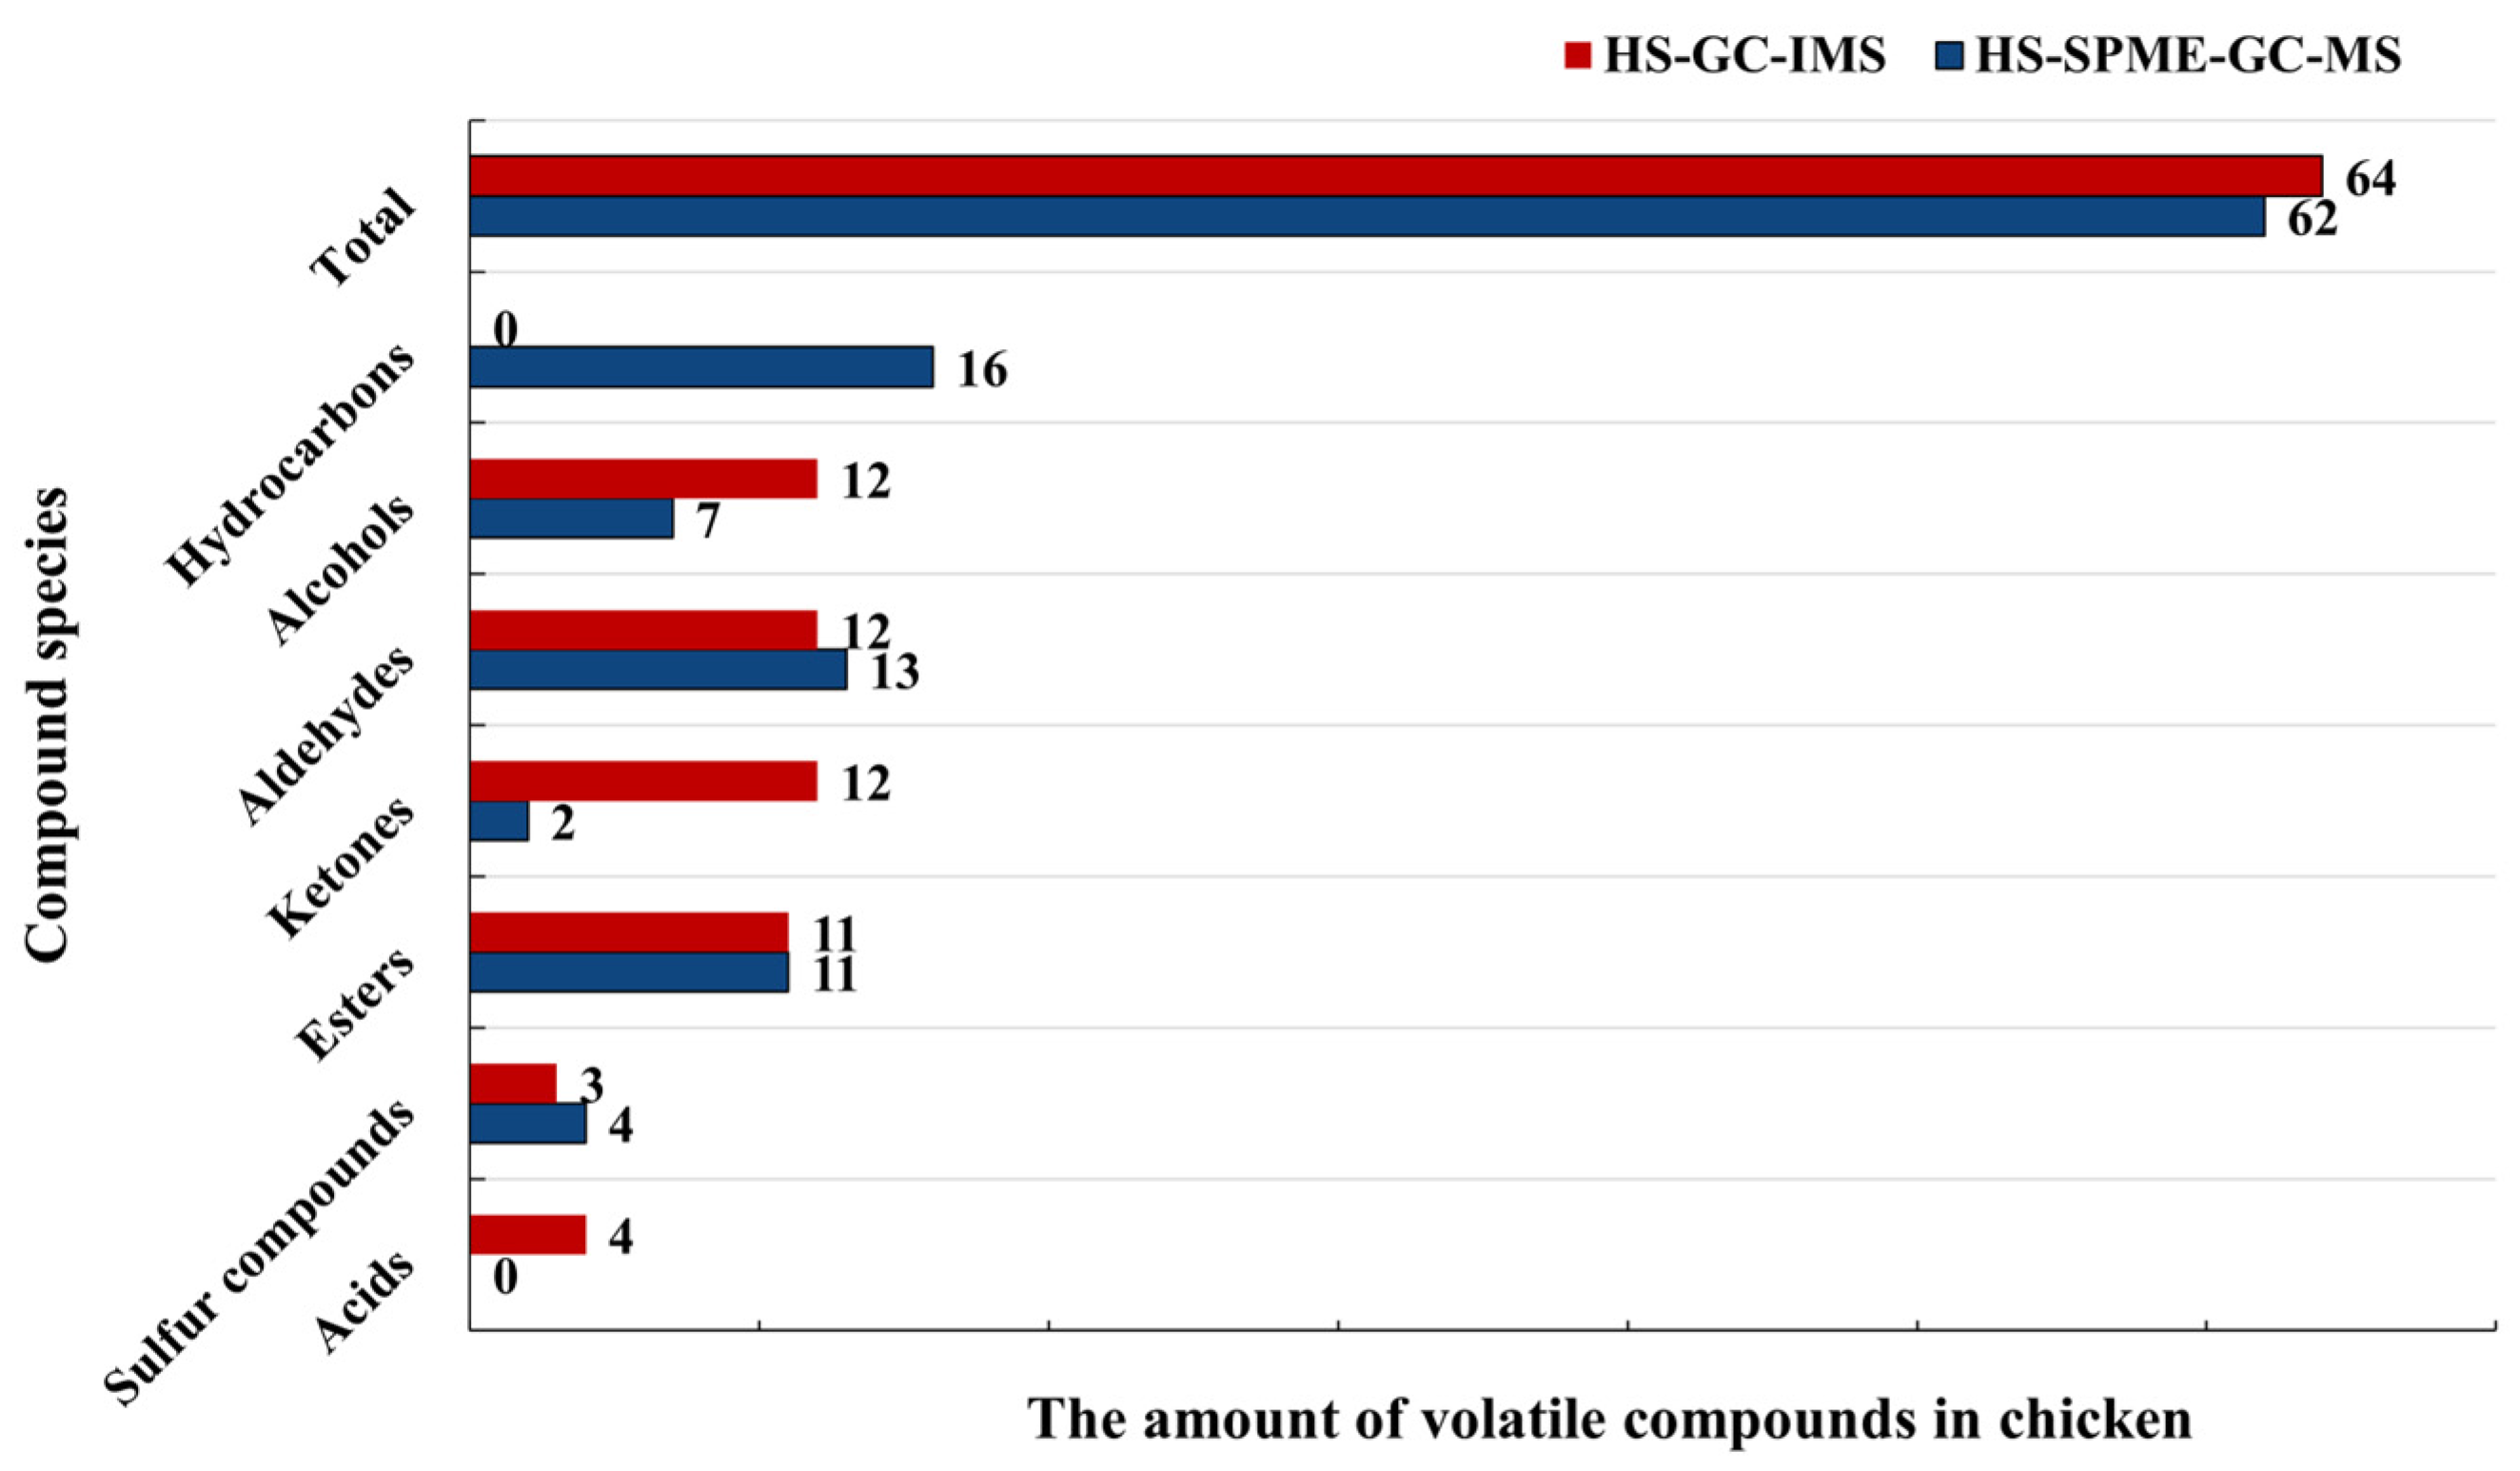
3.1. Qualitative Analysis of Volatile Compounds in Chicken at Different Contamination Times
3.2. Relative Abundance Analysis of Volatile Compounds in Chicken at Different Contamination Times
3.2.1. Analysis of the Relative Content of Volatile Compounds in Chicken Meat by HS-SPME-GC-MS
3.2.2. Analysis of the Relative Abundance of Volatile Compounds in Chicken Meat by HS-GC-IMS
3.3. Different Metabolites Associated with Spoilage Flavour Formation in Chicken Meat
3.3.1. Alcohols
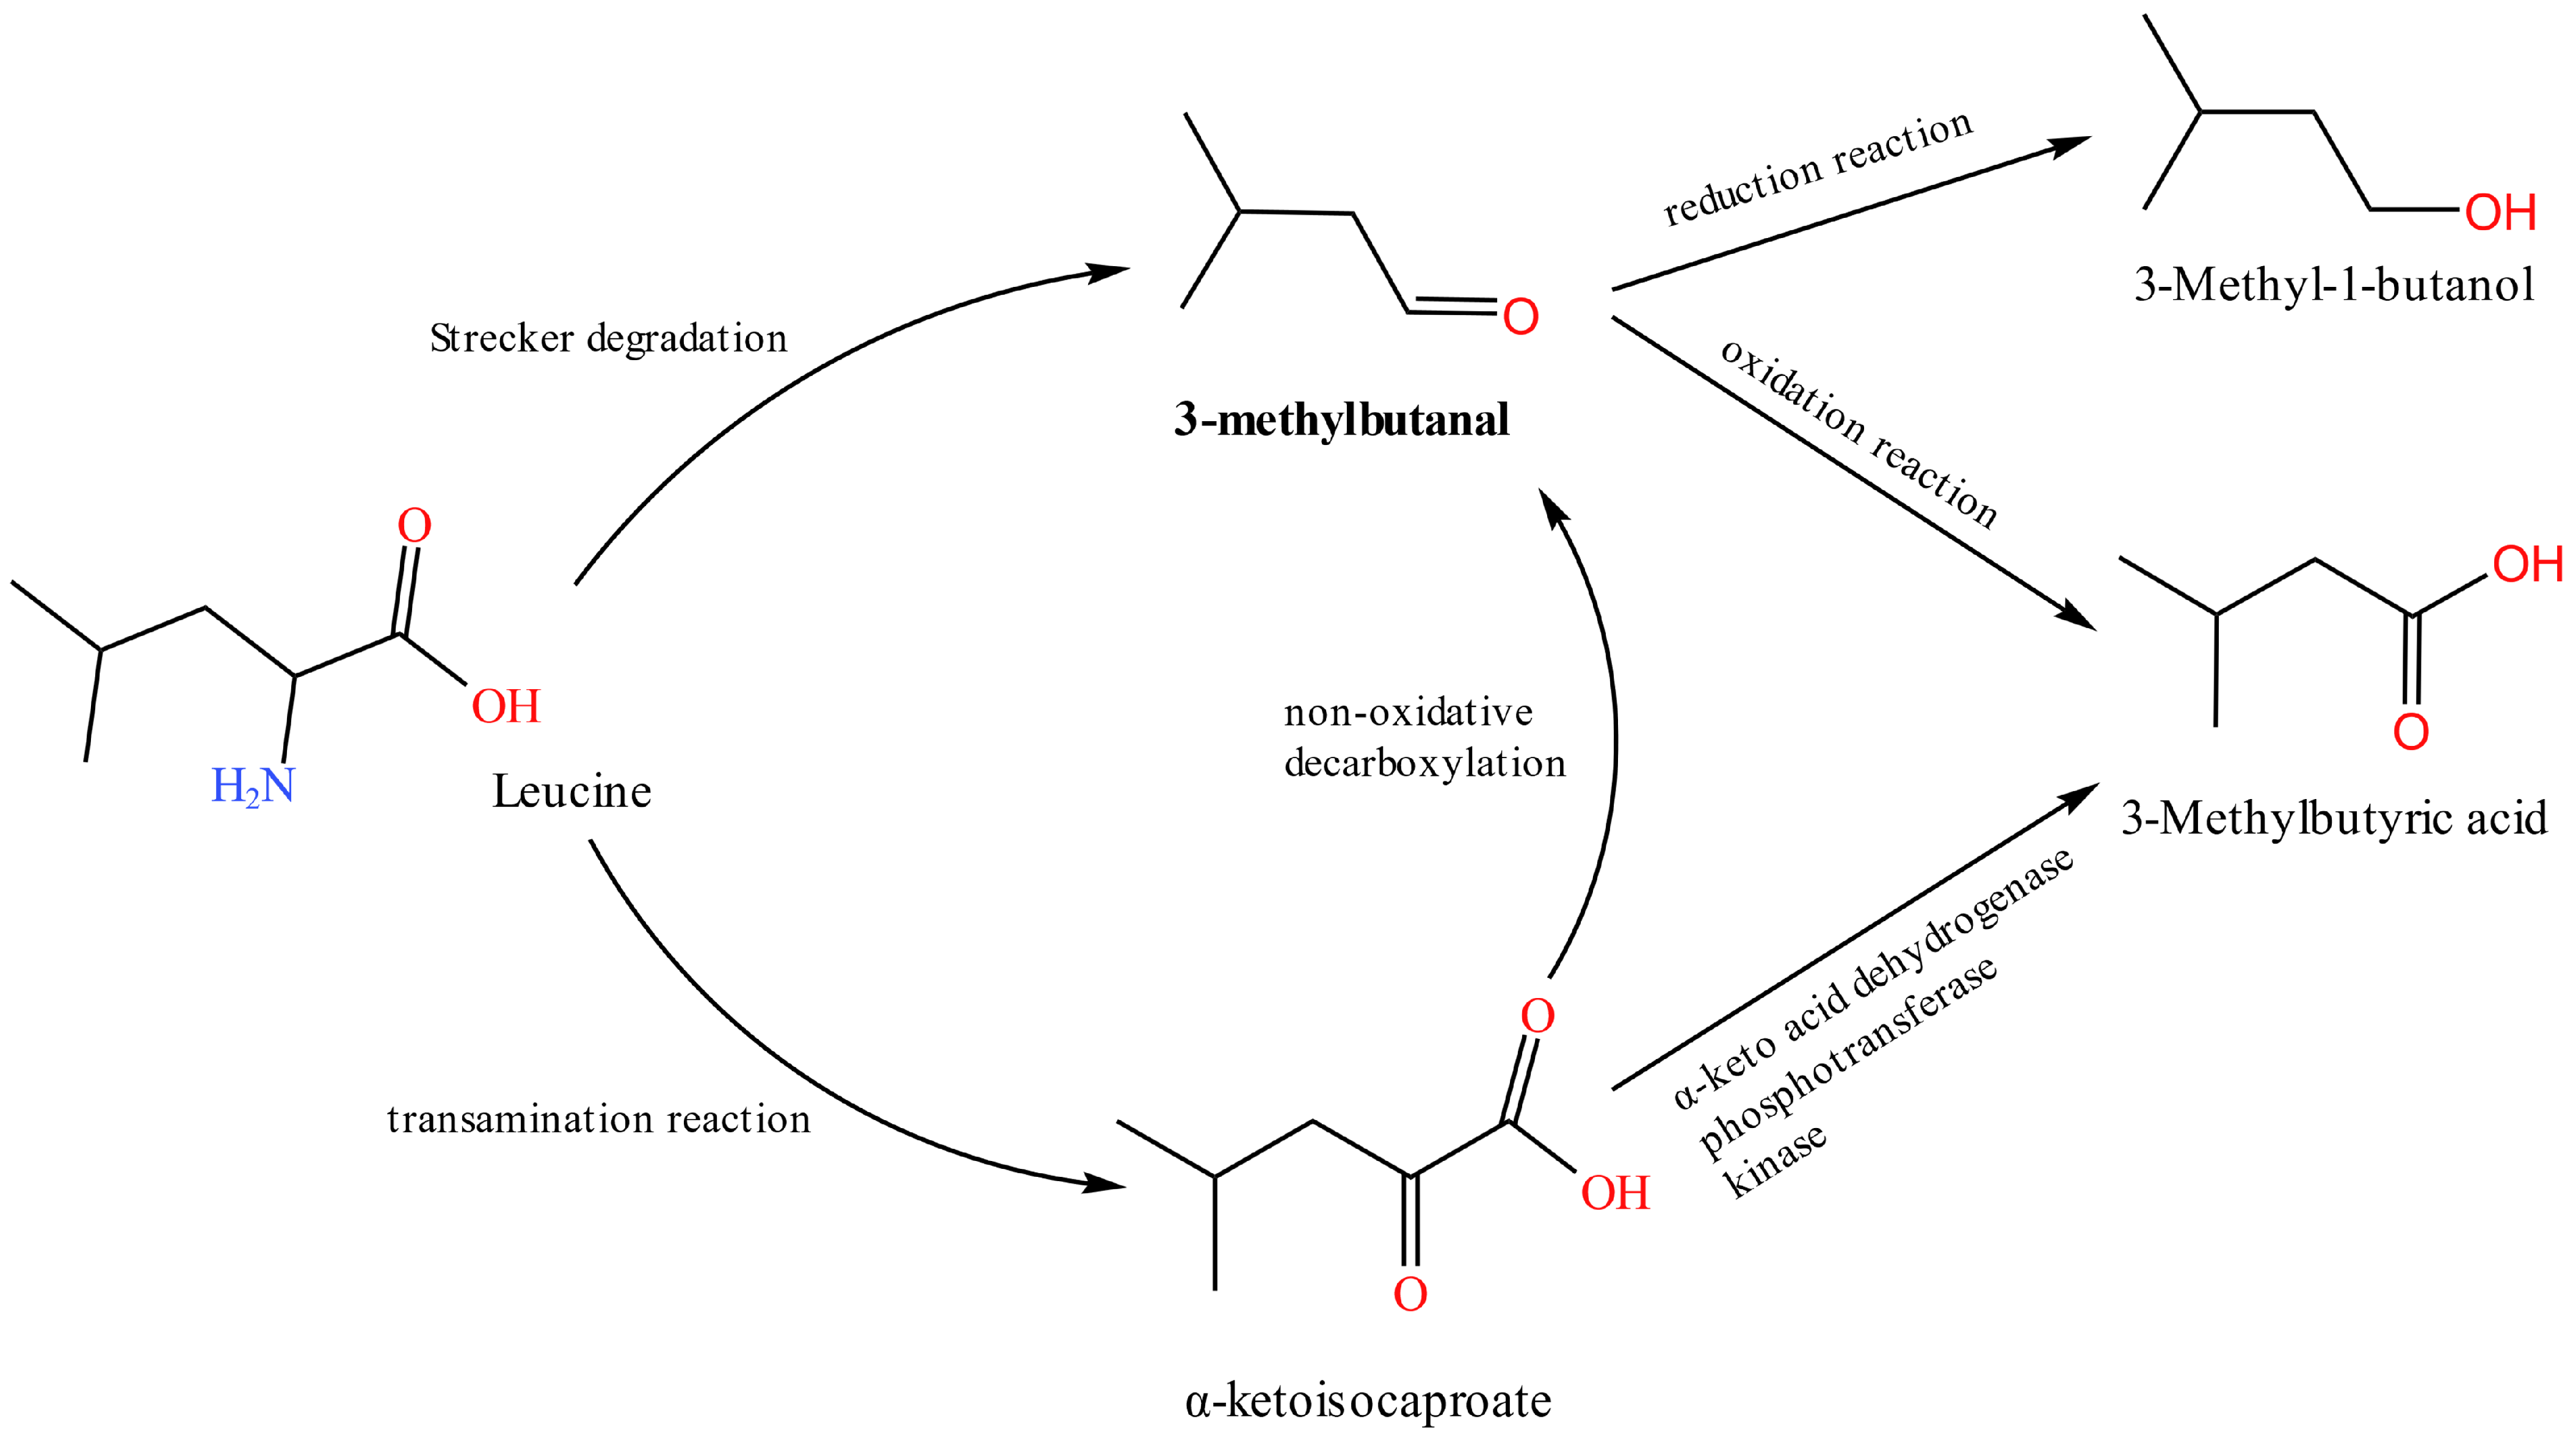
3.3.2. Aldehydes
3.3.3. Esters
3.3.4. Ketones
3.3.5. Sulfur Compound
3.4. Identification of Chicken Spoilage at Different Times Based on Chemometrics
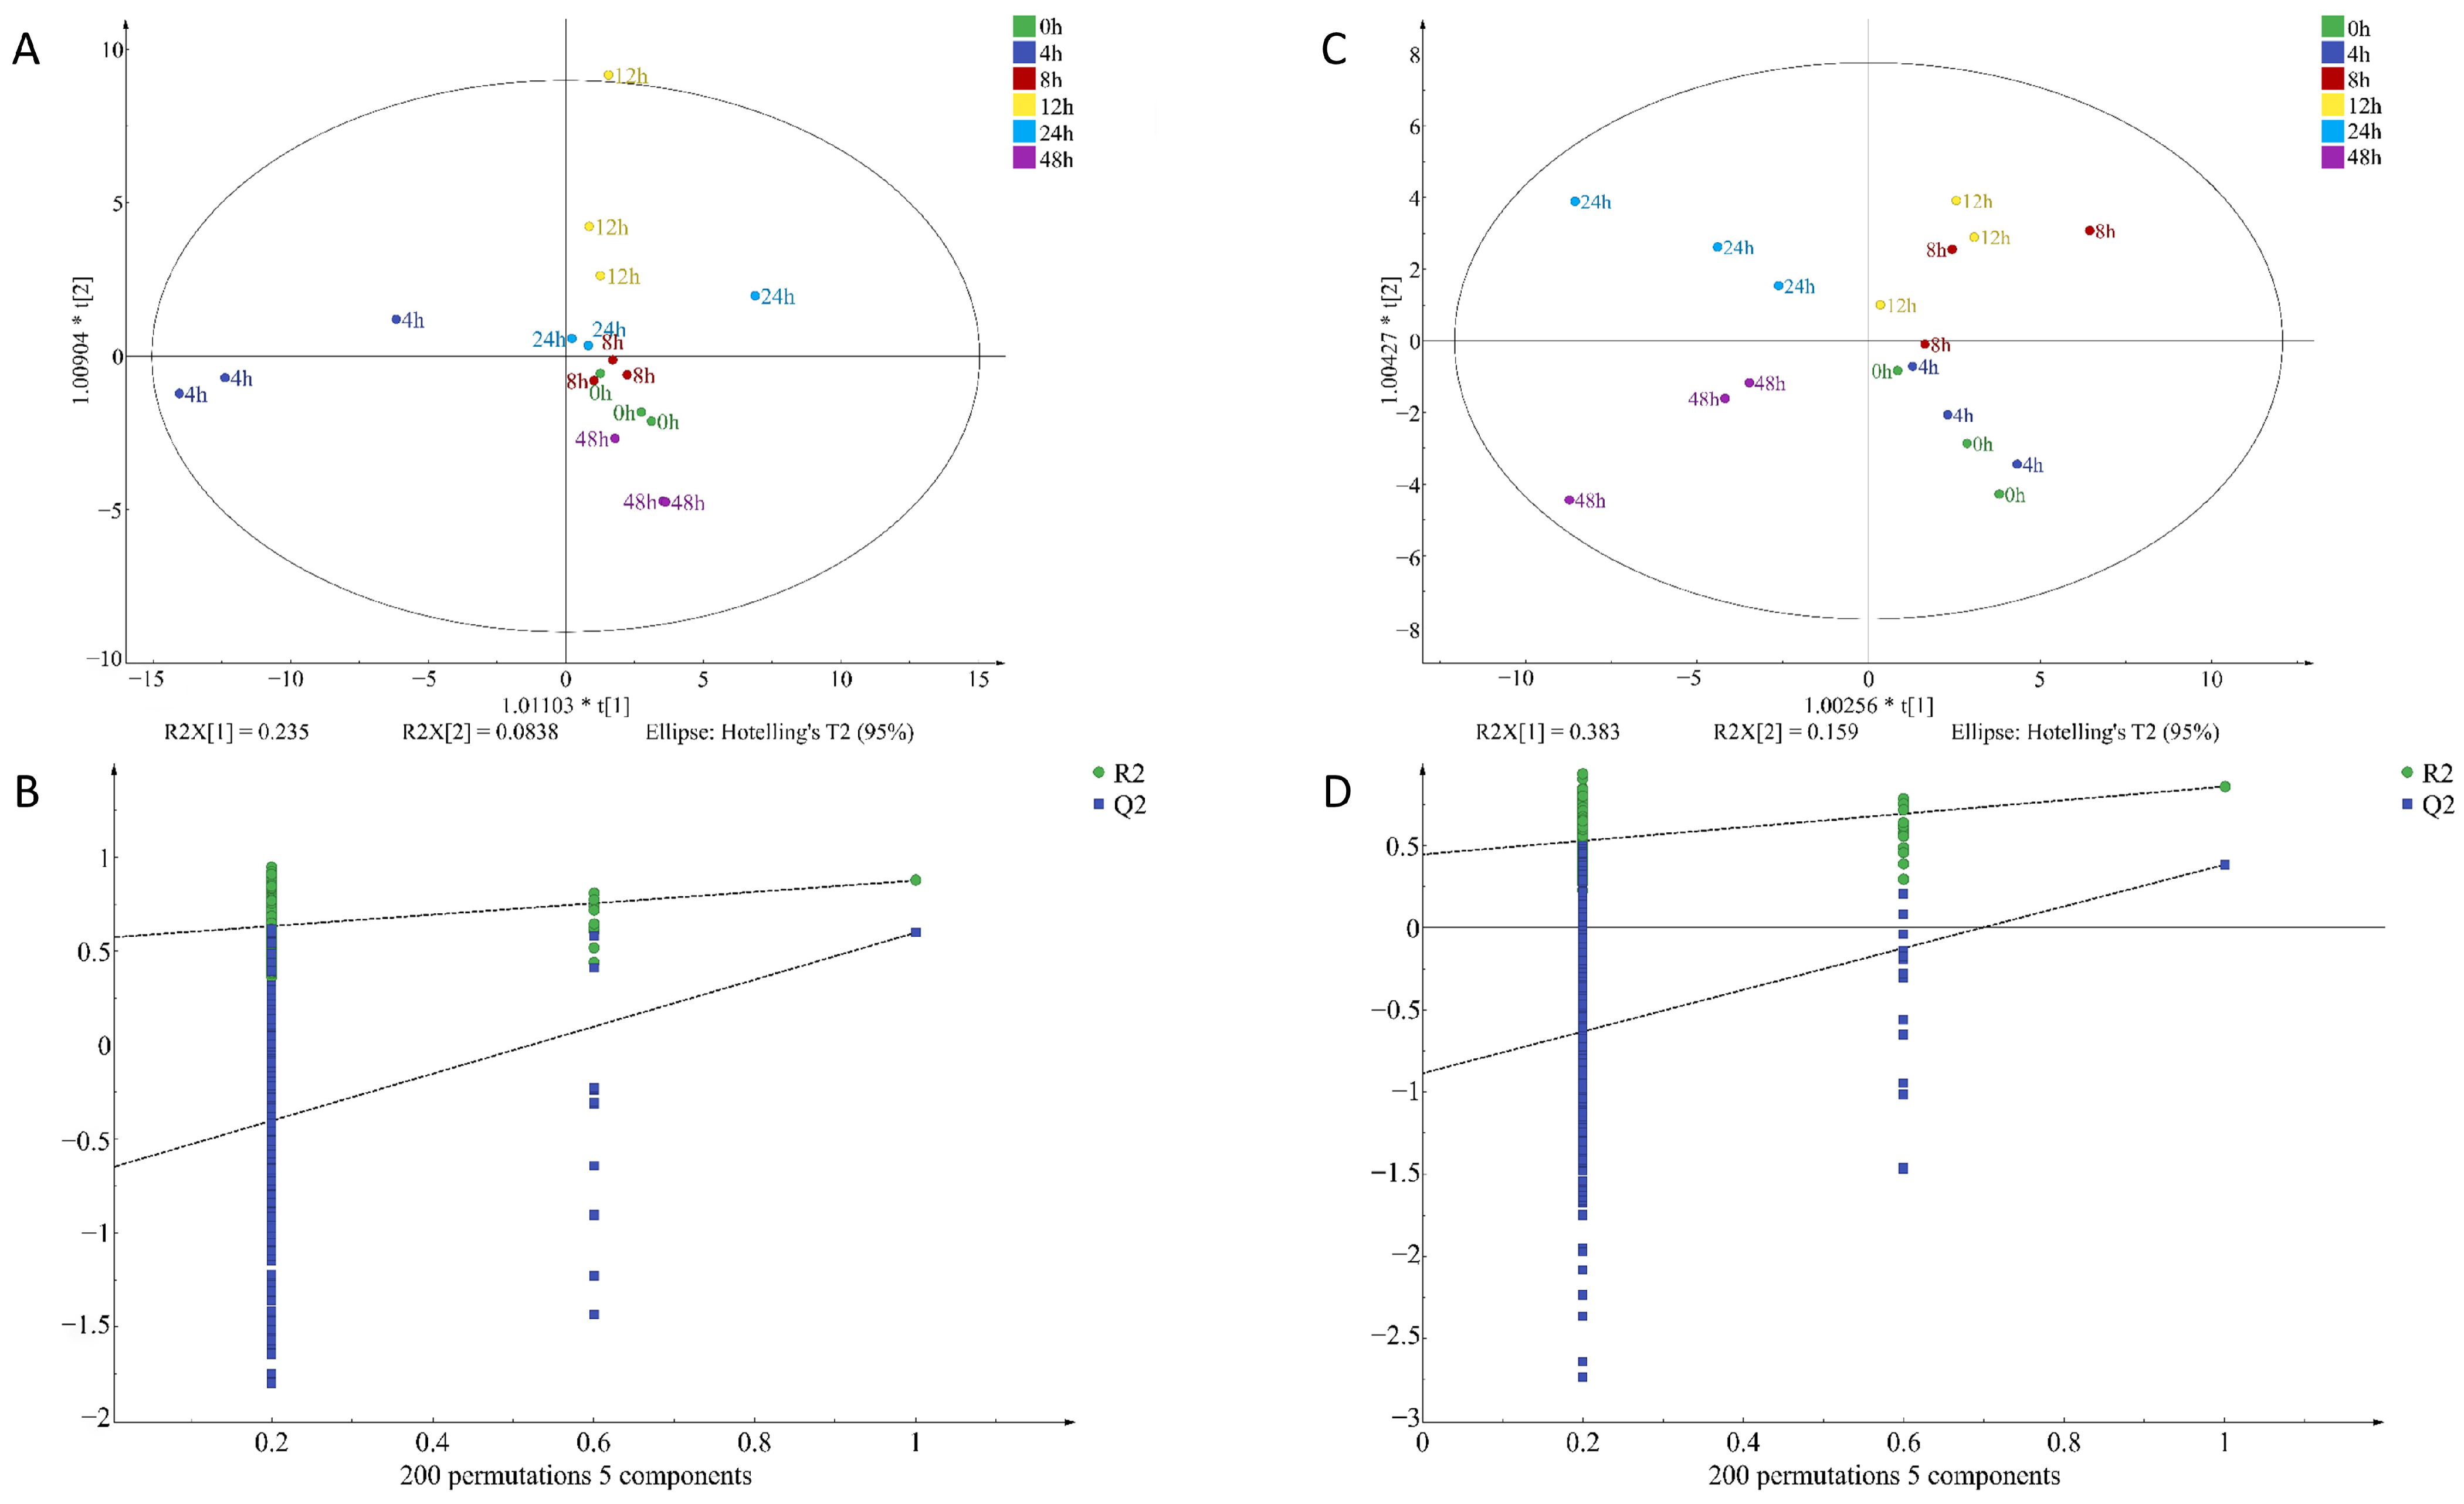
3.4.1. The Orthogonal Partial Least Squares Discrimination Analysis of VOCs in Chicken at Different Contamination Times
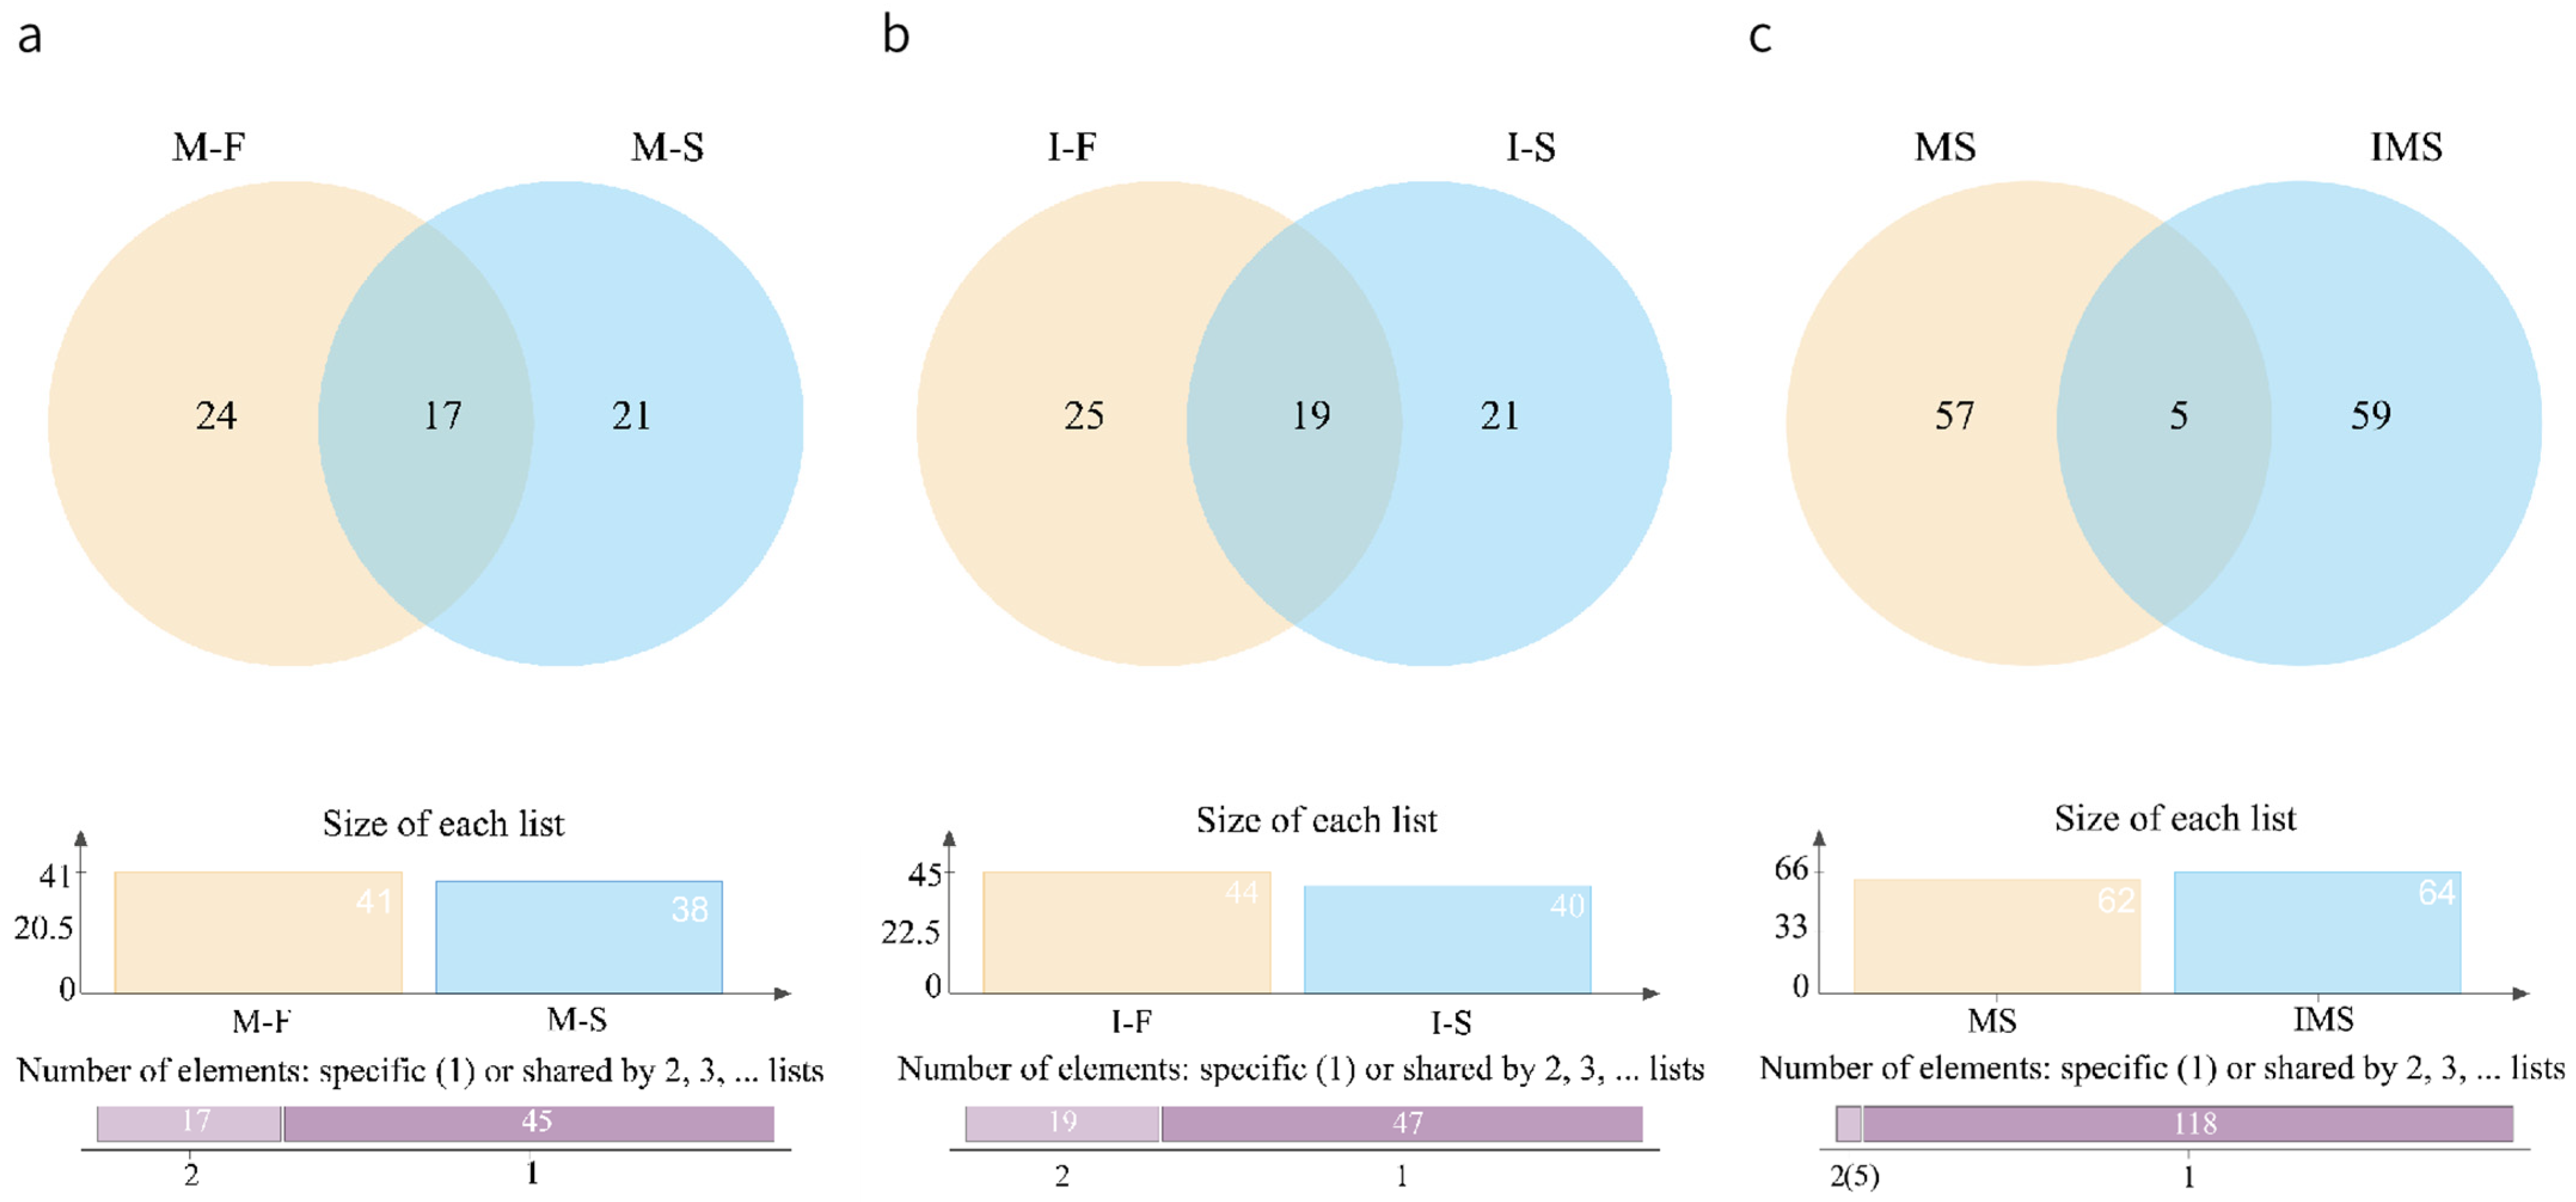
3.4.2. Comparison of HS-SPME-GC-MS and HS-GC-IMS
4. Conclusions
Supplementary Materials
Author Contributions
Funding
Data Availability Statement
Conflicts of Interest
Abbreviations
| HS-SPME-GC-MS | Headspace solid-phase microextraction coupled with gas chromatography-mass spectrometry. |
| HS-GC-IMS | Headspace gas chromatography-ion mobility spectrometry. |
| VOCs | Volatile organic compounds. |
| OPLS-DA | Orthogonal partial least squares discriminant analysis. |
| UPLC-MS/MS | Ultra performance liquid chromatography-tandem mass spectrometry. |
| LC-ESI-MS/MS | Liquid chromatography-electrospray ionization-mass spectrometry. |
| M-F | Substances in 10−4 concentration of S. aureus-contaminated samples detected by HS-SPME-GC-MS. |
| M-S | Substances in 10−6 concentration of S. aureus-contaminated samples detected by HS-SPME-GC-MS. |
| I-F | Substances in 10−4 concentration of S. aureus-contaminated samples detected by HS-GC-IMS. |
| I-S | Substances in 10−6 concentration of S. aureus-contaminated samples detected by HS-GC-IMS. |
| MeSH | Methionine and sulfides methanethiol. |
| DMTS | Dimethyltrisulfane. |
| M and I | HS-SPME-GC-MS and HS-GC-IMS (both methods). |
References
- Pellattiero, E.; Tasoniero, G.; Cullere, M.; Gleeson, E.; Baldan, G.; Contiero, B.; Zotte, A.D. Are Meat Quality Traits and Sensory Attributes in Favor of Slow-Growing Chickens? Animals 2020, 10, 960. [Google Scholar] [CrossRef]
- Katiyo, W.; de Kock, H.L.; Coorey, R.; Buys, E.M. Sensory implications of chicken meat spoilage in relation to microbial and physicochemical characteristics during refrigerated storage. LWT-Food Sci. Technol. 2020, 128, 109468. [Google Scholar] [CrossRef]
- Li, Y.; Qiu, Y.; Ye, C.; Chen, L.; Liang, Y.; Huang, T.-Y.; Zhang, L.; Liu, J. “One-step” characterization platform for pathogenic genetics of Staphylococcus aureus. Bioprocess Biosyst. Eng. 2021, 44, 985–994. [Google Scholar] [CrossRef]
- Schneider, G.; Schweitzer, B.; Steinbach, A.; Pertics, B.Z.; Cox, A.; Korosi, L. Antimicrobial Efficacy and Spectrum of Phosphorous-Fluorine Co-Doped TiO2 Nanoparticles on the Foodborne Pathogenic Bacteria Campylobacter jejuni, Salmonella Typhimurium, Enterohaemorrhagic E. coli, Yersinia enterocolitica, Shewanella putrefaciens, Listeria monocytogenes and Staphylococcus aureus. Foods 2021, 10, 1786. [Google Scholar] [CrossRef] [PubMed]
- Cai, H.; Kou, X.; Ji, H.; Wang, X.; Wang, H.; Zhang, Y.; Lu, S.; Li, B.; Dong, J.; Wang, Q.; et al. Prevalence and characteristics of Staphylococcus aureus isolated from Kazak cheese in Xinjiang, China. Food Control 2021, 123, 107759. [Google Scholar] [CrossRef]
- Olsen, R.H.; Christensen, H.; Kabell, S.; Bisgaard, M. Characterization of prevalent bacterial pathogens associated with pododermatitis in table egg layers. Avian Pathol. 2018, 47, 281–285. [Google Scholar] [CrossRef] [PubMed]
- Savariraj, W.R.; Ravindran, N.B.; Kannan, P.; Rao, V.A. Occurrence and enterotoxin gene profiles of Staphylococcus aureus isolated from retail chicken meat. Food Sci. Technol. Int. 2021, 27, 619–625. [Google Scholar] [CrossRef]
- Adzitey, F.; Ekli, R.; Aduah, M. Incidence and antibiotic susceptibility of Staphylococcus aureus isolated from ready-to-eat meats in the environs of Bolgatanga Municipality of Ghana. Cogent Environ. Sci. 2020, 6, 1791463. [Google Scholar] [CrossRef]
- Wang, A.; Luca, A.; Edelenbos, M. Emission of volatile organic compounds from yellow onion (Allium cepa L.) bulbs during storage. J. Food Sci. Technol. Mysore 2019, 56, 2940–2948. [Google Scholar] [CrossRef]
- Chen, L.; Mardiansyah, S.T.; Kuuliala, L.; Somrani, M.; Walgraeve, C.; Demeestere, K.; Devlieghere, F. Selected-ion flow-tube mass spectrometry for the identification of volatile spoilage markers for fresh pork packaged under modified atmospheres. Food Chem. 2023, 423, 136318. [Google Scholar] [CrossRef]
- Liu, H.; Hui, T.; Zheng, X.; Li, S.; Wei, X.; Li, P.; Zhang, D.; Wang, Z. Characterization of key lipids for binding and generating aroma compounds in roasted mutton by UPLC-ESI-MS/MS and Orbitrap Exploris GC. Food Chem. 2022, 374, 131723. [Google Scholar] [CrossRef] [PubMed]
- Yao, W.; Cai, Y.; Liu, D.; Chen, Y.; Li, J.; Zhang, M.; Chen, N.; Zhang, H. Analysis of flavor formation during production of Dezhou braised chicken using headspace-gas chromatography-ion mobility spec-trometry (HS-GC-IMS). Food Chem. 2022, 370, 130989. [Google Scholar] [CrossRef] [PubMed]
- Zhan, F.; Sun, L.; Zhao, G.; Li, M.; Zhu, C. Multiple Technologies Combined to Analyze the Changes of Odor and Taste in Daokou Braised Chicken during Processing. Foods 2022, 11, 963. [Google Scholar] [CrossRef] [PubMed]
- Yin, J.; Wu, M.; Lin, R.; Li, X.; Ding, H.; Han, L.; Yang, W.; Song, X.; Li, W.; Qu, H.; et al. Application and development trends of gas chromatography-ion mobility spectrometry for traditional Chinese medicine, clinical, food and environmental analysis. Microchem. J. 2021, 168, 106527. [Google Scholar] [CrossRef]
- Li, H.; Geng, W.; Haruna, S.A.; Zhou, C.; Wang, Y.; Ouyang, Q.; Chen, Q. Identification of characteristic volatiles and metabolomic pathway during pork storage using HS-SPME-GC/MS coupled with multivariate analysis. Food Chem. 2022, 373, 131431. [Google Scholar] [CrossRef]
- Liu, D.; Bai, L.; Feng, X.; Chen, Y.P.; Zhang, D.; Yao, W.; Zhang, H.; Chen, G.; Liu, Y. Characterization of Jinhua ham aroma profiles in specific to aging time by gas chromatography-ion mobility spectrometry (GC-IMS). Meat Sci. 2020, 168, 108178. [Google Scholar] [CrossRef]
- Li, C.; Al-Dalali, S.; Wang, Z.; Xu, B.; Zhou, H. Investigation of volatile flavor compounds and characterization of aroma-active compounds of water-boiled salted duck using GC-MS-O, GC-IMS, and E-nose. Food Chem. 2022, 386, 132728. [Google Scholar] [CrossRef]
- Deng, S.; Liu, Y.; Huang, F.; Liu, J.; Han, D.; Zhang, C.; Blecker, C. Evaluation of volatile flavor compounds in bacon made by different pig breeds during storage time. Food Chem. 2021, 357, 129765. [Google Scholar] [CrossRef]
- Ameera, O.H.; Ghaidaa, J.M.; Mohammed, G.J.; Hameed, I.H.H. Phytochemical screening of methanolic dried galls extract of Quercus infectoria using gas chromatography-mass spectrometry (GC-MS) and Fourier transform-infrared (FT-IR). J. Pharmacogn. Phytother. 2016, 8, 49–59. [Google Scholar] [CrossRef]
- Suresh, G.; Kumar, R.S.R. Morpho-molecular and biochemical characterization of the wild edible mushroom T. giganteum (TGS-1). J. Pharmacogn. Phytother. 2022, 11, 202–206. [Google Scholar]
- Uddin, M.Z.; Paul, A.; Rakib, A.; Sami, S.A.; Mahmud, S.; Rana, M.S.; Hossain, S.; Tareq, A.M.; Dutta, M.; Emran, T.B.; et al. Chemical Profiles and Pharmacological Properties with in Silico Studies on Elatostema papillosum Wedd. Molecules 2021, 26, 809. [Google Scholar] [CrossRef] [PubMed]
- Lawson, C.A.; Possell, M.; Seymour, J.R.; Raina, J.-B.; Suggett, D.J. Coral endosymbionts (Symbiodiniaceae) emit species-specific volatilomes that shift when exposed to thermal stress. Sci. Rep. 2019, 9, 17395. [Google Scholar] [CrossRef] [PubMed]
- Elbrense, H.; Elmasry, A.M.A.; Seleiman, M.F.; AL-Harbi, M.S.; Abd El-Raheem, A.M. Can Symbiotic Bacteria (Xenorhabdus and Photorhabdus) Be More Efficient than Their Entomopathogenic Nematodes against Pieris rapae and Pentodon algerinus Larvae? Biology 2021, 10, 999. [Google Scholar] [CrossRef] [PubMed]
- Miks-Krajnik, M.; Yoon, Y.-J.; Yuk, H.-G. Detection of volatile organic compounds as markers of chicken breast spoilage using HS-SPME-GC/MS-FASST. Food Sci. Biotechnol. 2015, 24, 361–372. [Google Scholar] [CrossRef]
- Song, X.; Canellas, E.; Nerin, C. Screening of volatile decay markers of minced pork by headspace-solid phase microextraction-gas chromatography-mass spectrometry and chemometrics. Food Chem. 2021, 342, 128341. [Google Scholar] [CrossRef]
- Yu, Y.; Wang, G.; Luo, Y.; Pu, Y.; Ge, C.; Liao, G. Effect of natural spices on precursor substances and volatile flavor compounds of boiled Wuding chicken during processing. Flavour Fragr. J. 2020, 35, 570–583. [Google Scholar] [CrossRef]
- Tian, X.; Li, Z.J.; Chao, Y.Z.; Wu, Z.Q.; Zhou, M.X.; Xiao, S.T.; Zeng, J.; Zhe, J. Evaluation by electronic tongue and headspace-GC-IMS analyses of the fl avor compounds in dry-cured pork with different salt content. Food Res. Int. 2020, 137, 109456. [Google Scholar] [CrossRef]
- Wang, F.; Gao, Y.; Wang, H.; Xi, B.; He, X.; Yang, X.; Li, W. Analysis of volatile compounds and flavor fingerprint in Jingyuan lamb of different ages using gas chromatography-ion mobility spectrometry (GC-IMS). Meat Sci. 2021, 175, 108449. [Google Scholar] [CrossRef]
- Chen, J.; Tao, L.; Zhang, T.; Zhang, J.; Wu, T.; Luan, D.; Ni, L.; Wang, X.; Zhong, J. Effect of four types of thermal processing methods on the aroma profiles of acidity regulator-treated tilapia muscles using E-nose, HS-SPME-GC-MS and HS-GC-IMS. LWT-Food Sci. Technol. 2021, 147, 111585. [Google Scholar] [CrossRef]
- Li, W.; Chen, Y.P.; Blank, I.; Li, F.; Li, C.; Liu, Y. GC x GC-ToF-MS and GC-IMS based volatile profile characterization of the Chinese dry-cured hams from different regions. Food Res. Int. 2021, 142, 110222. [Google Scholar] [CrossRef]
- Jin, Y.; Cui, H.; Yuan, X.; Liu, L.; Liu, X.; Wang, Y.; Ding, J.; Xiang, H.; Zhang, X.; Liu, J.; et al. Identification of the main aroma compounds in Chinese local chicken high-quality meat. Food Chem. 2021, 359, 129930. [Google Scholar] [CrossRef]
- Chen, Y.; Bassey, A.P.; Zhou, G.H.; Teng, S.; Dou, H.; Guo, Y.P.; Zhang, Y.Y.; Ye, K.P. Evaluation of flavor profile in blown pack spoilage meatballs via electronic nose and gas chromatography-ion mobility spectrometry (GC-IMS) integration. J. Food Meas. Charact. 2023, 17, 487–498. [Google Scholar] [CrossRef]
- Geeraerts, W.; De Vuyst, L.; Leroy, F.; Van Kerrebroeck, S. Monitoring of volatile production in cooked poultry products using selected ion flow tube-mass spectrometry. Food Res. Int. 2019, 119, 196–206. [Google Scholar] [CrossRef]
- Li, X.; Zhu, J.; Li, C.; Ye, H.; Wang, Z.; Wu, X.; Xu, B. Evolution of Volatile Compounds and Spoilage Bacteria in Smoked Bacon during Refrigeration Using an E-Nose and GC-MS Combined with Partial Least Squares Regression. Molecules 2018, 23, 3286. [Google Scholar] [CrossRef] [PubMed]
- Hu, K.L.; Yu, X.Q.; Chen, J.; Tang, J.N.; Wang, L.Z.; Li, Y.M.; Tang, C. Production of characteristic volatile markers and their relation to Staphylococcus aureus growth status in pork. Meat Sci. 2020, 160, 107956. [Google Scholar] [CrossRef]
- Jiang, H.; Zhang, M.; Ye, J.; Qian, M.; Li, X.; Zhao, W.; Bai, W. HS-SPME-GC-MS and OAV analyses of characteristic volatile flavour compounds in salt-baked drumstick. LWT-Food Sci. Technol. 2022, 170, 114041. [Google Scholar] [CrossRef]
- Li, X.; Xie, W.; Bai, F.; Wang, J.; Zhou, X.; Gao, R.; Xu, X.; Zhao, Y. Influence of thermal processing on flavor and sensory profile of sturgeon meat. Food Chem. 2022, 374, 131689. [Google Scholar] [CrossRef] [PubMed]
- Wang, Z.; Mi, S.; Wang, X.; Mao, K.; Liu, Y.; Gao, J.; Sang, Y. Characterization and discrimination of fermented sweet melon juice by different microbial strains via GC-IMS-based volatile profiling and chemometrics. Food Sci. Hum. Wellness 2023, 12, 1241–1247. [Google Scholar] [CrossRef]
- Wen, R.; Kong, B.; Yin, X.; Zhang, H.; Chen, Q. Characterisation of flavour profile of beef jerky inoculated with different autochthonous lactic acid bacteria using electronic nose and gas chromatography-ion mobility spectrometry. Meat Sci. 2022, 183, 108658. [Google Scholar] [CrossRef] [PubMed]
- Zeng, X.; Liu, J.; Dong, H.; Bai, W.; Yu, L.; Li, X. Variations of volatile flavour compounds in Cordyceps militaris chicken soup after enzymolysis pretreatment by SPME combined with GC-MS, GC x GC-TOF MS and GC-IMS. Int. J. Food Sci. Technol. 2020, 55, 509–516. [Google Scholar] [CrossRef]
- Nie, S.; Li, L.; Wang, Y.; Wu, Y.; Li, C.; Chen, S.; Zhao, Y.; Wang, D.; Xiang, H.; Wei, Y. Discrimination and characterization of volatile organic compound fingerprints during sea bass (Lateolabrax japonicas) fermentation by combining GC-IMS and GC-MS. Food Biosci. 2022, 50, 102048. [Google Scholar] [CrossRef]
- Yu, J.; Lu, K.; Zi, J.; Yang, X.; Zheng, Z.; Xie, W. Halophilic bacteria as starter cultures: A new strategy to accelerate fermentation and enhance flavor of shrimp paste. Food Chem. 2022, 393, 133393. [Google Scholar] [CrossRef] [PubMed]
- Schulz, S.; Dickschat, J.S. Bacterial volatiles: The smell of small organisms. Nat. Prod. Rep. 2007, 24, 814–842. [Google Scholar] [CrossRef] [PubMed]


| Super Class | Metabolite | KEGG ID | Upstream Products | Downstream Products | Reaction | Pathway |
|---|---|---|---|---|---|---|
| Alcohols | 1-Octen-3-ol | C14272 | − | − | − | − |
| 1-Pentanol | C16834 | C12650; | − | R08220; | − | |
| Aldehydes | 2-Methylbutanal | C02223 | C00671; | − | R03894; | − |
| 3-Methylbutanal | C07329 | C07328; | − | R05685; R05686; | − | |
| Heptanal | C14390 | − | − | − | − | |
| Esters | Ethyl Acetate | C00849 | C00469; | C00033; C00469; | R11957; R12515; | − |
| 3-Methylbutyl acetate | C12296 | − | C07328; C00033; | R12516 | − | |
| Hydrocarbons | Styrene | C07083 | C07111; C00423; | C07084; C20782; | R05417; R05424; R05488; R11070; | map00642; map01220; map01120; map01100; |
| Ketones | 3-Hydroxy-2-butanone | C00466 | C03046; | C00741; C00084; | R02343; R02344; R02345; R09524; | − |
| 2-Pentanone | C01949 | C02445; | − | R03781 | − | |
| Ethyl methyl ketone | C02845 | C18796; | − | R09358 | − | |
| Cyclohexanone | C00414 | C04316; C00571; | C00854; C01880; C02395; | R02229; R02231; R02232; R02233; R02234; | map00930; map01120; map01220; | |
| Acetone | C00207 | C00164; C02659; C06551; C06559; C09276; C00448; C19707; C16143; C01845; | C01845; C01995; C00164; C17530; | R01366; R01550; R01553; R03796; R05564; R05568; R05735; R08207; R08543; R09002; R09487; R10703; R10704; | map00650; map01100; | |
| Sulfur compounds | Dimethyltrisulfane | C08372 | − | − | − | − |
| Super Classs | Compounds | M-F | M-S | I-F | I-S | M and I |
|---|---|---|---|---|---|---|
| Acids | 2-Methylbutanoic acid | − | − | + | − | − |
| Acetic acid | − | − | + | − | − | |
| 2-Heptanol | − | − | − | + | − | |
| Alcohols | 3-Methyl-1-butanol | − | − | + | − | − |
| 2-Hexanol | − | − | + | − | − | |
| 1-Octen-3-ol | − | − | + | − | − | |
| 2-Propanol | − | − | + | − | − | |
| Hexanal | − | − | − | + | − | |
| Aldehydes | 2-Methylbutanal | − | + | + | + | + |
| 3-Methylbutanal | − | − | + | + | − | |
| 2-Undecenal | − | − | + | + | − | |
| Stearaldehyde | − | + | − | − | − | |
| Ethyl Acetate | − | + | − | − | − | |
| Esters | Hexyl acetate | − | − | + | + | - |
| Ethyl 3-methylbutanoate | − | − | + | − | − | |
| Ethyl propanoate | − | − | + | − | − | |
| Ethyl 2-methylpropanoate | − | − | + | − | − | |
| Propyl bytanoate | − | − | + | − | − | |
| Decahydronaphthalene | − | − | + | − | − | |
| Hydrocarbons | 3-Butenenitrile | − | − | + | − | − |
| (14E)-14-Octadecenal | − | − | − | + | − | |
| 2,6,11-Trimethyldodecane | + | − | − | − | − | |
| 2,6,10,15-Tetramethylheptadecane | + | − | − | − | − | |
| Tetradecane | + | + | − | − | − | |
| Heptacosane | + | − | − | − | − | |
| Tetratetracontane | − | + | − | − | − | |
| Toluene | − | + | − | − | − | |
| 2,6,10-Trimethyltetradecane | − | + | − | − | − | |
| Hexadecane | − | + | − | − | − | |
| Butan-2-one | − | + | − | − | − | |
| Ketones | 3-Hydroxy-2-butanone | − | − | + | + | − |
| Cyclohexanone | − | − | + | + | − | |
| 2-Heptanone | − | − | + | + | − | |
| Acetone | − | − | − | + | − | |
| Others | 2-Ethylpyrazine | − | − | − | + | − |
| 2-Tridecanyl trifluoroacetate | + | − | − | − | − | |
| Methyl N-hydroxybenzenecarboximidate | − | + | − | − | − |
Disclaimer/Publisher’s Note: The statements, opinions and data contained in all publications are solely those of the individual author(s) and contributor(s) and not of MDPI and/or the editor(s). MDPI and/or the editor(s) disclaim responsibility for any injury to people or property resulting from any ideas, methods, instructions or products referred to in the content. |
© 2023 by the authors. Licensee MDPI, Basel, Switzerland. This article is an open access article distributed under the terms and conditions of the Creative Commons Attribution (CC BY) license (https://creativecommons.org/licenses/by/4.0/).
Share and Cite
Wang, Y.; Wang, X.; Huang, Y.; Yue, T.; Cao, W. Analysis of Volatile Markers and Their Biotransformation in Raw Chicken during Staphylococcus aureus Early Contamination. Foods 2023, 12, 2782. https://doi.org/10.3390/foods12142782
Wang Y, Wang X, Huang Y, Yue T, Cao W. Analysis of Volatile Markers and Their Biotransformation in Raw Chicken during Staphylococcus aureus Early Contamination. Foods. 2023; 12(14):2782. https://doi.org/10.3390/foods12142782
Chicago/Turabian StyleWang, Yin, Xian Wang, Yuanyuan Huang, Tianli Yue, and Wei Cao. 2023. "Analysis of Volatile Markers and Their Biotransformation in Raw Chicken during Staphylococcus aureus Early Contamination" Foods 12, no. 14: 2782. https://doi.org/10.3390/foods12142782
APA StyleWang, Y., Wang, X., Huang, Y., Yue, T., & Cao, W. (2023). Analysis of Volatile Markers and Their Biotransformation in Raw Chicken during Staphylococcus aureus Early Contamination. Foods, 12(14), 2782. https://doi.org/10.3390/foods12142782