
Safety Assessment of Herbal Food Supplements: Elemental Profiling and Associated Risk

 ,
,  and
and
Abstract

1. Introduction
2. Materials and Methods
2.1. Sample Collection
2.2. Sample Preparation and Inductively Coupled Plasma Mass Spectrometry (ICP-MS) Analysis
2.3. Exposure and Risk Assessment
- Element’s contribution to the corresponding oral permitted daily exposure, corrected taking into account average body weight for the age class of consumers, was calculated using the following equation [18]:
- 2.
- Hazard quotients were calculated as a ratio of chronic exposure to the oral reference dose of an element [28] and expressed as percentages:
- 3.
- The hazard index of a sample was obtained as a sum of the hazard quotients of each element in that sample [28] (in percentages):
- 4.
- 5.
- The determination of lifetime cancer risk was based on the oral slope factor [28]:
2.4. Data Procesing and Statistical Analysis
3. Results
3.1. Profile of Elements in Herbal Food Supplements and Compliance Assessment
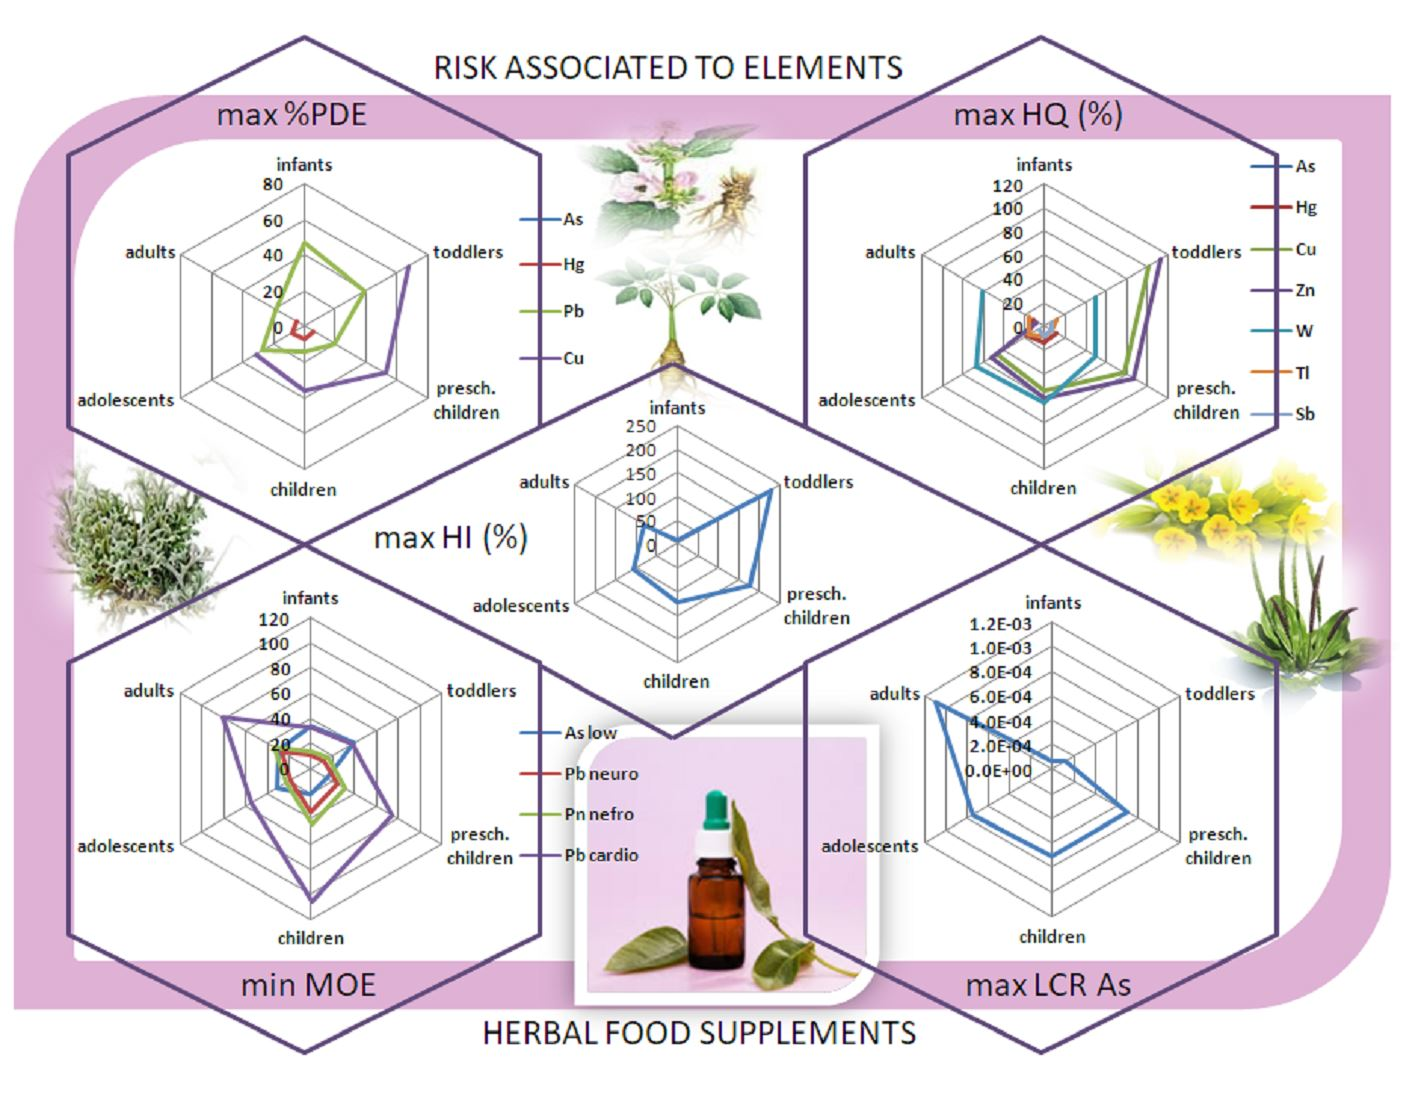
3.2. Exposure and Risk Assessment
3.2.1. PDE Approach
3.2.2. HQ Approach
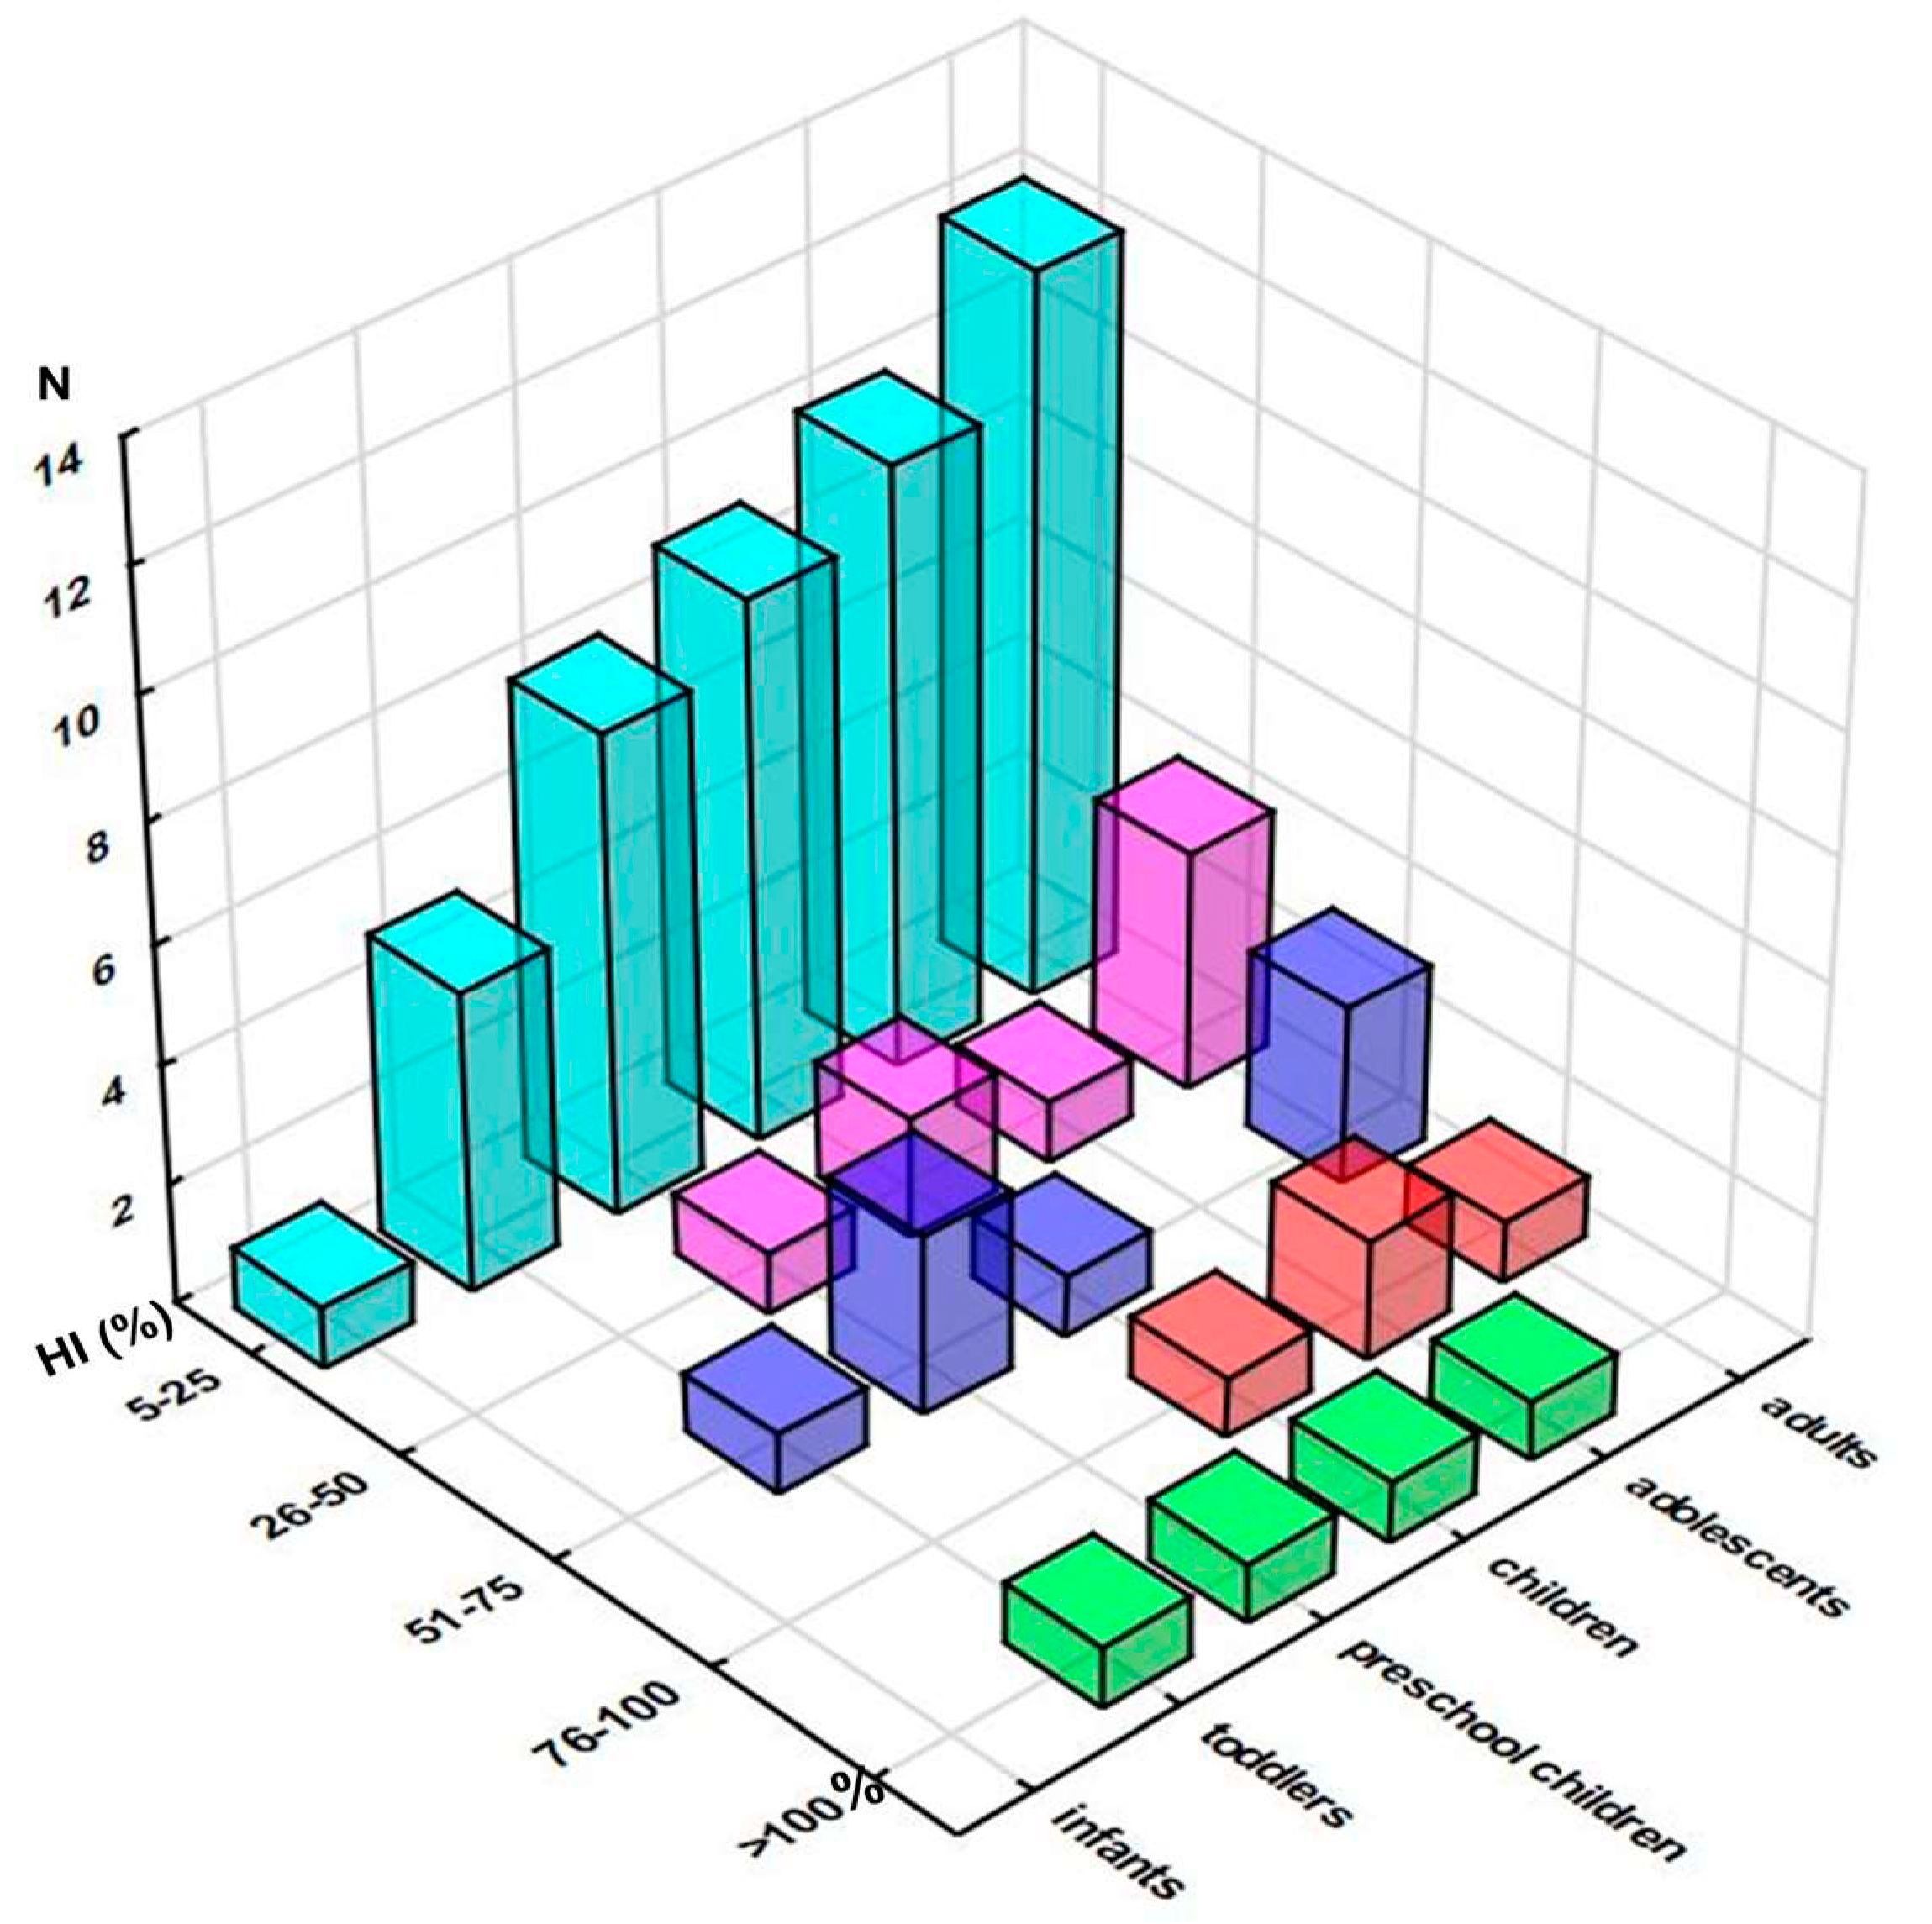
3.2.3. HI Approach
3.2.4. MOE Approach
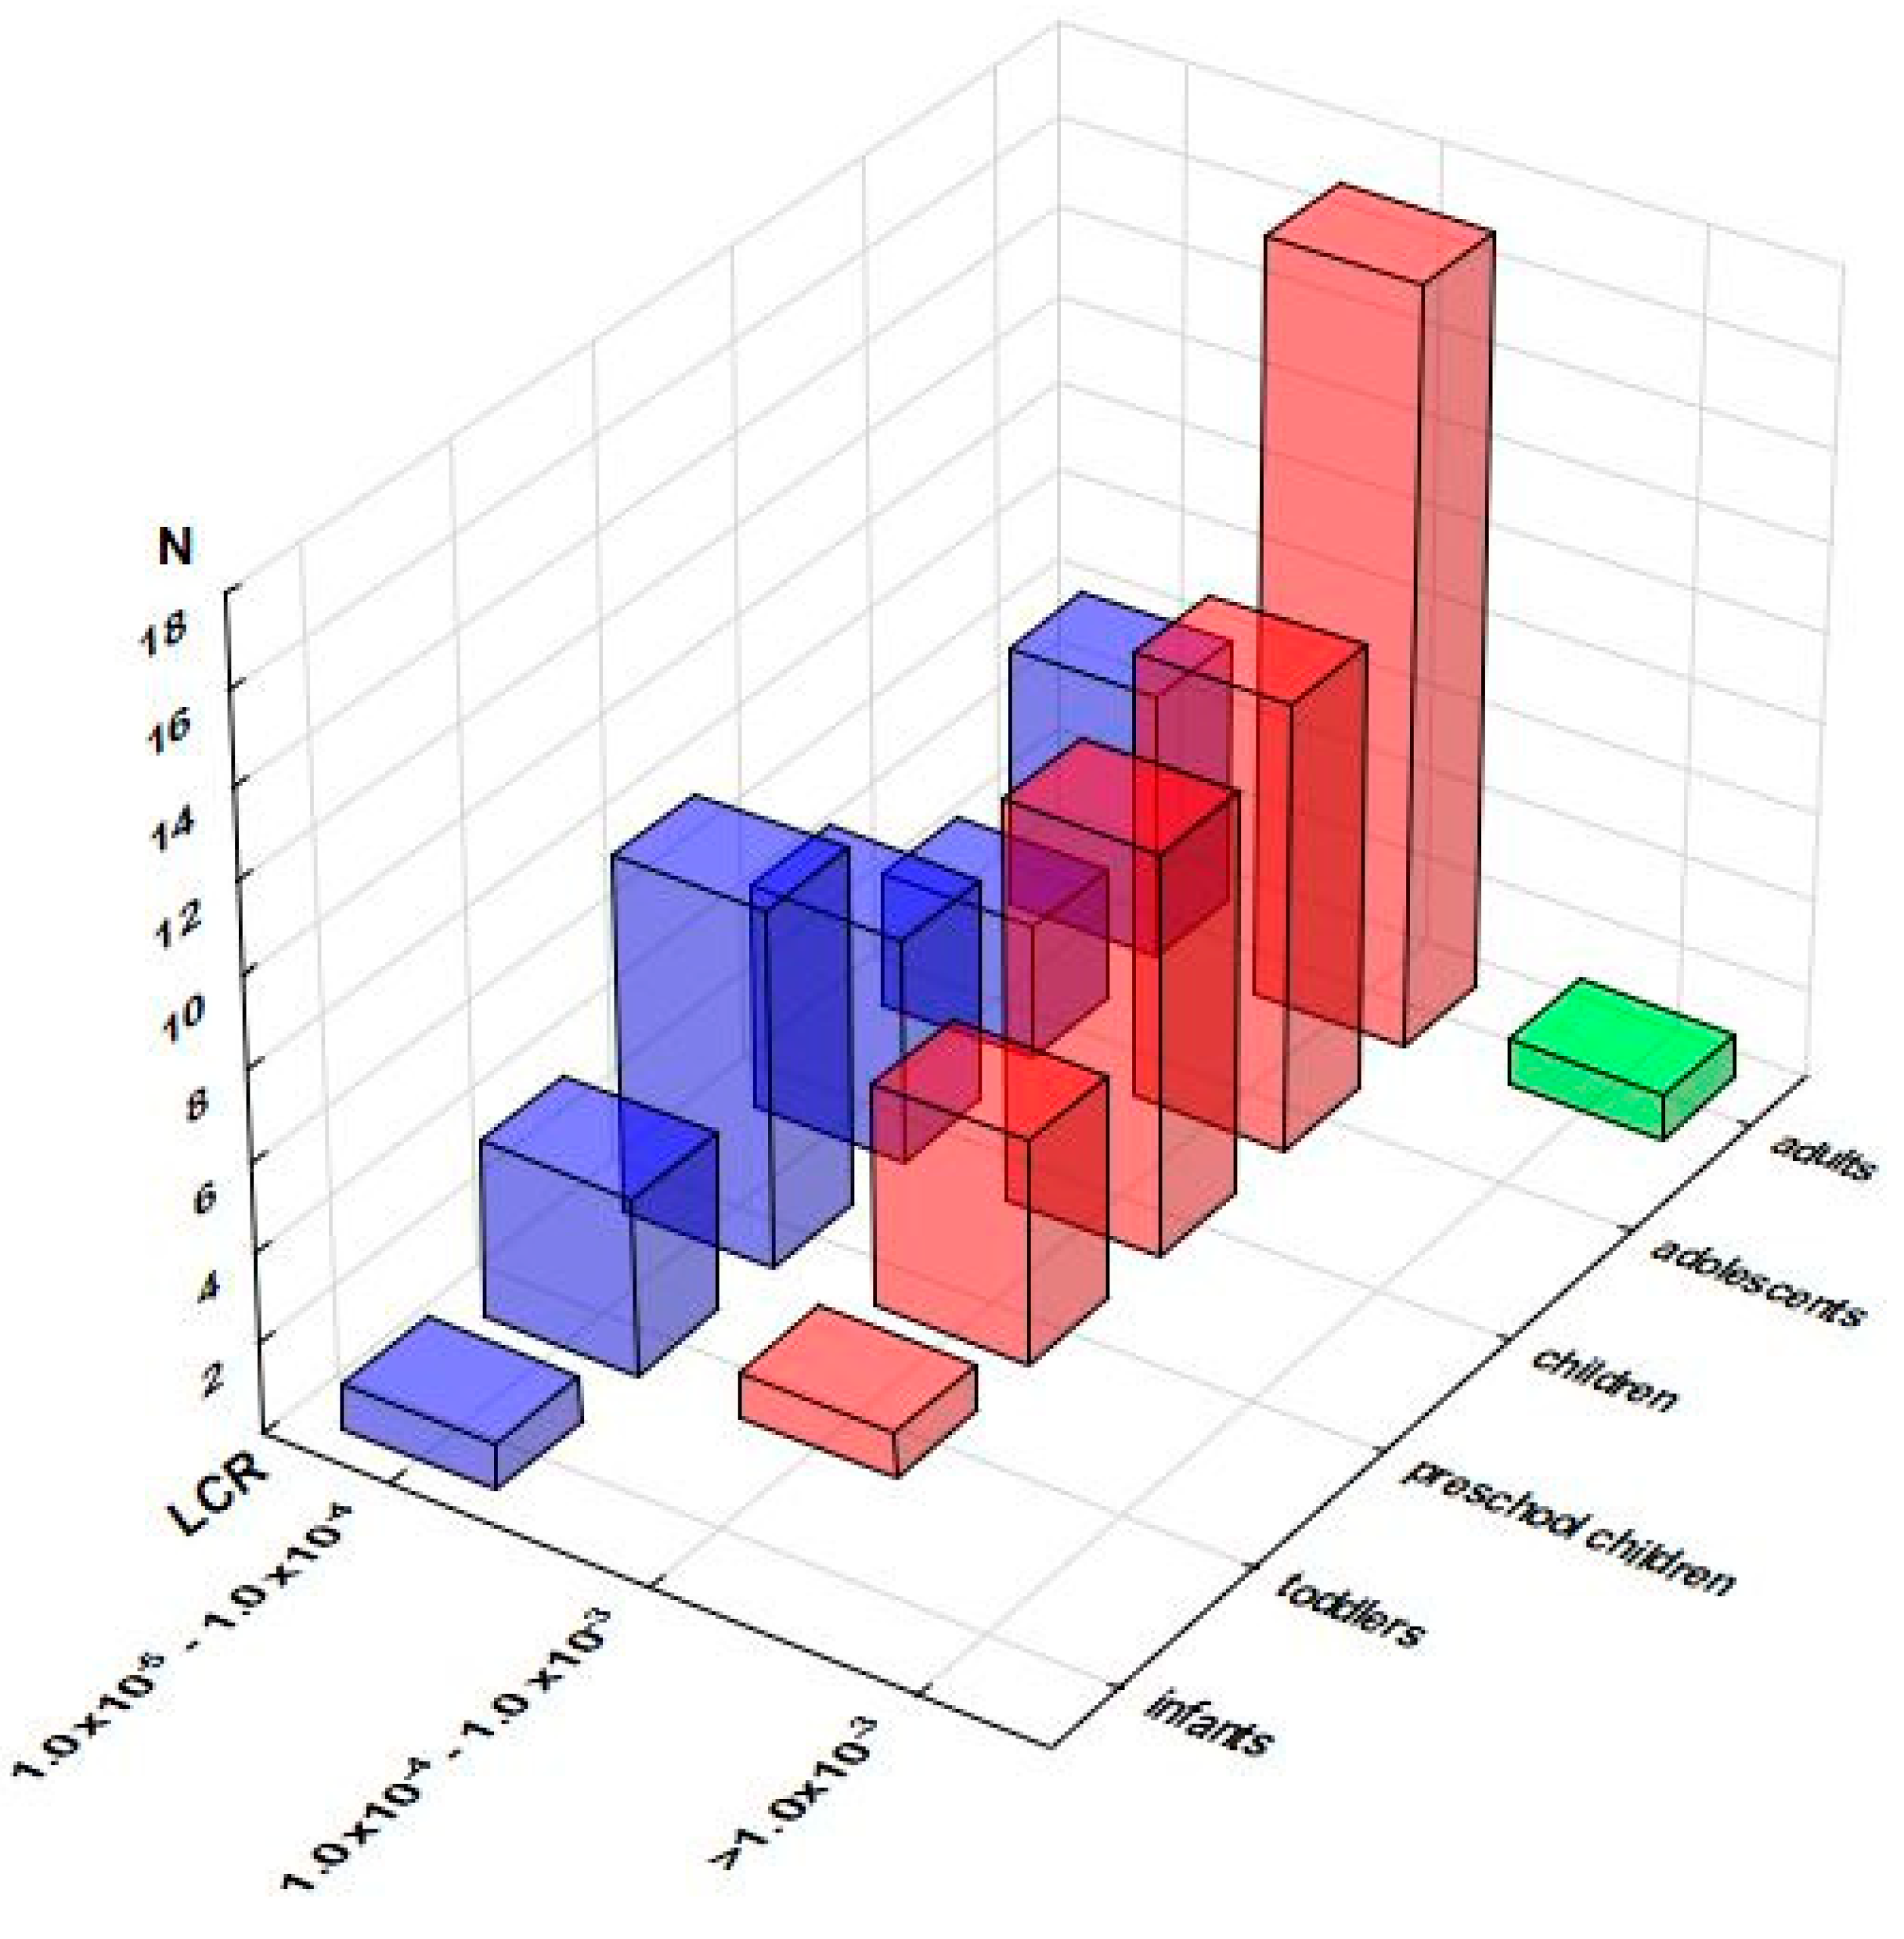
3.2.5. LCR Approach
3.3. Overall Considerations and Study Limitations
4. Conclusions
Supplementary Materials
Author Contributions
Funding
Institutional Review Board Statement
Informed Consent Statement
Data Availability Statement
Conflicts of Interest
References
- Hamulka, J.; Jersuzka-Bielak, M.; Górnicka, M.; Drywień, M.E.; Zielinska-Pukos, M.A. Dietary supplements during COVID-19 outbreak. Results of Google Trends analysis supported by PLifeCOVID-19 online studies. Nutrients 2021, 13, 54. [Google Scholar] [CrossRef] [PubMed]
- Directive 2002/46/EC of the European Parliament and of the Council of 10 June 2002 on the approximation of the laws of the Member States relating to food supplements. Off. J. Eur. Communities 2002, L183, 1–14.
- Jovičić-Bata, J.; Pavlović, N.; Milošević, N.; Gavarić, N.; Goločorbin-Kon, S.; Todorović, N.; Lalić-Popović, M. Coping with the burden of the COVID-19 pandemic: A cross-sectional study of community pharmacists from Serbia. BMC Health Serv. Res. 2021, 21, e304. [Google Scholar] [CrossRef]
- Alyami, H.S.; Orabi, M.A.A.; Aldhabbah, F.M.; Alturki, H.N.; Aburas, W.I.; Alfayez, A.I.; Alharbi, A.S.; Almasuood, R.A.; Alsuhaibani, N.A. Knowledge about COVID-19 and beliefs about and use of herbal products during the COVID-19 pandemic: A cross-sectional study in Saudi Arabia. Saudi Pharm. J. 2020, 28, 1326–1332. [Google Scholar] [CrossRef]
- Kladar, N.; Bijelić, K.; Gatarić, B.; Bubić Pajić, N.; Hitl, M. Phytotherapy and Dietotherapy of COVID-19—An Online Survey Results from Central Part of Balkan Peninsula. Healthcare 2022, 10, 1678. [Google Scholar] [CrossRef]
- El Khoury, G.; Ramadan, W.; Zeeni, N. Herbal products and dietary supplements: A cross-sectional survey of use, attitudes, and knowledge among the Lebanese population. J. Comm. Health 2016, 41, 566–573. [Google Scholar] [CrossRef] [PubMed]
- Pohl, P.; Bielawska-Pohl, A.; Dzimitrowicz, A.; Jamroz, P.; Welna, M. Impact and practicability of recently introduced requirements on elemental impurities. Trends Anal. Chem. 2018, 101, 43–55. [Google Scholar] [CrossRef]
- Maithani, M.; Raturi, R.; Sharma, P.; Gupta, V.; Bansal, P. Elemental impurities in pharmaceutical products adding fuel to the fire. Reg. Toxicol. Pharmacol. 2019, 108, e104435. [Google Scholar] [CrossRef] [PubMed]
- Buhač, T.; Amidžić Klarić, D.; Klarić, I.; Nigović, B.; Brusač, E.; Jeličić, M.L.; Mornar, A. Assessment of active ingredients and metal impurities in phytoestrogen-containing food and dietary supplements. J. Food Nutr. Res. 2020, 59, 87–97. [Google Scholar]
- Mornar, A.; Sertić, M.; Amidžić Klarić, D.; Klarić, I.; Stipanović, K.; Nigović, B. Evaluation of alcohol content and metal impurities in liquid dietary supplements by sHSS-GC-FID and GFAAS techniques. Food Chem. 2016, 211, 285–293. [Google Scholar] [CrossRef]
- Bandara, S.B.; Towle, K.M.; Monnot, A.D. A human health risk assessment of heavy metal ingestion among consumers of protein powder supplements. Toxicol. Rep. 2020, 7, 1255–1262. [Google Scholar] [CrossRef] [PubMed]
- Alhusban, A.A.; Ata, S.A.; Shraim, S.A. The safety assessment of toxic metals in commonly used pharmaceutical herbal products and traditional herbs for infants in Jordanian market. Biol. Trace Elem. Res. 2019, 187, 307–315. [Google Scholar] [CrossRef] [PubMed]
- Barin, J.S.; Mello, P.A.; Mesko, M.F.; Duarte, F.A.; Flores, E.M.M. Determination of elemental impurities in pharmaceutical products and related matrices by ICP-based methods: A review. Anal. Bioanal. Chem. 2016, 408, 4547–4566. [Google Scholar] [CrossRef]
- Jairoun, A.A.; Shahwan, M.; Zyoud, S.H. Heavy Metal contamination of Dietary Supplements products available in the UAE markets and the associated risk. Sci. Rep. 2020, 10, e18824. [Google Scholar] [CrossRef] [PubMed]
- Ćwieląg-Drabek, M.; Piekut, A.; Szymala, I.; Oleksiuk, K.; Razzaghi, M.; Osmala, W.; Jabłońska, K.; Dziubanek, G. Health risks from consumption of medicinal plant dietary supplements. Food Sci. Nutr. 2020, 8, 3535–3544. [Google Scholar] [CrossRef] [PubMed]
- Augustsson, A.; Qvarforth, A.; Engström, E.; Pauluka, C.; Rodushkin, I. Trace and major elements in food supplements of different origin: Implications for daily intake levels and health risks. Toxicol. Rep. 2021, 8, 1067–1080. [Google Scholar] [CrossRef]
- EC (European Commission). Commission Regulation (EU) 2023/915 of 25 April 2023 on maximum levels for certain contaminants in food and repealing Regulation (EC) No 1881/2006. Off. J. Eur. Union 2023, L119, 103–157. [Google Scholar]
- ICH. International Council for Harmonization of Technical Requirements for Pharmaceuticals for Human Use. Guideline for Elemental Impurities Q3D(R1); European Medicines Agency: Amsterdam, The Netherlands, 2019. [Google Scholar]
- European Food Safety Authority. Scientific opinion of the Panel on Contaminants in the Food Chain on a request from the European Commission on cadmium in food. EFSA J. 2009, 980, 1–139. [Google Scholar]
- European Food Safety Authority. Scientific opinion on arsenic in food. EFSA J. 2009, 7, 1351. [Google Scholar] [CrossRef]
- European Food Safety Authority. Scientific opinion on lead in food. EFSA J. 2010, 8, 1570. [Google Scholar]
- European Food Safety Authority. Scientific Opinion on the risk for public health related to the presence of mercury and methylmercury in food. EFSA J. 2012, 10, 2985. [Google Scholar]
- Fortune Business Insights, Europe Dietary Supplements Market Size, Trends. Analysis [2020–2027]. Market Report Research. 2019. Available online: https://www.fortunebusinessinsights.com/industry-reports/europe-dietary-supplements-market-101918 (accessed on 5 December 2021).
- Hitl, M.; Gavarić, N.; Kladar, N.; Brkić, S.; Samojlik, I.; Dragović, G.; Božin, B. Herbal preparations use in prevention and treatment of gastrointestinal and hepatic disorders—Data from Vojvodina, Serbia. Complement. Ther. Med. 2019, 43, 265–270. [Google Scholar] [CrossRef] [PubMed]
- Jovičić-Bata, J.; Grujičić, M.; Novaković, B.; Čović, B. Epidemiology of dietary supplement use in Serbia: Report from Novi Sad. Complement. Ther. Med. 2019, 47, e102228. [Google Scholar] [CrossRef] [PubMed]
- Torović, L.; Srdjenović Čonić, B.; Kladar, N.; Lukić, D.; Bijelović, S. Elemental profile of recorded and unrecorded fruit spirits and health risk assessment. J. Food Compos. Anal. 2022, 114, e104807. [Google Scholar] [CrossRef]
- World Health Organization. Principles and Methods for the Risk Assessment of Chemicals in Food; International Programme on Chemical Safety, Environmental Health Criteria; WHO: Geneva, Siwtzerland; FAO: Rome, Italy, 2009; 240p. [Google Scholar]
- United States Environmental Protection Agency. Chapter 7: Characterizing Risk and Hazard. In Human Health Risk Assessment Protocol; EPA: Washington, DC, USA, 2005. [Google Scholar]
- World Health Organization. Guideline for Drinking-Water Quality. 2011. Available online: http://www.who.int/water_sanitation_health/publications/2011/dwq_guidelines/en/ (accessed on 30 October 2019).
- United States Environmental Protection Agency. Regional Screening Level (RSL) Summary Table. 2020. Available online: https://www.epa.gov/risk/regional-screening-levels-rsls-generic-tables (accessed on 9 January 2023).
- Institute of Public Health RS. Results of the Investigation of Health Status of Serbian Population—Year 2013; Institute of Public Health RS: Belgrade, Serbia, 2014. [Google Scholar]
- Poniedziałek, B.; Niedzielski, P.; Kozak, L.; Rzymski, P.; Wachelka, M.; Rzymska, I.; Karczewski, J.; Rzymski, P. Monitoring of essential and toxic elements in multi-ingredient food supplements produced in European Union. J. Consum. Prot. Food Saf. 2018, 13, 41–48. [Google Scholar] [CrossRef]
- Korfali, S.I.; Hawi, T.; Mroueh, M. Evaluation of heavy metals content in dietary supplements in Lebanon. Chem. Cent. J. 2013, 7, 10. [Google Scholar] [CrossRef]
- Benutić, A.; Marciuš, B.; Nemet, I.; Rončević, S. Chemometric classification and discrimination of herbal dietary supplements based on ICP-MS elemental profiling. J. Food Compos. Anal. 2022, 114, e104794. [Google Scholar] [CrossRef]
- Miroslawski, J.; Paukszto, A. Determination of the cadmium, chromium, nickel, and lead ions relays in selected Polish medicinal plants and their infusion. Biol. Trace Elem. Res. 2018, 182, 147–151. [Google Scholar] [CrossRef]
- Brodziak-Dopierala, B.; Fisher, A.; Szczelina, W.; Stojko, J. The content of mercury in herbal dietary supplements. Biol. Trace Elem. Res. 2018, 185, 236–243. [Google Scholar] [CrossRef]
- Kowalski, A.; Frankowski, M. Levels and potential health risks of mercury in prescription, non-prescription medicines and dietary supplements in Poland. Reg. Toxicol. Pharmacol. 2015, 73, 396–400. [Google Scholar] [CrossRef]
- Canbay, H.S.; Doğantürk, M. Metals determination by microwave digestion ICP-OES of some dietary supplements and diet products in Turkey. Eurasian J. Anal. Chem. 2017, 12, 45–53. [Google Scholar]
- Leal, G.C.; Mattiazzi, P.; Rovasi, F.; Dal Molin, T.; Bohrer, D.; Cicero do Nascimento, P.; de Carvalho, L.M.; Viana, C. Determination of lead in dietary supplements by high-resolution continuum-source graphite furnance atomic absorption spectrometry with direct solid sampling. J. Food Compos. Anal. 2020, 86, e103360. [Google Scholar] [CrossRef]
- Filipiak-Szok, A.; Kurzawa, M.; Cichosz, M.; Szlyk, E. Elemental analysis of medicinal herbs and dietary supplements. Anal. Lett. 2015, 48, 2626–2638. [Google Scholar] [CrossRef]
- Filipiak-Szok, A.; Kurzawa, M.; Szlyk, E. Determination of toxic metals by ICP-MS in Asiatic and European medicinal plants and dietary supplements. J. Trace Elem. Med. Biol. 2015, 30, 54–58. [Google Scholar] [CrossRef]
- Budnik, L.T.; Baur, X.; Harth, V.; Hahn, A. Alternative drugs go global: Possible lead and/or mercury intoxication from imported natural health products and a need for scientifically evaluated poisoning monitoring from environmental exposures. J. Occup. Med. Toxicol. 2016, 11, 49. [Google Scholar] [CrossRef]
- Costa, J.G.; Vidovic, B.; Saraiva, N.; do Céu Costa, M.; Del Favero, G.; Marko, D.; Oliveira, N.G.; Fernandes, A.S. Contaminants: A dark side of food supplements? Free Radic. Res. 2019, 53, 1113–1135. [Google Scholar] [CrossRef]
- Schwalfenberg, G.; Rodushkin, I.; Genuis, S.J. Heavy metal contamination of prenatal vitamins. Toxicol. Rep. 2018, 5, 390–395. [Google Scholar] [CrossRef] [PubMed]
- Amariei, S.; Gutt, G.; Oroian, M. Study on toxic metal levels in food supplements. Rev. Chim. 2017, 68, 1298–1301. [Google Scholar] [CrossRef]
- Udousoro, I.; Ikem, A.; Akinbo, O.T. Content and daily intake of essential and potentially toxic elements from dietary supplements marketed in Nigeria. J. Food Compos. Anal. 2017, 62, 23–34. [Google Scholar] [CrossRef]
- Bu, K.; Cizdziel, J.V.; Reidy, L. Analysis of herbal supplements for selected dietary minerals and trace elements by laser ablation- and solution-based ICPMS. Microchem. J. 2013, 106, 244–249. [Google Scholar] [CrossRef]
- European Food Safety Authority. Lead dietary exposure in the European population. EFSA J. 2012, 10, 2831. [Google Scholar]
- European Food Safety Authority. Cadmium dietary exposure in the European population. EFSA J. 2012, 10, 2551. [Google Scholar] [CrossRef]
- European Food Safety Authority. Scientific report on the chronic dietary exposure to inorganic arsenic. EFSA J. 2021, 19, 6380. [Google Scholar]
- Srdjenović Čonić, B.; Torović, L.; Kladar, N.; Božin, B.; Sudji, J. Health risk assessment for pediatric population associated with ethanol and selected residual solvents in herbal based products. Reg. Toxicol. Pharmacol. 2019, 107, e104406. [Google Scholar] [CrossRef]
- Vojvodić, S.; Srđenović Čonić, B.; Torović, L. Safety assessment of herbal food supplements: Ethanol and residual solvents associated risk. J. Food Compos. Anal. 2023, 22, e105483. [Google Scholar] [CrossRef]
- Veprikova, Z.; Zachariasova, M.; Dzuman, Z.; Zachariasova, A.; Fenclova, M.; Slavikova, P.; Vaclavikova, M.; Mastovska, K.; Hengst, D.; Hajslova, J. Mycotoxins in plant-based food supplements: Hidden health risk for consumers. J. Agric. Food Chem. 2015, 63, 6633–6643. [Google Scholar] [CrossRef]


| Element | All (52) | All Paediatric (35) | Paediatric Only (6) | Adults Only (17) | ||||||||
|---|---|---|---|---|---|---|---|---|---|---|---|---|
| N (%) Detected | Mean ± SD (µg/kg) | Max (µg/kg) | N (%) Detected | Mean ± SD (µg/kg) | Max (µg/kg) | N (%) Detected | Mean ± SD (µg/kg) | Max (µg/kg) | N (%) Detected | Mean ± SD (µg/kg) | Max (µg/kg) | |
| Be | 6 (11.5) | 0.3 ± 0.8 | 3.5 | 3 (8.6) | 0.2 ± 0.7 | 2.9 | 0 (0) | 0.0 | 0.0 | 3 (17.6) | 0.4 ± 0.9 | 3.5 |
| B a,b | 32 (61.5) | 826 ± 2118 | 14,685 | 15 (42.9) | 275 ± 594 | 3050 | 5 (83.3) | 464 ± 468 | 1327 | 17 (100) | 1961 ± 3394 | 14,685 |
| Al | 27 (51.9) | 555 ± 834 | 3515 | 15 (42.9) | 430 ± 704 | 2641 | 2 (33.3) | 495 ± 1060 | 2642 | 12 (70.6) | 813 ± 1030 | 3515 |
| V | 23 (44.2) | 12.7 ± 21.5 | 111 | 16 (47.1) | 12.7 ± 18.3 | 79.2 | 3 (50.0) | 23.4 ± 32.7 | 79.2 | 7 (41.2) | 13.4 ± 27.9 | 111 |
| Cr | 19 (36.5) | 41.1 ± 86.8 | 454 | 12 (35.3) | 36.9 ± 73.1 | 358 | 3 (50.0) | 97.3 ± 147 | 358 | 7 (41.2) | 52.1 ± 113 | 454 |
| Mn b | 49 (94.2) | 1132 ± 3277 | 20,846 | 32 (91.4) | 359 ± 717 | 3717 | 6 (100) | 577 ± 786 | 2130 | 17(100) | 2725 ± 5397 | 20,846 |
| Fe | 31 (59.6) | 2564 ± 6012 | 38,400 | 19 (54.3) | 1723 ± 2849 | 11,879 | 4 (66.7) | 2661 ± 3276 | 8255 | 12 (70.6) | 4297 ± 9656 | 38,400 |
| Co | 33 (63.5) | 1.5 ± 2.2 | 13.0 | 21 (60.0) | 1.5 ± 2.5 | 13.0 | 5 (83.3) | 4.0 ± 4.6 | 13.0 | 12 (70.6) | 1.5 ± 1.5 | 4.2 |
| Ni b | 45 (86.5) | 57.0 ± 91.7 | 560 | 28 (80.0) | 45.8 ± 92.7 | 560 | 6 (100) | 140 ± 207 | 560 | 17 (100) | 80.1 ± 87.6 | 385 |
| Cu | 48 (92.3) | 917 ± 5774 | 41,745 | 32 (91.4) | 1279 ± 7041 | 41,745 | 6 (100) | 7086 ± 16,978 | 41,745 | 16 (94.1) | 172 ± 147 | 473 |
| Zn b | 46 (88.5) | 10,531 ± 50,532 | 349,961 | 29 (82.9) | 11,471 ± 59,001 | 349,961 | 6(100) | 61,787 ± 141,336 | 349,961 | 17 (100) | 8598 ± 27,131 | 11,365 |
| As a,b | 29 (55.8) | 3.9 ± 6.0 | 26.1 | 16 (45.7) | 2.2 ± 3.8 | 16.7 | 5 (83.3) | 4.8 ± 6.7 | 16.7 | 13 (76.5) | 7.2 ± 8.1 | 26.1 |
| Sr b | 49 (94.2) | 316 ± 468 | 1955 | 33 (94.3) | 178 ± 336 | 1760 | 5 (83.3) | 393 ± 674 | 1760 | 16 (94.1) | 599 ± 577 | 1955 |
| Ag a,b | 16 (30.8) | 17.8 ± 43.3 | 238 | 4 (11.4) | 1.7 ± 6.1 | 33.5 | 0 (0) | 0.0 | 0.0 | 12 (70.6) | 51.1 ± 64.5 | 238 |
| Cd | 42 (80.8) | 1.2 ± 1.1 | 5.7 | 27 (77.1) | 1.1 ± 1.2 | 5.7 | 6 (100) | 2.4 ± 2.0 | 5.7 | 15 (88.2) | 1.5 ± 1.0 | 3.0 |
| Sn | 34 (66.7) | 15.5 ± 19.7 | 83.0 | 24 (70.6) | 19.2 ± 21.6 | 83.0 | 3 (50.0) | 22.0 ± 28.7 | 63.6 | 10 (58.8) | 8.1 ± 12.7 | 51.7 |
| Sb a,b | 19 (36.5) | 1.6 ± 3.3 | 20.0 | 7 (20.0) | 1.1 ± 3.6 | 20.0 | 3 (50.0) | 1.0 ± 1.1 | 2.2 | 12 (70.6) | 2.5 ± 2.5 | 7.8 |
| Te | 15 (28.8) | 1.2 ± 2.3 | 10.0 | 8 (22.9) | 1.0 ± 2.4 | 10.0 | 2 (33.3) | 2.0 ± 3.5 | 8.7 | 7 (41.2) | 1.6 ± 2.3 | 7.3 |
| Ba | 41 (78.8) | 354 ± 662 | 4436 | 25 (71.4) | 351 ± 792 | 4436 | 6 (100) | 1238 ± 1700 | 4436 | 16 (94.1) | 360 ± 254 | 904 |
| W a,b | 22 (42.3) | 196 ± 328 | 1512 | 9 (25.7) | 52.0 ± 106 | 400 | 4 (66.7) | 78.0 ± 62.2 | 146 | 13 (76.5) | 491 ± 426 | 1512 |
| Hg a,b | 20 (38.5) | 11.2 ± 17.5 | 70.5 | 8 (22.9) | 6.4 ± 13.3 | 55.0 | 1 (16.7) | 3.6 ± 8.8 | 21.7 | 12 (70.6) | 21.1 ± 21.2 | 70.5 |
| Tl b | 38 (73.1) | 0.5 ± 1.1 | 7.9 | 23 (65.7) | 0.2 ± 0.2 | 1.1 | 6 (100) | 0.2 ± 0.1 | 0.4 | 15 (88.2) | 1.0 ± 1.8 | 7.9 |
| Pb | 12 (23.1) | 5.2 ± 14.8 | 82.4 | 7 (20.0) | 4.1 ± 11.7 | 62.4 | 2 (33.3) | 12.0 ± 25.0 | 62.4 | 5 (29.4) | 7.3 ± 19.9 | 82.4 |
| Infants | Toddlers | Preschool Children | Children | Adolescents | Adults | ||
|---|---|---|---|---|---|---|---|
| Pb | mean a | 0.00 | 0.65 | 0.22 | 0.19 | 0.36 | 0.22 |
| high c | 1.7 | 0.56 | 0.49 | 0.79 | 0.51 | ||
| maximum e | 2.6 | 2.3 | 1.3 | 0.91 | 2.8 | 2.2 | |
| Cd | mean a | 0.00 | 0.12 | 0.13 | 0.12 | 0.20 | 0.19 |
| high c | 0.32 | 0.20 | 0.19 | 0.26 | 0.26 | ||
| maximum e | 0.04 | 0.48 | 0.26 | 0.36 | 0.43 | 0.39 | |
| Hg | mean a | 0.00 | 0.88 | 4.1 | 3.7 | 7.7 | 7.4 |
| high c | 2.8 | 8.8 | 8.2 | 14.8 | 13.6 | ||
| maximum e | 0.00 | 5.1 | 15.5 | 18.0 | 38.1 | 29.2 | |
| As | mean b | 0.04 | 1.3 | 1.7 | 1.5 | 2.7 | 3.1 |
| high d | 1.7 | 2.5 | 2.2 | 4.0 | 4.0 | ||
| maximum f | 1.1 | 1.0 | 3.8 | 2.6 | 3.2 | 4.8 | |
Disclaimer/Publisher’s Note: The statements, opinions and data contained in all publications are solely those of the individual author(s) and contributor(s) and not of MDPI and/or the editor(s). MDPI and/or the editor(s) disclaim responsibility for any injury to people or property resulting from any ideas, methods, instructions or products referred to in the content. |
© 2023 by the authors. Licensee MDPI, Basel, Switzerland. This article is an open access article distributed under the terms and conditions of the Creative Commons Attribution (CC BY) license (https://creativecommons.org/licenses/by/4.0/).
Share and Cite
Torović, L.; Vojvodić, S.; Lukić, D.; Srđenović Čonić, B.; Bijelović, S. Safety Assessment of Herbal Food Supplements: Elemental Profiling and Associated Risk. Foods 2023, 12, 2746. https://doi.org/10.3390/foods12142746
Torović L, Vojvodić S, Lukić D, Srđenović Čonić B, Bijelović S. Safety Assessment of Herbal Food Supplements: Elemental Profiling and Associated Risk. Foods. 2023; 12(14):2746. https://doi.org/10.3390/foods12142746
Chicago/Turabian StyleTorović, Ljilja, Slađana Vojvodić, Danijela Lukić, Branislava Srđenović Čonić, and Sanja Bijelović. 2023. "Safety Assessment of Herbal Food Supplements: Elemental Profiling and Associated Risk" Foods 12, no. 14: 2746. https://doi.org/10.3390/foods12142746
APA StyleTorović, L., Vojvodić, S., Lukić, D., Srđenović Čonić, B., & Bijelović, S. (2023). Safety Assessment of Herbal Food Supplements: Elemental Profiling and Associated Risk. Foods, 12(14), 2746. https://doi.org/10.3390/foods12142746