
Improving the Accuracy of Saffron Adulteration Classification and Quantification through Data Fusion of Thin-Layer Chromatography Imaging and Raman Spectral Analysis

Abstract
:
1. Introduction
2. Materials and Methods
2.1. Chemicals and Reagents
2.2. Sample Preparation
2.3. Data Acquisition
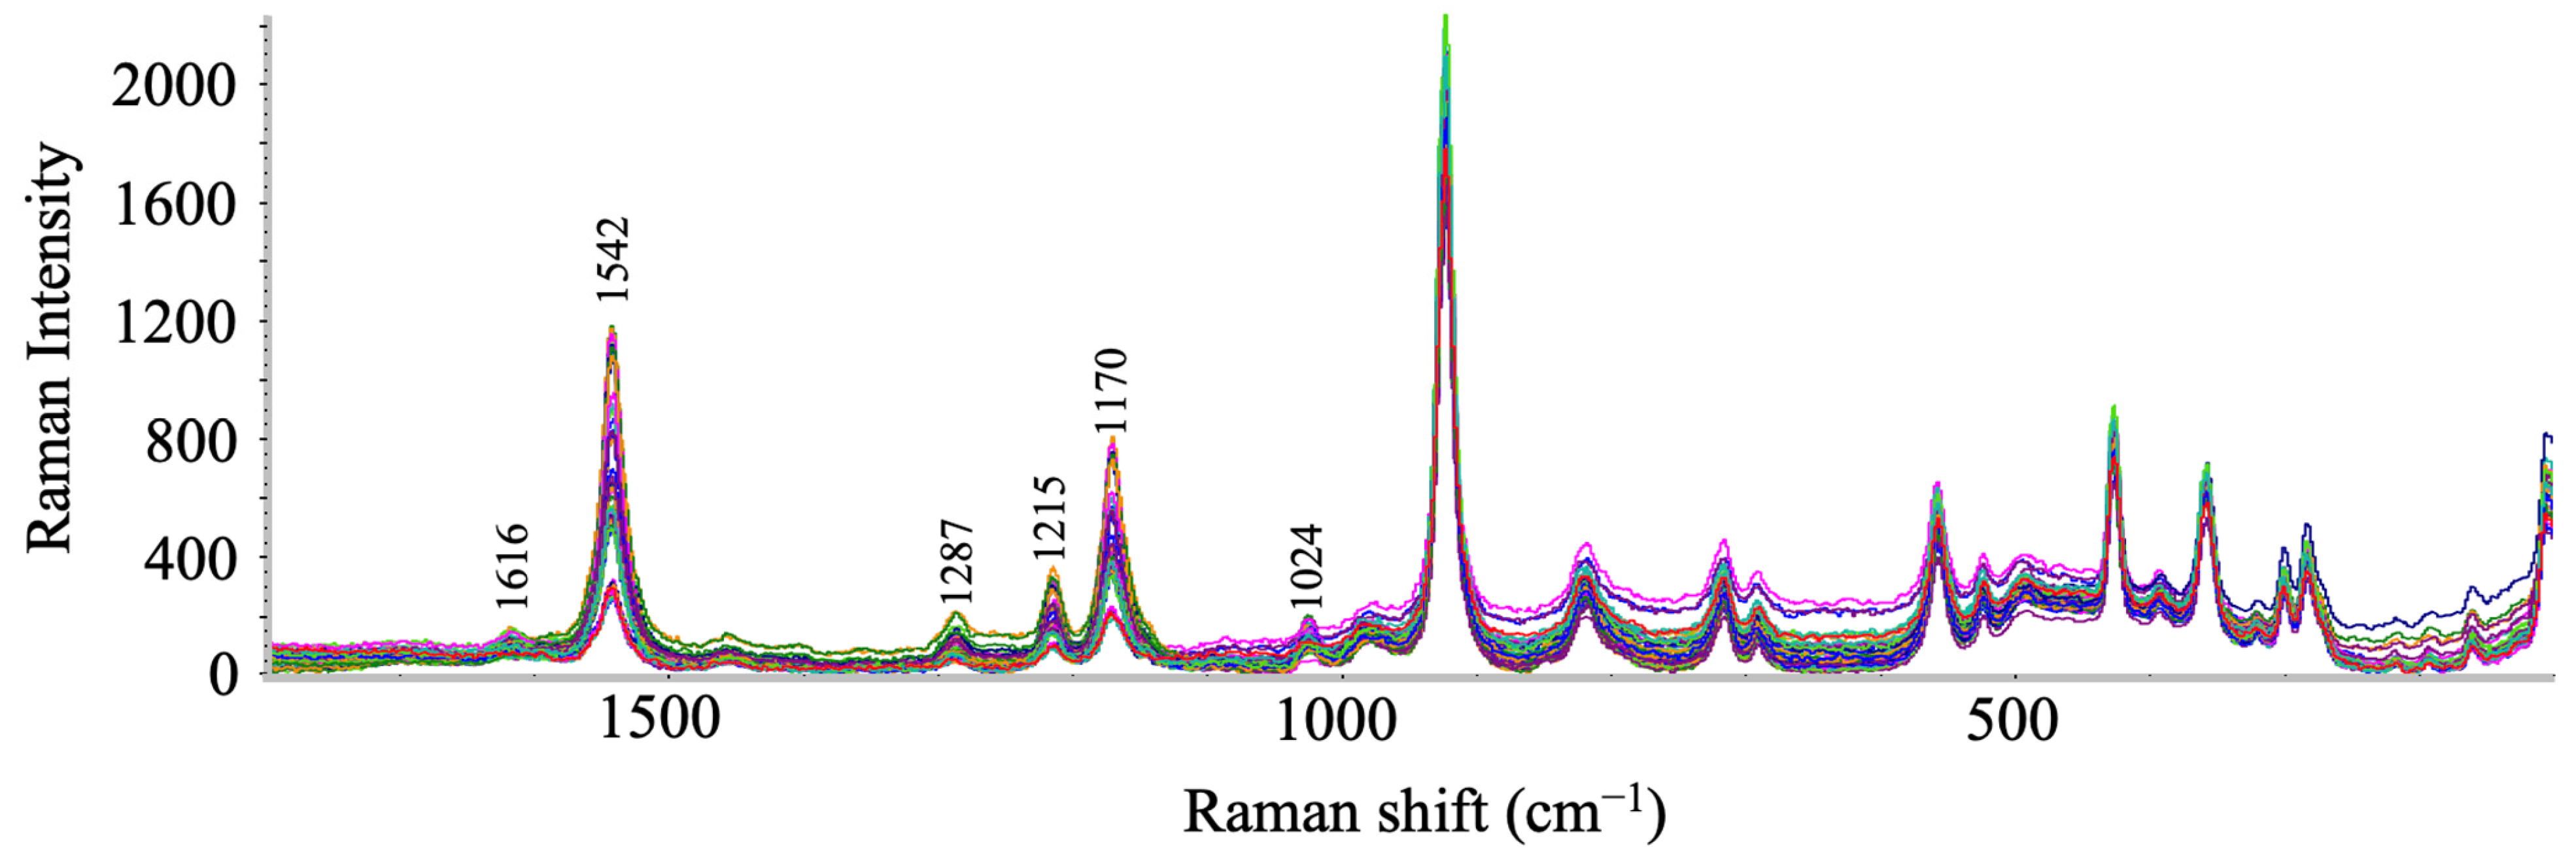
2.3.1. Raw and Featured Raman Spectral Data
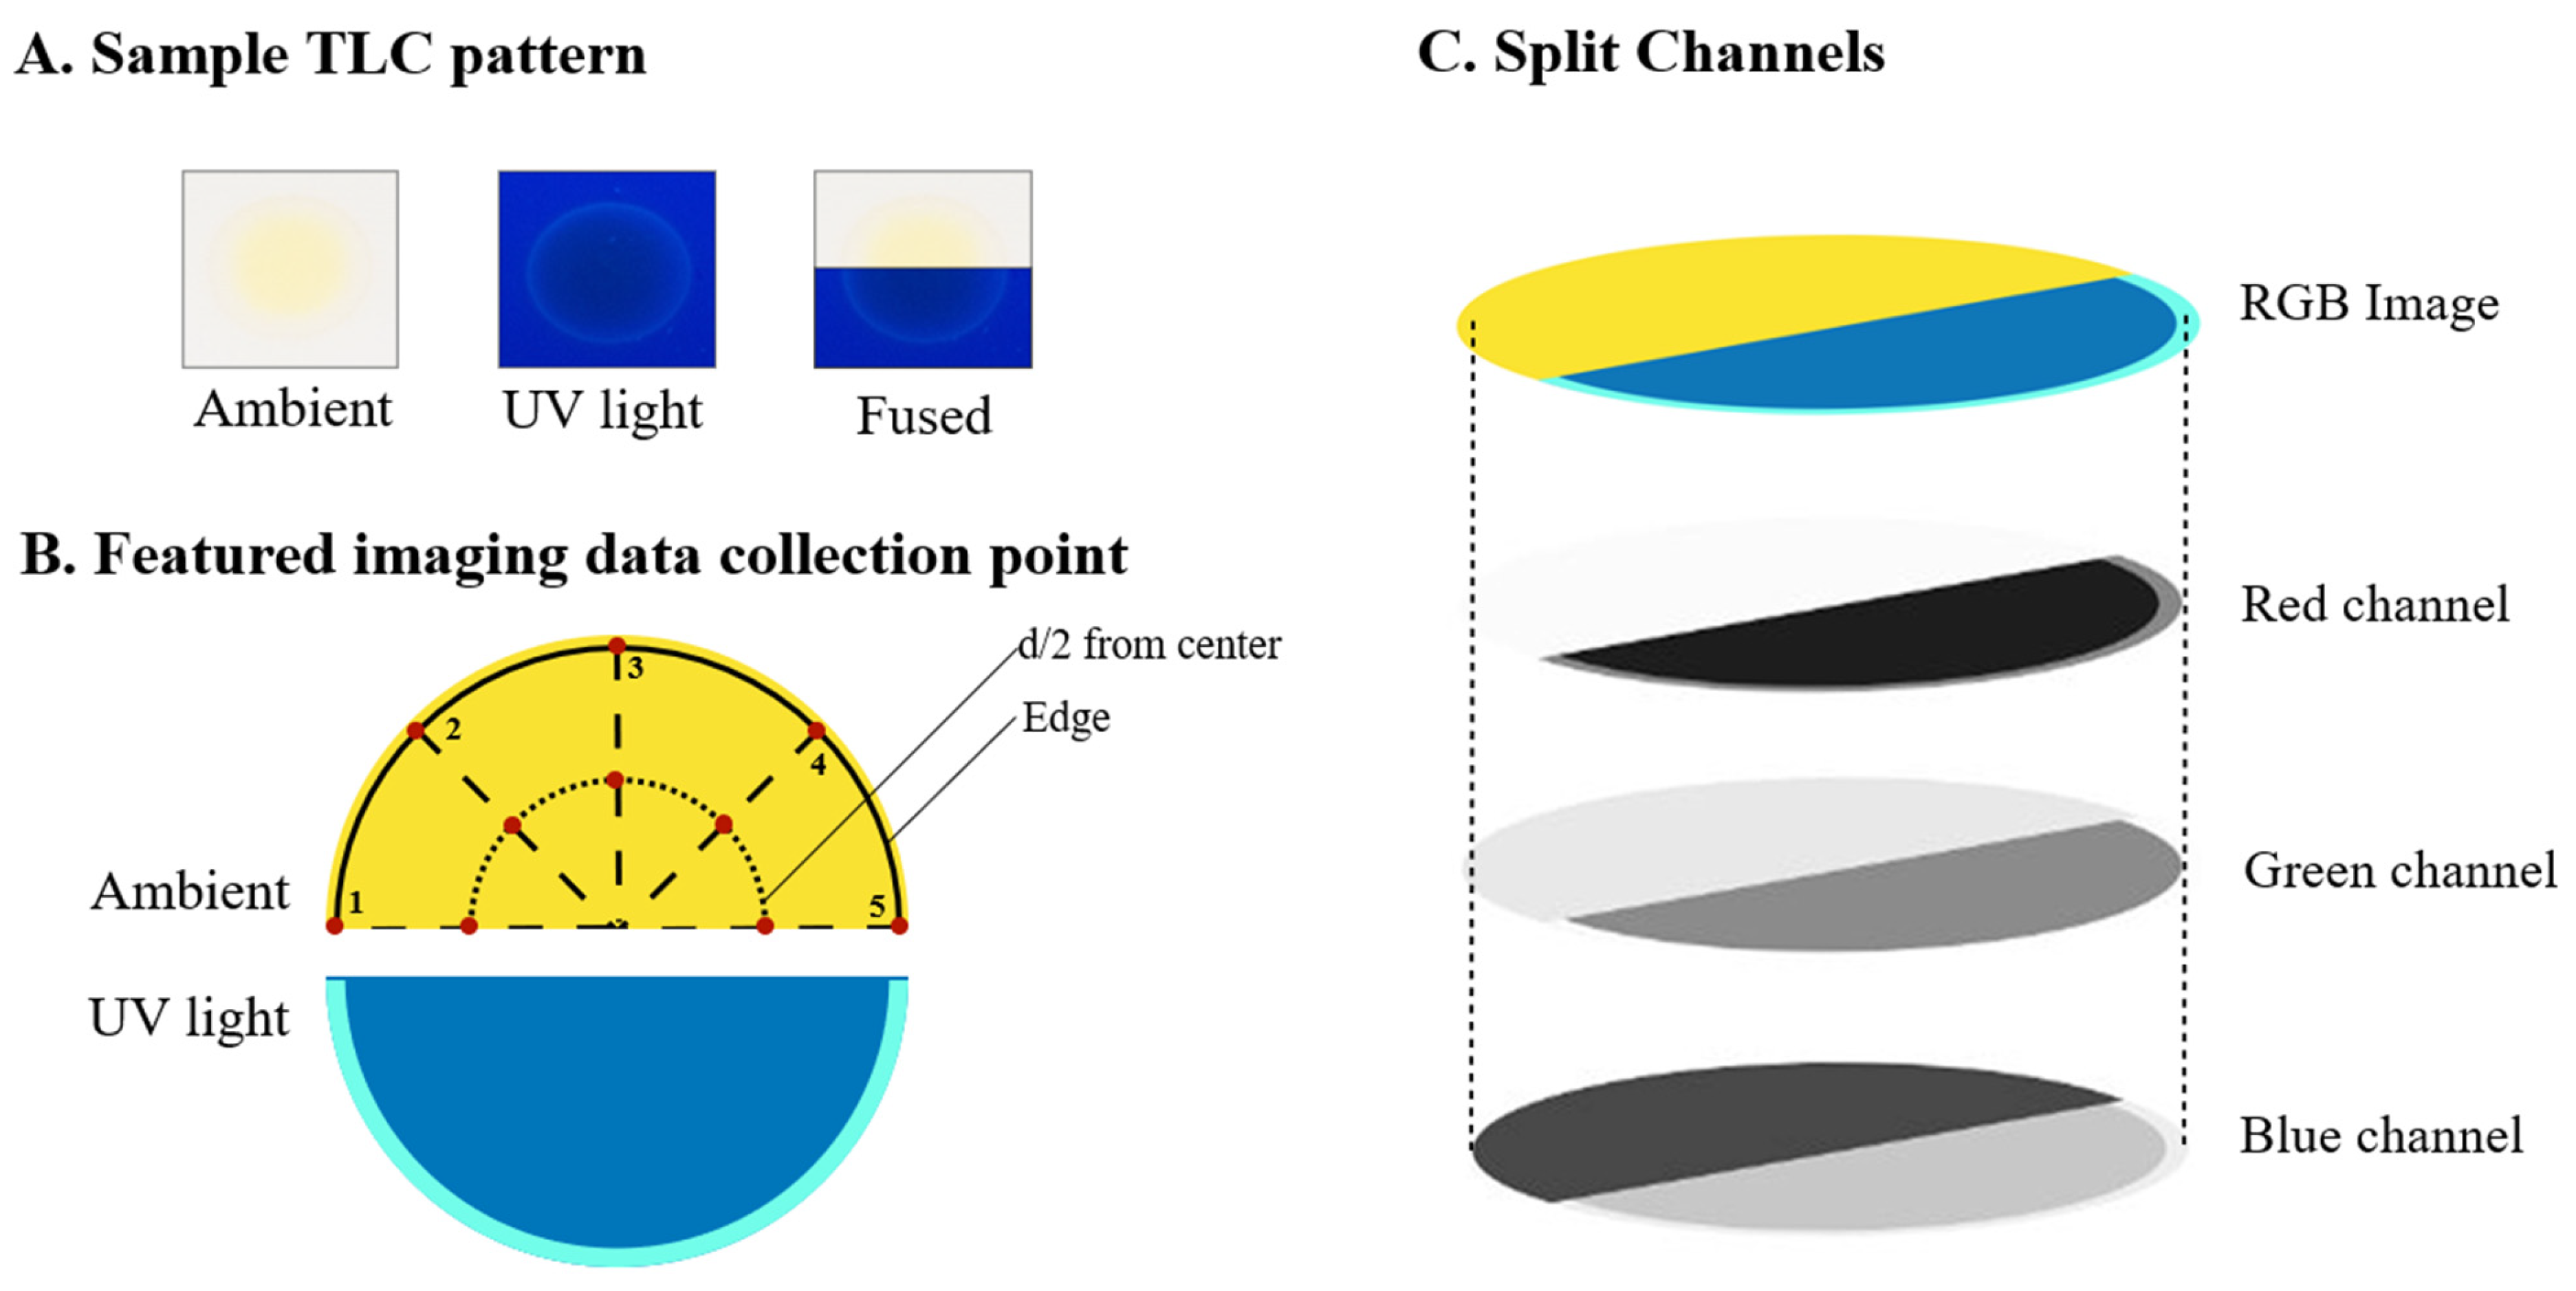
2.3.2. Raw and Featured Imaging Data
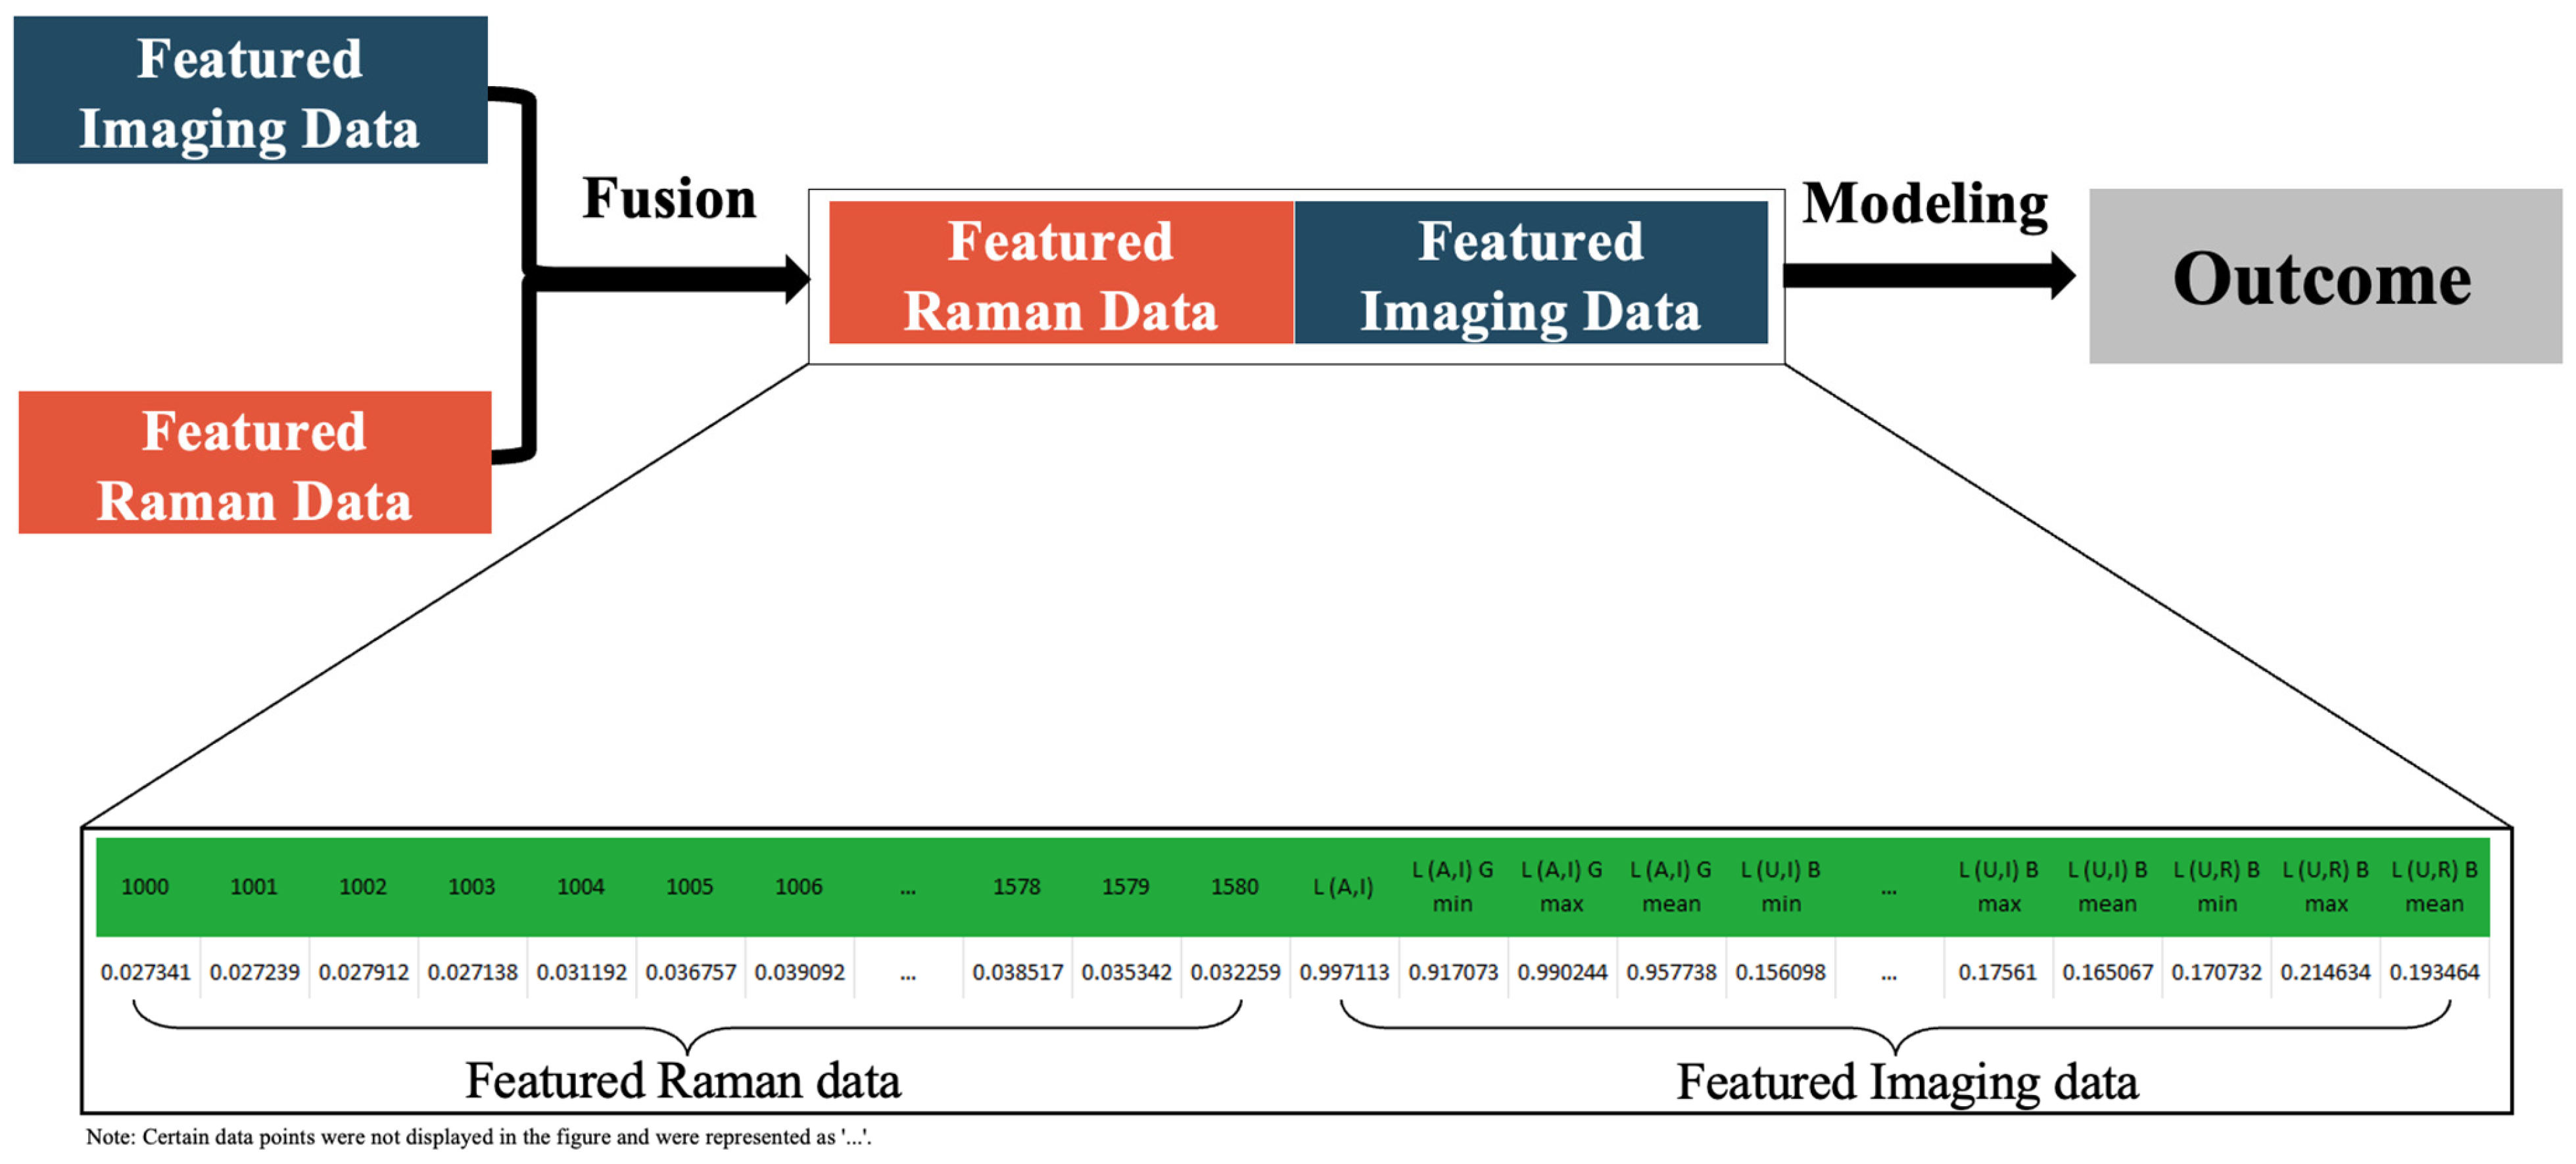
2.4. Data Fusion
2.5. Partial Least Squares Discriminant Analysis
2.6. Partial Least Square (PLS)—Regression of Quantification
3. Results and Discussion
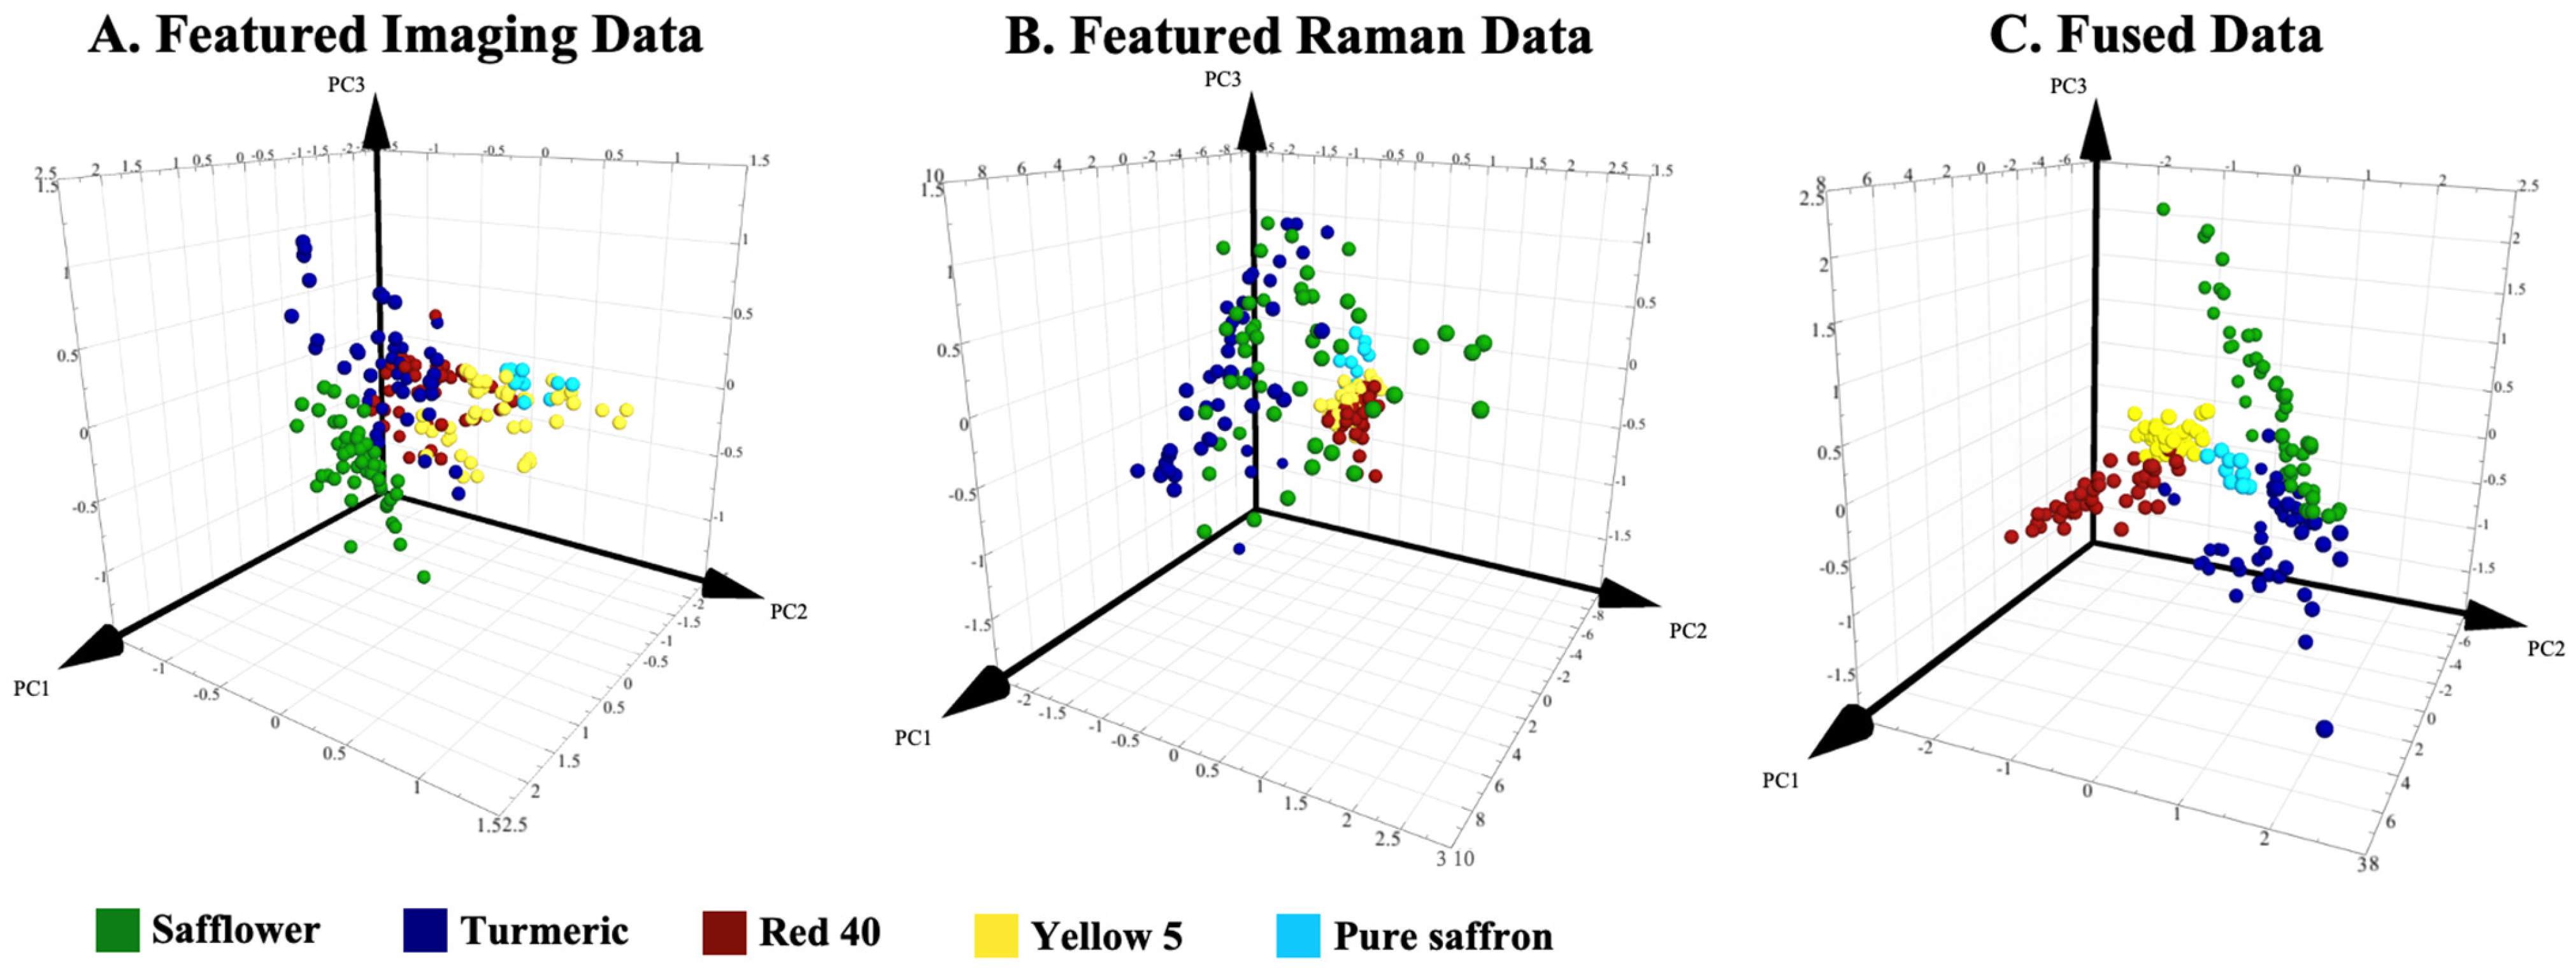
3.1. The Effect of Mid-Level Fusion on Classification Performance
3.2. Mid-Level Fusion Model Validation for Adulteration Classification
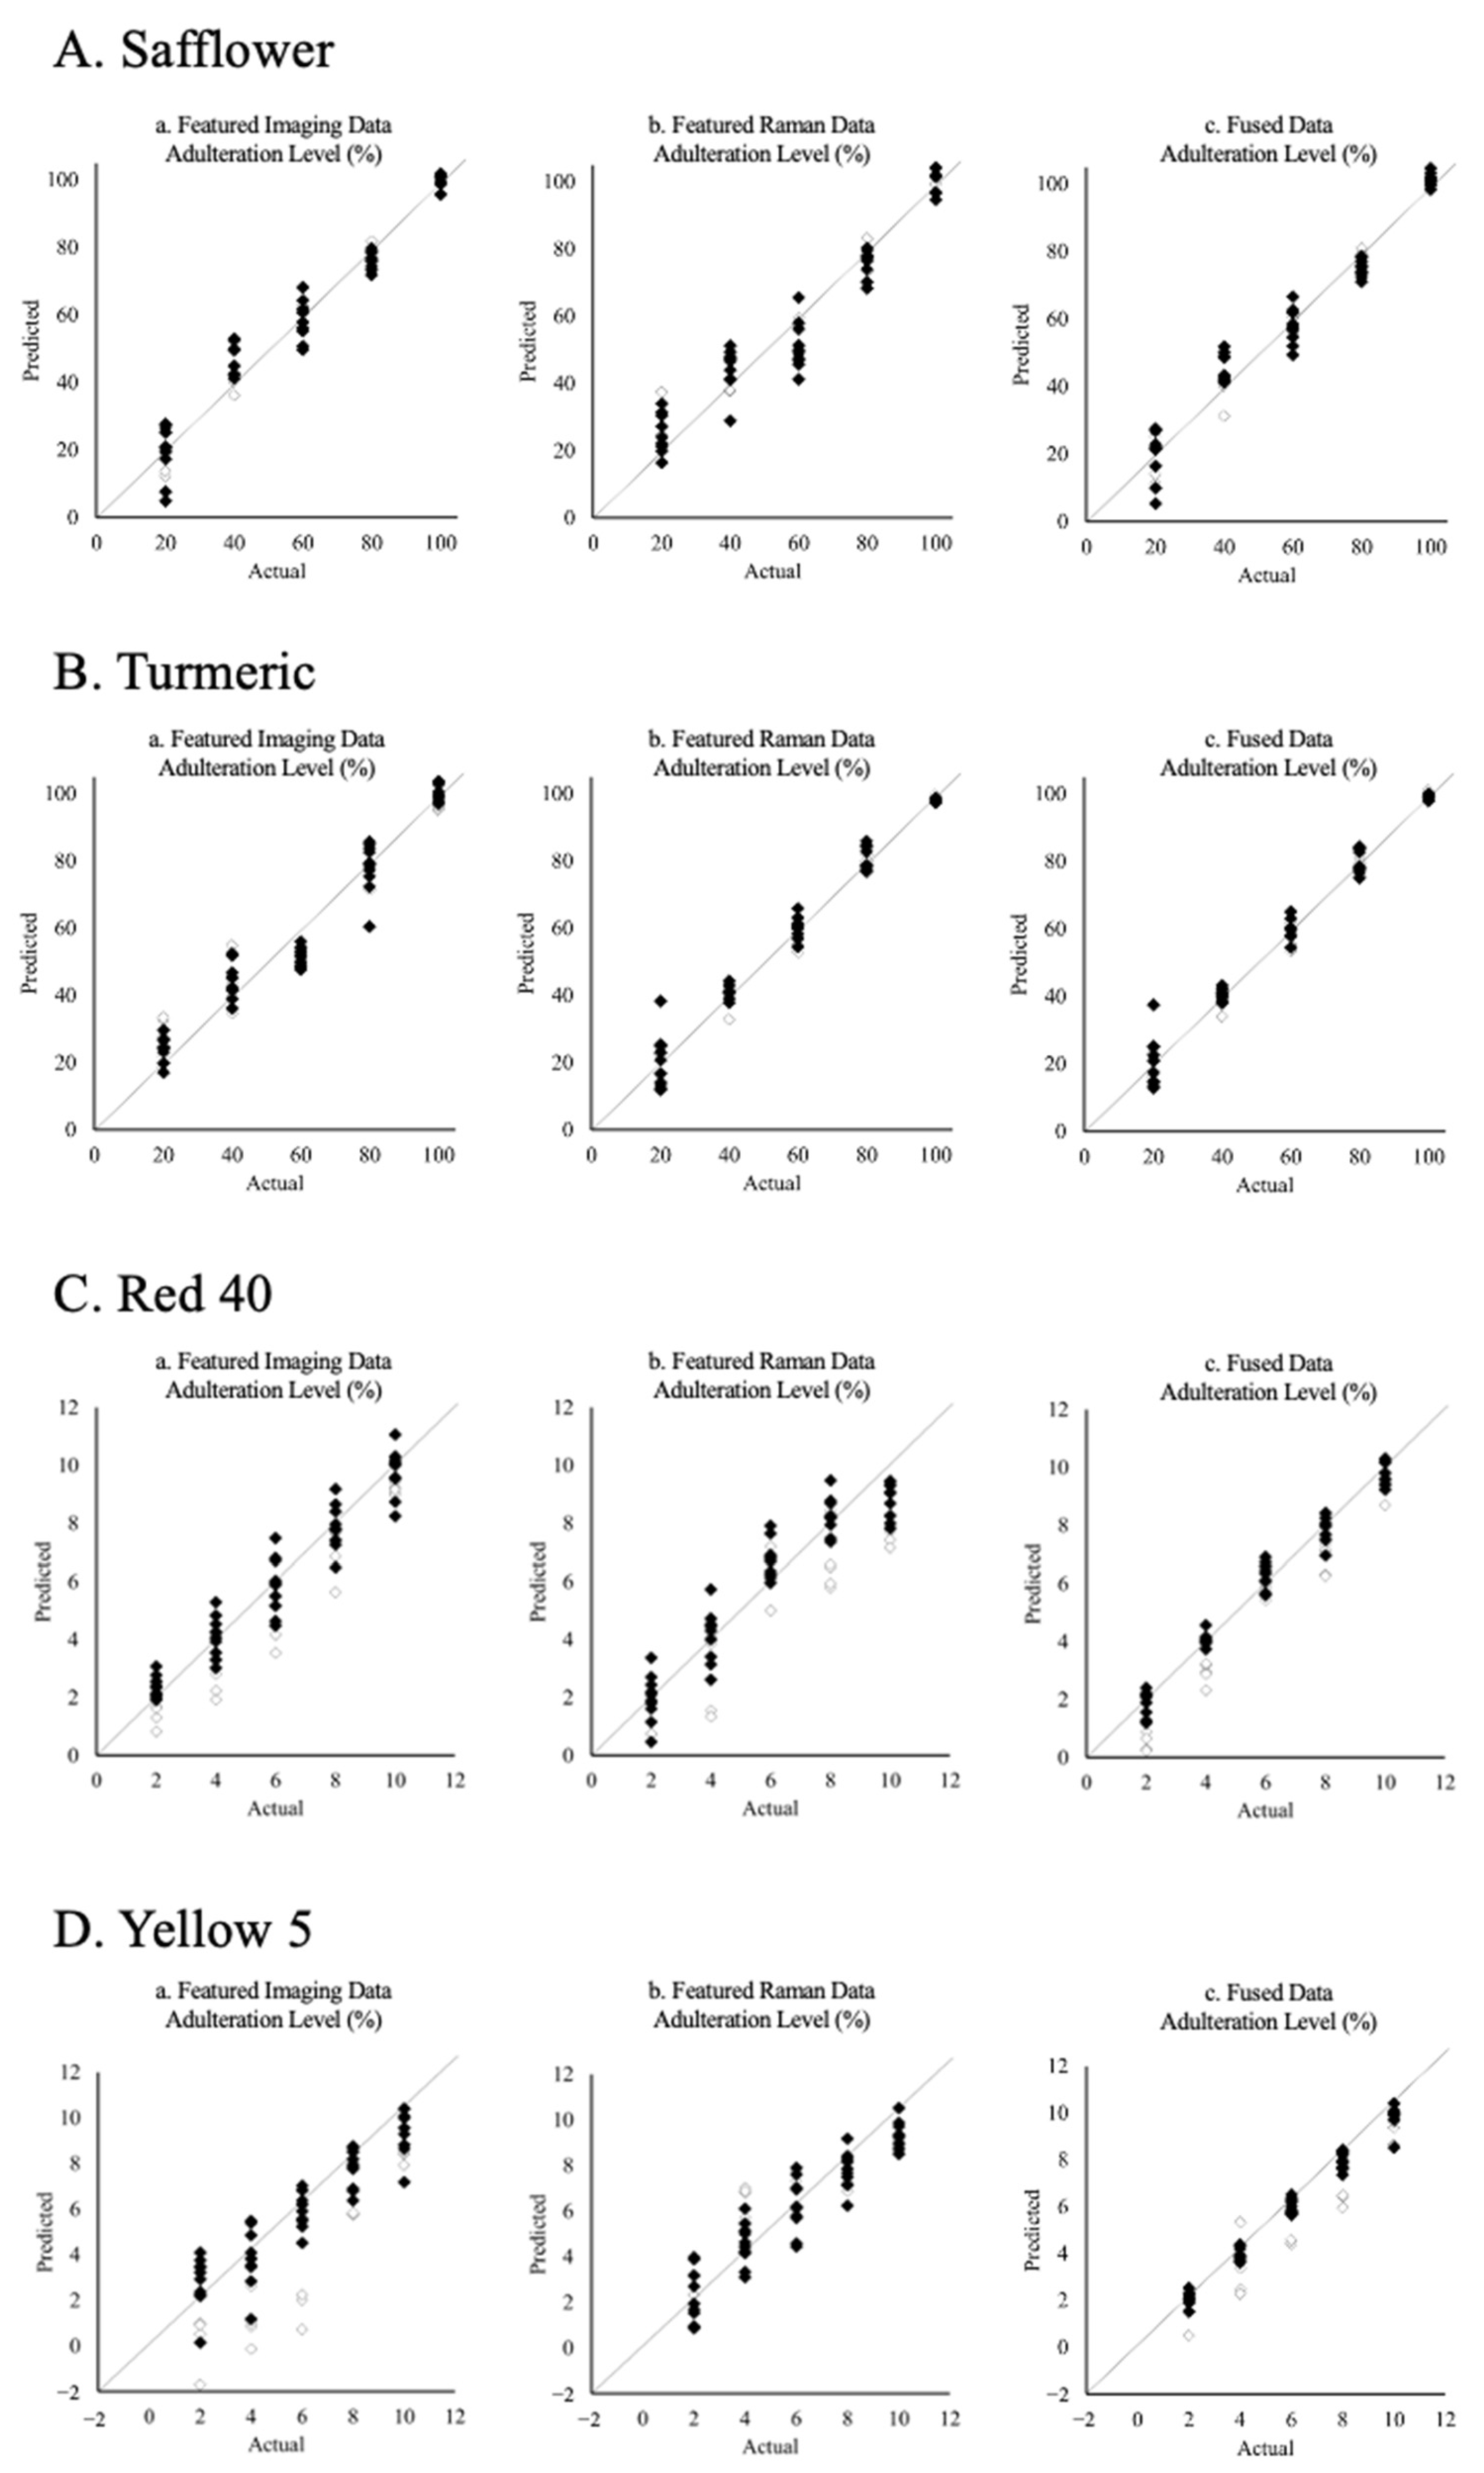
3.3. The Effect of Data Fusion on PLS Model Quantification Performances
4. Conclusions
Supplementary Materials
Author Contributions
Funding
Data Availability Statement
Conflicts of Interest
References
- Heidarbeigi, K.; Mohtasebi, S.S.; Foroughirad, A.; Ghasemi-Varnamkhasti, M.; Rafiee, S.; Rezaei, K. Detection of Adulteration in Saffron Samples Using Electronic Nose. Int. J. Food Prop. 2014, 18, 1391–1401. [Google Scholar] [CrossRef]
- Sujata, V.; Ravishankar, G.A.; Venkataraman, L.V. Methods for the analysis of the saffron metabolites crocin, crocetins, picrocrocin and safranal for the determination of the quality of the spice using thin-layer chromatography, high-performance liquid chromatography and gas chromatography. J. Chromatogr. A 1992, 624, 497–502. [Google Scholar] [CrossRef]
- Huang, W.; Li, F.; Liu, Y.; Long, C. Identification of Crocus sativus (Iridaceae) and its adulterants by using DNA barcoding technique. Planta Med. 2014, 80, 36–42. [Google Scholar] [CrossRef]
- Melnyk, J.P.; Wang, S.N.; Massimo, M.F. Chemical and biological properties of the world’s most expensive spice: Saffron. Food Res. Int. 2010, 43, 1981–1989. [Google Scholar] [CrossRef]
- Hamidpour, R.; Hamidpour, S.; Hamidpour, M.; Shahlari, M. Effect of Crocus sativus and its active compounds for the treatment of several diseases: A review. Int. J. Case Rep. Images 2013, 4, 666. [Google Scholar] [CrossRef]
- Varliklioz Er, S.; Eksi-Kocak, H.; Yetim, H.; Boyaci, I.H. Novel Spectroscopic Method for Determination and Quantification of Saffron Adulteration. Food Anal. Methods 2016, 10, 1547–1555. [Google Scholar] [CrossRef]
- ISO 3632-1; Saffron (Crocus sativus Linneaus). Part 1: Specifications. International Organization For Standardization: London, UK, 2011.
- ISO 3632-2; Saffron (Crocus sativus Linneaus). Part 2: Test Methods. International Organization for Standardization: London, UK, 2010.
- Sabatino, L.; Scordino, M.; Gargano, M.; Belligno, A.; Traulo, P.; Gagliano, G. HPLC/PDA/ESI-MS Evaluation of Saffron (Crocus sativus L.) Adulteration. Nat. Prod. Commun. 2011, 6, 1934578X1100601. [Google Scholar] [CrossRef]
- Dai, H.; Gao, Q.; He, L. Rapid Determination of Saffron Grade and Adulteration by Thin-Layer Chromatography Coupled with Raman Spectroscopy. Food Anal. Methods 2020, 13, 2128–2137. [Google Scholar] [CrossRef]
- Zheng, J.; He, L. Surface-Enhanced Raman Spectroscopy for the Chemical Analysis of Food. Compr. Rev. Food Sci. Food Saf. 2014, 13, 317–328. [Google Scholar] [CrossRef]
- Borràs, E.; Ferré, J.; Boqué, R.; Mestres, M.; Aceña, L.; Busto, O. Data fusion methodologies for food and beverage authentication and quality assessment—A review. Anal. Chim. Acta 2015, 891, 1–14. [Google Scholar] [CrossRef] [PubMed]
- Cocchi, M. Data Fusion Methodology and Applications, 1st ed.; Elsevier: Amsterdam, The Netherlands, 2019; ISSN Book 31. [Google Scholar]
- Castanedo, F. A review of data fusion techniques. Sci. World J. 2013, 2013, 704504. [Google Scholar] [CrossRef]
- Rodriguez-Mendez, M.; Arrieta, A.; Parra, V.; Bernal, A.; Vegas, A.; Villanueva, S.; Gutierrez-Osuna, R.; AntoniodeSaja, J. Fusion of three sensory modalities for the multimodal characterization of red wines. IEEE Sens. J. 2004, 4, 348–354. [Google Scholar] [CrossRef]
- Zhou, L.; Zhang, C.; Qiu, Z.; He, Y. Information fusion of emerging non-destructive analytical techniques for food quality authentication: A survey. TrAC Trends Anal. Chem. 2020, 127, 115901. [Google Scholar] [CrossRef]
- Brás, L.P.; Bernardino, S.A.; Lopes, J.A.; Menezes, J.C. Multiblock PLS as an approach to compare and combine NIR and MIR spectra in calibrations of soybean flour. Chemom. Intell. Lab. Syst. 2005, 75, 91–99. [Google Scholar] [CrossRef]
- Maléchaux, A.; Laroussi-Mezghani, S.; Le Dréau, Y.; Artaud, J.; Dupuy, N. Multiblock chemometrics for the discrimination of three extra virgin olive oil varieties. Food Chem. 2020, 309, 125588. [Google Scholar] [CrossRef]
- Mehl, F.; Marti, G.; Merle, P.; Delort, E.; Baroux, L.; Sommer, H.; Wolfender, J.-C.; Rudaz, S.; Boccard, J. Integrating metabolomic data from multiple analytical platforms for a comprehensive characterisation of lemon essential oils. Flavour Fragr. J. 2015, 30, 131–138. [Google Scholar] [CrossRef]
- Dos Santos, C.A.T.; Páscoa, R.N.; Sarraguça, M.C.; Porto, P.A.; Cerdeira, A.L.; González-Sáiz, J.M.; Pizarro, C.; Lopes, J.A. Merging vibrational spectroscopic data for wine classification according to the geographic origin. Food Res. Int. 2017, 102, 504–510. [Google Scholar] [CrossRef]
- Biancolillo, A.; Foschi, M.; D’Archivio, A.A. Geographical classification of Italian saffron (Crocus sativus L.) by multi-block treatments of UV-Vis and IR spectroscopic data. Molecules 2020, 25, 2332. [Google Scholar] [CrossRef]
- Cheng, J.H.; Sun, D.W. Data fusion and hyperspectral imaging in tandem with least squares-support vector machine for prediction of sensory quality index scores of fish fillet. LWT-Food Sci. Technol. 2015, 63, 892–898. [Google Scholar] [CrossRef]
- Wang, S.; Huang, M.; Zhu, Q. Model fusion for prediction of apple firmness using hyperspectral scattering image. Comput. Electron. Agric. 2012, 80, 1–7. [Google Scholar] [CrossRef]
- Nanyam, Y.; Choudhary, R.; Gupta, L.; Paliwal, J. A decision-fusion strategy for fruit quality inspection using hyperspectral imaging. Biosyst. Eng. 2012, 111, 118–125. [Google Scholar] [CrossRef]
- Fan, S.; Li, C.; Huang, W.; Chen, L. Data fusion of two hyperspectral imaging systems with complementary spectral sensing ranges for blueberry bruising detection. Sensors 2018, 18, 4463. [Google Scholar] [CrossRef]
- Jin, G.; Wang, Y.J.; Li, M.; Li, T.; Huang, W.J.; Li, L.; Deng, W.-W.; Ning, J. Rapid and real-time detection of black tea fermentation quality by using an inexpensive data fusion system. Food Chem. 2021, 358, 129815. [Google Scholar] [CrossRef]
- Mishra, P.; Nordon, A.; Asaari, M.S.M.; Lian, G.; Redfern, S. Fusing spectral and textural information in near-infrared hyperspectral imaging to improve green tea classification modelling. J. Food Eng. 2019, 249, 40–47. [Google Scholar] [CrossRef]
- Salvi, M.; Michielli, N.; Molinari, F. Stain Color Adaptive Normalization (SCAN) algorithm: Separation and standardization of histological stains in digital pathology. Comput. Methods Programs Biomed. 2020, 193, 105506. [Google Scholar] [CrossRef] [PubMed]
- Van den Berg, R.A.; Hoefsloot, H.C.; Westerhuis, J.A.; Smilde, A.K.; Van der Werf, M.J. Centering, scaling, and transformations: Improving the biological information content of metabolomics data. BMC Genom. 2006, 7, 142. [Google Scholar] [CrossRef]
- Márquez, C.; López, M.I.; Ruisánchez, I.; Callao, M.P. FT-Raman and NIR spectroscopy data fusion strategy for multivariate qualitative analysis of food fraud. Talanta 2016, 161, 80–86. [Google Scholar] [CrossRef]
- Qi, L.; Zhang, J.; Zhao, Y.; Zuo, Z.; Wang, Y.Z.; Jin, H. Characterization of Gentiana rigescens by Ultraviolet–Visible and Infrared Spectroscopies with Chemometrics. Anal. Lett. 2017, 50, 1497–1511. [Google Scholar] [CrossRef]
- Qiu, S.; Wang, J.; Gao, L. Qualification and quantisation of processed strawberry juice based on electronic nose and tongue. LWT-Food Sci. Technol. 2015, 60, 115–123. [Google Scholar] [CrossRef]
- Rodriguez-Mendez, M.L.; Apetrei, C.; Gay, M.; Medina-Plaza, C.; De Saja, J.A.; Vidal, S.; Aagaard, O.; Ugliano, M.; Wirth, J.; Cheynier, V. Evaluation of oxygen exposure levels and polyphenolic content of red wines using an electronic panel formed by an electronic nose and an electronic tongue. Food Chem. 2014, 155, 91–97. [Google Scholar] [CrossRef] [PubMed]
- Biancolillo, A.; Marini, F.; Ruckebusch, C.; Vitale, R. Chemometric strategies for spectroscopy-based food authentication. Appl. Sci. 2020, 10, 6544. [Google Scholar] [CrossRef]
- Westerhuis, J.A.; Coenegracht, P.M. Multivariate modelling of the pharmaceutical two-step process of wet granulation and tableting with multiblock partial least squares. J. Chemom. A J. Chemom. Soc. 1997, 11, 379–392. [Google Scholar] [CrossRef]
- Yuan, X.; Huang, B.; Wang, Y.; Yang, C.; Gui, W. Deep learning-based feature representation and its application for soft sensor modeling with variable-wise weighted SAE. IEEE Trans. Ind. Inform. 2018, 14, 3235–3243. [Google Scholar] [CrossRef]

| Members | Correct (%) | Safflower | Turmeric | Red 40 | Yellow 5 | Pure Saffron | |
|---|---|---|---|---|---|---|---|
| A. Featured Imaging data | |||||||
| Safflower | 50 | 100% | 50 | 0 | 0 | 0 | 0 |
| Turmeric | 50 | 56% | 2 | 28 | 20 | 0 | 0 |
| Red 40 | 50 | 96% | 0 | 0 | 48 | 2 | 0 |
| Yellow 5 | 50 | 100% | 0 | 0 | 0 | 50 | 0 |
| Pure Saffron | 10 | 0% | 0 | 0 | 0 | 10 | 0 |
| Total | 210 | 83.81% | 52 | 28 | 68 | 62 | 0 |
| B. Featured Raman Data | |||||||
| Safflower | 50 | 94% | 47 | 3 | 0 | 0 | 0 |
| Turmeric | 50 | 94% | 3 | 47 | 0 | 0 | 0 |
| Red 40 | 50 | 80% | 0 | 0 | 40 | 10 | 0 |
| Yellow 5 | 50 | 72% | 0 | 0 | 14 | 36 | 0 |
| Pure Saffron | 10 | 100% | 0 | 0 | 0 | 0 | 10 |
| Total | 210 | 85.71% | 50 | 50 | 54 | 46 | 10 |
| C. Fused Data | |||||||
| Safflower | 50 | 100% | 50 | 0 | 0 | 0 | 0 |
| Turmeric | 50 | 100% | 1 | 49 | 0 | 0 | 0 |
| Red 40 | 50 | 98% | 0 | 0 | 50 | 0 | 0 |
| Yellow 5 | 50 | 100% | 0 | 0 | 0 | 50 | 0 |
| Pure Saffron | 10 | 100% | 0 | 0 | 0 | 0 | 10 |
| Total | 210 | 99.52% | 51 | 49 | 50 | 50 | 10 |
| Members | Correct (%) | Safflower | Turmeric | Red 40 | Yellow 5 | Pure Saffron | |
|---|---|---|---|---|---|---|---|
| Fused data (external validataion) | |||||||
| Safflower | 25 | 100% | 25 | 0 | 0 | 0 | 0 |
| Turmeric | 25 | 100% | 0 | 25 | 0 | 0 | 0 |
| Red 40 | 25 | 96% | 0 | 0 | 24 | 1 | 0 |
| Yellow 5 | 25 | 100% | 0 | 0 | 0 | 25 | 0 |
| Pure Saffron | 5 | 100% | 0 | 0 | 0 | 0 | 5 |
| Total | 105 | 99.20% | 25 | 25 | 24 | 26 | 5 |
| Featured Imaging Data | Featured Raman Data | Fused Data | |||||||
|---|---|---|---|---|---|---|---|---|---|
| R2 | RMSEP | RMSECV | R2 | RMSEP | RMSECV | R2 | RMSEP | RMSECV | |
| Safflower | 0.923 | 6.15 | 6.02 | 0.959 | 4.54 | 11.09 | 0.961 | 4.78 | 5.97 |
| Turmeric | 0.946 | 7.30 | 7.96 | 0.978 | 3.53 | 5.37 | 0.982 | 3.11 | 5.05 |
| Red 40 | 0.923 | 1.28 | 0.82 | 0.892 | 1.65 | 1.37 | 0.978 | 1.03 | 0.97 |
| Yellow 5 | 0.873 | 2.84 | 1.16 | 0.868 | 1.60 | 1.38 | 0.990 | 1.55 | 0.72 |
Disclaimer/Publisher’s Note: The statements, opinions and data contained in all publications are solely those of the individual author(s) and contributor(s) and not of MDPI and/or the editor(s). MDPI and/or the editor(s) disclaim responsibility for any injury to people or property resulting from any ideas, methods, instructions or products referred to in the content. |
© 2023 by the authors. Licensee MDPI, Basel, Switzerland. This article is an open access article distributed under the terms and conditions of the Creative Commons Attribution (CC BY) license (https://creativecommons.org/licenses/by/4.0/).
Share and Cite
Dai, H.; Gao, Q.; Lu, J.; He, L. Improving the Accuracy of Saffron Adulteration Classification and Quantification through Data Fusion of Thin-Layer Chromatography Imaging and Raman Spectral Analysis. Foods 2023, 12, 2322. https://doi.org/10.3390/foods12122322
Dai H, Gao Q, Lu J, He L. Improving the Accuracy of Saffron Adulteration Classification and Quantification through Data Fusion of Thin-Layer Chromatography Imaging and Raman Spectral Analysis. Foods. 2023; 12(12):2322. https://doi.org/10.3390/foods12122322
Chicago/Turabian StyleDai, Haochen, Qixiang Gao, Jiakai Lu, and Lili He. 2023. "Improving the Accuracy of Saffron Adulteration Classification and Quantification through Data Fusion of Thin-Layer Chromatography Imaging and Raman Spectral Analysis" Foods 12, no. 12: 2322. https://doi.org/10.3390/foods12122322
APA StyleDai, H., Gao, Q., Lu, J., & He, L. (2023). Improving the Accuracy of Saffron Adulteration Classification and Quantification through Data Fusion of Thin-Layer Chromatography Imaging and Raman Spectral Analysis. Foods, 12(12), 2322. https://doi.org/10.3390/foods12122322