
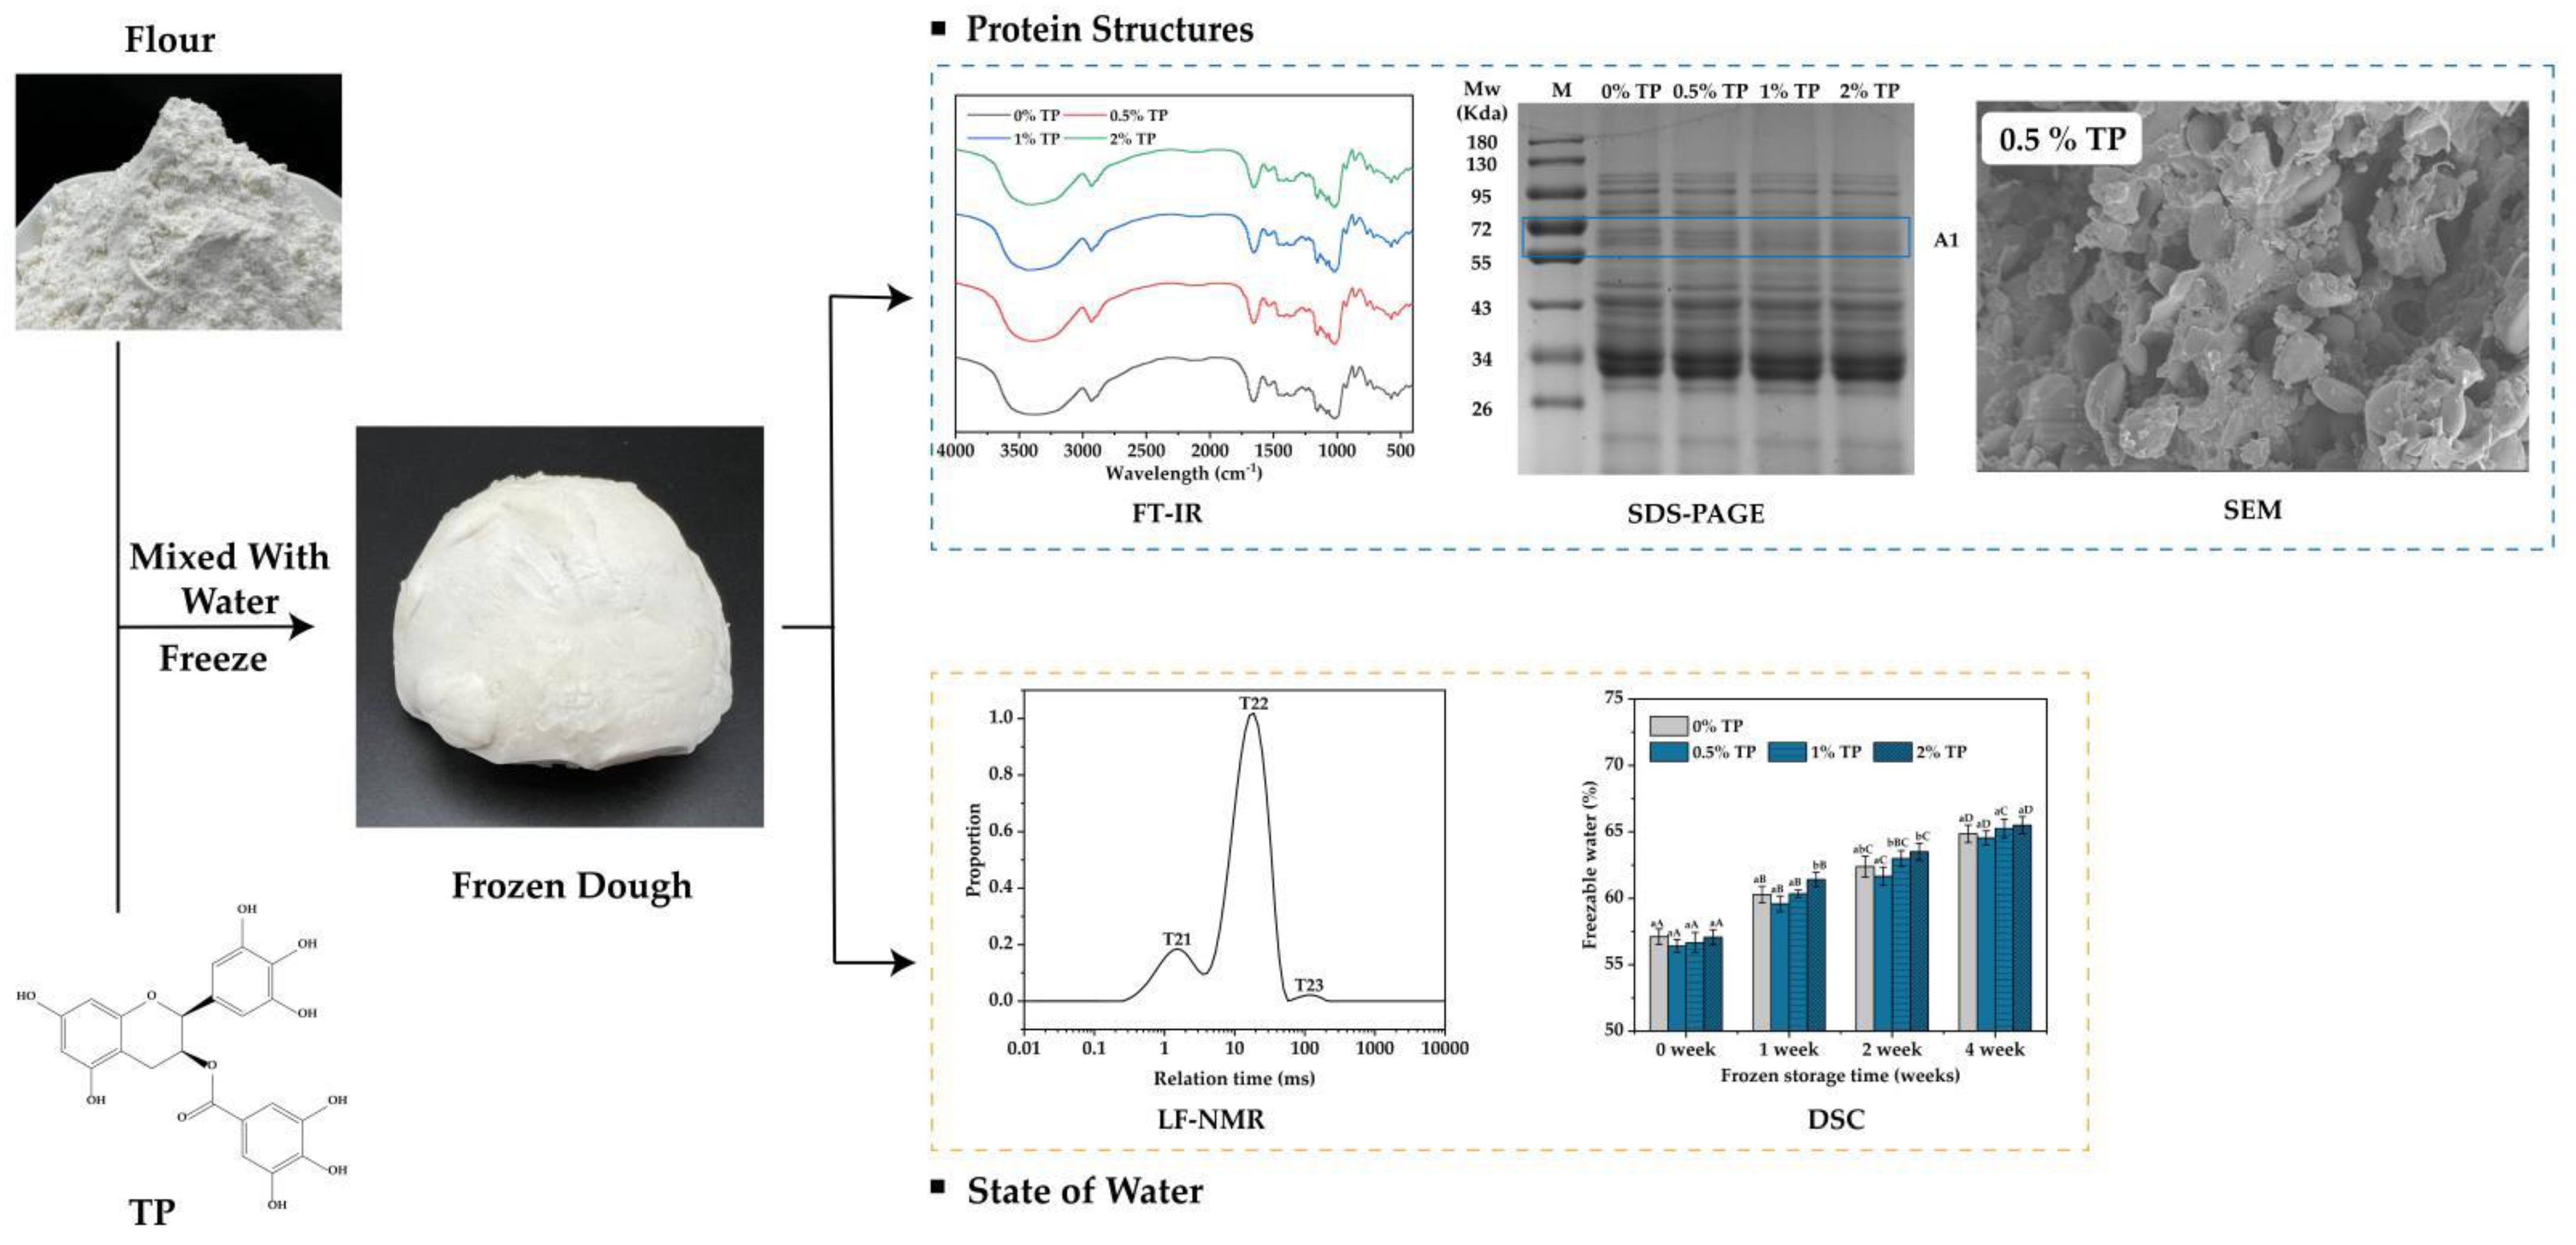
Effect of Tea Polyphenols on the Storage Stability of Non-Fermented Frozen Dough: Protein Structures and State of Water

 , and
, and
Abstract
1. Introduction
2. Materials and Methods
2.1. Materials
2.2. Preparations of the Dough
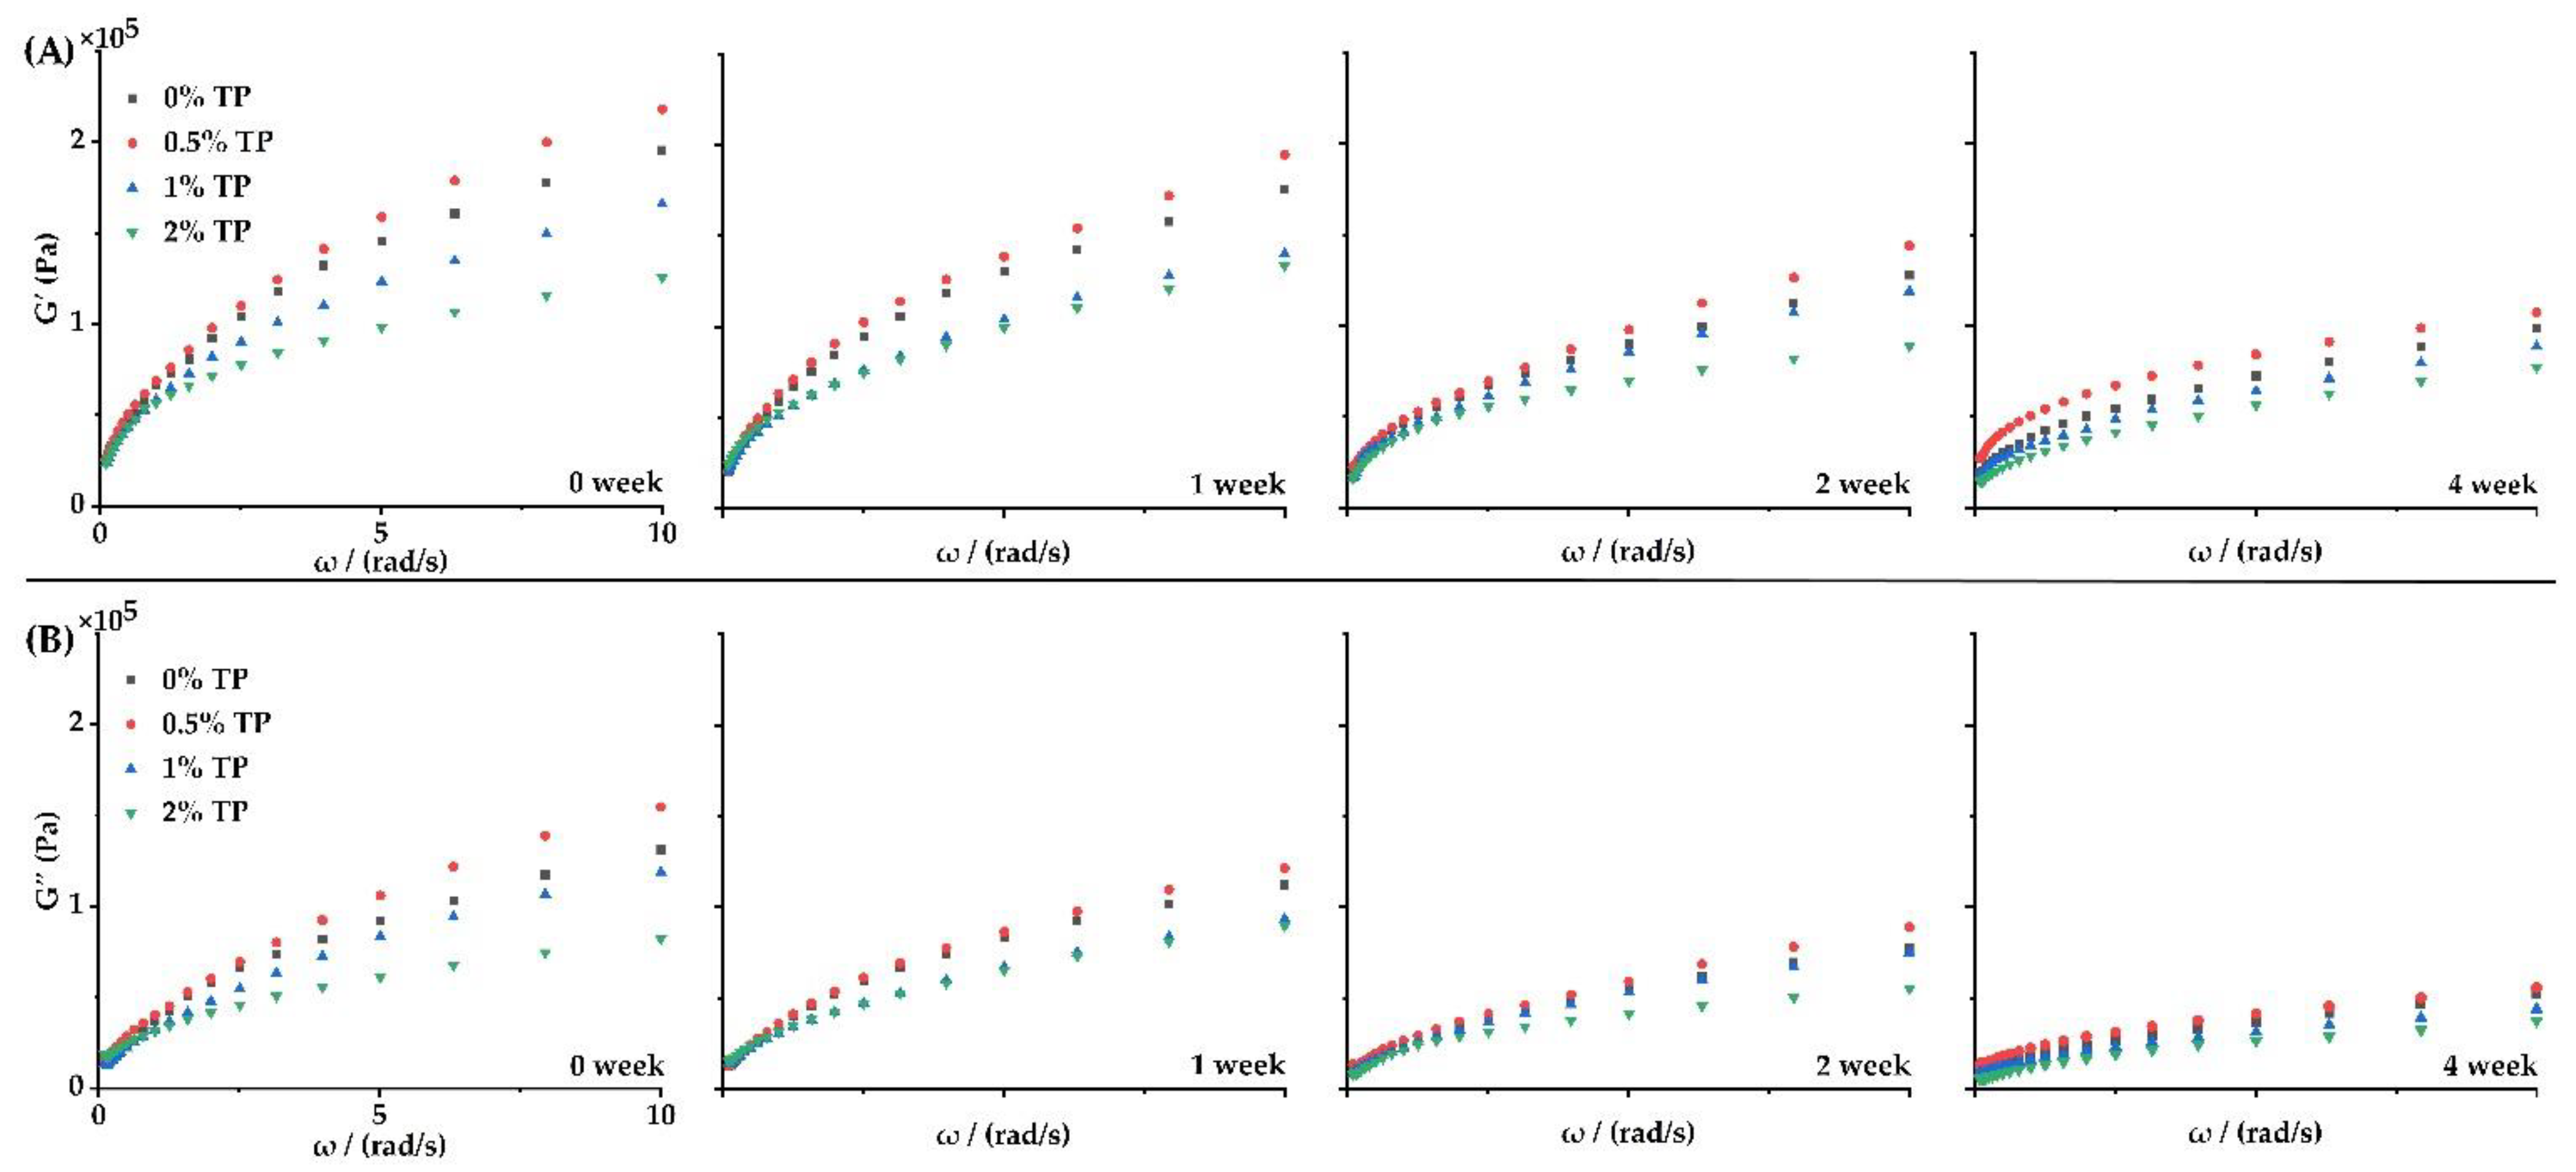
2.3. Rheology Tests
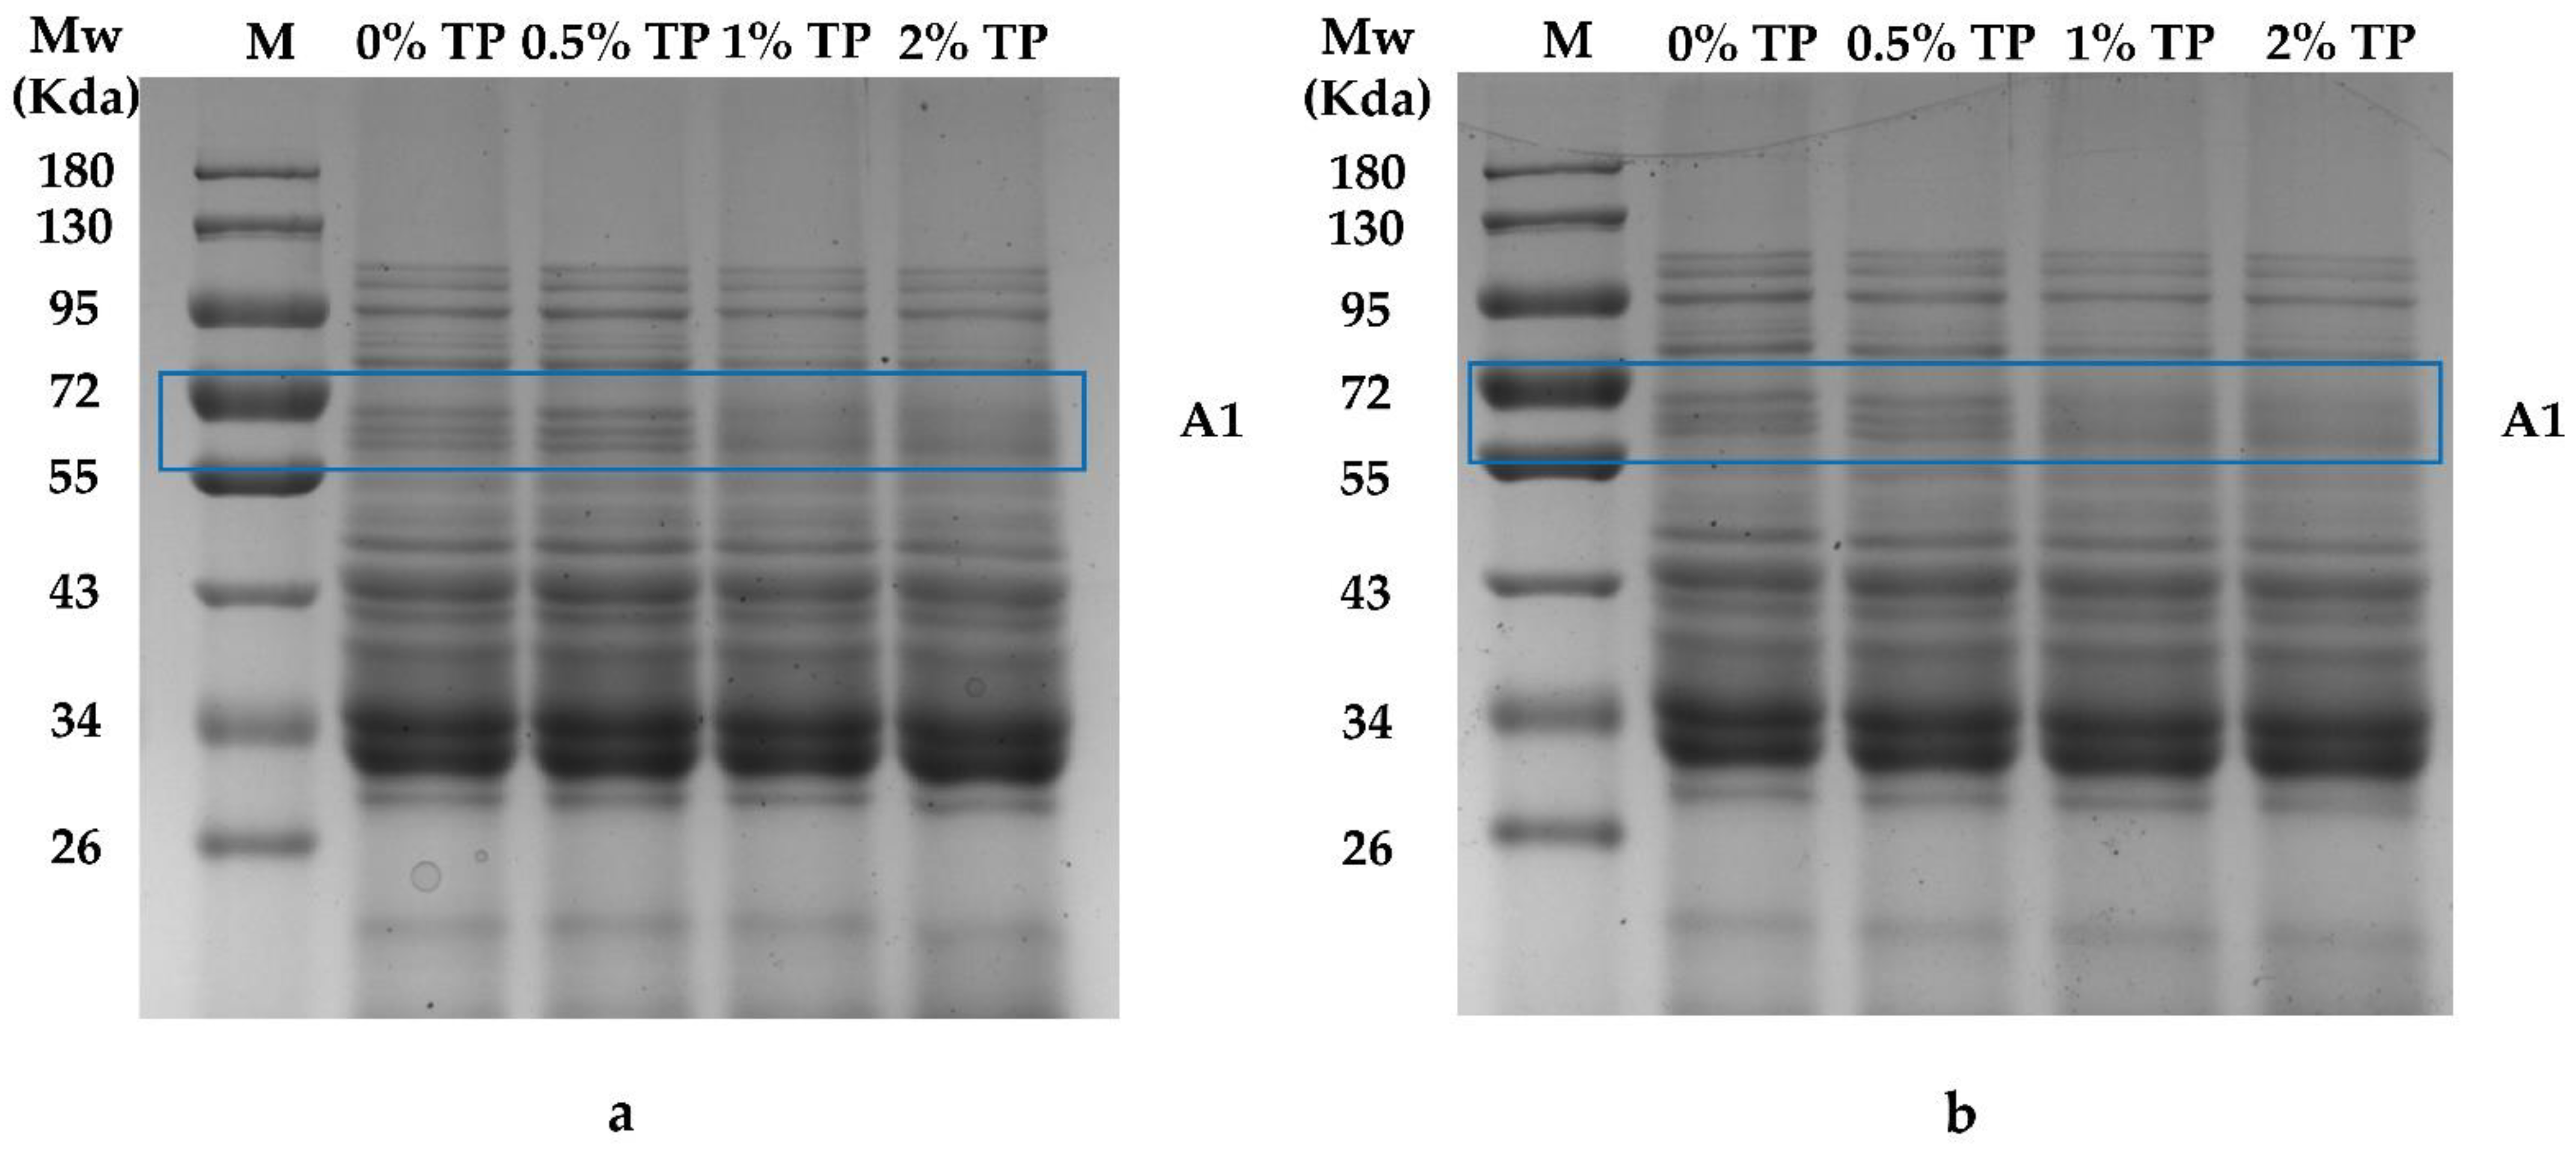
2.4. SDS-PAGE
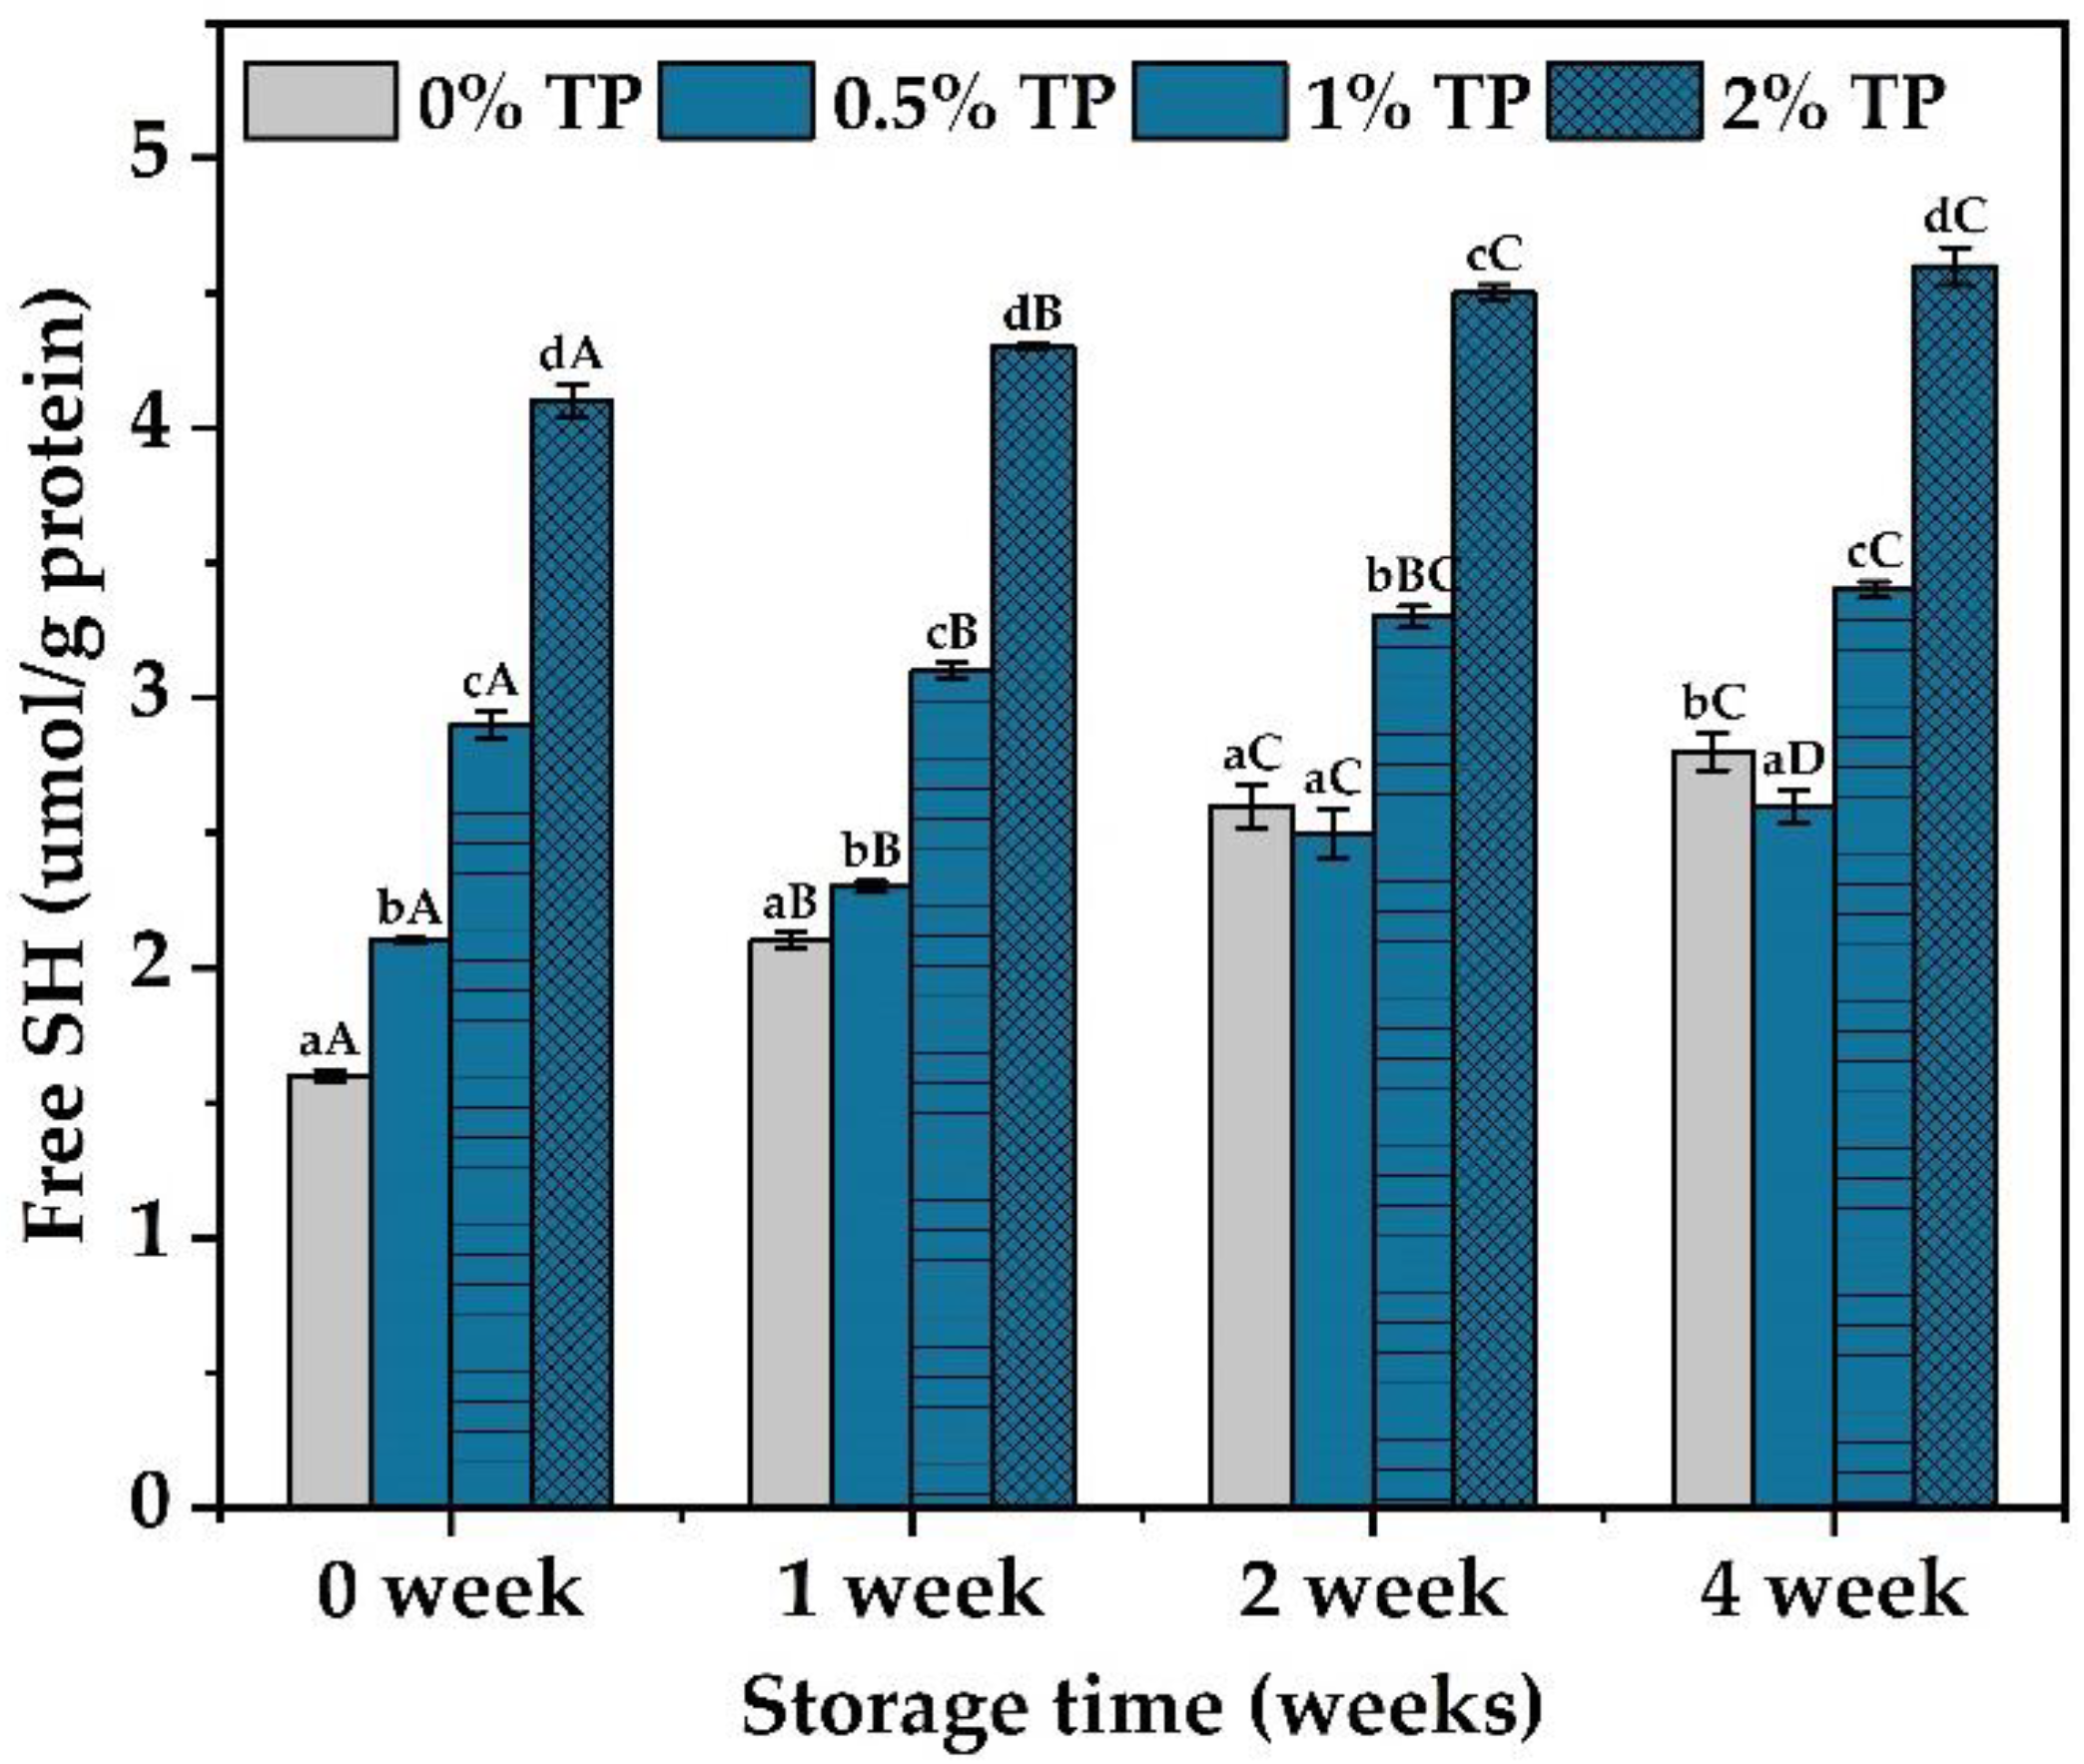
2.5. Determination of Free Sulfhydryl Groups
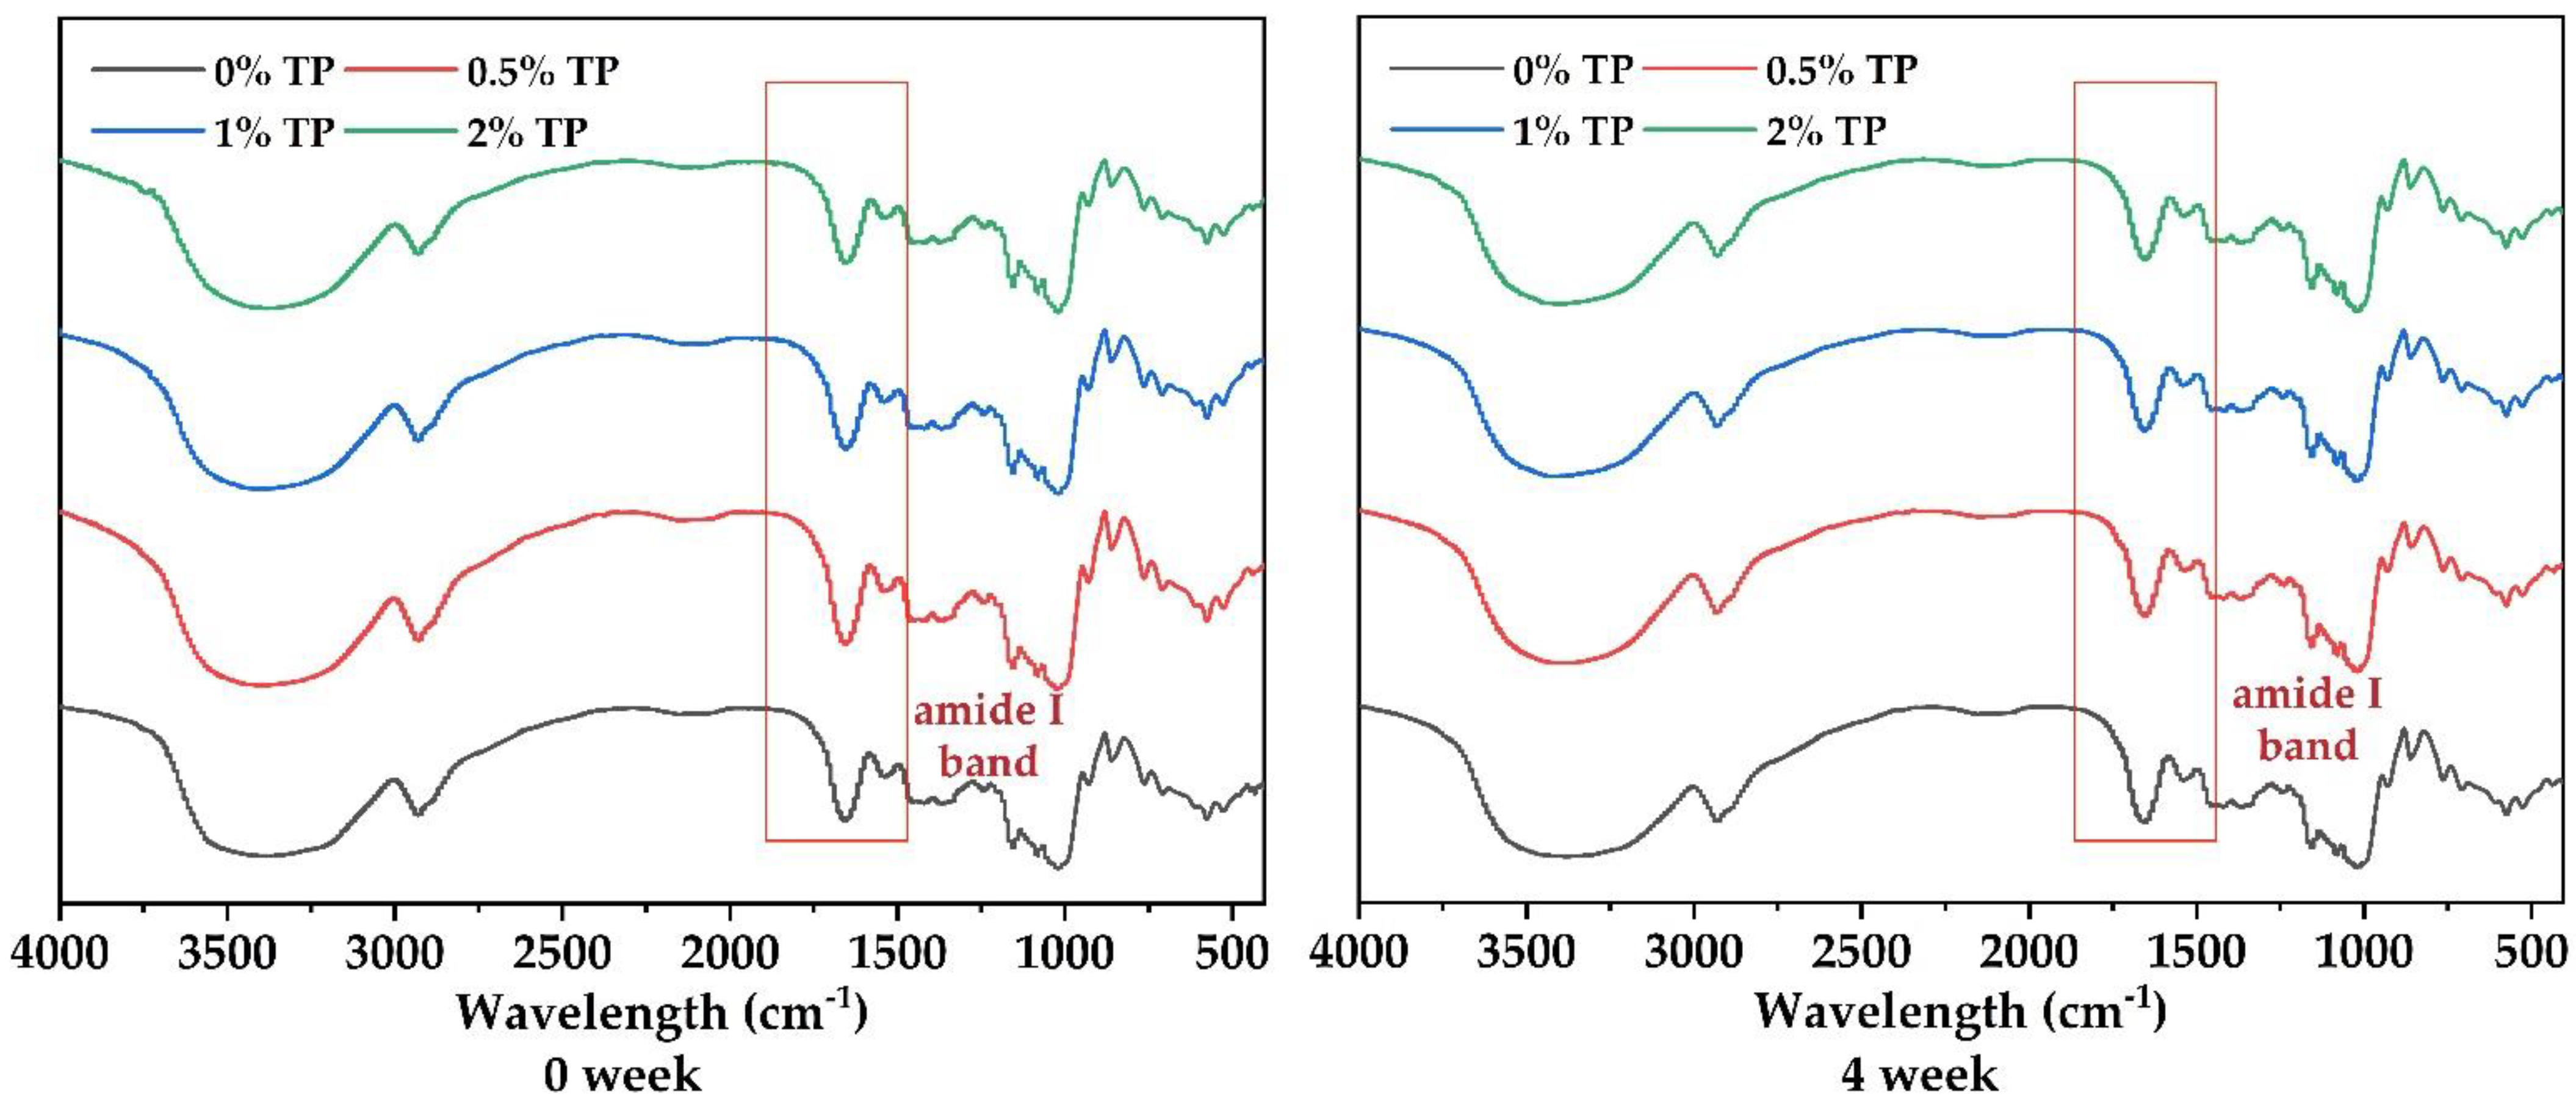
2.6. FT-IR
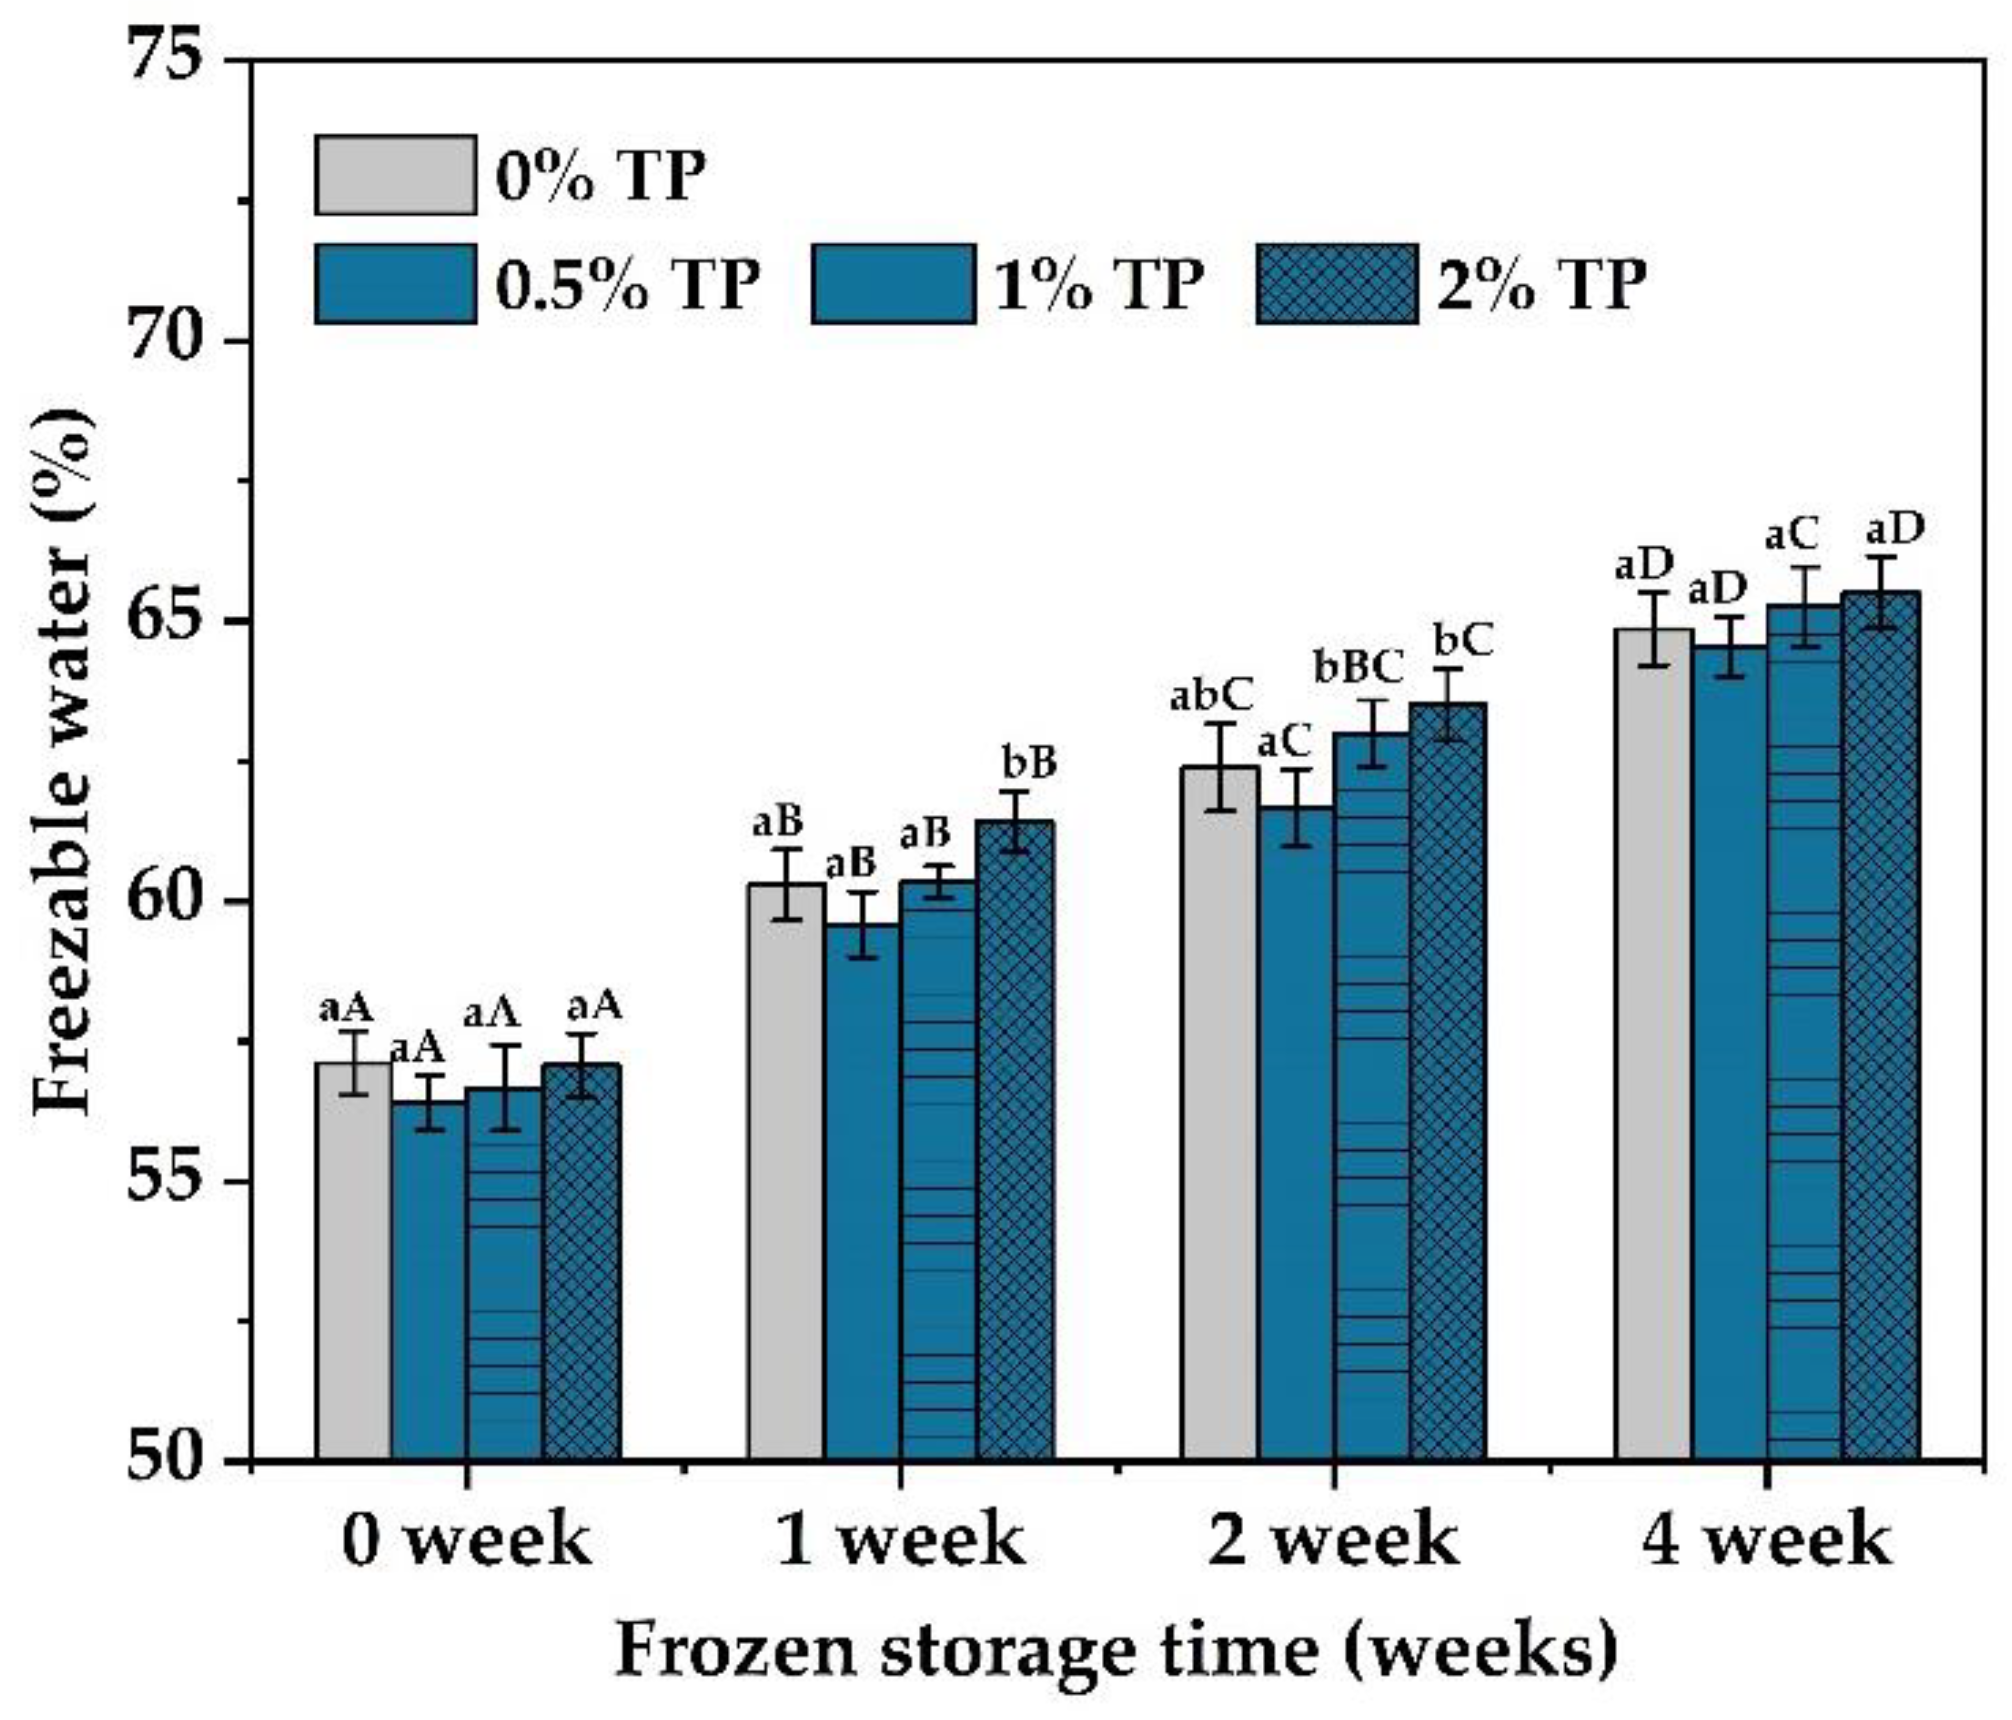
2.7. Freezable Water Content
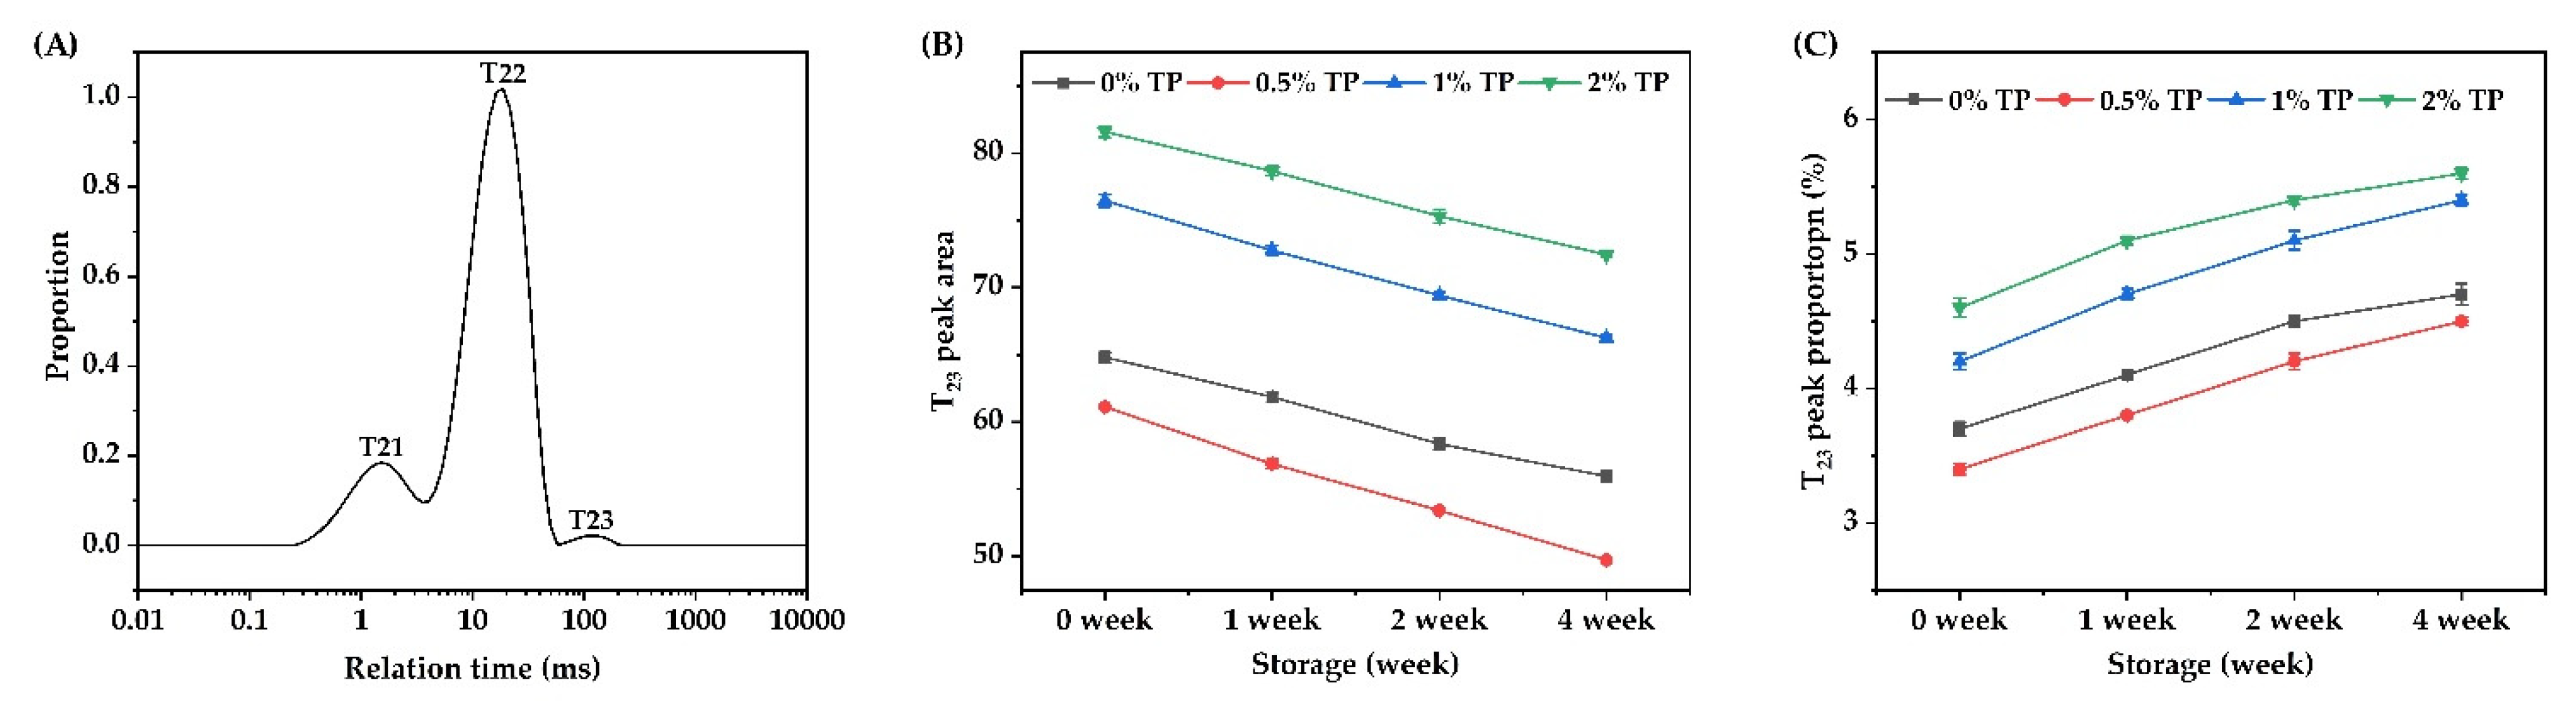
2.8. LF-NMR
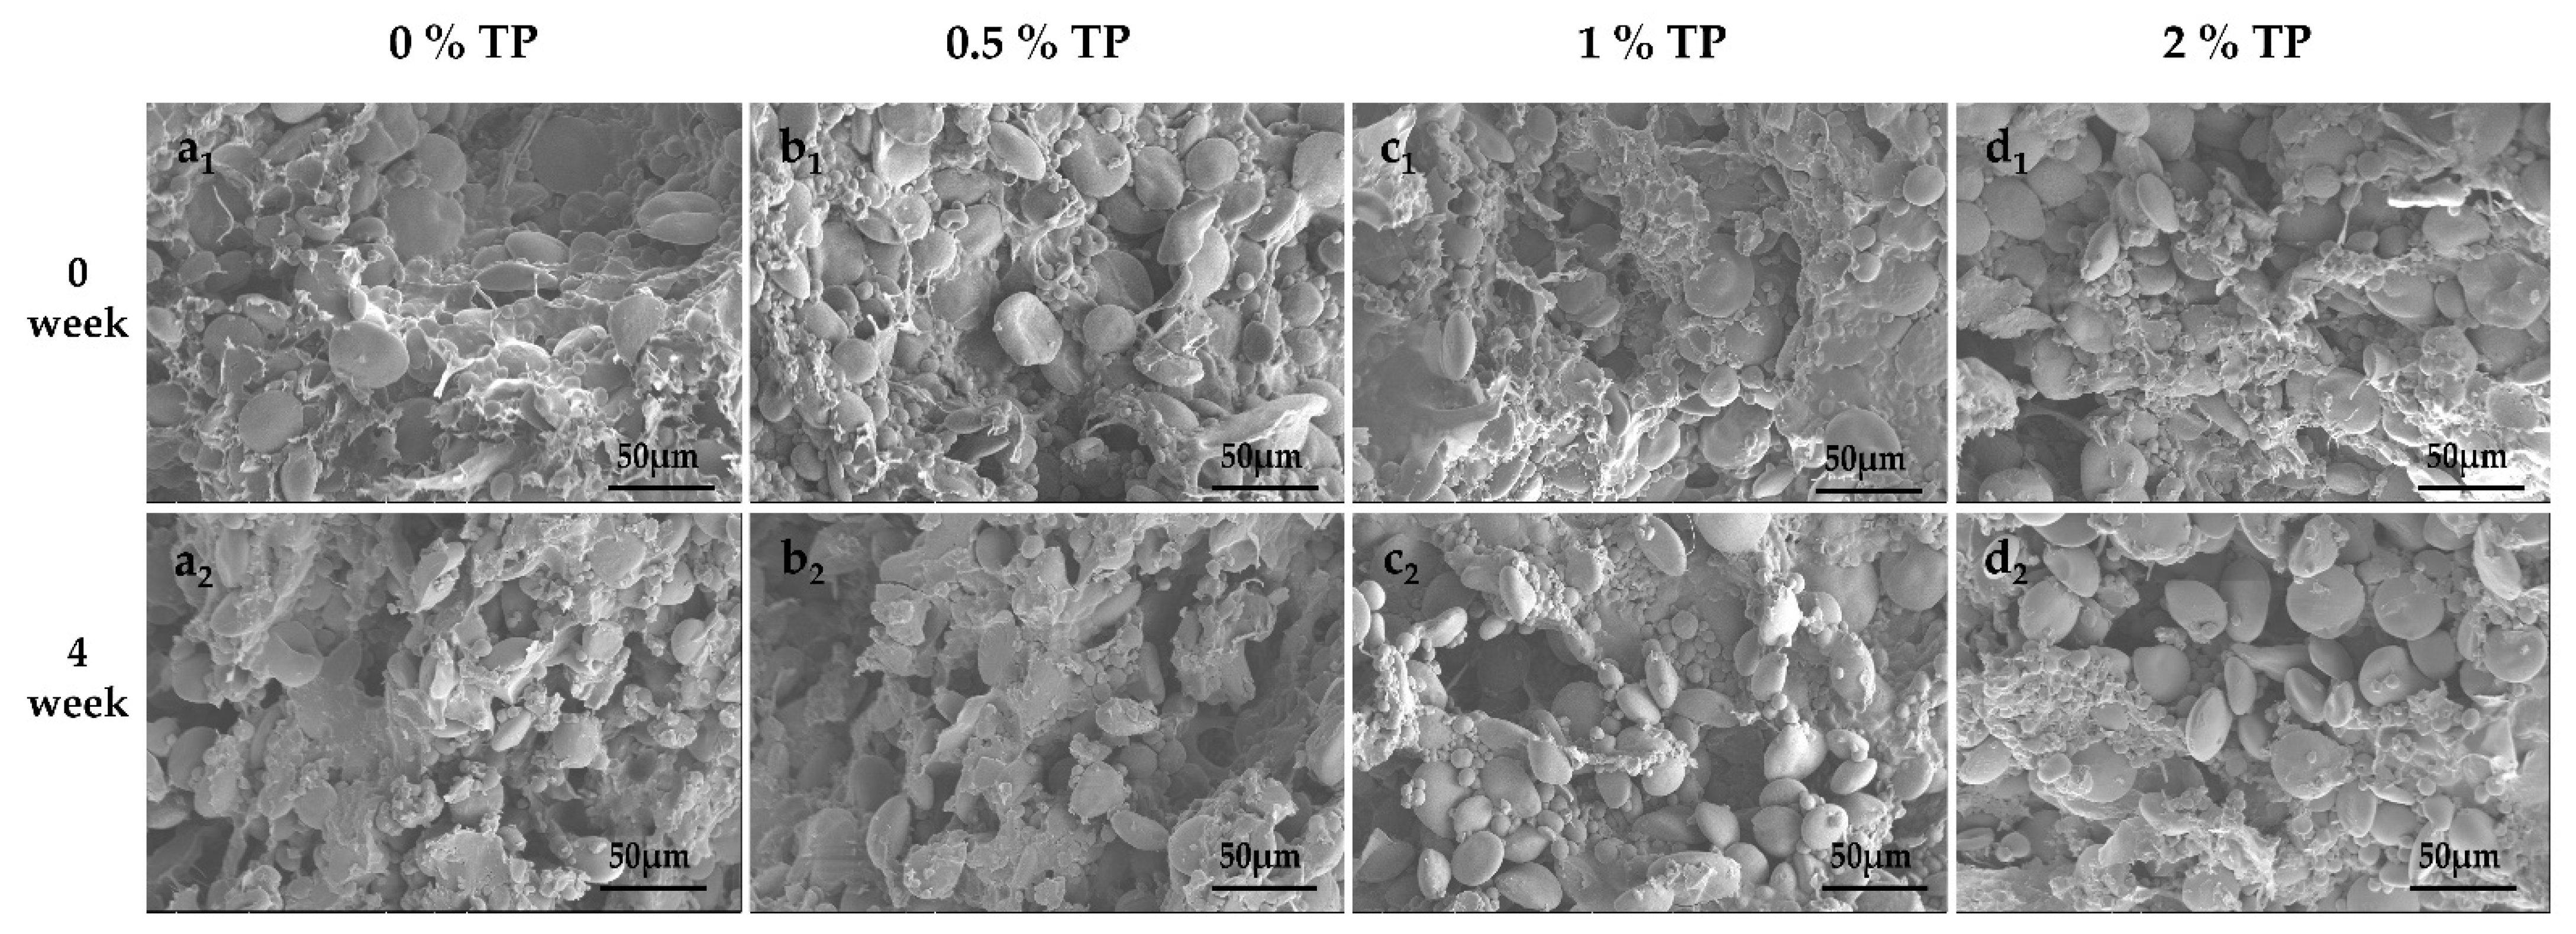
2.9. SEM
2.10. Statistical Analysis
3. Results and Discussion
3.1. Effect of TP on the Rheological Behavior of NFFD
3.2. Effect of TP on Protein Bands in NFFD
3.3. Effects of TPs on Free Sulfhydryl Contents
3.4. Effects of TPs on Protein Secondary Structures
3.5. Effect of TPs on the Content of Freezable Water of NFFD
3.6. Effect of TPs on the Water State of NFFD
3.7. Effect of TPs on the Microstructures of NFFD
4. Conclusions
Author Contributions
Funding
Data Availability Statement
Conflicts of Interest
References
- Tang, A.; Li, M.; Wang, R.; Dhital, S.; Lu, D. Manipulating raw noodle crystallinity to control the hardness of cooked noodle. LWT-Food Sci. Technol. 2019, 109, 305–312. [Google Scholar] [CrossRef]
- Obadi, M.; Zhang, J.; Shi, Y.; Xu, B. Factors affecting frozen cooked noodle quality: A review. Trends Food Sci. Technol. 2021, 109, 662–673. [Google Scholar] [CrossRef]
- Zhou, H.; Jin, Y.; Hong, T.; Yang, N.; Cui, B.; Xu, X.; Jin, Z. Effect of static magnetic field on the quality of frozen bread dough. LWT-Food Sci. Technol. 2022, 154, 112670. [Google Scholar] [CrossRef]
- Yang, C.; Jin, H.; Guan, F.; Chen, Y.; Wang, H. Cancer Preventive Activities of Tea Polyphenols. J. Food Drug Anal. 2020, 20, 318–322. [Google Scholar] [CrossRef]
- Angelino, D.; Cossu, M.; Marti, A.; Zanoletti, M.; Chiavaroli, L.; Brighenti, F.; Del Rio, D.; Martini, D. Bioaccessibility and bioavailability of phenolic compounds in bread: A review. Food Funct. 2017, 8, 2368–2393. [Google Scholar] [CrossRef]
- Giannou, V.; Tzia, C. Addition of Vital Wheat Gluten to Enhance the Quality Characteristics of Frozen Dough Products. Foods 2016, 5, 6. [Google Scholar] [CrossRef]
- Xu, J.; Wang, W.; Li, Y. Dough properties, bread quality, and associated interactions with added phenolic compounds: A review. J. Funct. Foods 2019, 52, 629–639. [Google Scholar] [CrossRef]
- Liu, R.; Shi, C.; Song, Y.; Wu, T.; Zhang, M. Impact of oligomeric procyanidins on wheat gluten microstructure and physicochemical properties. Food Chem. 2018, 260, 37–43. [Google Scholar] [CrossRef]
- Wang, Q.; Li, Y.; Sun, F.; Li, X.; Wang, P.; Sun, J.; Zeng, J.; Wang, C.; Hu, W.; Chang, J.; et al. Tannins improve dough mixing properties through affecting physicochemical and structural properties of wheat gluten proteins. Food Res. Int. 2015, 69, 64–71. [Google Scholar] [CrossRef]
- Pan, J.; Lv, Y.; Jiang, Y.; Zhang, H.; Zhu, Y.; Zhang, S.; Han, J. Effect of catechins on the quality properties of wheat flour and bread. Int. J. Food Sci. Technol. 2022, 57, 290–300. [Google Scholar] [CrossRef]
- Liu, Z.; Chen, J.; Zheng, B.; Lu, Q.; Chen, L. Effects of matcha and its active components on the structure and rheological properties of gluten. LWT-Food Sci. Technol. 2020, 124, 109197. [Google Scholar] [CrossRef]
- Han, C.; Ma, M.; Zhang, H.; Li, M.; Sun, Q. Progressive study of the effect of superfine green tea, soluble tea, and tea polyphenols on the physico-chemical and structural properties of wheat gluten in noodle system. Food Chem. 2020, 308, 125676. [Google Scholar] [CrossRef]
- Luo, W.; Sun, D.; Zhu, Z.; Wang, Q. Improving freeze tolerance of yeast and dough properties for enhancing frozen dough quality—A review of effective methods. Trends Food Sci. Technol. 2018, 72, 25–33. [Google Scholar] [CrossRef]
- Zhang, H.; Zhang, Y.; Wang, X.; Xiang, Q.; Bai, Y.; Li, S.; Yang, L. Effects of Bamboo Shoot Dietary Fiber on Mechanical Properties, Moisture Distribution, and Microstructure of Frozen Dough. J. Chem. 2017, 2017, 4513410. [Google Scholar] [CrossRef]
- Zhang, T.; Guan, E.; Yang, Y.; Zhang, L.; Liu, Y.; Bian, K. Underlying mechanism governing the influence of peanut oil addition on wheat dough viscoelasticity and Chinese steamed bread quality. LWT-Food Sci. Technol. 2022, 156, 113007. [Google Scholar] [CrossRef]
- Liu, M.; Liang, Y.; Wang, Y.; Zhang, H.; Wu, G.; Wang, L.; Qian, H.; Qi, X. Effects of recombinant carrot antifreeze protein from Pichia pastoris GS115 on the physicochemical properties of hydrated gluten during freeze-thawed cycles. J. Cereal Sci. 2018, 83, 245–251. [Google Scholar] [CrossRef]
- Fanari, F.; Carboni, G.; Desogus, F.; Grosso, M.; Wilhelm, M. A Chemometric Approach to Assess the Rheological Properties of Durum Wheat Dough by Indirect FTIR Measurements. Food Bioprocess Technol. 2022, 15, 1040–1054. [Google Scholar] [CrossRef]
- Xin, C.; Nie, L.; Chen, H.; Li, J.; Li, B. Effect of degree of substitution of carboxymethyl cellulose sodium on the state of water, rheological and baking performance of frozen bread dough. Food Hydrocoll. 2018, 80, 8–14. [Google Scholar] [CrossRef]
- Lu, L.; Yang, Z.; Guo, X.; Xing, J.; Zhu, K. Effect of NaHCO3 and freeze-thaw cycles on frozen dough: From water state, gluten polymerization and microstructure. Food Chem. 2021, 358, 129869. [Google Scholar] [CrossRef]
- Kondakci, T.; Zhang, J.; Zhou, W. Impact of Flour Protein Content and Freezing Conditions on the Quality of Frozen Dough and Corresponding Steamed Bread. Food Bioprocess Technol. 2015, 8, 1877–1889. [Google Scholar] [CrossRef]
- He, W.; Chen, N.; Yu, Z.; Sun, Q.; He, Q.; Zeng, W. Effect of tea polyphenols on the quality of Chinese steamed bun and the action mechanism. J. Food Sci. 2022, 87, 1500–1513. [Google Scholar] [CrossRef] [PubMed]
- Fu, Y.; Liu, X.; Xie, Q.; Chen, L.; Chang, C.; Wu, W.; Xiao, S.; Wang, X. Effects of Laminaria japonica polysaccharides on the texture, retrogradation, and structure performances in frozen dough bread. LWT-Food Sci. Technol. 2021, 151, 112239. [Google Scholar] [CrossRef]
- Tian, C.; Zhen, T.; Ma, M.; Li, M.; Sun, Q. Contribution of catechin monomers in tea polyphenols to the structure and physicochemical properties of wheat gluten and its sub-fractions. J. Cereal Sci. 2021, 101, 103306. [Google Scholar] [CrossRef]
- Ke, Y.; Wang, Y.; Ding, W.; Leng, Y.; Lv, Q.; Yang, H.; Wang, X.; Ding, B. Effects of inulin on protein in frozen dough during frozen storage. Food Funct. 2020, 11, 7775–7783. [Google Scholar] [CrossRef] [PubMed]
- Yang, Y.; Guan, E.; Zhang, T.; Xu, F.; Li, M.; Bian, K. Behavior of wheat flour dough at different pretreated temperatures through rheological characteristics and molecular interactions of proteins. Food Chem. 2023, 404, 134188. [Google Scholar] [CrossRef] [PubMed]
- Qian, X.; Gu, Y.; Sun, B.; Wang, X. Changes of aggregation and structural properties of heat-denatured gluten proteins in fast-frozen steamed bread during frozen storage. Food Chem. 2021, 365, 130492. [Google Scholar] [CrossRef]
- Ban, C.; Yoon, S.; Han, J.; Kim, S.; Han, J.; Lim, S.; Choi, Y. Effects of freezing rate and terminal freezing temperature on frozen croissant dough quality. LWT-Food Sci. Technol. 2016, 73, 219–225. [Google Scholar] [CrossRef]
- Krekora, M.; Nawrocka, A. The influence of selected polyphenols on the gluten structure—A study on gluten dough with application of FT-IR and FT-Raman spectroscopy. J. Cereal Sci. 2022, 108, 103570. [Google Scholar] [CrossRef]
- Liu, J.; Luo, D.; Li, X.; Xu, B.; Zhang, X.; Liu, J. Effects of inulin on the structure and emulsifying properties of protein components in dough. Food Chem. 2016, 210, 235–241. [Google Scholar] [CrossRef]
- Zhu, F. Frozen steamed breads and boiled noodles: Quality affected by ingredients and processing. Food Chem. 2021, 349, 129178. [Google Scholar] [CrossRef]
- Zhu, X.; Chen, J.; Hu, Y.; Zhang, N.; Fu, Y.; Chen, X. Tuning complexation of carboxymethyl cellulose/ cationic chitosan to stabilize Pickering emulsion for curcumin encapsulation. Food Hydrocoll. 2021, 110, 106135. [Google Scholar] [CrossRef]
- Zhu, X.; Yuan, P.; Zhang, T.; Wang, Z.; Cai, D.; Chen, X.; Shen, Y.; Xu, J.; Song, C.; Goff, D. Effect of carboxymethyl chitosan on the storage stability of frozen dough: State of water, protein structures and quality attributes. Food Res. Int. 2022, 151, 110863. [Google Scholar] [CrossRef] [PubMed]
- He, Y.; Guo, J.; Ren, G.; Cui, G.; Han, S.; Liu, J. Effects of konjac glucomannan on the water distribution of frozen dough and corresponding steamed bread quality. Food Chem. 2020, 330, 127243. [Google Scholar] [CrossRef] [PubMed]
- Zhou, J.; Jia, Z.; Wang, M.; Wang, Q.; Barba, F.; Wan, L.; Wang, X.; Fu, Y. Effects of Laminaria japonica polysaccharides on gelatinization properties and long-term retrogradation of wheat starch. Food Hydrocoll. 2022, 133, 107908. [Google Scholar] [CrossRef]
- Jiang, Y.; Zhao, Y.; Zhu, Y.; Qin, S.; Deng, Y.; Zhao, Y. Effect of dietary fiber-rich fractions on texture, thermal, water distribution, and gluten properties of frozen dough during storage. Food Chem. 2019, 297, 124902. [Google Scholar] [CrossRef]
- Wang, P.; Xu, L.; Nikoo, M.; Ocen, D.; Wu, F.; Yang, N.; Jin, Z.; Xu, X. Effect of frozen storage on the conformational, thermal and microscopic properties of gluten: Comparative studies on gluten-, glutenin- and gliadin-rich fractions. Food Hydrocoll. 2014, 35, 238–246. [Google Scholar] [CrossRef]
- Li, S.; Qu, Z.; Feng, J.; Chen, Y. Improved physicochemical and structural properties of wheat gluten with konjac glucomannan. J. Cereal Sci. 2020, 95, 103050. [Google Scholar] [CrossRef]
- Feng, Y.; Feng, X.; Liu, S.; Zhang, H.; Wang, J. Effects of dietary fiber and ferulic acid on dough characteristics and glutenin macropolymer (GMP) aggregation behavior during dough resting. LWT-Food Sci. Technol. 2022, 166, 113782. [Google Scholar] [CrossRef]
- Chen, G.; Wang, S.; Feng, B.; Jiang, B.; Miao, M. Interaction between soybean protein and tea polyphenols under high pressure. Food Chem. 2019, 277, 632–638. [Google Scholar] [CrossRef]


| Time/Weeks | Addition (TP)/% | Secondary Protein Structure | |||
|---|---|---|---|---|---|
| β-Sheet/% | Irregular Curl/% | α-Helix/% | β-Turn/% | ||
| 0 | 0 | 30.02 ± 0.13 c | 16.61 ± 0.06 b | 37.44 ± 0.08 c | 15.93 ± 0.12 b |
| 0.5 | 30.19 ± 0.04 c | 16.23 ± 0.13 a | 38.72 ± 0.06 d | 14.86 ± 0.07 a | |
| 1 | 28.78 ± 0.08 b | 16.50 ± 0.09 b | 36.71 ± 0.07 b | 18.01 ± 0.14 c | |
| 2 | 27.82 ± 0.11 a | 18.39 ± 0.14 c | 35.72 ± 0.11 a | 18.07 ± 0.21 c | |
| 4 | 0 | 29.65 ± 0.14 c | 16.93 ± 0.11 b | 37.02 ± 0.15 c | 16.40 ± 0.25 b |
| 0.5 | 29.81 ± 0.08 c | 16.56 ± 0.09 a | 38.55 ± 0.16 d | 15.08 ± 0.11 a | |
| 1 | 27.61 ± 0.13 b | 17.12 ± 0.17 b | 36.08 ± 0.08 b | 19.19 ± 0.23 c | |
| 2 | 26.59 ± 0.21 a | 18.88 ± 0.22 c | 35.32 ± 0.21 a | 19.21 ± 0.26 c | |
Disclaimer/Publisher’s Note: The statements, opinions and data contained in all publications are solely those of the individual author(s) and contributor(s) and not of MDPI and/or the editor(s). MDPI and/or the editor(s) disclaim responsibility for any injury to people or property resulting from any ideas, methods, instructions or products referred to in the content. |
© 2022 by the authors. Licensee MDPI, Basel, Switzerland. This article is an open access article distributed under the terms and conditions of the Creative Commons Attribution (CC BY) license (https://creativecommons.org/licenses/by/4.0/).
Share and Cite
Zheng, K.; Chen, Z.; Fu, Y.; Chen, L.; Zhu, X.; Chen, X.; Ding, W. Effect of Tea Polyphenols on the Storage Stability of Non-Fermented Frozen Dough: Protein Structures and State of Water. Foods 2023, 12, 80. https://doi.org/10.3390/foods12010080
Zheng K, Chen Z, Fu Y, Chen L, Zhu X, Chen X, Ding W. Effect of Tea Polyphenols on the Storage Stability of Non-Fermented Frozen Dough: Protein Structures and State of Water. Foods. 2023; 12(1):80. https://doi.org/10.3390/foods12010080
Chicago/Turabian StyleZheng, Kai, Zhehan Chen, Yang Fu, Lei Chen, Xiangwei Zhu, Xi Chen, and Wenping Ding. 2023. "Effect of Tea Polyphenols on the Storage Stability of Non-Fermented Frozen Dough: Protein Structures and State of Water" Foods 12, no. 1: 80. https://doi.org/10.3390/foods12010080
APA StyleZheng, K., Chen, Z., Fu, Y., Chen, L., Zhu, X., Chen, X., & Ding, W. (2023). Effect of Tea Polyphenols on the Storage Stability of Non-Fermented Frozen Dough: Protein Structures and State of Water. Foods, 12(1), 80. https://doi.org/10.3390/foods12010080