
Variation in the Content and Composition of Tocols in a Wheat Population

Abstract
:1. Introduction
2. Materials and Methods
2.1. Development of Mv Toborzó/Tommi Wheat Recombinant Inbred Population
2.2. Field Conditions
2.3. Analysis of the Compositional Traits
2.4. Analysis of Tocopherols and Tocotrienols
2.5. Analysis of Dough Properties
2.6. Statistical Analysis
3. Results
4. Discussion
5. Conclusions
Supplementary Materials
Author Contributions
Funding
Institutional Review Board Statement
Informed Consent Statement
Data Availability Statement
Conflicts of Interest
References
- Bramley, P.M.; Elmadfa, I.; Kafatos, A.; Kelly, F.J.; Manios, Y.; Roxborough, H.E.; Schuch, W.; Sheehy, S.; Wagner, K. Vitamin E. J. Sci. Food Agric. 2000, 80, 913–938. [Google Scholar] [CrossRef]
- EFSA Panel on Dietetic Products, Nutrition and Allergy (ND). Scientific Opinion on Dietary Reference Values for vitamin E as α-tocopherol. EFSA J. 2015, 13, 4149–4221. [Google Scholar]
- Panfili, G.; Fratianni, A.; Irano, M. Normal phase high-performance liquid chromatography method for the determination of tocopherols and tocotrienols in cereals. J. Agric. Food Chem. 2003, 51, 3940–3944. [Google Scholar] [CrossRef] [PubMed]
- Hidalgo, A.; Brandolini, A. Kinetics of carotenoids degradation during the storage of einkorn (Triticum monococcum L. ssp. monococcum) and bread wheat (Triticum aestivum L. ssp. aestivum) flours. J. Agric. Food Chem. 2008, 56, 11300–11305. [Google Scholar] [CrossRef]
- Souci, S.; Fachmann, W.; Kraut, H. Die Zusammensetzung der Lebensmittel–Nährstofftabellen (Food Composition and Nutrition Tables), 6th ed.; Medpharm Scientific Publisher: Stuttgart, Germany, 2000. [Google Scholar]
- Zhou, K.; Laux, J.J.; Yu, L. Comparison of Swiss wheat grain and fractions for their antioxidant properties. J. Agric. Food Chem. 2004, 52, 1118–1123. [Google Scholar] [CrossRef]
- Shewry, P.R.; Piironen, V.; Lampi, A.-M.; Edelmann, M.; Kariluoto, S.; Nurmi, T.; Fernandez-Orozco, R.; Ravel, C.; Charmet, G.; Andersson, A.; et al. The HEALTHGRAIN wheat diversity screen: Effects of genotype and environment on phytochemicals and dietary fiber components. J. Agric. Food Chem. 2010, 58, 9291–9298. [Google Scholar] [CrossRef]
- Shewry, P.R.; Piironen, V.; Lampi, A.-M.; Edelmann, M.; Kariluoto, S.; Nurmi, T.; Andersson, A.; Åman, P.; Rakszegi, M.; Bedo, Z.; et al. Effects of genotype and environment on the content and composition of phytochemicals and dietary fiber components in rye in the HEALTHGRAIN diversity screen. J. Agric. Food Chem. 2010, 58, 9372–9383. [Google Scholar] [CrossRef]
- Shewry, P.R.; Hawkesford, M.J.; Piironen, V.; Lampi, A.-M.; Gebruers, K.; Boros, D.; Andersson, A.; Åman, P.; Rakszegi, M.; Bedo, Z.; et al. Natural variation in grain composition of wheat and related cereals. J. Agric. Food Chem. 2013, 61, 8295–8303. [Google Scholar] [CrossRef]
- Lampi, A.-M.; Nurmi, T.; Piironen, V. Effects of the environment and genotype on tocopherols and tocotrienols in wheat in the HEALTHGRAIN diversity screen. J. Agric. Food Chem. 2010, 58, 9306–9313. [Google Scholar] [CrossRef]
- Burton, L.P.J. Phenolic Phosphite Antioxidant and Process for Preparation Thereof. U.S. Patent 4,526,918, 2 July 1985. [Google Scholar]
- Wagner, K.-H.; Wotruba, F.; Elmadfa, I. Antioxidative potential of tocotrienols and tocopherols in coconut fat at different oxidation temperatures. Eur. J. Lipid Sci. Technol. 2001, 103, 746–751. [Google Scholar] [CrossRef]
- Yoshida, Y.; Niki, E.; Noguchi, N. Comparative study on the action of tocopherols and tocotrienols as antioxidant: Chemical and physical effects. Chem. Phys. Lipids 2003, 123, 63–75. [Google Scholar] [CrossRef]
- Tiwari, U.; Cummins, E. Nutritional importance and effect of processing on tocols in cereals. Trends Food Sci. Technol. 2009, 20, 511–520. [Google Scholar] [CrossRef]
- Institute of Medicine. Dietary Reference Intakes for Vitamin C, Vitamin E, Selenium, and Carotenoids; National Academy Press: Washington, DC, USA, 2000; p. 506. [Google Scholar]
- Morris, M.C.; Evans, D.A.; Tangney, C.C.; Bienias, J.L.; Wilson, R.S.; Aggarwal, N.T.; Scherr, P.A. Relation of the tocopherol forms to incident Alzheimer disease and to cognitive change. Am. J. Clin. Nutr. 2005, 81, 508–514. [Google Scholar] [CrossRef] [PubMed]
- Berbée, M.; Fu, Q.; Boerma, M.; Wang, J.; Sree, K.K.; Hauer-Jensen, M. γ-Tocotrienol ameliorates intestinal radiation injury and reduces vascular oxidative stress after total-body irradiation by an HMG-CoA reductase-dependent mechanism. Radiat. Res. 2009, 171, 596–605. [Google Scholar] [CrossRef]
- Ghosh, S.P.; Kulkarni, S.; Hieber, K.; Toles, R.; Romanyukha, L.; Tzu-Cheg, K.; Hauer-Jensen, M.; Kumar, K. Gamma-tocotrienol, a tocol antioxidant as a potent radioprotector. Int. J. Radiat. Biol. 2009, 85, 598–606. [Google Scholar] [CrossRef]
- Singh, V.K.; Beattie, L.A.; Seed, T.M. Vitamin E: Tocopherols and tocotrienols as potential radiation countermeasures. J. Radiat. Res. 2013, 54, 973–988. [Google Scholar] [CrossRef] [Green Version]
- Hidalgo, A.; Brandolini, A. Tocols stability during bread, water biscuit and pasta processing from wheat flours. J. Cereal Sci. 2010, 52, 254–259. [Google Scholar] [CrossRef]
- Fratianni, A.; Panfili, G.; Cubadda, R. Carotenoids, tocols, and retinols during the pasta-making process. In Processing and Impact on Active Components in Food; Preedy, V.R., Ed.; Academic Press: Cambridge, MA, USA; Elsevier: London, UK, 2015; pp. 309–317. [Google Scholar]
- Piironen, V.; Varo, P.; Koivistoinen, P. Stability of tocopheros and tocotrienols in food preparation procedures. J. Food Comp. Anal. 1987, 1, 53–58. [Google Scholar] [CrossRef]
- Wennermark, B.; Jägerstad, M. Breadmaking and Storage of Various Wheat Fractions Affect Vitamin E. J. Food Sci. 1992, 57, 1205–1209. [Google Scholar] [CrossRef]
- Kiss, T.; Balla, K.; Veisz, O.; Lang, L.; Bedo, Z.; Griffiths, S.; Isaac, P.; Karsai, I. Allele frequencies in the VRN-A1, VRN-B1 and VRN-D1 vernalization response and PPD-B1 and PPD-D1 photoperiod sensitivity genes, and their effects on heading in a diverse set of wheat cultivars (Triticum aestivum L.). Mol. Breed. 2014, 34, 297–310. [Google Scholar] [CrossRef] [Green Version]
- Ward, J.L.; Poutanen, K.; Gebruers, K.; Piironen, V.; Lampi, A.-M.; Nyström, L.; Andersson, A.; Aman, P.; Boros, D.; Rakszegi, M.; et al. The HEALTHGRAIN Cereal Diversity Screen: Concept, Results, and Prospects. J. Agric. Food Chem. 2008, 56, 9699–9709. [Google Scholar] [CrossRef] [PubMed]
- Takac, V.; Tóth, V.; Rakszegi, M.; Mikic, S.; Mirosavljevic, M.; Kondic-Špika, A. Differences in processing quality traits, protein content and composition between spelt and bread wheat genotypes grown under conventional and organic production. Foods 2021, 10, 156. [Google Scholar] [CrossRef] [PubMed]
- MSZ 6367/4-86. Edible, Fodder and Industrial Seeds and Husked Products. Determination of Test Weight, Thousand Kernel Weight and Classification Grade; Hungarian Standards Institution: Budapest, Hungary, 1986. [Google Scholar]
- International Association for Cereal Science and Technology ICC 105/2. Determination of Crude Protein in Cereals and Cereal Products for Food and for Feed; International Association for Cereal Science and Technology: Vienna, Austria, 1995. [Google Scholar]
- International Association for Cereal Science and Technology ICC 137/1. Mechanical Determination of the Wet Gluten Content of Wheat Flour (Glutomatic); International Association for Cereal Science and Technology: Vienna, Austria, 1995. [Google Scholar]
- International Association for Cereal Science and Technology, ICC 202. Procedure for Near Infrared (NIR) Reflectance Analysis of Ground Wheat and Milled Wheat Products; International Association for Cereal Science and Technology: Vienna, Austria, 1995. [Google Scholar]
- Douglas, S.G. A rapid method for the determination of pentosans in wheat flour. Food Chem. 1981, 7, 139–145. [Google Scholar] [CrossRef]
- AACC International. Approved Methods 32–23.01. Beta-Glucan Content of Barley and Oats–Rapid Enzymatic Procedure; AACC International: St. Paul, MN, USA, 1995. [Google Scholar]
- Ryynänen, M.; Lampi, A.; Salo-Väänänen, P.; Ollilainen, V.; Piironen, V. A small-scale sample preparation method with HPLC analysis for determination of tocopherols and tocotrienols in cereals. J. Food Comp. Anal. 2004, 17, 749–765. [Google Scholar] [CrossRef]
- AOCS. Official Methods and Recommended Practices of the American Oil Chemists’ Society, 5th ed.; American Oil Chemists’ Society: Champaign, IL, USA, 1997; p. 5, [Official Method Ce 8-89 (Reapproved 1997) Determination of Tocopherols and Tocotrienols in Vegetable Oils and Fats by HPLC)]. [Google Scholar]
- International Association for Cereal Science and Technology ICC 115/1. Method for Using Brabender Farinograph; International Association for Cereal Science and Technology: Vienna, Austria, 1995. [Google Scholar]
- International Association for Cereal Science and Technology ICC 155. Determination of Wet Gluten Quantity and Quality (Gluten Index ac. to Perten) of whole Wheat Meal and Wheat Flour (Triticum aestivum); International Association for Cereal Science and Technology: Vienna, Austria, 1995. [Google Scholar]
- International Association for Cereal Science and Technology ICC 116/1. Determination of the Sedimentation Value (According to Zeleny) as an Approximate Measure of Baking Quality; International Association for Cereal Science and Technology: Vienna, Austria, 1997. [Google Scholar]
- Tömösközi, S.; Nádosi, M.; Balázs, G.; Cavanagh, C.; Morgunov, A.; Salgó, A.; Bekes, F. Revival of sedimentation value—Method development, quality prediction and molecular background. In Proceedings of the 10th International Gluten Workshop, INRA, Clermont-Ferrand, France, 7–9 September 2009; pp. 104–108. [Google Scholar]
- AACC International. Approved Methods 56-81B. Determination of Falling Number; AACC International: St. Paul, MN, USA, 1995. [Google Scholar]
- Virk, D.S.; Pandit, D.B.; Sufian, M.A.; Ahmed, F.; Siddique, M.A.B.; Samad, M.A.; Rahman, M.; Islam, M.; Ortiz-Ferrara, G.; Joshi, K.; et al. REML is an effective analysis for mixed modelling of unbalanced on-farm varietal trials. Exp. Agric. 2009, 45, 77–91. [Google Scholar] [CrossRef] [Green Version]
- Barnes, P.J. Cereal tocopherols. Dev. Food Sci. 1983, 5B, 1095–1100. [Google Scholar]
- Zielinski, H.; Kozlowska, H.; Lewczuk, B. Bioactive compounds in the cereal grains before and after hydrothermal processing. Food Sci. Emerg. Technol. 2001, 2, 159–169. [Google Scholar] [CrossRef]
- Ruibal-Mendieta, N.L.; Delacroix, D.L.; Mignolet, E.; Pycke, J.; Marques, C.; Rozenberg, R.; Petitjean, G.; Habib-Jiwan, J.; Meurens, M.; Quetin-Leclercq, J.; et al. Spelt (Triticum aestivum ssp. spelta) as a source of breadmaking fluors and bran naturally enriched in oleic acid and minerals but not phytic acid. J. Agric. Food Chem. 2005, 53, 2751–2759. [Google Scholar] [CrossRef]
- Lampi, A.-M.; Nurmi, T.; Ollilainen, V.; Piironen, V. Tocopherols and tocotrienols in wheat genotypes in the HEALTHGRAIN diversity screen. J. Agric. Food Chem. 2008, 56, 9716–9722. [Google Scholar] [CrossRef]
- Moore, J.; Hao, Z.; Zhou, K.; Luther, M.; Costa, J.; Yu, L. Carotenoid, tocopherol, phenolic acid, and antioxidant properties of Maryland-grown soft wheat. J. Agric. Food Chem. 2005, 53, 6649–6657. [Google Scholar] [CrossRef]
- Hidalgo, A.; Brandolini, A.; Pompei, C.; Piscozzi, R. Carotenoids and tocols of einkorn wheat (Triticum monococcum ssp. monococcum L.). Cereal Sci. 2006, 44, 182–193. [Google Scholar] [CrossRef]
- Piironen, V.; Lampi, A.-M.; Ekholm, P.; Salmenkallio-Marttila, M.; Liukkonen, K.-H. Micronutrients and Phytochemicals in Wheat Grain. In WHEAT: Chemistry and Technology, 4th ed.; Shewry, P.R., Khan, K., Eds.; AACC Int.: St. Paul, MN, USA, 2009; pp. 179–222. [Google Scholar]
- Morrison, W.R.; Coventry, A.M.; Barnes, P.J. The distribution of acyl lipids and tocopherols in flour millstreams. J. Sci. Food Agric. 1982, 33, 925–933. [Google Scholar] [CrossRef]
- Piironen, V.; Syvaoja, E.; Varo, P.; Salminen, K.; Koivistoinen, P. Tocopherols and tocotrienols in cereal products from Finland. Cereal Chem. 1986, 63, 78–81. [Google Scholar]
- Guzmán, C.; Medina-Larqué, A.S.; Velu, G.; Gonzales-Santoyo, H.; Singh, R.P.; Huerta-Espino, J.; Ortiz, I.; Pena, R. Use of wheat genetic resources to develop biofortified wheat with enhanced grain zinc and iron concentrations and desirable processing quality. J. Cereal Sci. 2014, 60, 617–622. [Google Scholar] [CrossRef]
- Govindan, V.; Ortiz-Monasterio, I.; Cakmak, I.; Hao, Y.; Singh, R.P. Biofortification strategies to increase grain zinc and iron concentrations in wheat. J. Cereal Sci. 2014, 59, 365–372. [Google Scholar]
- Bouis, H.E.; Hotz, C.; McClafferty, B.; Meenakshi, J.V.; Pfeiffer, W.H. Biofortification: A new tool to reduce micronutrient malnutrition. Food Nutr. Bull. 2011, 32, 315–405. [Google Scholar] [CrossRef]
- Méne-Saffrané, L.; Pellaud, S. Current strategies for vitamin E biofortification of crops. Curr. Opin. Biotechnol. 2017, 44, 189–197. [Google Scholar] [CrossRef] [Green Version]
- Zhang, L.; Luo, Y.Z.; Zhu, Y.X.; Zhang, I.; Zhang, W.; Chen, R.M.; Xu, M.; Fan, Y.; Wang, L. GmTMT2a from soybean elevates the alpha-tocopherol content in corn and Arabidopsis. Transgenic Res. 2013, 22, 1021–1028. [Google Scholar] [CrossRef]
- Zhang, G.Y.; Liu, R.R.; Xu, G.; Zhang, P.; Li, Y.; Tang, K.X.; Liang, G.; Liu, Q. Increased alpha-tocotrienol contents in seeds of transgenic rice overexpressing Arabidopsis gamma-tocopherol methyltransferase. Transgenic Res. 2013, 22, 89–99. [Google Scholar] [CrossRef]
- Shewry, P.R.; Van Schaik, F.; Ravel, C.; Charmet, G.; Rakszegi, M.; Bedo, Z.; Ward, J. Genotype and environment effects on the contents of vitamins B1, B2, B3 and B6 in wheat grain. J. Agric. Food Chem. 2011, 59, 10564–10571. [Google Scholar] [CrossRef]


| Descriptives | Year | N | Mean | Std. Dev. | Std. Error | 95% Confidence Interval for Mean | Min. | Max. | |
|---|---|---|---|---|---|---|---|---|---|
| μg/g | Lower Bound | Upper Bound | μg/g | μg/g | |||||
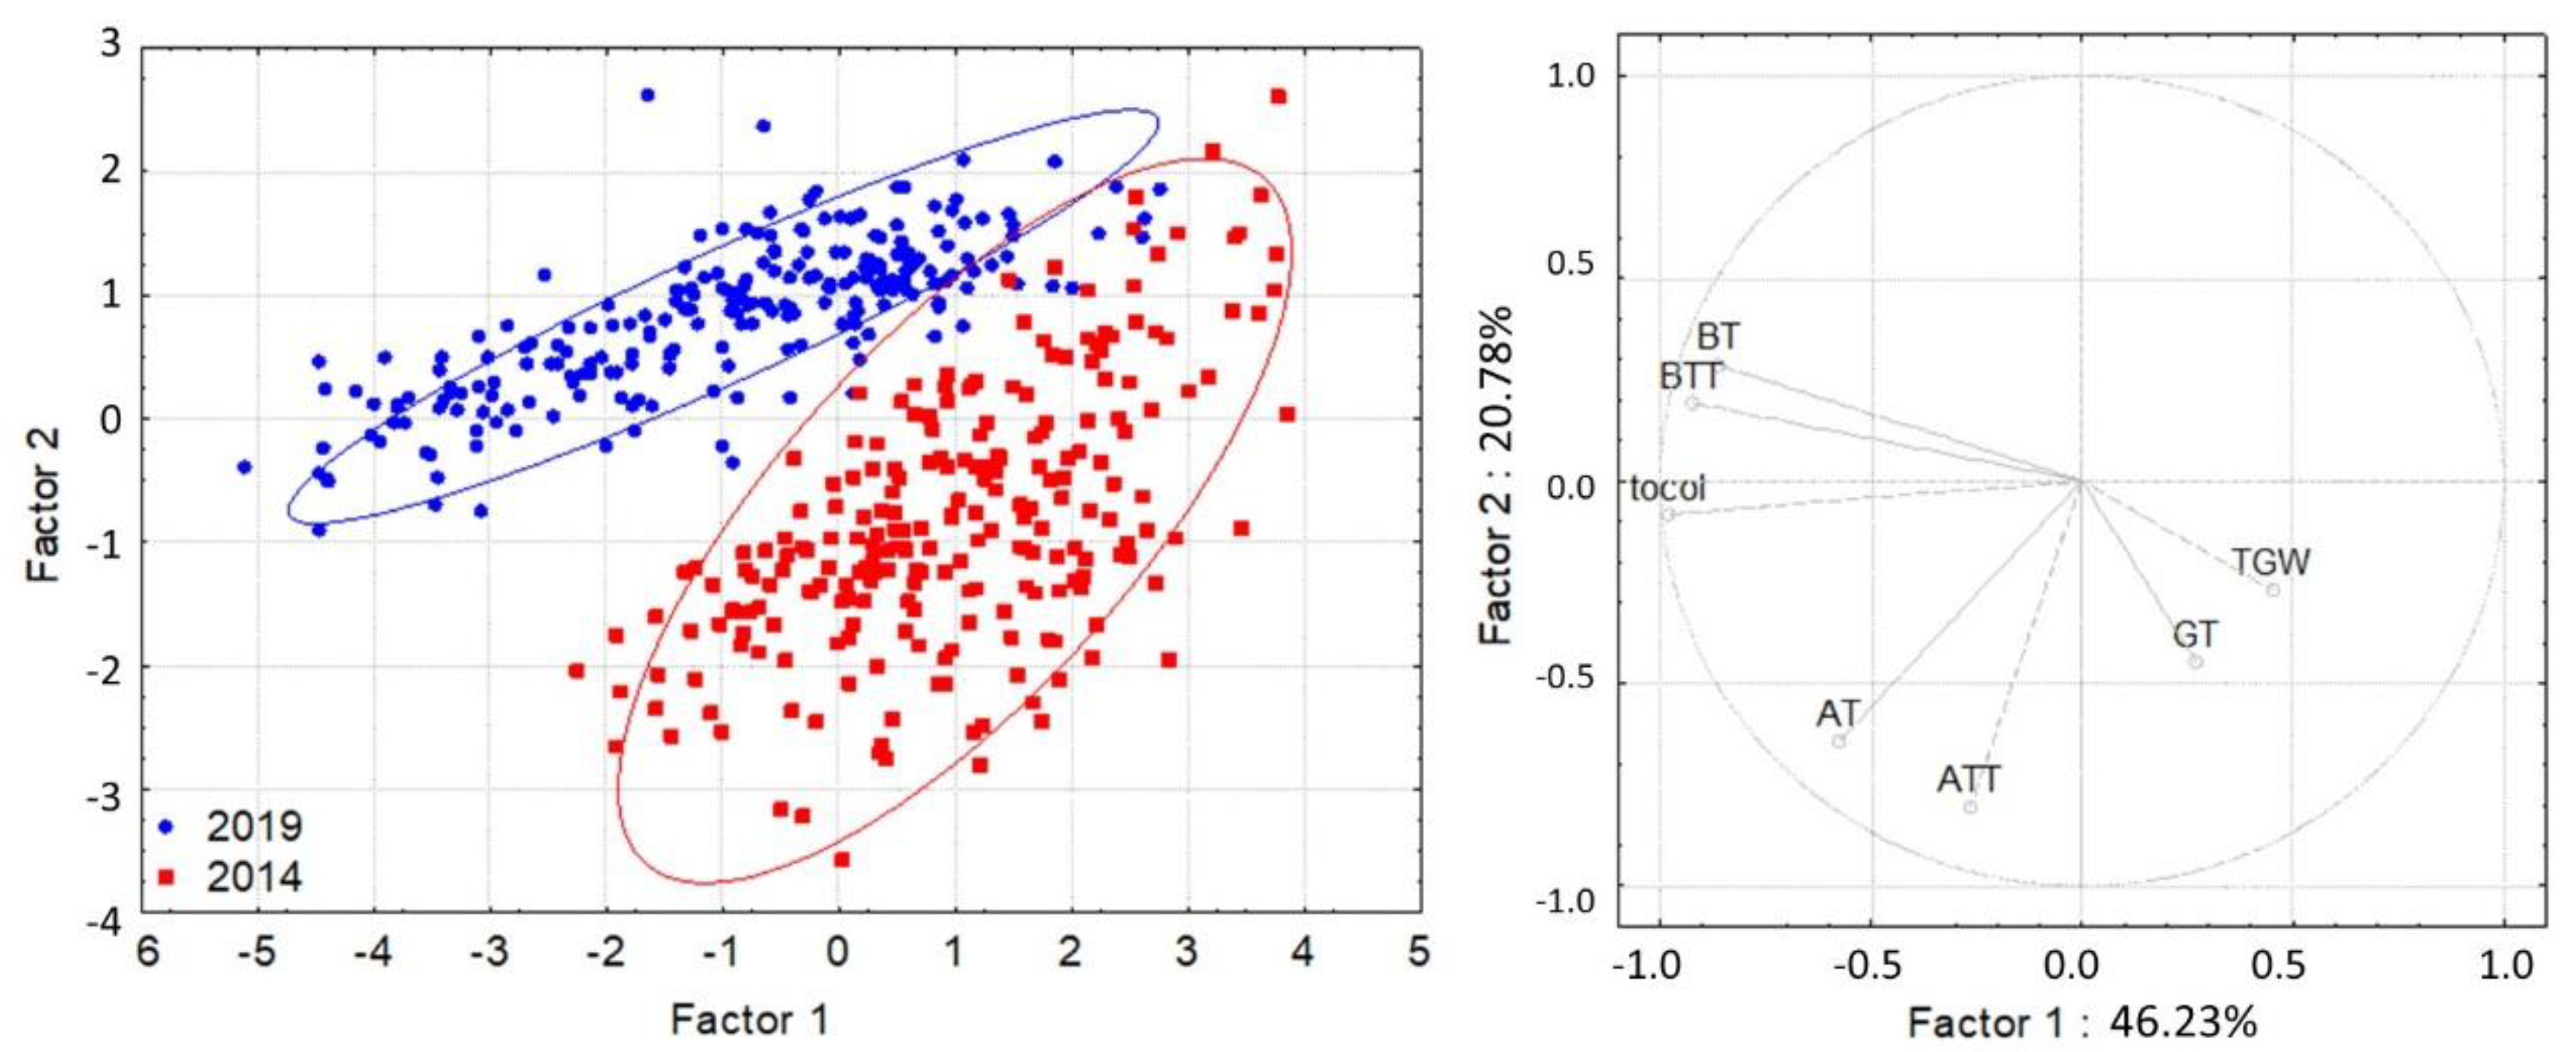
| AT | 2014 | 458 | 5.67 | 1.82 | 0.09 | 5.51 | 5.84 | 1.38 | 10.05 |
| 2019 | 458 | 5.48 | 1.04 | 0.05 | 5.38 | 5.57 | 3.30 | 8.39 | |
| Total | 916 | 5.58 | 1.49 | 0.05 | 5.48 | 5.67 | 1.38 | 10.05 | |
| ATT | 2014 | 458 | 2.91 | 0.57 | 0.03 | 2.85 | 2.96 | 1.15 | 4.79 |
| 2019 | 458 | 2.16 | 0.56 | 0.03 | 2.11 | 2.21 | 1.01 | 3.88 | |
| Total | 916 | 2.53 | 0.67 | 0.02 | 2.49 | 2.58 | 1.01 | 4.79 | |
| BT | 2014 | 458 | 2.40 | 0.45 | 0.02 | 2.36 | 2.45 | 0.80 | 3.76 |
| 2019 | 458 | 3.75 | 0.75 | 0.03 | 3.68 | 3.81 | 1.84 | 5.64 | |
| Total | 916 | 3.07 | 0.91 | 0.03 | 3.02 | 3.13 | 0.80 | 5.64 | |
| BTT | 2014 | 458 | 13.19 | 2.25 | 0.11 | 12.97 | 13.40 | 8.55 | 19.12 |
| 2019 | 458 | 19.05 | 4.13 | 0.19 | 18.67 | 19.43 | 10.51 | 28.94 | |
| Total | 916 | 16.12 | 4.43 | 0.15 | 15.83 | 16.41 | 8.55 | 28.94 | |
| GT | 2014 | 458 | 0.31 | 0.39 | 0.02 | 0.27 | 0.34 | 0.00 | 1.39 |
| 2019 | 458 | 0.15 | 0.07 | 0.00 | 0.14 | 0.15 | 0.06 | 0.43 | |
| Total | 916 | 0.23 | 0.29 | 0.01 | 0.21 | 0.25 | 0.00 | 1.39 | |
| Tocol | 2014 | 458 | 24.48 | 4.12 | 0.20 | 24.09 | 24.87 | 13.69 | 34.87 |
| 2019 | 458 | 30.61 | 5.93 | 0.28 | 30.04 | 31.13 | 17.82 | 45.18 | |
| Total | 916 | 27.53 | 5.94 | 0.20 | 27.14 | 27.92 | 13.69 | 45.18 | |
| TKW | 2014 | 458 | 46.47 | 5.93 | 0.30 | 45.87 | 47.07 | 25.97 | 58.52 |
| 2019 | 458 | 40.44 | 5.39 | 0.34 | 39.84 | 41.04 | 26.90 | 53.47 | |
| Total | 916 | 43.47 | 6.40 | 0.23 | 43.02 | 43.92 | 25.97 | 58.52 | |
| G | E | G × E | |
|---|---|---|---|
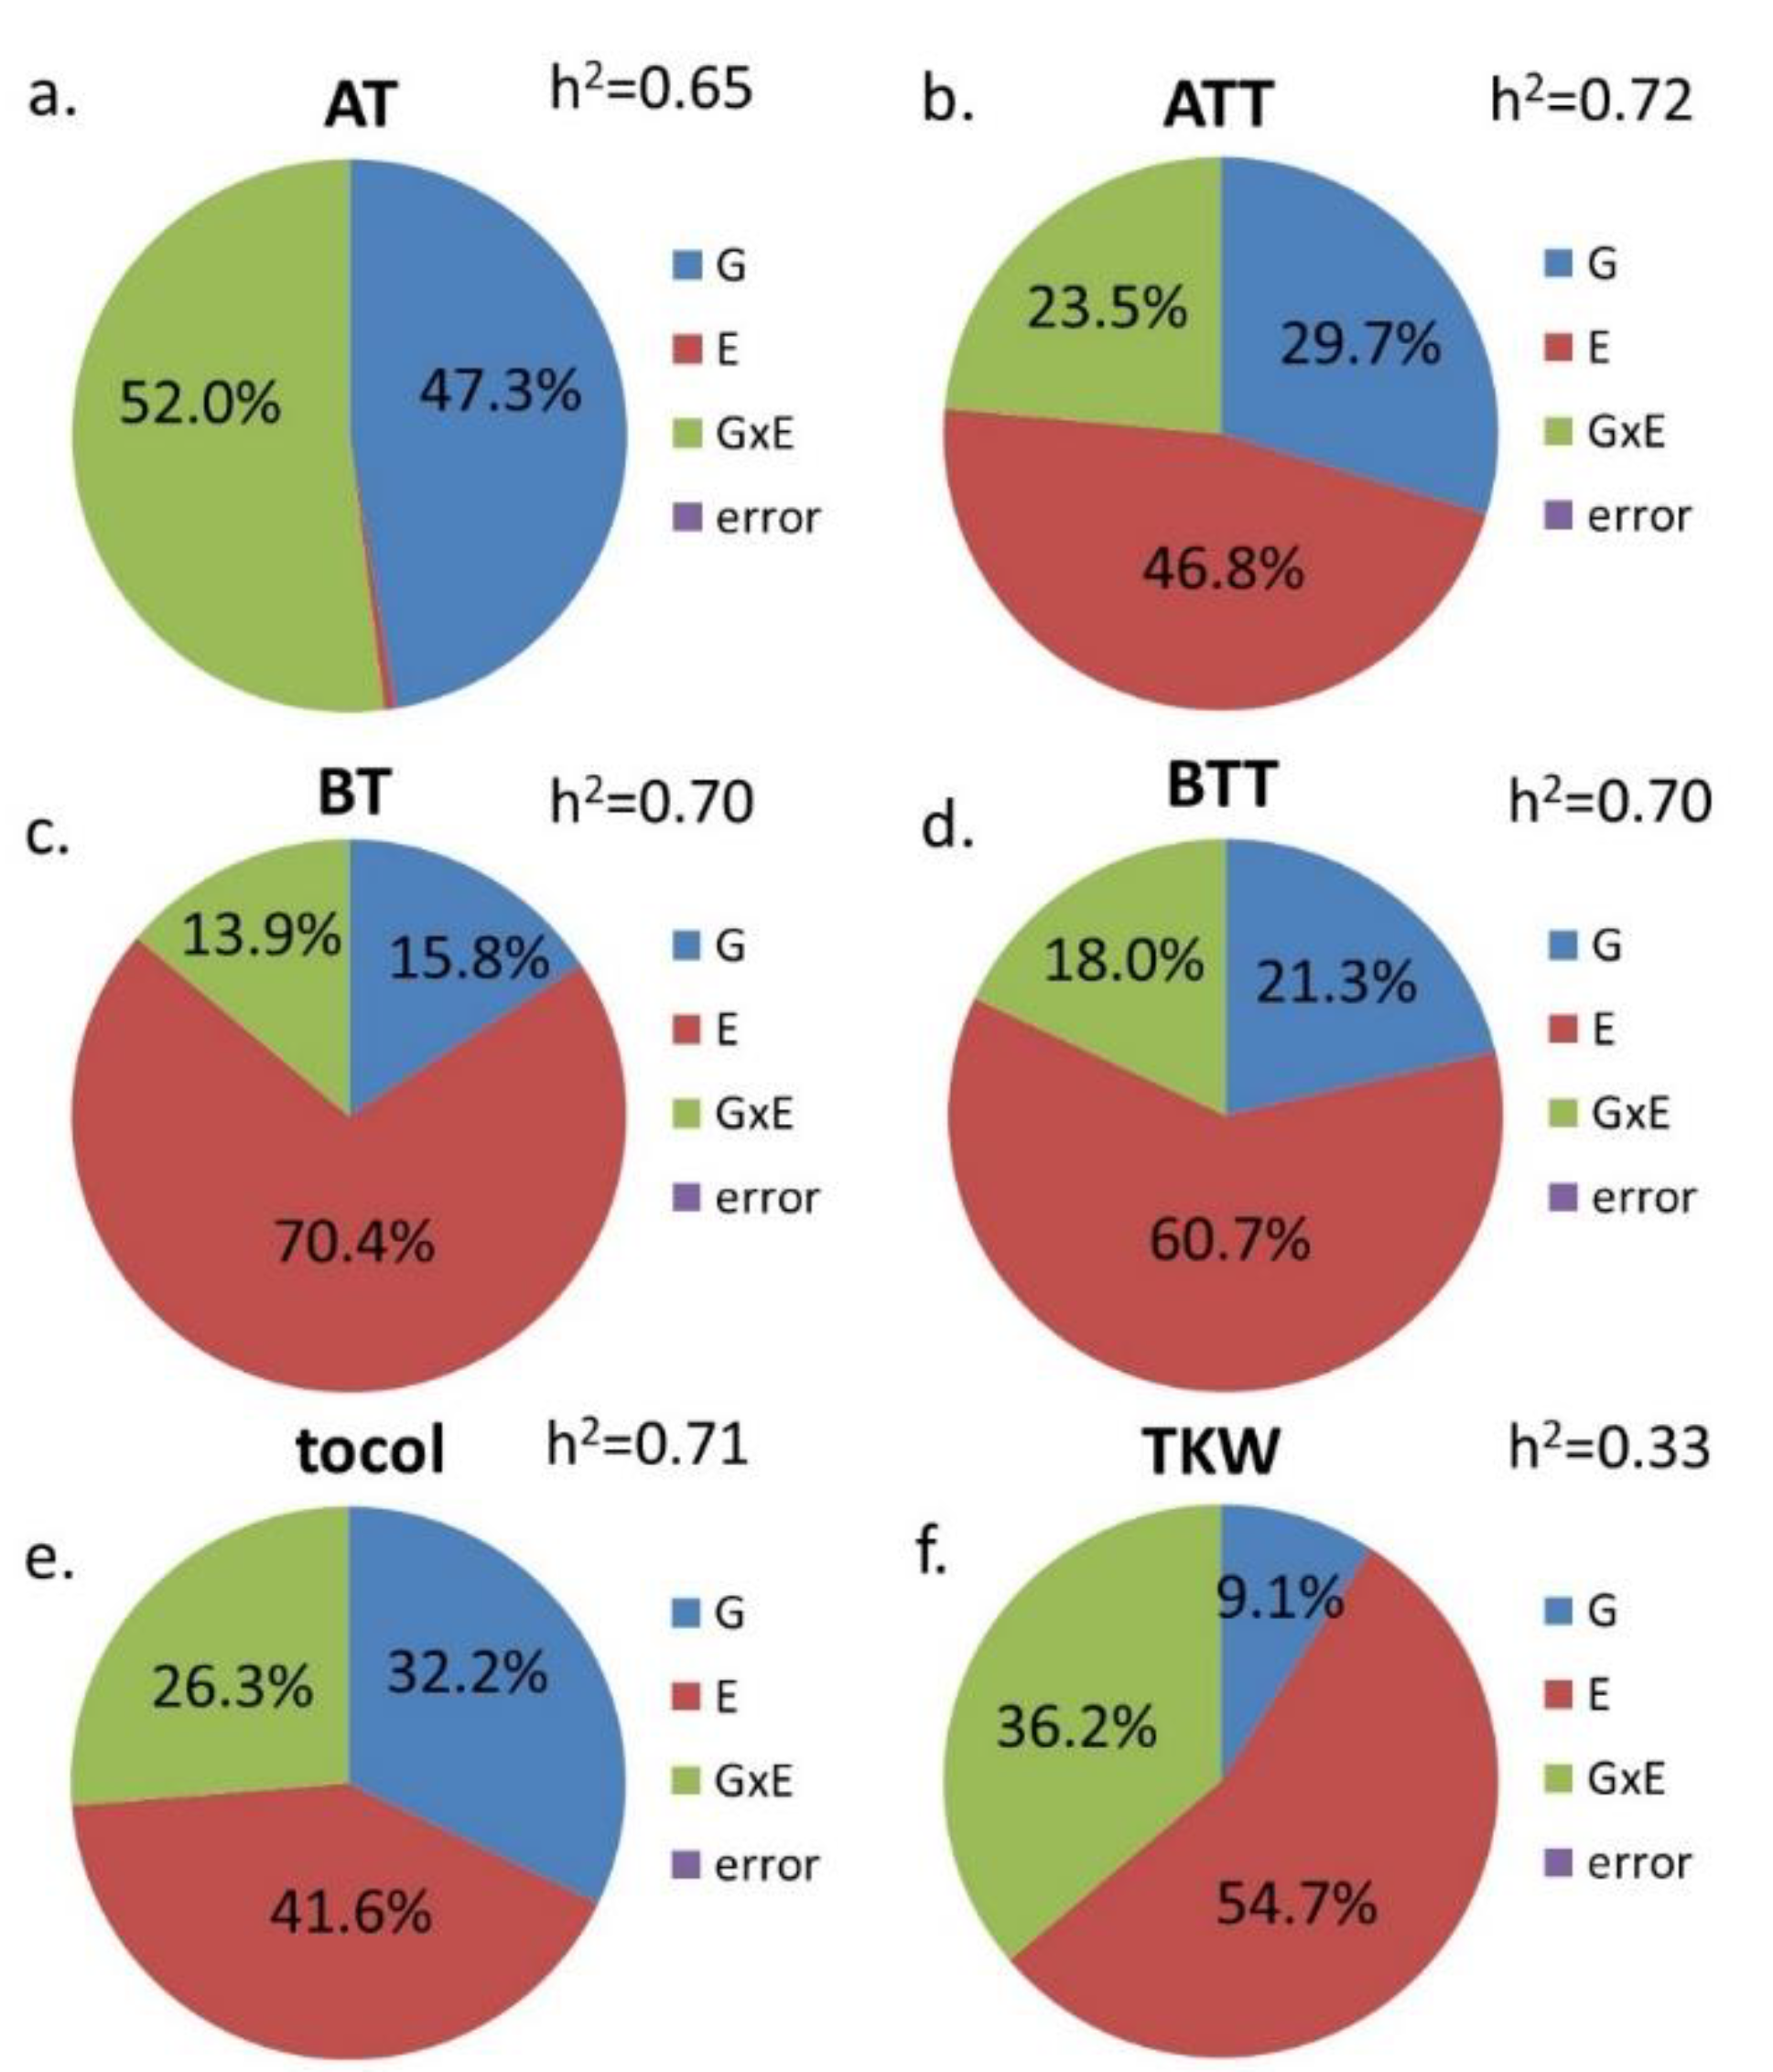
| AT | *** | *** | *** |
| ATT | *** | *** | *** |
| BT | *** | *** | *** |
| BTT | *** | *** | *** |
| GT | *** | *** | *** |
| tocol | *** | *** | *** |
| TKW | *** | *** | n.s. |
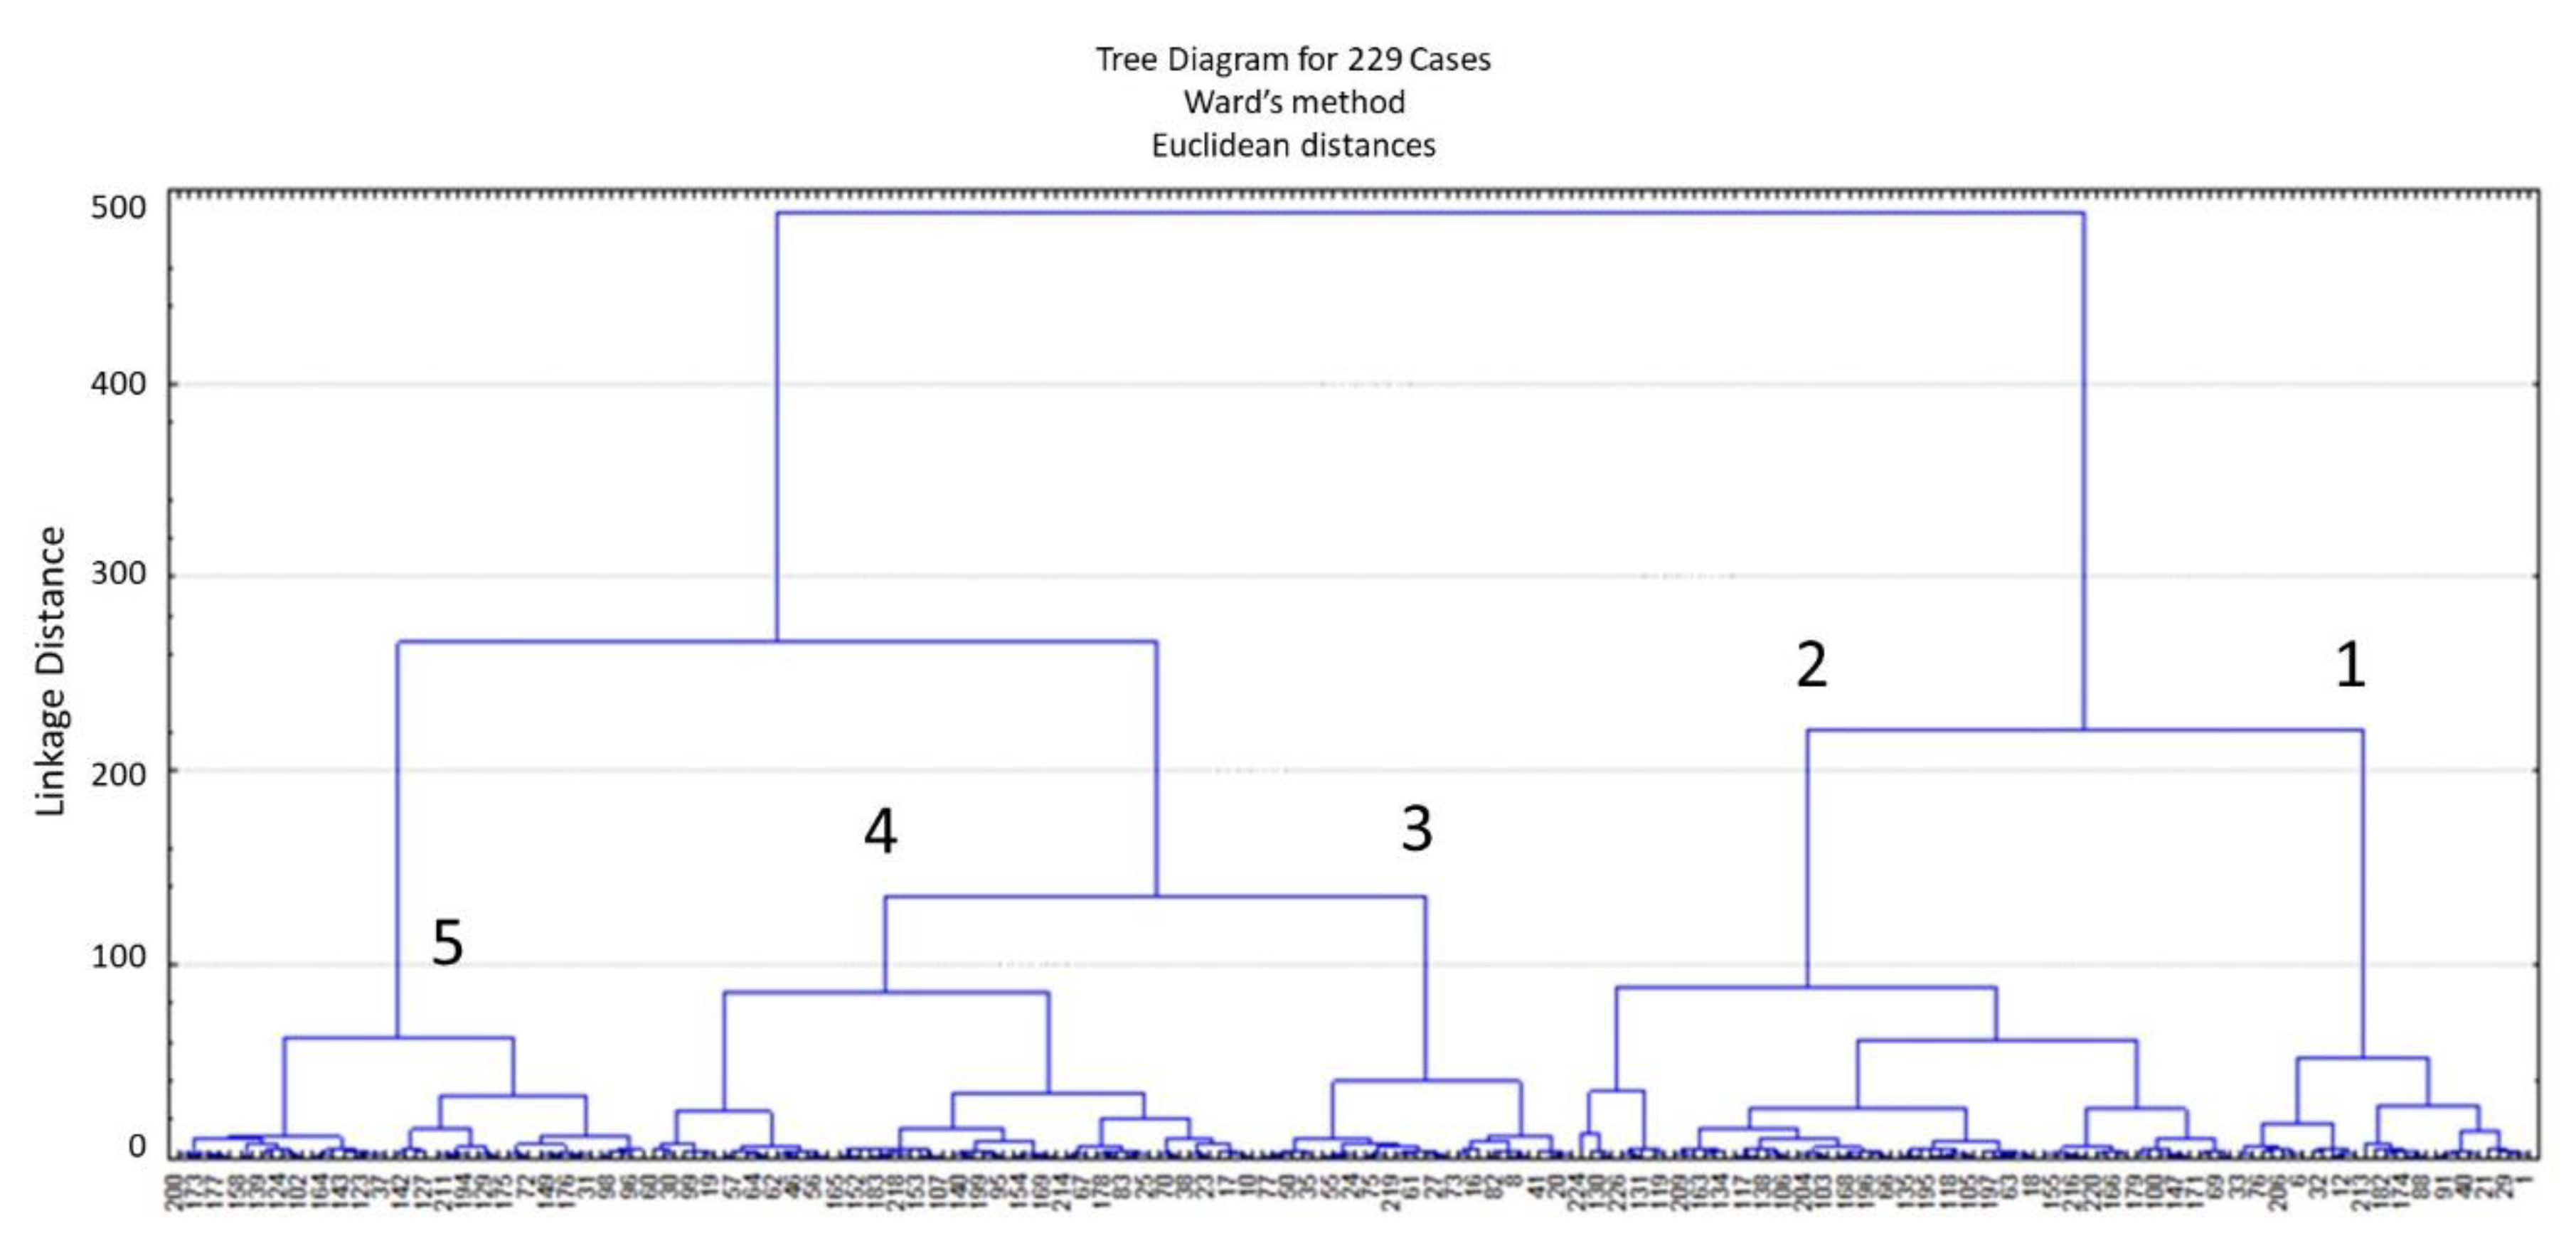
| Group | 1 | 2 | 3 | 4 | 5 |
|---|---|---|---|---|---|
| N | 29 | 64 | 31 | 59 | 46 |
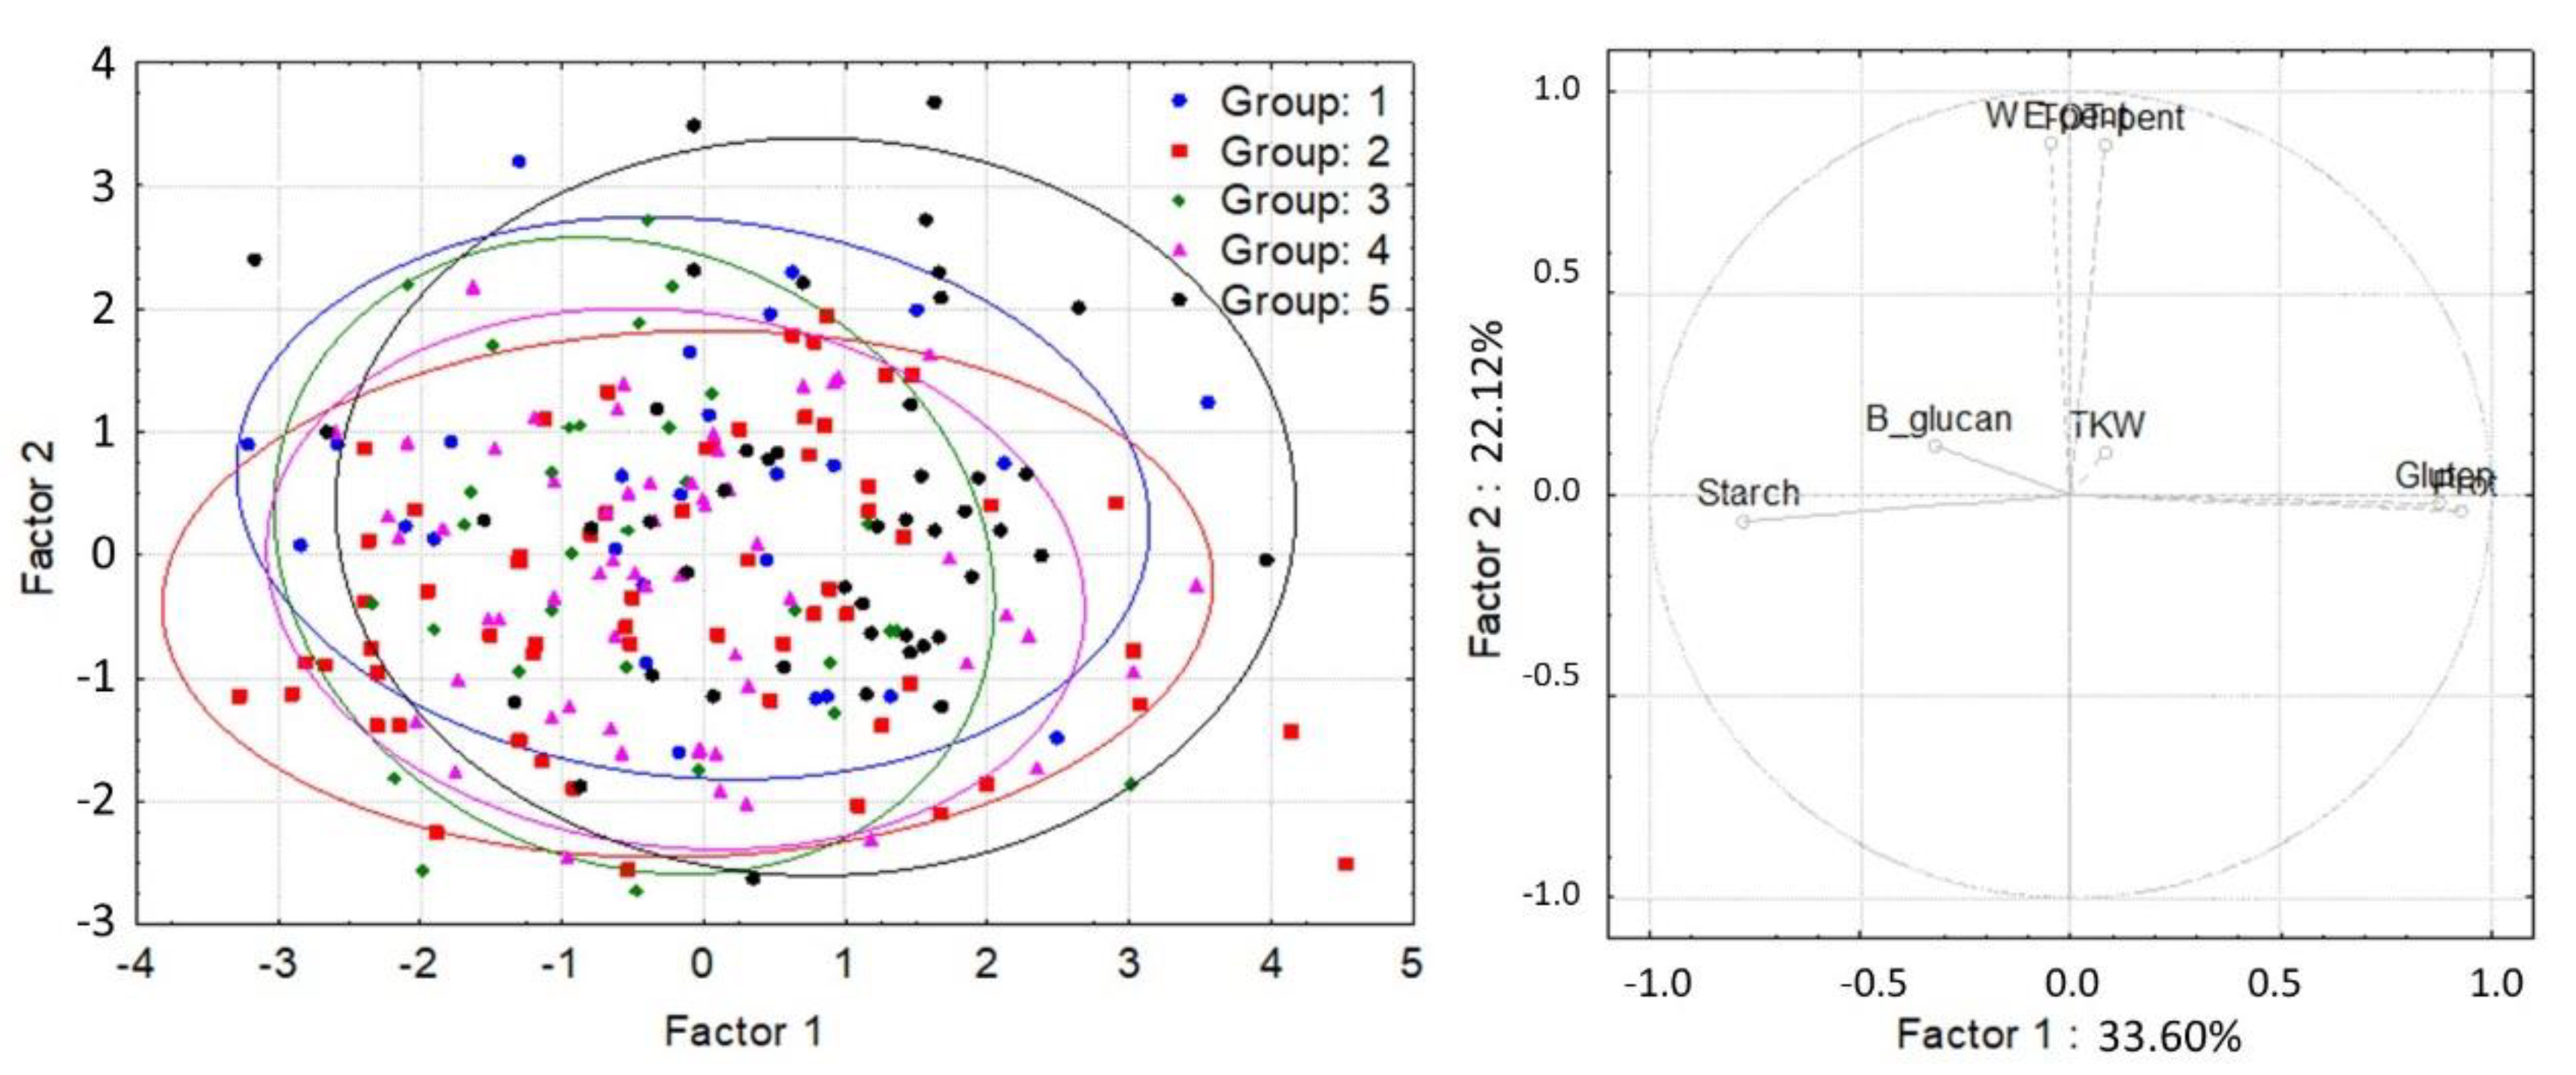
| α-tocopherol content (μg/g) | 6.38 bc | 4.87 a | 6.89 c | 5.85 b | 4.82 a |
| α-tocotrienol content (μg/g) | 3.29 a | 2.42 b | 2.87 b | 2.48 c | 2.06 d |
| β-tocopherol content (μg/g) | 3.47 c | 2.85 a | 3.60 c | 3.17 b | 2.66 a |
| β-tocotrienol content (μg/g) | 20.40 d | 15.22 b | 19.17 c | 16.02 b | 12.76 a |
| γ-tocopherol content (μg/g) | 0.18 ab | 0.28 c | 0.12 a | 0.22 ab | 0.26 c |
| Total tocol content (μg/g) | 33.72 d | 25.63 b | 32.65 d | 27.74 c | 22.56 a |
| TOT-pentosan content (mg/g) | 46.82 a | 44.82 a | 44.67 a | 44.58 a | 46.39 a |
| WE-pentosan content (mg/g) | 10.25 b | 8.87 a | 9.55 ab | 9.05 a | 9.78 ab |
| B-glucan content (mg/g) | 6.44 a | 6.98 b | 6.90 ab | 7.02 b | 6.99 b |
| Protein content (%) | 14.14 a | 14.31 a | 14.06 a | 14.38 a | 14.98 b |
| Starch content (%) | 55.11 a | 55.42 a | 56.11 b | 56.16 b | 55.64 ab |
| Gluten content (%) | 31.73 a | 32.70 ab | 33.32 ab | 34.18 bc | 36.43 c |
| Gluten Index (GI) | 89.90 b | 86.40 ab | 87.69 b | 85.85 ab | 80.52 a |
| Falling Number (FN) (s) | 408.85 b | 319.59 a | 403.89 b | 345.94 a | 295.83 a |
| Zeleny sedimentation (ml) | 45.20 a | 41.50 a | 44.58 a | 44.53 a | 44.20 a |
| Dough development time (Dev Time) (min) | 9.37 a | 9.74 a | 9.45 a | 10.21 a | 11.45 a |
| Dough Stability (min) | 12.86 a | 13.39 a | 12.14 a | 13.23 a | 13.40 a |
| Water absorption (Wabs) (%) | 60.05 a | 61.25 ab | 61.03 ab | 62.12 b | 64.41 c |
| Quality number (QN) | 88.21 a | 84.33 a | 86.98 a | 86.71 a | 88.82 a |
| Thousand-kernel weight (TKW) (g) | 36.78 a | 39.46 b | 45.49 c | 48.55 d | 50.82 e |
| Test weight (TW) (kg/100 L) | 70.62 a | 72.52 a | 75.48 b | 76.56 b | 75.94 b |
Publisher’s Note: MDPI stays neutral with regard to jurisdictional claims in published maps and institutional affiliations. |
© 2022 by the authors. Licensee MDPI, Basel, Switzerland. This article is an open access article distributed under the terms and conditions of the Creative Commons Attribution (CC BY) license (https://creativecommons.org/licenses/by/4.0/).
Share and Cite
Tremmel-Bede, K.; Szentmiklóssy, M.; Lampi, A.-M.; Piironen, V.; Shewry, P.R.; Vida, G.; Tömösközi, S.; Karsai, I.; Láng, L.; Bedő, Z.; et al. Variation in the Content and Composition of Tocols in a Wheat Population. Foods 2022, 11, 1343. https://doi.org/10.3390/foods11091343
Tremmel-Bede K, Szentmiklóssy M, Lampi A-M, Piironen V, Shewry PR, Vida G, Tömösközi S, Karsai I, Láng L, Bedő Z, et al. Variation in the Content and Composition of Tocols in a Wheat Population. Foods. 2022; 11(9):1343. https://doi.org/10.3390/foods11091343
Chicago/Turabian StyleTremmel-Bede, Karolina, Marietta Szentmiklóssy, Anna-Maija Lampi, Vieno Piironen, Peter R. Shewry, Gyula Vida, Sándor Tömösközi, Ildikó Karsai, László Láng, Zoltán Bedő, and et al. 2022. "Variation in the Content and Composition of Tocols in a Wheat Population" Foods 11, no. 9: 1343. https://doi.org/10.3390/foods11091343
APA StyleTremmel-Bede, K., Szentmiklóssy, M., Lampi, A.-M., Piironen, V., Shewry, P. R., Vida, G., Tömösközi, S., Karsai, I., Láng, L., Bedő, Z., & Rakszegi, M. (2022). Variation in the Content and Composition of Tocols in a Wheat Population. Foods, 11(9), 1343. https://doi.org/10.3390/foods11091343