
Rapid Assessment of Rice Quality Traits Using Low-Cost Digital Technologies


Abstract
:
1. Introduction
2. Materials and Methods
2.1. Samples Preparation
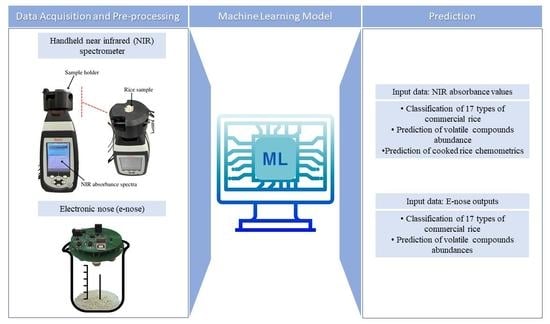
2.2. Near-Infrared Spectroscopy and Electronic Nose Measurements
2.3. Gas Chromatography-Mass Selective Detector Analysis
2.4. Colour, pH, and Texture Measurement
2.5. Statistical Analysis and Machine Learning Modelling
3. Results and Discussion
4. Conclusions
Supplementary Materials
Author Contributions
Funding
Institutional Review Board Statement
Informed Consent Statement
Data Availability Statement
Acknowledgments
Conflicts of Interest
References
- Shahbandeh, M. Rice Consumption Worldwide in 2021/2022, by Country (in 1000 metric tons). Available online: https://www.statista.com/statistics/255971/top-countries-based-on-rice-consumption-2012-2013/ (accessed on 23 March 2022).
- Mané, I.; Bassama, J.; Ndong, M.; Mestres, C.; Diedhiou, P.M.; Fliedel, G. Deciphering urban consumer requirements for rice quality gives insights for driving the future acceptability of local rice in Africa: Case study in the city of Saint-Louis in Senegal. Food Sci. Nutr. 2021, 9, 1614–1624. [Google Scholar] [CrossRef] [PubMed]
- Bairagi, S.; Demont, M.; Custodio, M.C.; Ynion, J. What drives consumer demand for rice fragrance? Evidence from South and Southeast Asia. Br. Food J. 2020, 122, 3473–3498. [Google Scholar] [CrossRef]
- Wahyudi, A.; Kuwornu, J.K.M.; Gunawan, E.; Datta, A.; Nguyen, L.T. Factors Influencing the Frequency of Consumers’ Purchases of Locally-Produced Rice in Indonesia: A Poisson Regression Analysis. Agriculture 2019, 9, 117. [Google Scholar] [CrossRef] [Green Version]
- Gondal, T.A.; Keast, R.S.J.; Shellie, R.A.; Jadhav, S.R.; Gamlath, S.; Mohebbi, M.; Liem, D.G. Consumer Acceptance of Brown and White Rice Varieties. Foods 2021, 10, 1950. [Google Scholar] [CrossRef]
- Maleki, C.; Oliver, P.; Lewin, S.; Liem, G.; Keast, R. Preference mapping of different water-to-rice ratios in cooked aromatic white jasmine rice. J. Food Sci. 2020, 85, 1576–1585. [Google Scholar] [CrossRef]
- Pang, Y.; Ali, J.; Wang, X.; Franje, N.J.; Revilleza, J.E.; Xu, J.; Li, Z. Relationship of Rice Grain Amylose, Gelatinization Temperature and Pasting Properties for Breeding Better Eating and Cooking Quality of Rice Varieties. PLoS ONE 2016, 11, e0168483. [Google Scholar] [CrossRef] [Green Version]
- Li, H.; Prakash, S.; Nicholson, T.M.; Fitzgerald, M.A.; Gilbert, R.G. The importance of amylose and amylopectin fine structure for textural properties of cooked rice grains. Food Chem. 2016, 196, 702–711. [Google Scholar] [CrossRef] [Green Version]
- Routray, W.; Rayaguru, K. 2-Acetyl-1-pyrroline: A key aroma component of aromatic rice and other food products. Food Rev. Int. 2017, 34, 539–565. [Google Scholar] [CrossRef]
- Bairagi, S.; Mohanty, S.; Custodio, M.C. Consumers’ preferences for rice attributes in Cambodia: A choice modeling approach. J. Agribus. Dev. Emerg. Econ. 2019, 9, 94–108. [Google Scholar] [CrossRef]
- Hu, X.; Lu, L.; Guo, Z.; Zhu, Z. Volatile compounds, affecting factors and evaluation methods for rice aroma: A review. Trends Food Sci. Technol. 2020, 97, 136–146. [Google Scholar] [CrossRef]
- Wei, X.; Sun, Q.; Methven, L.; Elmore, J.S. Comparison of the sensory properties of fragrant and non-fragrant rice (Oryza sativa), focusing on the role of the popcorn-like aroma compound 2-acetyl-1-pyrroline. Food Chem. 2021, 339, 128077. [Google Scholar] [CrossRef] [PubMed]
- Setyaningsih, W.; Majchrzak, T.; Dymerski, T.; Namiesnik, J.; Palma, M. Key-Marker Volatile Compounds in Aromatic Rice (Oryza sativa) Grains: An HS-SPME Extraction Method Combined with GCxGC-TOFMS. Molecules 2019, 24, 4180. [Google Scholar] [CrossRef] [PubMed] [Green Version]
- Sansenya, S.; Hua, Y.; Chumanee, S. The Correlation between 2-Acetyl-1-pyrroline Content, Biological Compounds and Molecular Characterization to the Aroma Intensities of Thai Local Rice. J. Oleo Sci. 2018, 67, 893–904. [Google Scholar] [CrossRef] [PubMed] [Green Version]
- Choi, S.; Seo, H.-S.; Lee, K.R.; Lee, S.; Lee, J. Effect of milling degrees on volatile profiles of raw and cooked black rice (Oryza sativa L. cv. Sintoheugmi). Appl. Biol. Chem. 2018, 61, 91–105. [Google Scholar] [CrossRef]
- Tikapunya, T.; Henry, R.J.; Smyth, H. Evaluating the sensory properties of unpolished Australian wild rice. Food Res. Int. 2018, 103, 406–414. [Google Scholar] [CrossRef] [Green Version]
- Kasote, D.; Singh, V.K.; Bollinedi, H.; Singh, A.K.; Sreenivasulu, N.; Regina, A. Profiling of 2-Acetyl-1-Pyrroline and Other Volatile Compounds in Raw and Cooked Rice of Traditional and Improved Varieties of India. Foods 2021, 10, 1917. [Google Scholar] [CrossRef]
- Gao, C.; Li, Y.; Pan, Q.; Fan, M.; Wang, L.; Qian, H. Analysis of the key aroma volatile compounds in rice bran during storage and processing via HS-SPME GC/MS. J. Cereal Sci. 2021, 99, 103178. [Google Scholar] [CrossRef]
- Pal, S.; Bagchi, T.B.; Dhali, K.; Kar, A.; Sanghamitra, P.; Sarkar, S.; Samaddar, M.; Majumder, J. Evaluation of sensory, physicochemical properties and Consumer preference of black rice and their products. J. Food Sci. Technol. 2019, 56, 1484–1494. [Google Scholar] [CrossRef]
- Xia, Y.; Sun, Y.; Yuan, J.; Xing, C. Grain quality evaluation of japonica rice effected by cultivars, environment, and their interactions based on appearance and processing characteristics. Food Sci. Nutr. 2021, 9, 2129–2138. [Google Scholar] [CrossRef]
- Ribeiro, C.M.G.; Strunkis, C.d.M.; Campos, P.V.S.; Salles, M.O. Electronic Nose and Tongue Materials for Sensing. In Reference Module in Biomedical Sciences; Elsevier: Amsterdam, The Netherlands, 2021. [Google Scholar] [CrossRef]
- Jafari, S.-M.; Tsimidou, M.Z.; Rajabi, H.; Kyriakoudi, A. Chapter 16—Bioactive ingredients of saffron: Extraction, analysis, applications. In Saffron; Koocheki, A., Khajeh-Hosseini, M., Eds.; Woodhead Publishing: Sawston, UK, 2020. [Google Scholar] [CrossRef]
- Sari, I.M.; Wijaya, D.R.; Hidayat, W.; Kannan, R. An Approach to Classify Rice Quality using Electronic Nose Dataset-based Naïve Bayes Classifier. In Proceedings of the 2021 International Symposium on Electronics and Smart Devices (ISESD), Bandung, Indonesia, 29–30 June 2021; pp. 1–5. [Google Scholar]
- Erlangga, F.; Wijaya, D.R.; Wikusna, W. Electronic Nose Dataset for Classifying Rice Quality using Neural Network. In Proceedings of the 2021 9th International Conference on Information and Communication Technology (ICoICT), Yogyakarta, Indonesia, 3–5 August 2021; pp. 462–466. [Google Scholar]
- Gonzalez Viejo, C.; Tongson, E.; Fuentes, S. Integrating a Low-Cost Electronic Nose and Machine Learning Modelling to Assess Coffee Aroma Profile and Intensity. Sensors 2021, 21, 2016. [Google Scholar] [CrossRef]
- Summerson, V.; Gonzalez Viejo, C.; Pang, A.; Torrico, D.D.; Fuentes, S. Assessment of Volatile Aromatic Compounds in Smoke Tainted Cabernet Sauvignon Wines Using a Low-Cost E-Nose and Machine Learning Modelling. Molecules 2021, 26, 5108. [Google Scholar] [CrossRef] [PubMed]
- Gonzalez Viejo, C.; Fuentes, S.; Hernandez-Brenes, C. Smart Detection of Faults in Beers Using Near-Infrared Spectroscopy, a Low-Cost Electronic Nose and Artificial Intelligence. Fermentation 2021, 7, 117. [Google Scholar] [CrossRef]
- Chen, H.-z.; Zhang, M.; Guo, Z. Discrimination of fresh-cut broccoli freshness by volatiles using electronic nose and gas chromatography-mass spectrometry. Postharvest Biol. Technol. 2019, 148, 168–175. [Google Scholar] [CrossRef]
- Zhu, D.; Ren, X.; Wei, L.; Cao, X.; Ge, Y.; Liu, H.; Li, J. Collaborative analysis on difference of apple fruits flavour using electronic nose and electronic tongue. Sci. Hortic. 2020, 260, 108879. [Google Scholar] [CrossRef]
- Wakhid, S.; Sarno, R.; Sabilla, S.I. The effect of gas concentration on detection and classification of beef and pork mixtures using E-nose. Comput. Electron. Agric. 2022, 195, 106838. [Google Scholar] [CrossRef]
- Huang, C.; Gu, Y. A Machine Learning Method for the Quantitative Detection of Adulterated Meat Using a MOS-Based E-Nose. Foods 2022, 11, 602. [Google Scholar] [CrossRef]
- Rusinek, R.; Siger, A.; Gawrysiak-Witulska, M.; Rokosik, E.; Malaga-Toboła, U.; Gancarz, M. Application of an electronic nose for determination of pre-pressing treatment of rapeseed based on the analysis of volatile compounds contained in pressed oil. Int. J. Food Sci. Technol. 2020, 55, 2161–2170. [Google Scholar] [CrossRef]
- Rusinek, R.; Jeleń, H.; Malaga-Toboła, U.; Molenda, M.; Gancarz, M. Influence of changes in the level of volatile compounds emitted during rapeseed quality degradation on the reaction of MOS type sensor-array. Sensors 2020, 20, 3135. [Google Scholar] [CrossRef]
- Gancarz, M.; Malaga-Toboła, U.; Oniszczuk, A.; Tabor, S.; Oniszczuk, T.; Gawrysiak-Witulska, M.; Rusinek, R. Detection and measurement of aroma compounds with the electronic nose and a novel method for MOS sensor signal analysis during the wheat bread making process. Food Bioprod. Process. 2021, 127, 90–98. [Google Scholar] [CrossRef]
- Tatli, S.; Mirzaee-Ghaleh, E.; Rabbani, H.; Karami, H.; Wilson, A.D. Rapid detection of urea fertilizer effects on voc emissions from cucumber fruits using a MOS E-Nose Sensor Array. Agronomy 2021, 12, 35. [Google Scholar] [CrossRef]
- Strani, L.; D’Alessandro, A.; Ballestrieri, D.; Durante, C.; Cocchi, M. Fast GC E-Nose and Chemometrics for the Rapid Assessment of Basil Aroma. Chemosensors 2022, 10, 105. [Google Scholar] [CrossRef]
- Cozzolino, D. The Ability of Near Infrared (NIR) Spectroscopy to Predict Functional Properties in Foods: Challenges and Opportunities. Molecules 2021, 26, 6981. [Google Scholar] [CrossRef] [PubMed]
- Beć, K.B.; Grabska, J.; Huck, C.W. Current and future research directions in computer-aided near-infrared spectroscopy: A perspective. Spectrochim. Acta Part A Mol. Biomol. Spectrosc. 2021, 254, 119625. [Google Scholar] [CrossRef] [PubMed]
- Zeng, J.; Guo, Y.; Han, Y.; Li, Z.; Yang, Z.; Chai, Q.; Wang, W.; Zhang, Y.; Fu, C. A Review of the discriminant analysis methods for food quality based on near-infrared spectroscopy and pattern recognition. Molecules 2021, 26, 749. [Google Scholar] [CrossRef] [PubMed]
- Pasquini, C. Near infrared spectroscopy: A mature analytical technique with new perspectives—A review. Anal. Chim. Acta 2018, 1026, 8–36. [Google Scholar] [CrossRef]
- Teye, E.; Amuah, C.L.Y.; McGrath, T.; Elliott, C. Innovative and rapid analysis for rice authenticity using hand-held NIR spectrometry and chemometrics. Spectrochim. Acta A Mol. Biomol. Spectrosc. 2019, 217, 147–154. [Google Scholar] [CrossRef]
- Li, L.; Wang, Y.; Jin, S.; Li, M.; Chen, Q.; Ning, J.; Zhang, Z. Evaluation of black tea by using smartphone imaging coupled with micro-near-infrared spectrometer. Spectrochim. Acta A Mol. Biomol. Spectrosc. 2021, 246, 118991. [Google Scholar] [CrossRef]
- Henrique da Silva Melo, B.; Figueiredo Sales, R.; da Silva Bastos Filho, L.; Souza Povoas da Silva, J.; Gabrielle Carolino de Almeida Sousa, A.; Maria Camara Peixoto, D.; Pimentel, M.F. Handheld near infrared spectrometer and machine learning methods applied to the monitoring of multiple process stages in industrial sugar production. Food Chem. 2021, 369, 130919. [Google Scholar] [CrossRef]
- Duarte, E.S.A.; de Almeida, V.E.; da Costa, G.B.; de Araujo, M.C.U.; Veras, G.; Diniz, P.; Fernandes, D.D.S. Feasibility study on quantification and authentication of the cassava starch content in wheat flour for bread-making using NIR spectroscopy and digital images. Food Chem. 2021, 368, 130843. [Google Scholar] [CrossRef]
- Richens, J.G.; Lee, C.M.; Johri, S. Improving the accuracy of medical diagnosis with causal machine learning. Nat. Commun. 2020, 11, 3923. [Google Scholar] [CrossRef]
- Sircar, A.; Yadav, K.; Rayavarapu, K.; Bist, N.; Oza, H. Application of machine learning and artificial intelligence in oil and gas industry. Pet. Res. 2021, 6, 379–391. [Google Scholar] [CrossRef]
- Dogan, A.; Birant, D. Machine learning and data mining in manufacturing. Expert Syst. Appl. 2021, 166, 114060. [Google Scholar] [CrossRef]
- Yao, B.; Feng, T. Machine Learning in Automotive Industry; SAGE Publications: London, UK, 2018; Volume 10, p. 1687814018805787. [Google Scholar]
- Liakos, K.G.; Busato, P.; Moshou, D.; Pearson, S.; Bochtis, D. Machine Learning in Agriculture: A Review. Sensors 2018, 18, 2674. [Google Scholar] [CrossRef] [PubMed] [Green Version]
- Jiménez-Carvelo, A.M.; González-Casado, A.; Bagur-González, M.G.; Cuadros-Rodríguez, L. Alternative data mining/machine learning methods for the analytical evaluation of food quality and authenticity—A review. Food Res. Int. 2019, 122, 25–39. [Google Scholar] [CrossRef]
- Basile, T.; Marsico, A.D.; Perniola, R. Use of Artificial Neural Networks and NIR Spectroscopy for Non-Destructive Grape Texture Prediction. Foods 2022, 11, 281. [Google Scholar] [CrossRef] [PubMed]
- Astray, G.; Mejuto, J.C.; Martínez-Martínez, V.; Nevares, I.; Alamo-Sanza, M.; Simal-Gandara, J. Prediction models to control aging time in red wine. Molecules 2019, 24, 826. [Google Scholar] [CrossRef] [PubMed] [Green Version]
- Fuentes, S.; Summerson, V.; Tongson, E.; Viejo, C.G. Latest developments and potential uses of digital technologies and artificial intelligence (AI) to assess smoke contamination in grapevines, berries and taint in wines. Wine Vitic. J. 2022, 37, 62–66. [Google Scholar]
- Gonzalez Viejo, C.; Torrico, D.; Dunshea, F.; Fuentes, S. Emerging Technologies Based on Artificial Intelligence to Assess the Quality and Consumer Preference of Beverages. Beverages 2019, 5, 62. [Google Scholar] [CrossRef] [Green Version]
- Gonzalez Viejo, C.; Fuentes, S.; Li, G.; Collmann, R.; Condé, B.; Torrico, D. Development of a robotic pourer constructed with ubiquitous materials, open hardware and sensors to assess beer foam quality using computer vision and pattern recognition algorithms: RoboBEER. Food Res. Int. 2016, 89, 504–513. [Google Scholar] [CrossRef]
- Martinez-Castillo, C.; Astray, G.; Mejuto, J.C.; Simal-Gandara, J. Random forest, artificial neural network, and support vector machine models for honey classification. eFood 2020, 1, 69–76. [Google Scholar] [CrossRef] [Green Version]
- Zhang, X.; Gao, Z.; Yang, Y.; Pan, S.; Yin, J.; Yu, X. Rapid identification of the storage age of dried tangerine peel using a hand-held near infrared spectrometer and machine learning. J. Near Infrared Spectrosc. 2022, 30, 31–39. [Google Scholar] [CrossRef]
- Fuentes, S.; Tongson, E.; Unnithan, R.R.; Gonzalez Viejo, C. Early Detection of Aphid Infestation and Insect-Plant Interaction Assessment in Wheat Using a Low-Cost Electronic Nose (E-Nose), Near-Infrared Spectroscopy and Machine Learning Modeling. Sensors 2021, 21, 5948. [Google Scholar] [CrossRef] [PubMed]
- Ye, Z.; Liu, Y.; Li, Q. Recent Progress in Smart Electronic Nose Technologies Enabled with Machine Learning Methods. Sensors 2021, 21, 7620. [Google Scholar] [CrossRef] [PubMed]
- Sampaio, P.S.; Almeida, A.S.; Brites, C.M. Use of Artificial Neural Network Model for Rice Quality Prediction Based on Grain Physical Parameters. Foods 2021, 10, 3016. [Google Scholar] [CrossRef]
- Gonzalez Viejo, C.; Fuentes, S.; Godbole, A.; Widdicombe, B.; Unnithan, R.R. Development of a low-cost e-nose to assess aroma profiles: An artificial intelligence application to assess beer quality. Sens. Actuators B Chem. 2020, 308, 127688. [Google Scholar] [CrossRef]
- Astuti, R.D.; Fibri, D.L.N.; Handoko, D.D.; David, W.; Budijanto, S.; Shirakawa, H. The Volatile Compounds and Aroma Description in Various Rhizopus oligosporus Solid-State Fermented and Nonfermented Rice Bran. Fermentation 2022, 8, 120. [Google Scholar] [CrossRef]
- Xu, M.; Jin, Z.; Lan, Y.; Rao, J.; Chen, B. HS-SPME-GC-MS/olfactometry combined with chemometrics to assess the impact of germination on flavor attributes of chickpea, lentil, and yellow pea flours. Food Chem. 2019, 280, 83–95. [Google Scholar] [CrossRef] [PubMed]
- Jarunrattanasri, A.; Theerakulkait, C.; Cadwallader, K.R. Aroma components of acid-hydrolyzed vegetable protein made by partial hydrolysis of rice bran protein. J. Agric. Food Chem. 2007, 55, 3044–3050. [Google Scholar] [CrossRef]
- Suttiarporn, P.; Sookwong, P.; Mahatheeranont, S. Fractionation and identification of antioxidant compounds from bran of Thai black rice cv. Riceberry. Int. J. Chem. Eng. Appl. 2016, 7, 109. [Google Scholar] [CrossRef] [Green Version]
- Ajarayasiri, J.; Chaiseri, S. Comparative study on aroma-active compounds in Thai, black and white glutinous rice varieties. Agric. Nat. Resour. 2008, 42, 715–722. [Google Scholar]
- Gonzalez Viejo, C.; Torrico, D.D.; Dunshea, F.R.; Fuentes, S. Development of Artificial Neural Network Models to Assess Beer Acceptability Based on Sensory Properties Using a Robotic Pourer: A Comparative Model Approach to Achieve an Artificial Intelligence System. Beverages 2019, 5, 33. [Google Scholar] [CrossRef] [Green Version]
- The Good Scents Company. The Good Scents Company Information System. Available online: http://www.thegoodscentscompany.com/ (accessed on 29 March 2022).
- Liu, J.; Liu, Y.; Wang, A.; Dai, Z.; Wang, R.; Sun, H.; Strappe, P.; Zhou, Z. Characteristics of moisture migration and volatile compounds of rice stored under various storage conditions. J. Cereal Sci. 2021, 102, 103323. [Google Scholar] [CrossRef]
- Zhao, Q.; Xue, Y.; Shen, Q. Changes in the major aroma-active compounds and taste components of Jasmine rice during storage. Food Res. Int. 2020, 133, 109160. [Google Scholar] [CrossRef]
- Liu, K.; Zhao, S.; Li, Y.; Chen, F. Analysis of volatiles in brown rice, germinated brown rice, and selenised germinated brown rice during storage at different vacuum levels. J. Sci. Food Agric. 2018, 98, 2295–2301. [Google Scholar] [CrossRef] [PubMed]
- Aznan, A.; Gonzalez Viejo, C.; Pang, A.; Fuentes, S. Computer Vision and Machine Learning Analysis of Commercial Rice Grains: A Potential Digital Approach for Consumer Perception Studies. Sensors 2021, 21, 6354. [Google Scholar] [CrossRef] [PubMed]
- Siriphollakul, P.; Nakano, K.; Kanlayanarat, S.; Ohashi, S.; Sakai, R.; Rittiron, R.; Maniwara, P. Eating quality evaluation of Khao Dawk Mali 105 rice using near-infrared spectroscopy. LWT—Food Sci. Technol. 2017, 79, 70–77. [Google Scholar] [CrossRef]
- Onmankhong, J.; Sirisomboon, P. Texture evaluation of cooked parboiled rice using nondestructive milled whole grain near infrared spectroscopy. J. Cereal Sci. 2021, 97, 103151. [Google Scholar] [CrossRef]
- Summerson, V.; Gonzalez Viejo, C.; Torrico, D.D.; Pang, A.; Fuentes, S. Detection of smoke-derived compounds from bushfires in Cabernet-Sauvignon grapes, must, and wine using Near-Infrared spectroscopy and machine learning algorithms. OENO One 2020, 54, 1105–1119. [Google Scholar] [CrossRef]
- Wawrzyniak, J. Prediction of fungal infestation in stored barley ecosystems using artificial neural networks. LWT 2021, 137, 110367. [Google Scholar] [CrossRef]
- Azarmdel, H.; Jahanbakhshi, A.; Mohtasebi, S.S.; Muñoz, A.R. Evaluation of image processing technique as an expert system in mulberry fruit grading based on ripeness level using artificial neural networks (ANNs) and support vector machine (SVM). Postharvest Biol. Technol. 2020, 166, 111201. [Google Scholar] [CrossRef]
- Fracassetti, D.; Pozzoli, C.; Vitalini, S.; Tirelli, A.; Iriti, M. Impact of cooking on bioactive compounds and antioxidant activity of pigmented rice cultivars. Foods 2020, 9, 967. [Google Scholar] [CrossRef] [PubMed]
- Krongworakul, N.; Naivikul, O.; Boonsupthip, W.; Wang, Y.J. Effect of conventional and microwave heating on physical and chemical properties of Jasmine brown rice in various forms. J. Food Process Eng. 2020, 43, e13506. [Google Scholar] [CrossRef]
- Arjharn, W.; Neamsorn, N.; Changrue, V.; Chanbang, Y.; Kunasakdakul, K.; Theanjumpol, P.; Kantakaew, P.; Junyusen, P.; Treeamnuk, T.; Junyusen, T. Electronic nose system for rancidity and insect monitoring of brown rice. E3S Web Conf. 2020, 187, 04015. [Google Scholar] [CrossRef]
- Amirvaresi, A.; Nikounezhad, N.; Amirahmadi, M.; Daraei, B.; Parastar, H. Comparison of near-infrared (NIR) and mid-infrared (MIR) spectroscopy based on chemometrics for saffron authentication and adulteration detection. Food Chem. 2021, 344, 128647. [Google Scholar] [CrossRef]
- Li, L.; Jin, S.; Wang, Y.; Liu, Y.; Shen, S.; Li, M.; Ma, Z.; Ning, J.; Zhang, Z. Potential of smartphone-coupled micro NIR spectroscopy for quality control of green tea. Spectrochim. Acta A Mol. Biomol. Spectrosc. 2021, 247, 119096. [Google Scholar] [CrossRef] [PubMed]
- Wilde, A.S.; Haughey, S.A.; Galvin-King, P.; Elliott, C.T. The feasibility of applying NIR and FT-IR fingerprinting to detect adulteration in black pepper. Food Control 2019, 100, 1–7. [Google Scholar] [CrossRef] [Green Version]
- Di Bucchianico, A. Coefficient of Determination (R2). In Encyclopedia of Statistics in Quality and Reliability; Wiley: Hoboken, NJ, USA, 2008; Volume 1. [Google Scholar]
- Junior, S.B.; Mastelini, S.M.; Barbon, A.P.A.; Barbin, D.F.; Calvini, R.; Lopes, J.F.; Ulrici, A. Multi-target prediction of wheat flour quality parameters with near infrared spectroscopy. Inf. Process. Agric. 2020, 7, 342–354. [Google Scholar]
- Junior, S.B.; Santana, E.J.; Badaró, A.T.; Borrás, N.A.; Barbin, D.F. Advantages of Multi-Target Modelling for Spectral Regression. In Spectroscopic Techniques & Artificial Intelligence for Food and Beverage Analysis; Springer: Berlin/Heidelberg, Germany, 2020; pp. 95–121. [Google Scholar]


| Class ID | Product Category | Type | Brands | Abbreviation | Rice-to-Water Ratio (v/v) | Cooking Time (min) |
|---|---|---|---|---|---|---|
| 1 | White rice (Polished rice) | Khoshihikari a | SunRice | KHO | 1:1 1/2 | 25 |
| 2 | Sushi rice a | SunRice | SRS | 1:1 1/2 | 25 | |
| 3 | Bomba a | La Perla | BMB | 1:2 | 25 | |
| 4 | Calasparra a | Cooperativa del Campo | CLP | 1:2 | 25 | |
| 5 | Arborio b | Woolworths | ARB | 1:2 | 25 | |
| 6 | Calrose b | SunRice | CLS | 1:1 1/2 | 25 | |
| 7 | Long grain c | Woolworths | LGW | 1:1 1/2 | 25 | |
| 8 | Jasmine c | SunRice | JSR | 1:1 1/2 | 25 | |
| 9 | Jasmine-organic c | Macro | JOM | 1:1 1/2 | 25 | |
| 10 | Basmati c | Riviana | BSR | 1:1 1/3 | 25 | |
| 11 | Basmati c | SunRice | BSS | 1:1 1/3 | 25 | |
| 12 | Whole grain rice (Unpolished rice) | Biodynamic rice b | Honest to Goodness | BDM | 1:1 2/3 | 55 |
| 13 | Medium grain b | SunRice | MGB | 1:1 2/3 | 55 | |
| 14 | Medium grain—organic b | Macro | MOB | 1:1 2/3 | 55 | |
| 15 | Doongara c | SunRice | DGR | 1:1 2/3 | 55 | |
| 16 | Black rice c | SunRice | BKR | 1:1 1/2 | 60 | |
| 17 | Wild rice—organic c | Honest to Goodness | WRO | 1:1 1/3 | 60 |
| Sensor Name | Gases |
|---|---|
| MQ3 | Alcohol |
| MQ4 | Methene |
| MQ7 | Carbon monoxide |
| MQ8 | Hydrogen |
| MQ135 | Ammonia, alcohol, benzene |
| MQ136 | Hydrogen sulfide |
| MQ137 | Ammonia |
| MQ138 | Benzene, alcohol, ammonia |
| MG811 | Carbon dioxide |
| Algorithm | Stages | Samples | Accuracy (%) | Error (%) | Performance (MSE) |
|---|---|---|---|---|---|
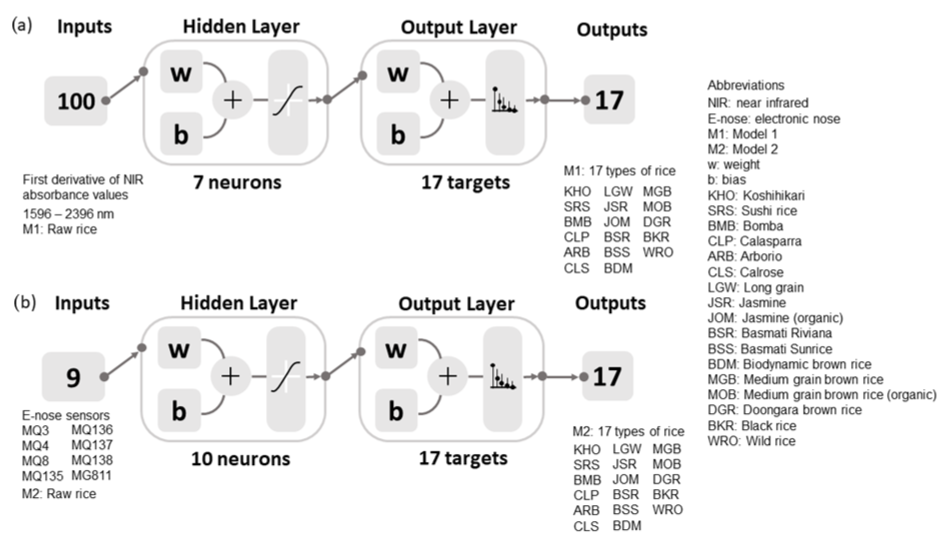
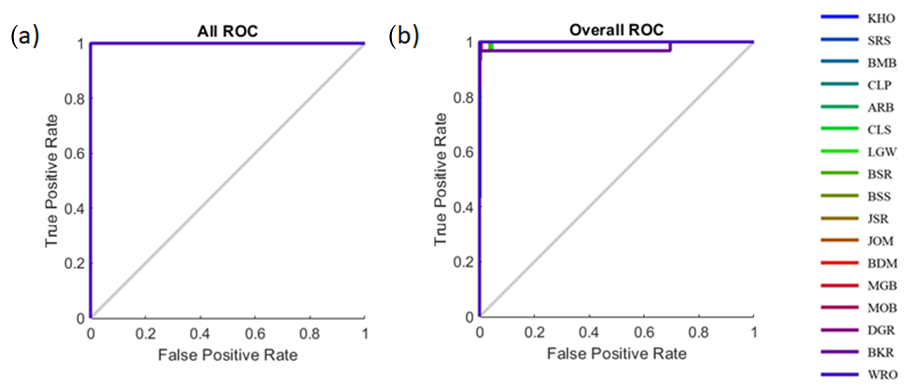
| Model 1 (Inputs: NIR absorbance of raw rice; targets: 17 types of rice) | |||||
| BR 7 neurons | Training | 107 | 100 | 0.0 | <0.001 |
| Testing | 46 | 95.7 | 4.3 | 0.003 | |
| Overall | 153 | 98.7 | 1.3 | − | |
| Model 2 (Inputs: E-nose outputs of raw rice; targets: 17 types of rice) | |||||
| BR 10 neurons | Training | 357 | 100 | 0.0 | <0.001 |
| Testing | 153 | 95.4 | 4.6 | 0.005 | |
| Overall | 510 | 98.6 | 1.4 | − | |
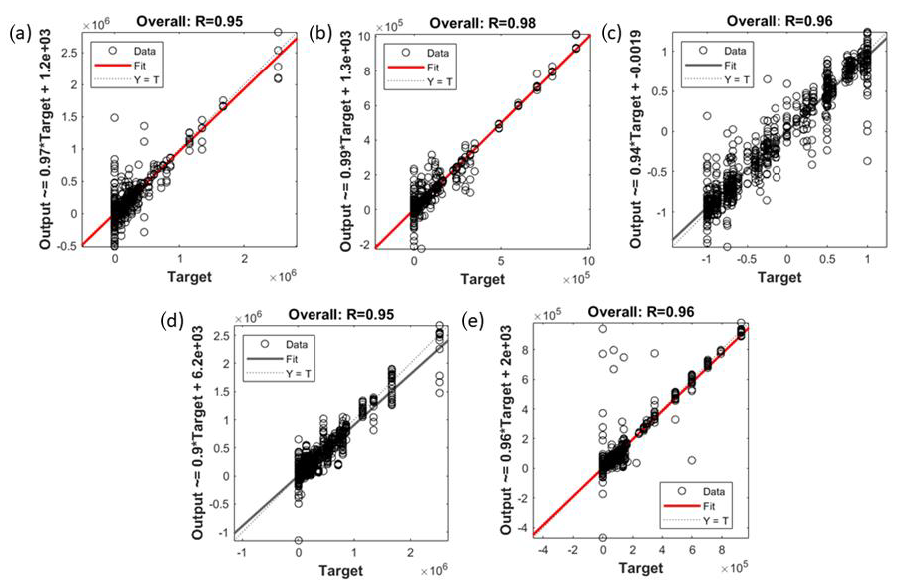
| Algorithm | Stages | Samples | Observations (Samples × Targets) | R | Slope | Performance (MSE) |
|---|---|---|---|---|---|---|
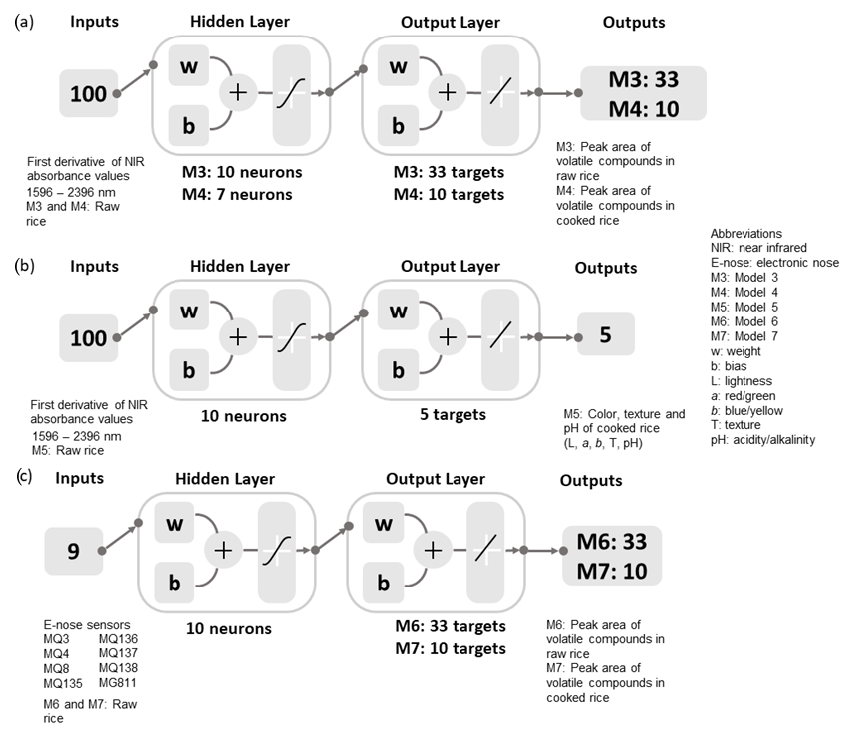
| Model 3 (Inputs: raw rice NIR; targets: raw rice aroma) | ||||||
| BR | Training | 107 | 3531 | 1.00 | 1.00 | 1.47 × 10⁸ |
| 10 neurons | Testing | 46 | 1518 | 0.85 | 0.91 | 1.23 × 10¹⁰ |
| Overall | 153 | 5049 | 0.95 | 0.97 | − | |
| Model 4 (Inputs: raw rice NIR; targets: cooked rice aroma) | ||||||
| BR | Training | 107 | 1070 | 0.99 | 1.00 | 2.22 × 10⁷ |
| 7 neurons | Testing | 46 | 460 | 0.92 | 0.98 | 2.54 × 10⁹ |
| Overall | 153 | 1530 | 0.98 | 0.99 | − | |
| Model 5 (Inputs: raw rice NIR; targets: cooked rice physicochemical quality) | ||||||
| Training | 91 | 455 | 0.99 | 0.98 | 0.01 | |
| CGB | Validation | 31 | 155 | 0.93 | 0.89 | 0.07 |
| 10 neurons | Testing | 31 | 155 | 0.90 | 0.88 | 0.08 |
| Overall | 153 | 765 | 0.96 | 0.94 | − | |
| Model 6 (Inputs: raw rice e-nose; targets: raw rice aroma) | ||||||
| Training | 356 | 11,748 | 0.95 | 0.90 | 3.37 × 10⁹ | |
| LM | Validation | 77 | 2541 | 0.95 | 0.92 | 3.47 × 10⁹ |
| 10 neurons | Testing | 77 | 2541 | 0.93 | 0.87 | 5.15 × 10⁹ |
| Overall | 510 | 16,830 | 0.95 | 0.90 | − | |
| Model 7 (Inputs: raw rice e-nose; targets: cooked rice aroma) | ||||||
| BR | Training | 357 | 3570 | 0.98 | 0.97 | 5.77 × 10⁸ |
| 10 neurons | Testing | 153 | 1530 | 0.92 | 0.95 | 3.43 × 10⁹ |
| Overall | 510 | 5100 | 0.96 | 0.96 | − | |
Publisher’s Note: MDPI stays neutral with regard to jurisdictional claims in published maps and institutional affiliations. |
© 2022 by the authors. Licensee MDPI, Basel, Switzerland. This article is an open access article distributed under the terms and conditions of the Creative Commons Attribution (CC BY) license (https://creativecommons.org/licenses/by/4.0/).
Share and Cite
Aznan, A.; Gonzalez Viejo, C.; Pang, A.; Fuentes, S. Rapid Assessment of Rice Quality Traits Using Low-Cost Digital Technologies. Foods 2022, 11, 1181. https://doi.org/10.3390/foods11091181
Aznan A, Gonzalez Viejo C, Pang A, Fuentes S. Rapid Assessment of Rice Quality Traits Using Low-Cost Digital Technologies. Foods. 2022; 11(9):1181. https://doi.org/10.3390/foods11091181
Chicago/Turabian StyleAznan, Aimi, Claudia Gonzalez Viejo, Alexis Pang, and Sigfredo Fuentes. 2022. "Rapid Assessment of Rice Quality Traits Using Low-Cost Digital Technologies" Foods 11, no. 9: 1181. https://doi.org/10.3390/foods11091181
APA StyleAznan, A., Gonzalez Viejo, C., Pang, A., & Fuentes, S. (2022). Rapid Assessment of Rice Quality Traits Using Low-Cost Digital Technologies. Foods, 11(9), 1181. https://doi.org/10.3390/foods11091181