
Physicochemical Properties and Mouthfeel in Commercial Plant-Based Yogurts


 , ,
, ,
Abstract
:1. Introduction
2. Materials and Methods
2.1. Samples
2.2. pH and Titratable Acidity
2.3. Soluble Solids
2.4. Particle Size Measurement
2.5. Rheological Measurements
2.5.1. Steady Shear Data
2.5.2. Flow Curves
2.5.3. Dynamic Shear Data
2.6. Sensory Analysis
2.7. Data Analysis
3. Results
3.1. Acidity
3.2. Soluble Solids
3.3. Particle Size Measurements


| D1 | D2 | P1 | P2 | P3 | P4 | P5 | |
|---|---|---|---|---|---|---|---|
| d[3.2] + s.d. (µm) | 20 ± 0.2 bc | 21 ± 0.3 b | 15 ± 0.1 e | 36 ± 0.4 a | 20 ± 0.1 c | 14 ± 0.1 f | 19 ± 0.1 d |
| d[4.3] + s.d. (µm) | 27 ± 0.2 d | 28 ± 0.9 c | 24 ± 0.5 e | 48 ± 0.1 b | 30 ± 0.4 c | 22 ± 0.3 f | 68 ± 1.2 a |
| d[0.9] + s.d. (µm) | 47 ± 0.6 e | 52 ± 2.2 cd | 48 ± 1.4 de | 76 ± 0.7 b | 56 ± 0.7 c | 42 ± 0.4 f | 151 ± 3.5 a |
3.4. Rheological Measurements
3.4.1. Steady Shear Data
| D1 | D2 | P1 | P2 | P3 | P4 | P5 | ||||||||
|---|---|---|---|---|---|---|---|---|---|---|---|---|---|---|
| SS10 (Pa s) | 3.92 | ±0.20 b | 4.82 | ±0.17 a | 1.99 | ±0.05 d | 4.20 | ±0.06 b | 4.20 | ±0.03 b | 2.76 | ±0.06 c | 2.50 | ±0.06 c |
| SS50 (Pa s) | 1.53 | ±0.05 b | 1.99 | ±0.11 a | 0.52 | ±0.01 e | 1.55 | ±0.00 b | 1.01 | ±0.01 c | 0.90 | ±0.01 c d | 0.85 | ±0.01 d |
| HL (-) | 57,416.48 | ±1479.05 b | 59,720.44 | ±1242.04 a | 10,937.42 | ±148.72 d | −4647.42 | ±152.23 e | 17,678.42 | ±291.84 c | 11,022.59 | ±177.27 d | 16,278.60 | ±22.35 c |
| n (-) | 0.31 | ±0.01 b | 0.28 | ±0.01 c | 0.15 | ±0.01 d | 0.35 | ±0.00 a | 0.15 | ±0.02 d | 0.31 | ±0.00 b c | 0.36 | ±0.01 a |
| K (Pa s n) | 21.15 | ±1.65 b | 26.00 | ±2.06 a | 14.02 | ±0.28 c | 18.91 | ±0.15 b | 27.94 | ±1.18 a | 13.52 | ±0.08 c d | 10.73 | ±0.09 d |
| ηapp10 (1/s) | 4.35 | ±0.27 b | 4.94 | ±0.29 a | 1.99 | ±0.02 d | 4.27 | ±0.03 b | 3.97 | ±0.02 b | 2.75 | ±0.01 c | 2.45 | ±0.03 c |
| G’LVE (Pa) | 302.00 | ±15.46 b | 380.71 | ±37.11 a | 59.08 | ±3.41 d e | 77.73 | ±1.39 d | 195.05 | ±12.77 c | 16.48 | ±0.92 e | 24.90 | ±2.35 e |
| γLVE (-) | 0.01 | ±0.00 c | 0.01 | ±0.00 c | 0.02 | ±0.00 c | 0.03 | ±0.00 b c | 0.07 | ±0.02 a | 0.06 | ±0.00 a b | 0.06 | ±0.01 a |
| G′ (Pa) | 303.30 | ±14.57 a | 431.60 | ±13.47 b | 61.22 | ±5.45 e | 89.30 | ±1.01 d | 226.15 | ±1.75 c | 17.69 | ±1.58 f | 25.67 | ±1.10 f |
| G″ (Pa) | 74.60 | ±2.52 a | 102.88 | ±0.81 b | 7.21 | ±0.27 d e | 23.13 | ±0.12 d | 14.81 | ±0.06 c | 8.53 | ±0.67 e | 10.51 | ±0.23 e |
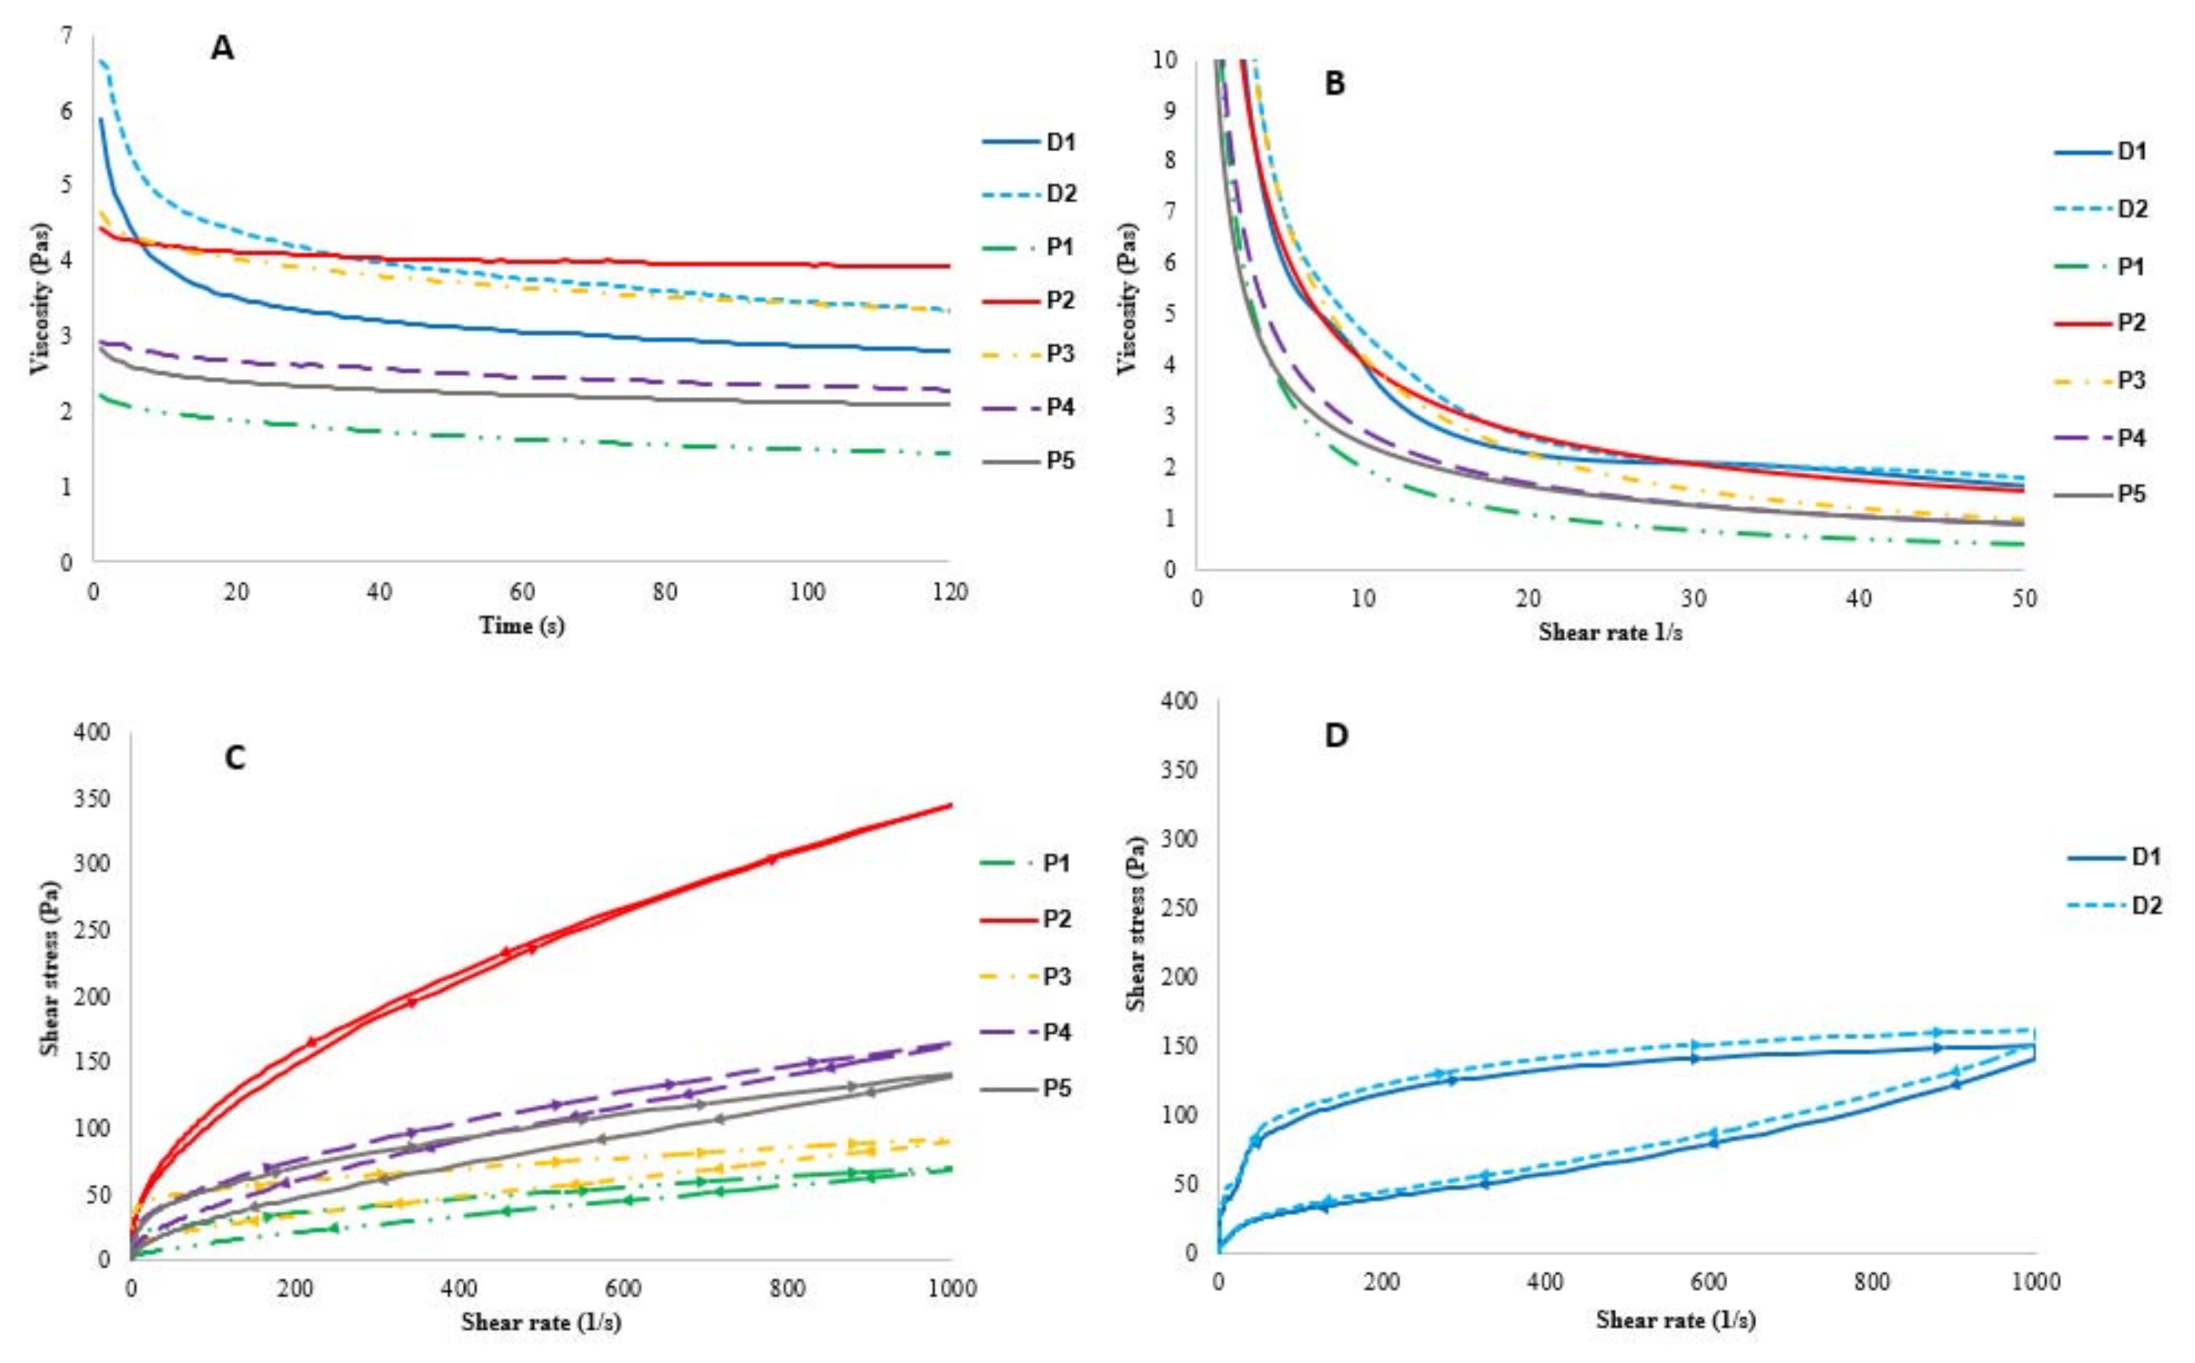
3.4.2. Flow Curves
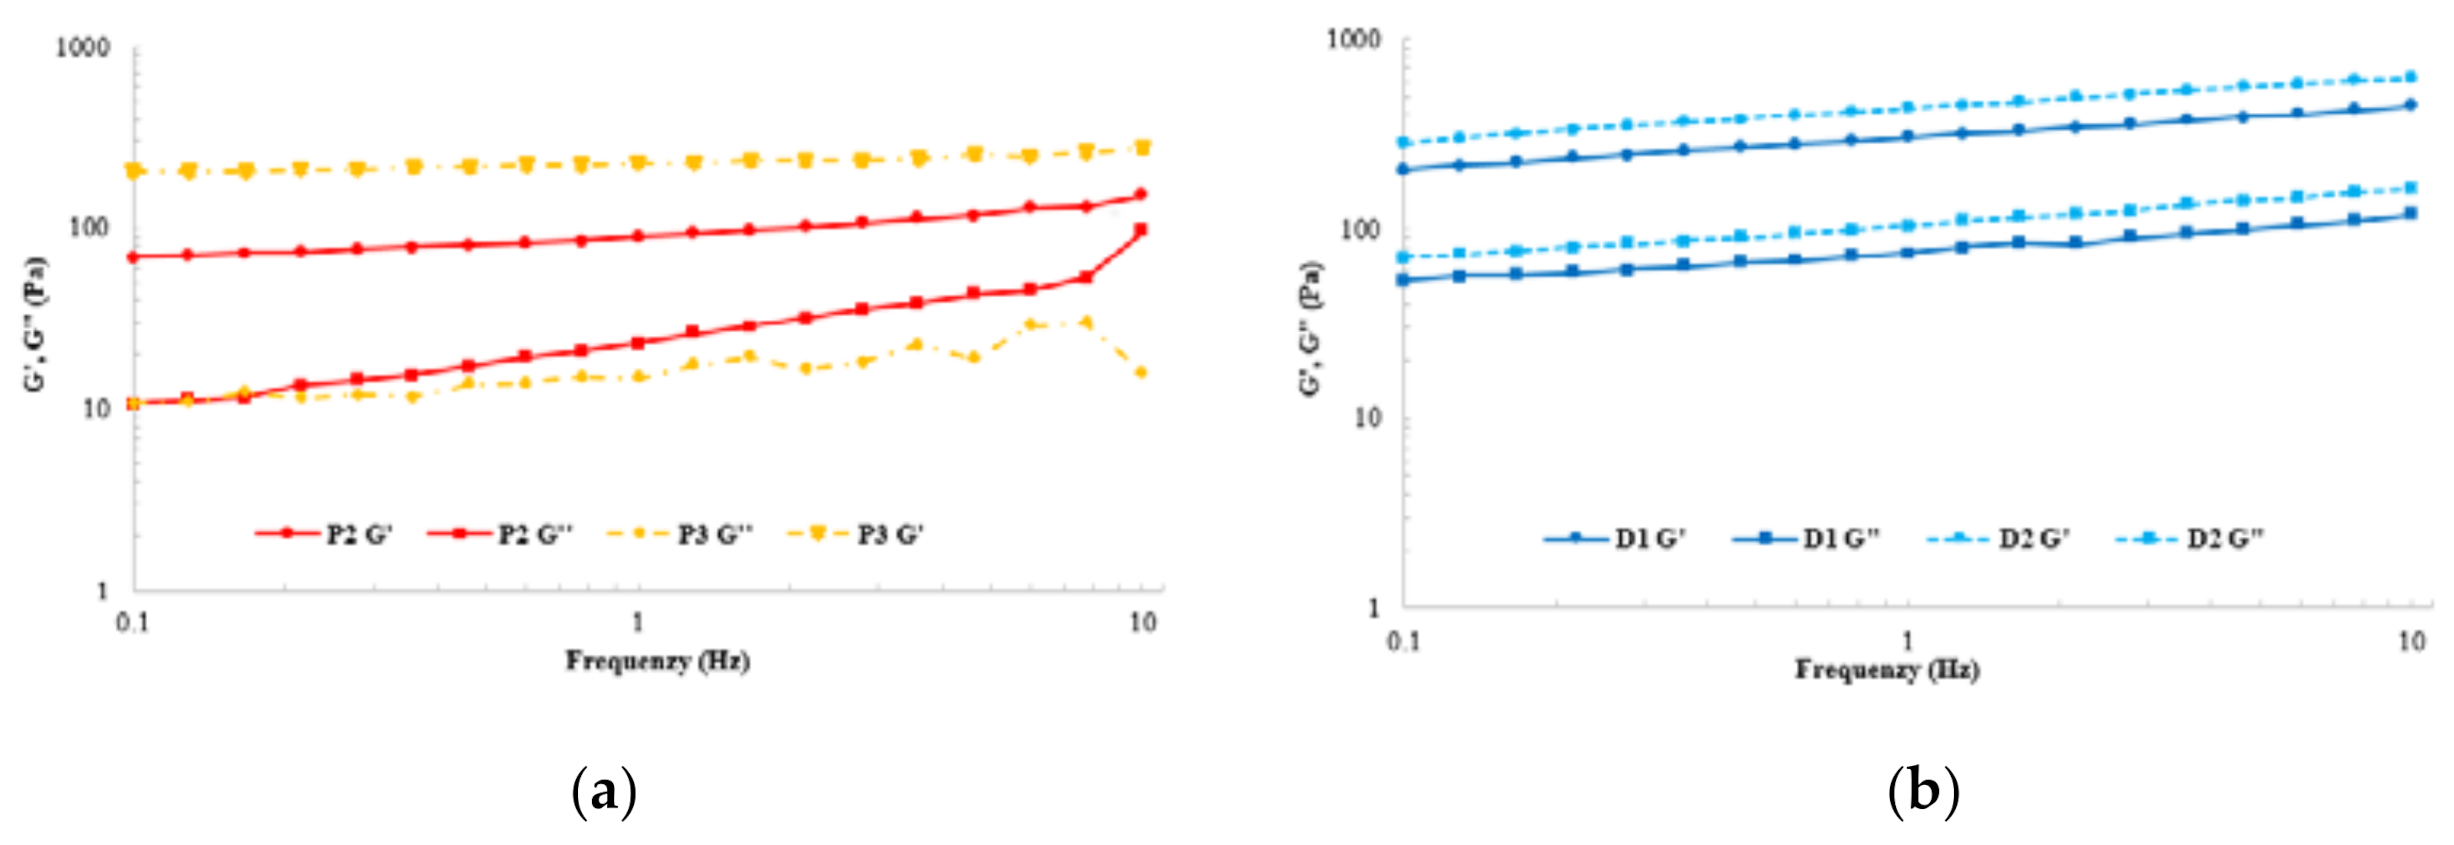
3.4.3. Dynamic Shear Data
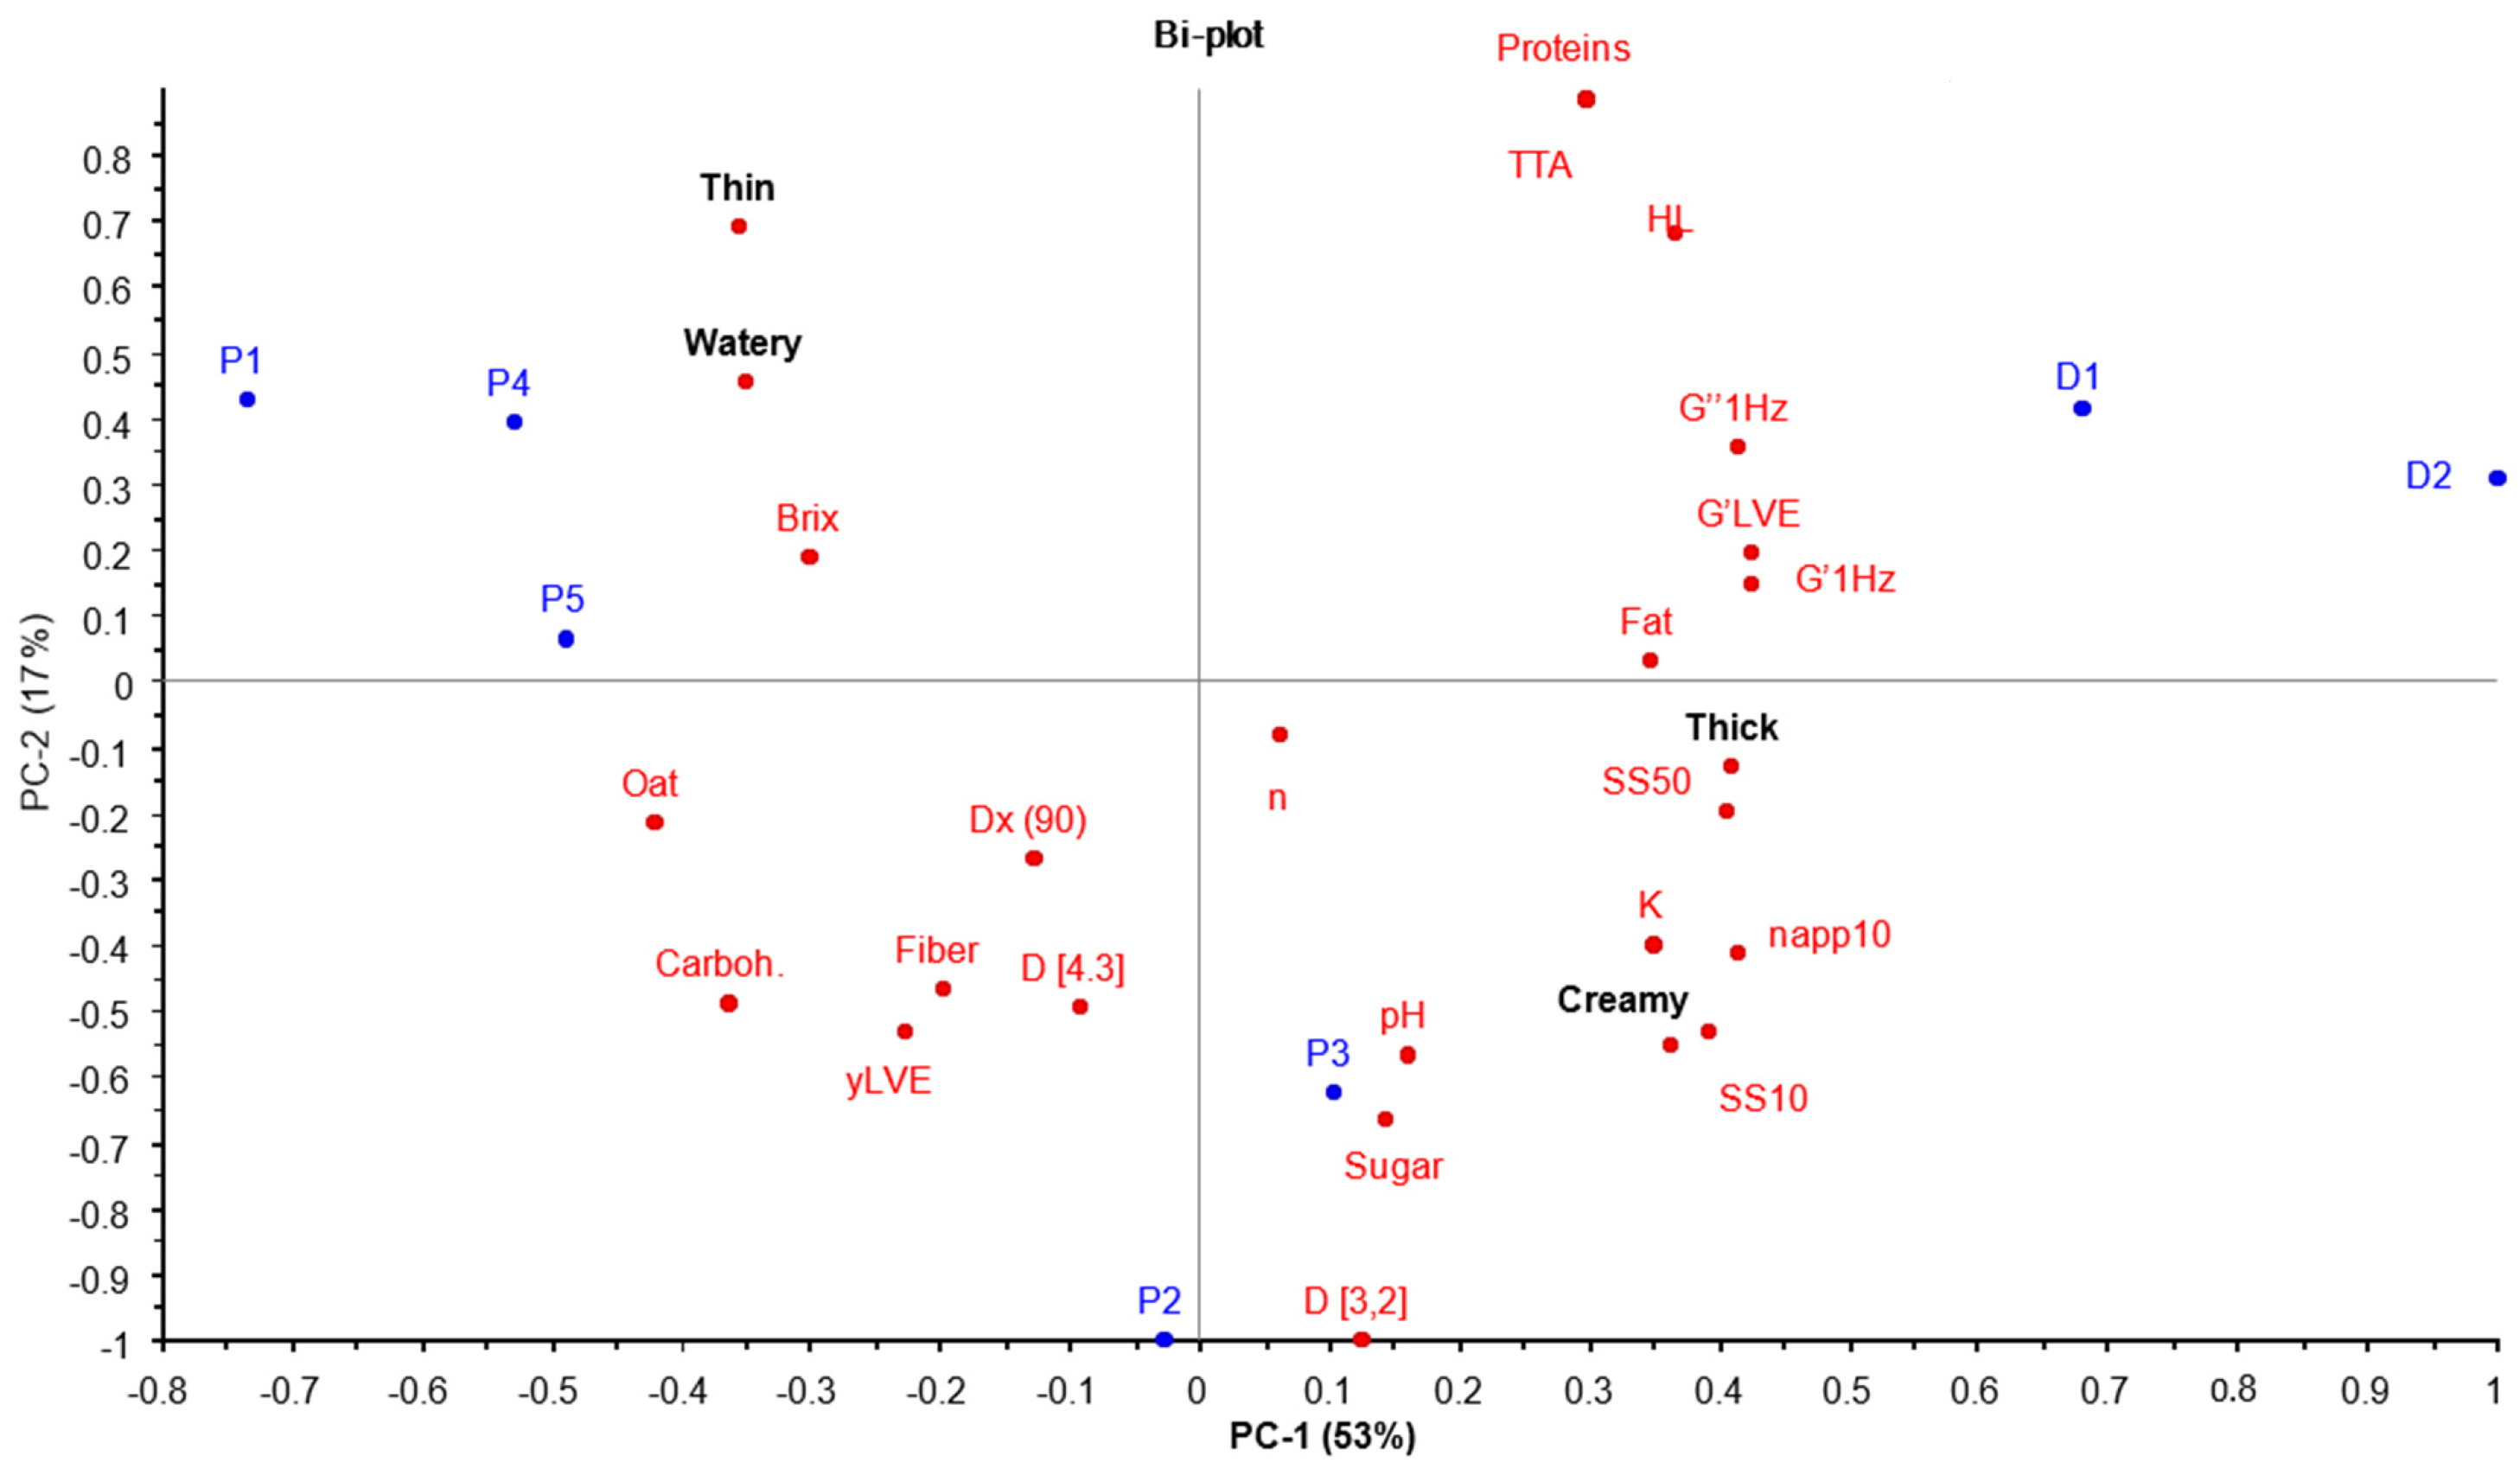
3.5. Physicochemical Differences in Dairy- and Plant-Based Yogurts
3.6. Physicochemical and Mouthfeel Properties among Plant-Based Yogurts
4. Discussion
4.1. Rheological Measurements
4.2. The Physicochemical Dividers between Dairy and Plant-Based Yogurts
4.3. Relationship between Physicochemical and Mouthfeel Properties among Plant-Based Yogurts
5. Conclusions
Limitations and Future Challenges
Author Contributions
Funding
Institutional Review Board Statement
Informed Consent Statement
Data Availability Statement
Acknowledgments
Conflicts of Interest
Appendix A
| Creamy | Thick | Thin | Watery | |
|---|---|---|---|---|
| HL | −0.188 | −0.541 | 0.260 | 0.373 |
| n | 0.295 | 0.572 | −0.219 | −0.466 |
| K | 0.634 | 0.391 | −0.716 | −0.493 |
| ηapp10 | 0.893 * | 0.878 | −0.955 * | −0.884 * |
| SS10 | 0.908 * | 0.846 | −0.966 ** | −0.873 |
| SS50 | 0.813 | 0.964 ** | −0.846 | −0.894 * |
| G’LVE | 0.562 | 0.215 | −0.619 | −0.318 |
| γLVE | 0.582 | 0.396 | −0.527 | −0.557 |
| G′1 Hz | 0.584 | 0.242 | −0.640 | −0.346 |
| G″1 Hz | 0.812 | 0.857 | −0.847 | −0.771 |
| D [3.2] | 0.668 | 0.767 | −0.692 | −0.633 |
| D [4.3] | 0.430 | 0.297 | −0.281 | −0.199 |
| Dx (90) | 0.283 | 0.108 | −0.116 | −0.043 |
| °Brix | −0.684 | −0.272 | 0.646 | 0.418 |
| Fat | 0.153 | 0.205 | −0.314 | −0.228 |
| Carboh. | −0.153 | 0.322 | 0.021 | −0.299 |
| Sugar | 0.272 | 0.181 | −0.376 | −0.128 |
| Fiber | −0.257 | −0.217 | 0.142 | 0.328 |
| Protein | −0.625 | −0.546 | 0.717 | 0.516 |
| Oat | −0.893 * | −0.594 | 0.818 | 0.592 |
| pH | 0.477 | 0.064 | −0.428 | −0.028 |
| TTA | −0.670 | −0.559 | 0.757 | 0.544 |
References
- Banovic, M.; Lähteenmäki, L.; Arvola, A.; Pennanen, K.; Duta, D.E.; Brückner-Gühmann, M.; Grunert, K.G. Foods with Increased Protein Content: A Qualitative Study on European Consumer Preferences and Perceptions. Appetite 2018, 125, 233–243. [Google Scholar] [CrossRef]
- Brückner-Gühmann, M.; Banovic, M.; Drusch, S. Towards an Increased Plant Protein Intake: Rheological Properties, Sensory Perception and Consumer Acceptability of Lactic Acid Fermented, Oat-Based Gels. Food Hydrocoll. 2019, 96, 201–208. [Google Scholar] [CrossRef]
- Ercili-Cura, D.; Miyamoto, A.; Paananen, A.; Yoshii, H.; Poutanen, K.; Partanen, R. Adsorption of Oat Proteins to Air-Water Interface in Relation to Their Colloidal State. Food Hydrocoll. 2015, 44, 183–190. [Google Scholar] [CrossRef]
- Jeske, S.; Zannini, E.; Arendt, E.K. Past, Present and Future: The Strength of Plant-Based Dairy Substitutes Based on Gluten-Free Raw Materials. Food Res. Int. 2018, 110, 42–51. [Google Scholar] [CrossRef] [PubMed]
- Mårtensson, O.; Andersson, C.; Andersson, K.; Öste, R.; Holst, O. Formulation of an Oat-Based Fermented Product and Its Comparison with Yoghurt. J. Sci. Food Agric. 2001, 81, 1314–1321. [Google Scholar] [CrossRef]
- Greis, M.; Sainio, T.; Katina, K.; Kinchla, A.J.; Nolden, A.; Partanen, R.; Seppä, L. Dynamic Texture Perception in Plant-Based Yogurt Alternatives: Identifying Temporal Drivers of Liking by TDS. Food Qual. Pref. 2020, 86, 104019. [Google Scholar] [CrossRef]
- Cutler, A.N.; Morris, E.R.; Taylor, L.J. Oral perception of viscosity in fluid foods and model systems. J. Texture Stud. 1983, 14, 377–395. [Google Scholar] [CrossRef]
- De Wijk, R.A.; van Gemert, L.J.; Terpstra, M.E.J.; Wilkinson, C.L. Texture of Semi-Solids; Sensory and Instrumental Measurements on Vanilla Custard Desserts. Food Qual. Pref. 2003, 14, 305–317. [Google Scholar] [CrossRef]
- Harte, F.; Clark, S.; Barbosa-Cánovas, G.V. Yield Stress for Initial Firmness Determination on Yogurt. J. Food Eng. 2007, 80, 990–995. [Google Scholar] [CrossRef]
- Janhøj, T.; Petersen, C.B.; Frøst, M.B.; Ipsen, R. Sensory and Rheological Characterization of Low-Fat Stirred Yogurt. J. Texture Stud. 2006, 37, 276–299. [Google Scholar] [CrossRef]
- Janssen, A.M.; Terpstra, M.E.J.; de Wijk, R.A.; Prinz, J.F. Relations between Rheological Properties, Saliva-Induced Structure Breakdown and Sensory Texture Attributes of Custards. J. Texture Stud. 2007, 38, 42–69. [Google Scholar] [CrossRef]
- Jørgensen, C.E.; Abrahamsen, R.K.; Rukke, E.O.; Johansen, A.G.; Schüller, R.B.; Skeie, S.B. Improving the Structure and Rheology of High Protein, Low Fat Yoghurt with Undenatured Whey Proteins. Int. Dairy J. 2015, 47, 6–18. [Google Scholar] [CrossRef]
- Nguyen, P.T.M.; Kravchuk, O.; Bhandari, B.; Prakash, S. Effect of Different Hydrocolloids on Texture, Rheology, Tribology and Sensory Perception of Texture and Mouthfeel of Low-Fat Pot-Set Yoghurt. Food Hydrocoll. 2017, 72, 90–104. [Google Scholar] [CrossRef] [Green Version]
- Sonne, A.; Busch-Stockfisch, M.; Weiss, J.; Hinrichs, J. Improved Mapping of In-Mouth Creaminess of Semi-Solid Dairy Products by Combining Rheology, Particle Size, and Tribology Data. LWT Food Sci. Technol. 2014, 59, 342–347. [Google Scholar] [CrossRef]
- Kilcast, D.; Clegg, S. Sensory Perception of Creaminess and Its Relationship with Food Structure. Food Qual. Pref. 2002, 13, 609–623. [Google Scholar] [CrossRef]
- Krzeminski, A.; Tomaschunas, M.; Köhn, E.; Busch-Stockfisch, M.; Weiss, J.; Hinrichs, J. Relating Creamy Perception of Whey Protein Enriched Yogurt Systems to Instrumental Data by Means of Multivariate Data Analysis. J. Food Sci. 2013, 78, S314–S319. [Google Scholar] [CrossRef]
- Laiho, S.; Williams, R.P.W.; Poelman, A.; Appelqvist, I.; Logan, A. Effect of Whey Protein Phase Volume on the Tribology, Rheology and Sensory Properties of Fat-Free Stirred Yoghurts. Food Hydrocoll. 2017, 67, 166–177. [Google Scholar] [CrossRef]
- Lett, A.M.; Yeomans, M.R.; Norton, I.T.; Norton, J.E. Enhancing Expected Food Intake Behaviour, Hedonics and Sensory Characteristics of Oil-in-Water Emulsion Systems through Microstructural Properties, Oil Droplet Size and Flavour. Food Qual. Pref. 2016, 47, 148–155. [Google Scholar] [CrossRef]
- Sodini, I.; Remeuf, F.; Haddad, C.; Corrieu, G. The Relative Effect of Milk Base, Starter, and Process on Yogurt Texture: A Review. Crit. Rev. Food Sci. Nutr. 2004, 44, 113–137. [Google Scholar] [CrossRef]
- Sala, G.; de Wijk, R.A.; van de Velde, F.; van Aken, G.A. Matrix Properties Affect the Sensory Perception of Emulsion-Filled Gels. Food Hydrocoll. 2008, 22, 353–363. [Google Scholar] [CrossRef]
- Grasso, N.; Alonso-Miravalles, L.; O’Mahony, J.A. Composition, Physicochemical and Sensorial Properties of Commercial Plant-Based Yogurts. Foods 2020, 9, 252. [Google Scholar] [CrossRef] [Green Version]
- Gupta, M.K.; Torrico, D.D.; Ong, L.; Gras, S.L.; Dunshea, F.R.; Cottrell, J.J. Plant and Dairy-Based Yogurts: A Comparison of Consumer Sensory Acceptability Linked to Textural Analysis. Foods 2022, 11, 463. [Google Scholar] [CrossRef]
- Wang, Y.; Sorvali, P.; Laitila, A.; Maina, N.H.; Coda, R.; Katina, K. Dextran Produced in Situ as a Tool to Improve the Quality of Wheat-Faba Bean Composite Bread. Food Hydrocoll. 2018, 84, 396–405. [Google Scholar] [CrossRef] [Green Version]
- Cayot, P.; Schenker, F.; Houzé, G.; Sulmont-Rossé, C.; Colas, B. Creaminess in Relation to Consistency and Particle Size in Stirred Fat-Free Yogurt. Int. Dairy J. 2008, 18, 303–311. [Google Scholar] [CrossRef]
- De Wijk, R.A.; Prinz, J.F.; Janssen, A.M. Explaining Perceived Oral Texture of Starch-Based Custard Desserts from Standard and Novel Instrumental Tests. Food Hydrocoll. 2006, 20, 24–34. [Google Scholar] [CrossRef]
- Krzeminski, A.; Großhable, K.; Hinrichs, J. Structural Properties of Stirred Yoghurt as Influenced by Whey Proteins. LWT Food Sci. Technol. 2011, 44, 2134–2140. [Google Scholar] [CrossRef]
- Shama, F.; Sherman, P. Identification of stimuli controlling the sensory evaluation of viscosity II. Oral Methods. J. Texture Stud. 1973, 4, 111–118. [Google Scholar] [CrossRef]
- Schlich, P. Temporal Dominance of Sensations (TDS): A New Deal for Temporal Sensory Analysis. Curr. Opin. Food Sci. 2017, 15, 38–42. [Google Scholar] [CrossRef]
- Abdi, H. Partial Least Square Regression PLS-Regression. Encyclopedia of Measurement and Statistics; SAGE Publications, Inc.: Thousand Oaks, CA, USA, 2007. [Google Scholar]
- Lee, W.J.; Lucey, J.A. Formation and Physical Properties of Yogurt. Asian-Australas. J. Anim. Sci. 2010, 23, 1127–1136. [Google Scholar] [CrossRef]
- Sikora, M.; Kowalski, S.; Tomasik, P. Binary Hydrocolloids from Starches and Xanthan Gum. Food Hydrocoll. 2008, 22, 943–952. [Google Scholar] [CrossRef]
- Carriere, C.J.; Inglett, G.E. Nonlinear Viscoelastic Solution Properties of Oat-Based β-Glucan/Amylodextrin Blends. Carbohydr. Polym. 1999, 40, 9–16. [Google Scholar] [CrossRef]
- Bozzi, L.; Milas, M.; Rinaudo, M. Solution and Gel Rheology of a New Polysaccharide Excreted by the Bacterium Alteromonas Sp. Strain 1644. Int. J. Biol. Macromol. 1996, 18, 83–91. [Google Scholar] [CrossRef] [PubMed]
- Renard, D.; Lefebvre, J. Gelation of Globular Proteins: Effect of PH and Ionic Strength on the Critical Concentration for Gel Formation. A Simple Model and Its Application to β-Lactoglobulin Heat-Induced Gelation. Int. J. Biol. Macromol. 1992, 14, 287–291. [Google Scholar] [CrossRef] [PubMed]
- Akhtar, M.; Stenzel, J.; Murray, B.S.; Dickinson, E. Factors Affecting the Perception of Creaminess of Oil-in-Water Emulsions. Food Hydrocoll. 2005, 19, 521–526. [Google Scholar] [CrossRef]
- Dickinson, E. On the Road to Understanding and Control of Creaminess Perception in Food Colloids. Food Hydrocoll. 2018, 77, 372–385. [Google Scholar] [CrossRef]
- Stanley, N.L.; Taylor, L.J. Rheological Basis of Oral Characteristics of Fluid and Semi-Solid Foods: A Review. Acta Psychol. 1993, 84, 79–92. [Google Scholar] [CrossRef]
- Mosca, A.C.; Rocha, J.A.; Sala, G.; van de Velde, F.; Stieger, M. Inhomogeneous Distribution of Fat Enhances the Perception of Fat-Related Sensory Attributes in Gelled Foods. Food Hydrocoll. 2012, 27, 448–455. [Google Scholar] [CrossRef]
- Tomaschunas, M.; Hinrichs, J.; Köhn, E.; Busch-Stockfisch, M. Effects of Casein-to-Whey Protein Ratio, Fat and Protein Content on Sensory Properties of Stirred Yoghurt. Int. Dairy J. 2012, 26, 31–35. [Google Scholar] [CrossRef]
- Vingerhoeds, M.H.; de Wijk, R.A.; Zoet, F.D.; Nixdorf, R.R.; van Aken, G.A. How Emulsion Composition and Structure Affect Sensory Perception of Low-Viscosity Model Emulsions. Food Hydrocoll. 2008, 22, 631–646. [Google Scholar] [CrossRef]
- Dresselhuis, D.M.; de Hoog, E.H.A.; Cohen Stuart, M.A.; Vingerhoeds, M.H.; van Aken, G.A. The Occurrence of In-Mouth Coalescence of Emulsion Droplets in Relation to Perception of Fat. Food Hydrocoll. 2008, 22, 1170–1183. [Google Scholar] [CrossRef]
- van Aken, G.A.; Vingerhoeds, M.H.; de Wijk, R.A. Textural Perception of Liquid Emulsions: Role of Oil Content, Oil Viscosity and Emulsion Viscosity. Food Hydrocoll. 2011, 25, 789–796. [Google Scholar] [CrossRef]
- Morell, P.; Hernando, I.; Llorca, E.; Fiszman, S. Yogurts with an increased protein content and physically modified starch: Rheological, structural, oral digestion and sensory properties related to enhanced satiating capacity. Food Res. Int. 2015, 70, 64–73. [Google Scholar] [CrossRef]
- De Wijk, R.A.; Prinz, J.F.; Engelen, L.; Weenen, H. The Role of α-Amylase in the Perception of Oral Texture and Flavour in Custards. Physiol. Behav. 2004, 83, 81–91. [Google Scholar] [CrossRef]
- Devezeaux de Lavergne, M.; van Delft, M.; van de Velde, F.; van Boekel, M.A.J.S.; Stieger, M. Dynamic Texture Perception and Oral Processing of Semi-Solid Food Gels: Part 1: Comparison between QDA, Progressive Profiling and TDS. Food Hydrocoll. 2015, 43, 207–217. [Google Scholar] [CrossRef]

| Base | Thickener | Stabilizer or Preservative | Oil (g/100 mL) | |
|---|---|---|---|---|
| D1 | Dairy | None | None | Milk fat (2.5) |
| D2 | Dairy | None | None | Milk fat (4) |
| P1 | Oat base (water, oat 12%), potato protein | Potato starch | Calcium carbonate (E170), Tricalcium phosphate (E341) | Rapeseed oil (2.2) |
| P2 | Oat base (water, oat 8.5%) | Modified starch, pectin | Potassium sorbate (E202) | Canola oil (2.4) |
| P3 | Oat base (water, oat flakes 8%) | Starch (corn, potato), pectin | Tricalcium phosphate (E341) | Canola oil (2.5) |
| P4 | Water, oat 12%, and potato protein | Starch (tapioca, potato), xanthan, and locust bean gum | None | Canola oil (0.8) |
| P5 | Oat base (water, oat 8.2%), pea protein | Modified potato starch | None | Canola oil (0.9) |
| Type of Measurement | Explanation | Codes |
|---|---|---|
| Large deformation test: | η at 10 s−¹ at t = 10 s. | SS10 |
| Steady shear rate (SS) | η at 50 s−¹ at 10 s. | SS50 |
| The area of the hysteresis loop between the upward and downward curves | HL | |
| Large deformation test: Flow curves (FCs) | Shear thinning index, n, and consistency, K, were calculated from the power law (η = K*ẏn¹) from the upward flow curve | n, K |
| Apparent viscosities (ηapp) from upward flow curve (Pa·s) calculated from Ostwald-de Waele = Kẏ^(n−¹) at shear rates 1.5, 5, 10, 25, and 50 (1/s) | ηapp10 | |
| Small deformation test: | Stress (G′) at the end point of LVER | G’LVE |
| Dynamic strain sweeps (DSSs) | Strain (γ) at the end point of LVER | γLVE |
| Small deformation test: | G′ at 1 Hz, Pa (DFS G′1 Hz) | G′ |
| Dynamic frequency sweep (DFS) | G″ at 1 Hz, Pa (DFS G″1 Hz) | G″ |
| Particle size | Surface weighted particle size | d[3.2] |
| Volume weighted particle size | d[4.3] | |
| 90th percentile of the particles less than d[0.9] | d[0.9] | |
| Chemical composition | Fat content | Fat |
| Carbohydrate content | Carboh. | |
| Sugar content | Sugar | |
| Fiber content | Fiber | |
| Protein content | Proteins | |
| Oat content | Oat | |
| Soluble solids | °Brix | °Brix |
| Acidity | pH | pH |
| Total titratable acidity | TTA |
| pH | TTA | |||
|---|---|---|---|---|
| Instrumental Analysis ± STD | ±Sensory Analysis | Instrumental Analysis ± STD | ±Sensory Analysis | |
| D1 | 4.27 ± 0.12 bc | −0.06 | 10.83 ± 0.09 a | −0.18 |
| D2 | 4.18 ± 0.12 bc | −0.12 | 10.86 ± 0.10 a | 0.22 |
| P1 | 4.16 ± 0.08 c | 0.01 | 4.43 ± 0.14 c | −0.09 |
| P2 | 4.26 ± 0.10 b | −0.07 | 2.00 ± 0.08 d | −0.05 |
| P3 | 4.43 ± 0.11 a | −0.17 | 2.18 ± 0.16 d | 0.14 |
| P4 | 3.47 ± 0.12 d | 0.06 | 5.36 ± 0.45 b | 0.23 |
| P5 | 4.26 ± 0.11 bc | −0.08 | 5.54 ± 0.33 b | 0.21 |
Publisher’s Note: MDPI stays neutral with regard to jurisdictional claims in published maps and institutional affiliations. |
© 2022 by the authors. Licensee MDPI, Basel, Switzerland. This article is an open access article distributed under the terms and conditions of the Creative Commons Attribution (CC BY) license (https://creativecommons.org/licenses/by/4.0/).
Share and Cite
Greis, M.; Sainio, T.; Katina, K.; Nolden, A.A.; Kinchla, A.J.; Seppä, L.; Partanen, R. Physicochemical Properties and Mouthfeel in Commercial Plant-Based Yogurts. Foods 2022, 11, 941. https://doi.org/10.3390/foods11070941
Greis M, Sainio T, Katina K, Nolden AA, Kinchla AJ, Seppä L, Partanen R. Physicochemical Properties and Mouthfeel in Commercial Plant-Based Yogurts. Foods. 2022; 11(7):941. https://doi.org/10.3390/foods11070941
Chicago/Turabian StyleGreis, Maija, Taru Sainio, Kati Katina, Alissa A. Nolden, Amanda J. Kinchla, Laila Seppä, and Riitta Partanen. 2022. "Physicochemical Properties and Mouthfeel in Commercial Plant-Based Yogurts" Foods 11, no. 7: 941. https://doi.org/10.3390/foods11070941
APA StyleGreis, M., Sainio, T., Katina, K., Nolden, A. A., Kinchla, A. J., Seppä, L., & Partanen, R. (2022). Physicochemical Properties and Mouthfeel in Commercial Plant-Based Yogurts. Foods, 11(7), 941. https://doi.org/10.3390/foods11070941