Article

Sensomics-Assisted Aroma Decoding of Pea Protein Isolates (Pisum sativum L.)

1
Chair of Food Chemistry and Molecular Sensory Science, TUM School of Life Sciences, Technical University of Munich, Lise-Meitner-Straße 34, 85354 Freising, Germany
2
Leibniz-Institute for Food Systems Biology at the Technical University of Munich, Lise-Meitner-Straße 34, 85354 Freising, Germany
3
Chair of Food and Bioprocess Engineering, TUM School of Life Sciences, Technical University of Munich, Weihenstephaner Berg 1, 85354 Freising, Germany
*
Author to whom correspondence should be addressed.
Foods 2022, 11(3), 412; https://doi.org/10.3390/foods11030412
Submission received: 10 January 2022 / Revised: 20 January 2022 / Accepted: 27 January 2022 / Published: 30 January 2022
(This article belongs to the Topic Future Food Analysis and Detection)

Abstract

:
The aroma of pea protein (Pisum sativum L.) was decrypted for knowledge-based flavor optimization of new food products containing pea protein. Sensomics helped to determine several volatiles via ultra-high performance liquid chromatography tandem mass spectrometry and 3-nitrophenylhydrazine derivatization. Among the investigated volatiles, representatives of aldehydes, ketones, and acids were reported in literature as especially important in pea and pea-related matrices. After validation of the method and quantitation of the corresponding analytes, sensory reconstitution as well as omission studies of a selected pea protein were performed and revealed nine odor-active compounds as key food odorants (3-methylbutanal, hexanal, acetaldehyde, (E,E)-2,4-nonadienal, (E)-2-octenal, benzaldehyde, heptanal, 2-methylbutanal, and nonanoic acid). Interestingly, eight out of nine compounds belonged to the chemical class of aldehydes. Statistical heatmap and cluster analysis of all odor activity values of different pea proteins confirmed the obtained sensory results and generalize these nine key food odorants in other pea proteins. The knowledge of key components gained shows potential for simplifying industrial flavor optimization of pea protein-based food.

1. Introduction

In the last several years, an increasing market for alternative foods based on plant ingredients such as pea, soy, oat, or hemp can be observed. While in 2018, the German sales for plant-based dairy substitutes were about €316 million, that number soared by 70% to a total revenue of €536 million in 2020 [1]. Furthermore, in the first quarter of 2020, the production of vegetarian or vegan meat substitutes increased by 37% compared to the previous quarter [2]. Even though these plant-based alternatives are more expensive compared to their original analogs, this does not prevent consumers from buying. This can be explained by an increasing tendency towards sustainability and animal welfare, e.g., as highlighted by a 2020 consumer barometer, saying that 69% of consumers are more willing to pay a higher price for food with sustainable origin [3]. As this current trend apparently results in good business and plant-based proteins while simultaneously showing a better footprint [4], it is indeed linked not only to start-ups but also to well-established companies concentrating their attention and their R&D on this highly topical issue.
Nevertheless, these new foods often suffer from off-flavors introduced by the plant-based ingredients. Aroma perception especially gets distorted by grassy, green, and bean-like changes, as it could be, e.g., shown for different functional milk desserts loaded with microparticulated pea protein as a fat replacer [5]. As Europe offers a large market for pea protein (the second largest in 2016, with 33%) [6], and global rising sales to $285 million through 2026 (compound annual growth rate of 2020–2026: 12%) are predicted [7], the focus of this study is dedicated to pea protein (Pisum sativum L.) and its characteristic flavor.
Driven by the aim to lose the distracting pea off-flavor, aroma and taste compositions have been investigated. Activity-guided fractionation in combination with taste dilution experiments could already reveal and explain bitter off-taste in pea protein isolates caused by different lipids and lipid oxidation products [8]. While hexanal and 3-methylbutanoic acid have been unequivocally identified as key food odorants (KFO) in raw peas [9], other aroma-active compounds such as methional, 2-undecanone, (E)-2-octenal, (E,E)-3,5-octadien-2-one, (E,E)-2,4-decadienal, or phenylacetaldehyde seem to play a crucial role in pea proteins [10,11]. Nevertheless, a confirmative molecular-sensory aroma reconstitution of pea protein has been missing so far.
Over the last years, the Sensomics concept was successfully adopted to identify many KFO in different food matrices, such as in Chinese green tea [12], in Styrian pumpkin seed oil [13], or in raw licorice [14], for instance. By applying the recently described “unified flavor quantitation”, we could advantageously supplement the Sensomics approach by a fast sample preparation, easy handling, and quick UHPLC-MS/MS measurements [15]. In addition, a recently published UHPLC-MS/MS method was also added to cover an increased variety of different odor-active sensometabolites in pea proteins [16].
Commonly reported odorants, identified by GC-O analyses in differently processed pea [9,17], pea proteins [10,11,18], and lupin flours [19], chosen because of their close biological affinity, were also included for targeted quantitation via accurate stable isotope dilution analysis. Therefore, the objective of the present investigation was to decode the aroma of a widely-used pea protein (Pisum sativum L.) within Europe, namely Nutralys® S85F, by identifying KFO and providing the received knowledge for further flavor optimization, such as downregulation steps. Odor activity calculations followed by sensory reconstitution and omission experiments were performed to achieve an authentic aroma recombinant, as well as to highlight KFO in pea protein (Pisum sativum L.) for the first time ever.

2. Materials and Methods

2.1. Chemicals

The following compounds were commercially obtained from Sigma-Aldrich (Steinheim, Germany): 3-nitrophenylhydrazine hydrochloride (3-NPH), pyridine, N-(3-(dimethylamino)-propyl)-N′-ethylcarbodiimide hydrochloride (EDC), formic acid, triacetin, 3-methylbutanal, hexanal, (E)-2-octenal, (E,E)-2,4-nonadienal, (E,Z)-2,6-nonadienal, (E,E)-2,4-decadienal, (E)-2-undecenal, (E)-2-dodecenal, 2-undecanone, heptanoic acid, phenylacetaldehyde, 4-ethylbenzaldehyde, 4-hydroxy-3-methoxybenzaldehyde (vanillin), γ-octalactone, 2,3-dimethylpyrazine, 2,5-dimethylpyrazine, 2,3,5-trimethylpyrazine, 2-ethylpyrazine, 2-ethyl-5(6)-methylpyrazine, 2-isobutyl-3-methoxypyrazine, 3-isopropyl-2-methoxypyrazine, hexanal-d12, hexanoic acid-d3, and phenylacetic acid-13C2. Additionally, 2-methylbutanal was purchased from Alfa Aesar (Lancaster, UK), heptanal from Tokyo Chemcial Industry (Tokyo, Japan), 3-(methylthio)propanal (methional), hexanoic acid, and 2,6-dimethylpyrazine were obtained from Merck KGaA (Darmstadt, Germany), 2,3-octanedione and (E,E)-3,5-octadien-2-one from aromaLAB (Planegg, Germany), and 3-methylbutanal-d2 and diacetyl-d6 from CDN Isotopes (Pointe-Claire, QC, Canada). Decanal-d2 [20], vanillin-d3 [21], and γ-nonalactone-d2 [22] were synthesized by the Leibniz Institute for Food Systems Biology at the Technical University of Munich. Acetonitrile used for UHPLC-MS/MS analysis was of LC-MS grade (Honeywell, Seelze, Germany). Water for sample preparation and chromatography was purified using a B30 Integrity ultra-pure water system (AQUA LAB GmbH & Co. KG, Ransbach-Baumbach, Germany).

2.2. Pea Protein Isolates

The following pea proteins (Table 1) were provided by our partners from the Industrial Collective Research (IGF) branch of the FEI project under grant number AiF 20197 N and analyzed with the developed methods. All samples were stored in the dark at 4 °C.

2.3. Protein Content (PC)

Protein contents were determined using the Dumas method with the Vario MAX cube (Elementar Analysensysteme GmbH, Langenselbold, Germany) by the Chair of Food and Bioprocess Engineering at the Technical University of Munich. As proposed for pea proteins, a factor of 5.4 was used for conversion of nitrogen content into protein content [23].

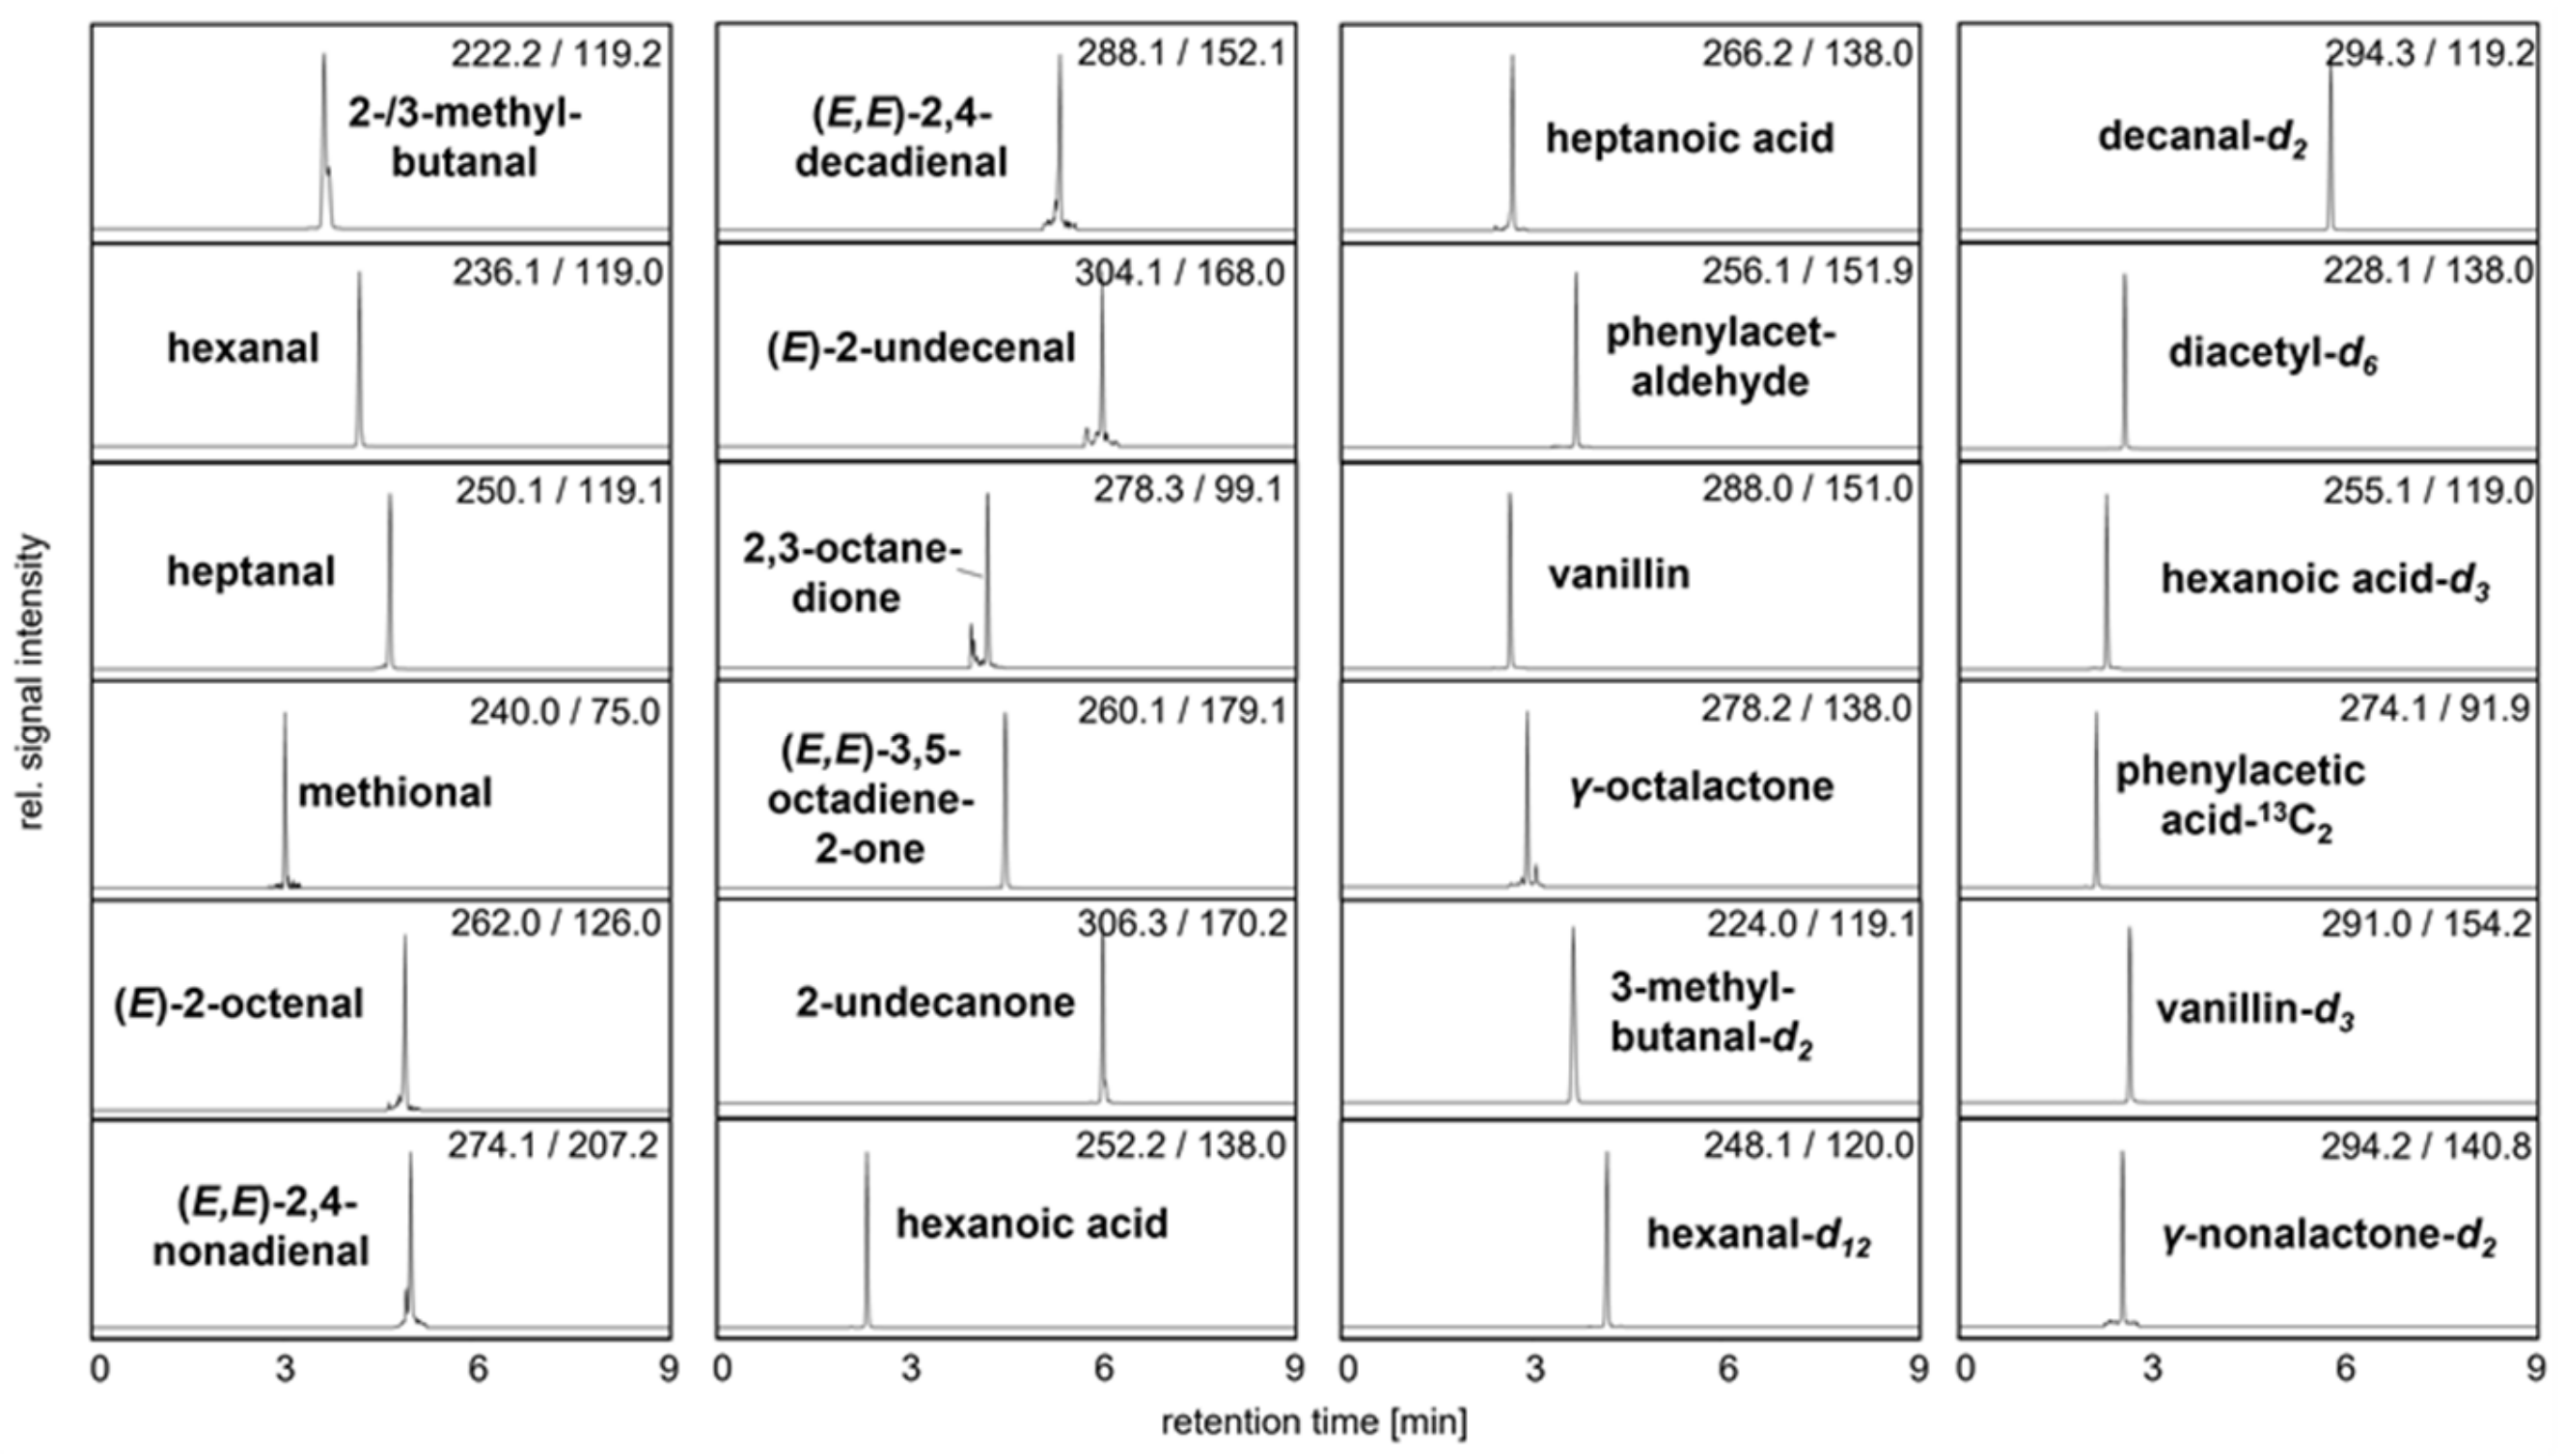
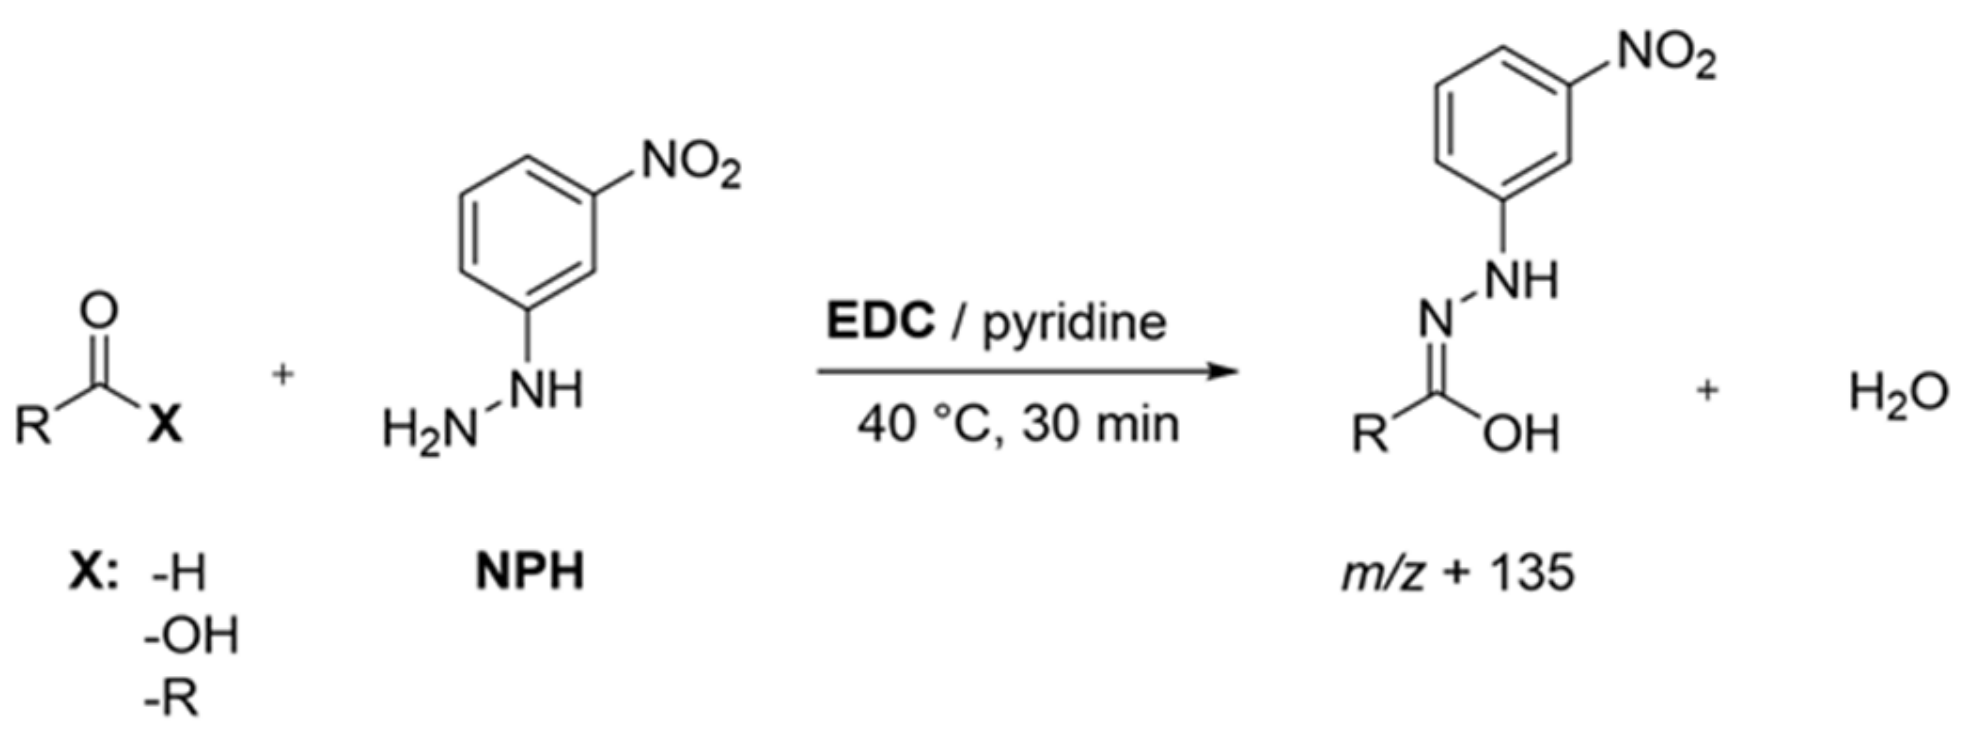
2.4. Identification and Quantitation of Odor-Active Acids, Aldehydes, Ketones, and Pyrazines

Internal Standard (IS) solution: First, 3-methylbutanal-d2 (22.0 µg/mL), hexanal-d12 (1.3 µg/mL), decanal-d2 (23.3 µg/mL), diacetyl-d6 (19.9 µg/mL), hexanoic acid-d3 (5.5 µg/mL), phenylacetic acid-13C2 (2.7 µg/mL), vanillin-d3 (1.8 µg/mL), and γ-nonalactone-d2 (15.5 µg/mL) were prepared in acetonitrile/water (50:50, v/v) and used as an IS mixture for quantitation.
Sample Preparation: Following literature protocols, with slight modifications to analyze short and branched fatty acids [24] as well as aldehydes, ketones, and organic acids [15,16], protein isolates (40 mg) were first suspended in a mixture of acetonitrile/water (960 µL, 50:50, v/v), spiked with the IS solution (20 µL), and equilibrated overnight at room temperature under continuous shaking. After at least 20 h, the suspensions were mixed with a solution (20 µL, 200 mmol/L) of 3-NPH in acetonitrile/water (50:50, v/v) and a solution (20 µL, 120 mmol/L) of EDC in acetonitrile/water (50:50, v/v) containing 6% pyridine and derivatized for 30 min at 40 °C (Figure 1). A membrane-filtered (Minisart RC 15, 0.45 µm, Sartorius AG, Göttingen, Germany) aliquot (1 µL) was then analyzed via UHPLC-MS/MS (MRM transitions see Table S1).
Screening for pyrazines (Table S2): Pea protein, cocoa, and coffee samples (0.04–1.0 g) were extracted with methanol/water (1–10 mL, 50:50, v/v) and homogenized for 2 min (Super Homogenizer Precellys Evolution, Bertin Technologies, Montigny-le-Bretonneux, France). Cocoa samples were additionally defatted (n-pentane). The centrifugated and membrane-filtered supernatants (1 µL) were then analyzed by UHPLC-MS/MS.
IS calibration curves (Table S3): Stock solutions of 2-methylbutanal (91 µg/mL), 3-methylbutanal (85 µg/mL), hexanal (102 µg/mL), heptanal (105 µg/mL), methional (118 µg/mL), (E)-2-octenal (113 µg/mL), (E,E)-2,4-nonadienal (116 µg/mL), (E,Z)-2,6-nonadienal (124 µg/mL), (E,E)-2,4-decadienal (115 µg/mL), (E)-2-undecenal (143 µg/mL), (E)-2-dodecenal (154 µg/mL), 2,3-octanedione (127 µg/mL), (E,E)-3,5-octadien-2-one (97 µg/mL), 2-undecanone (152 µg/mL), hexanoic acid (108 µg/mL), heptanoic acid (112 µg/mL), phenylacetaldehyde (105 µg/mL), 4-ethyl benzaldehyde (164 µg/mL), vanillin (133 µg/mL), and γ-octalactone (132 µg/mL) were prepared in acetonitrile/water (50:50, v/v) and further diluted by one to two steps. Consequently, 16 calibration solutions were produced in acetonitrile/water (50:50, v/v), and aliquots (40 µL) of each calibration solution spiked with 20 µL of the IS were derivatized as described above. Each determined concentration is the mean of three independent sample workups.
Validation experiments: As no analyte-free pea-like matrix was available for recovery experiments, calibration curves were first analyzed with (standard addition calibration) and without (matrix-free calibration) the presence of pea protein (40 mg/mL, C) in acetonitrile/water (50:50, v/v), as described above. A comparison between both curves revealed either the same slope, just shifted by a certain amount for the analytes present in pea protein, e.g., for hexanal and hexanoic acid, or congruent curves for no or low abundance, such as for (E,Z)-2,6-nonadienal and 2,3-octanedione (Figure 2). Hexanal, hexanoic acid, (E,Z)-2,6-nonadienal, and 2,3-octanedione represented one typical compound of each of the investigated compound classes; all analytes indicated the same behavior.
These experiments concluded that matrix effects during ionization were fully compensated by the selected internal standards and, therefore, recovery experiments were recorded to check the extraction and derivatization process in triplicate by spiking a constant volume (20 µL) of the diluted stock solution (1:120) with acetonitrile/water (50:50, v/v) and equilibrating with the IS solution (20 µL) for at least 20 h. The sample preparation was further conducted as detailed above. For the determination of the limit of detection (LOD) and the limit of quantitation (LOQ), the lowest calibration solution was further diluted, and the signal-to-noise ratio was measured using the MultiQuant software (AB Sciex, Darmstadt, Germany). The LOD was set to a signal-to-noise ratio of 3, and the LOQ was set to a signal-to-noise ratio of 10.
3-NPH-UHPLC-MS/MS analysis: An Exion LCTM UHPLC-system (AB Sciex, Darmstadt, Germany) was connected to a QTRAP 6500+ mass spectrometer (AB Sciex) and operated in positive electrospray ionization (ESI+) mode (ion spray voltage at +5500 V). The UHPLC system involved two Exion LC AD pumps, an Exion LC degasser, an Exion LC AD autosampler, an Exion LC AC column oven, and an Exion LC controller. Chromatographic separation was achieved on a 100 × 2.1 mm, 100 Å Kinetex 1.7 µm XB-C18 column (Phenomenex, Aschaffenburg, Germany) using the following gradient of 0.1% formic acid in water (solvent A) and 0.1% formic acid in acetonitrile (solvent B) with a flow of 0.4 mL/min: 0 min, 27% B; 0.5 min, 27% B; 1 min, 50% B; 6 min, 100% B; 7 min, 100% B; 7.5 min, 27% B, and 9 min, 27% B. The QTRAP 6500+ mass spectrometer was conducted in full-scan mode, as nebulizer (55 psi) and turbo gas (450 °C) zero grade air was used for solvent drying (65 psi). Nitrogen served as curtain (35 psi) and collision gas (1.5 × 10⁻⁵ torr), and the quadrupoles were set at unit resolution. Data acquisition and instrumental control was performed with the Analyst 1.6.3 software (AB Sciex) and obtained data were evaluated with the MultiQuant software (AB Sciex).
Additional 3-NPH-UHPLC-MS/MS analysis: Beside the described approach, a further 3-NPH-UHPLC-MS/MS method, successfully applied to a model milk dessert [16], was also used for quantitation of further odor-active sensometabolites, for which high abundance among different food matrices was shown [25].

2.5. Sensory Analysis

General conditions and panel training: Orthonasal aroma experiments were performed by sixteen aroma panelists (nine women and seven men, age 22–58 years) from the Chair of Food Chemistry and Molecular Sensory Science and the Leibniz Institute for Food Systems Biology at the Technical University of Munich to characterize the aroma profiles of pea proteins (Pisum sativum L.). Each attendee trained weekly for a minimum of two years to be able to distinguish aroma qualities and quantities [16]. All panelists agreed to contribute and had no history of known anosmia. For aroma evaluation, aqueous solutions of the following reference odorants (20 mL; 10-fold odor thresholds) for the given odor qualities were used for quantitative descriptive analysis (QDA) training, according to Stone and Sidel [26]: hexanal (25.0 µg/L) for grassy, 3-isopropyl-2-methoxypyrazine (0.1 µg/L) for beans-like, acetic acid (60 mg/L) for sour, (E,E)-2,4-decadienal (0.32 µg/L) for fatty, phenylacetic acid (0.68 mg/L) for honey-like, 2-ethyl-5-methylpyrazine (1.0 mg/L) for nutty, 3-methylbutanal (5.0 µg/L) for malty, and 2,3,5-trimethylpyrazine (0.12 mg/L) for earthy. All sensory analyses took place in special sensory cabins, and temperature was regulated to 20–25 °C. Data were evaluated with Excel 2016 (Microsoft, Redmond, WA, USA) as well as Origin 2018b 9.55 (OriginLab Corporation, Northampton, MA, USA).
Aroma profile analysis (APA): For orthonasal aroma profile analysis, 10% pea protein was suspended in a mixture of water/triacetin (97.5:2.5, w/w) and presented in closed sensory vials (45 mL) to the panelists. By sniffing, the aroma intensities for grassy, beans-like, sour, fatty, honey-like, nutty, malty, and earthy notes were rated from 0 (not detectable) to 5 (very intense), and thus the aroma profiles were characterized.
Recombination studies and comparative APA (cAPA): For aroma recombination, deodorized pea protein powder with strongly minimized characteristic pea aroma was generated using the following steps: Pea protein C (500 g) was stirred in freshly distilled n-pentane (2 × 1.5 L), then in dichloromethane (2 × 1.5 L) at room temperature overnight, and was removed from solvent on the next day. The obtained pea protein powder was dried under a stream of nitrogen and could not be sensorially related to pea by the panelists. Moreover, recombination solutions, including all aroma-active compounds (odor activity value, OAV ≥ 1) or parts of it (minimal recombinant) in native pea protein concentrations, were prepared in triacetin. Aroma recombinants were prepared by suspending 10% deodorized pea protein powder in water and the recombination solution in triacetin (97.5:2.5, w/w) and assessed in comparison to C, as described for the APA.
Omission tests: Incomplete recombinants, each lacking one aroma-active compound or group (OAV ≥ 1), were evaluated against complete recombinants by means of 3-alternative forced choice tests (3-AFC). Based on the number of correctly identified samples and attended panelists (13–14), p values were determined by binomial distribution [27].

2.6. Determination of Odor Thresholds

Odor thresholds were taken from the Leibniz-LSB@TUM odorant database or determined in water for 2,3-octanedione, (E,E)-3,5-octadien-2-one, and (E)-2-dodecenal according to literature [28,29].

2.7. Estimation of Aroma Contribution

As only odorants with concentrations achieving their individual threshold contribute to the overall aroma, OAV were calculated by using Equation (1). Per definition, analytes with values ≥ 1, determined by the ratio of the quantified amount to the orthonasal odor threshold, had an impact on the food’s authenticity and, thus, were considered in the recombination experiments [25].
O A V = c o n c e n t r a t i o n o r t h o n a s a l   o d o r   t h r e s h o l d

2.8. Statistical Analysis

OAV data were visualized as a heatmap using the visualization platform R (version 4.0.4, R foundation) [30] and package “ComplexHeatmap” [31].

3. Results

Based on literature research on the aroma of lupin and pea protein (Pisum sativum L.) [9,10,11,17,18,19,32], reported candidates (Tables S1 and S2) and further odor-active sensometabolites [16] were quantitated by means of UHPLC-MS/MS based on stable isotope dilution analysis (SIDA) with rapid and simple sample workup.

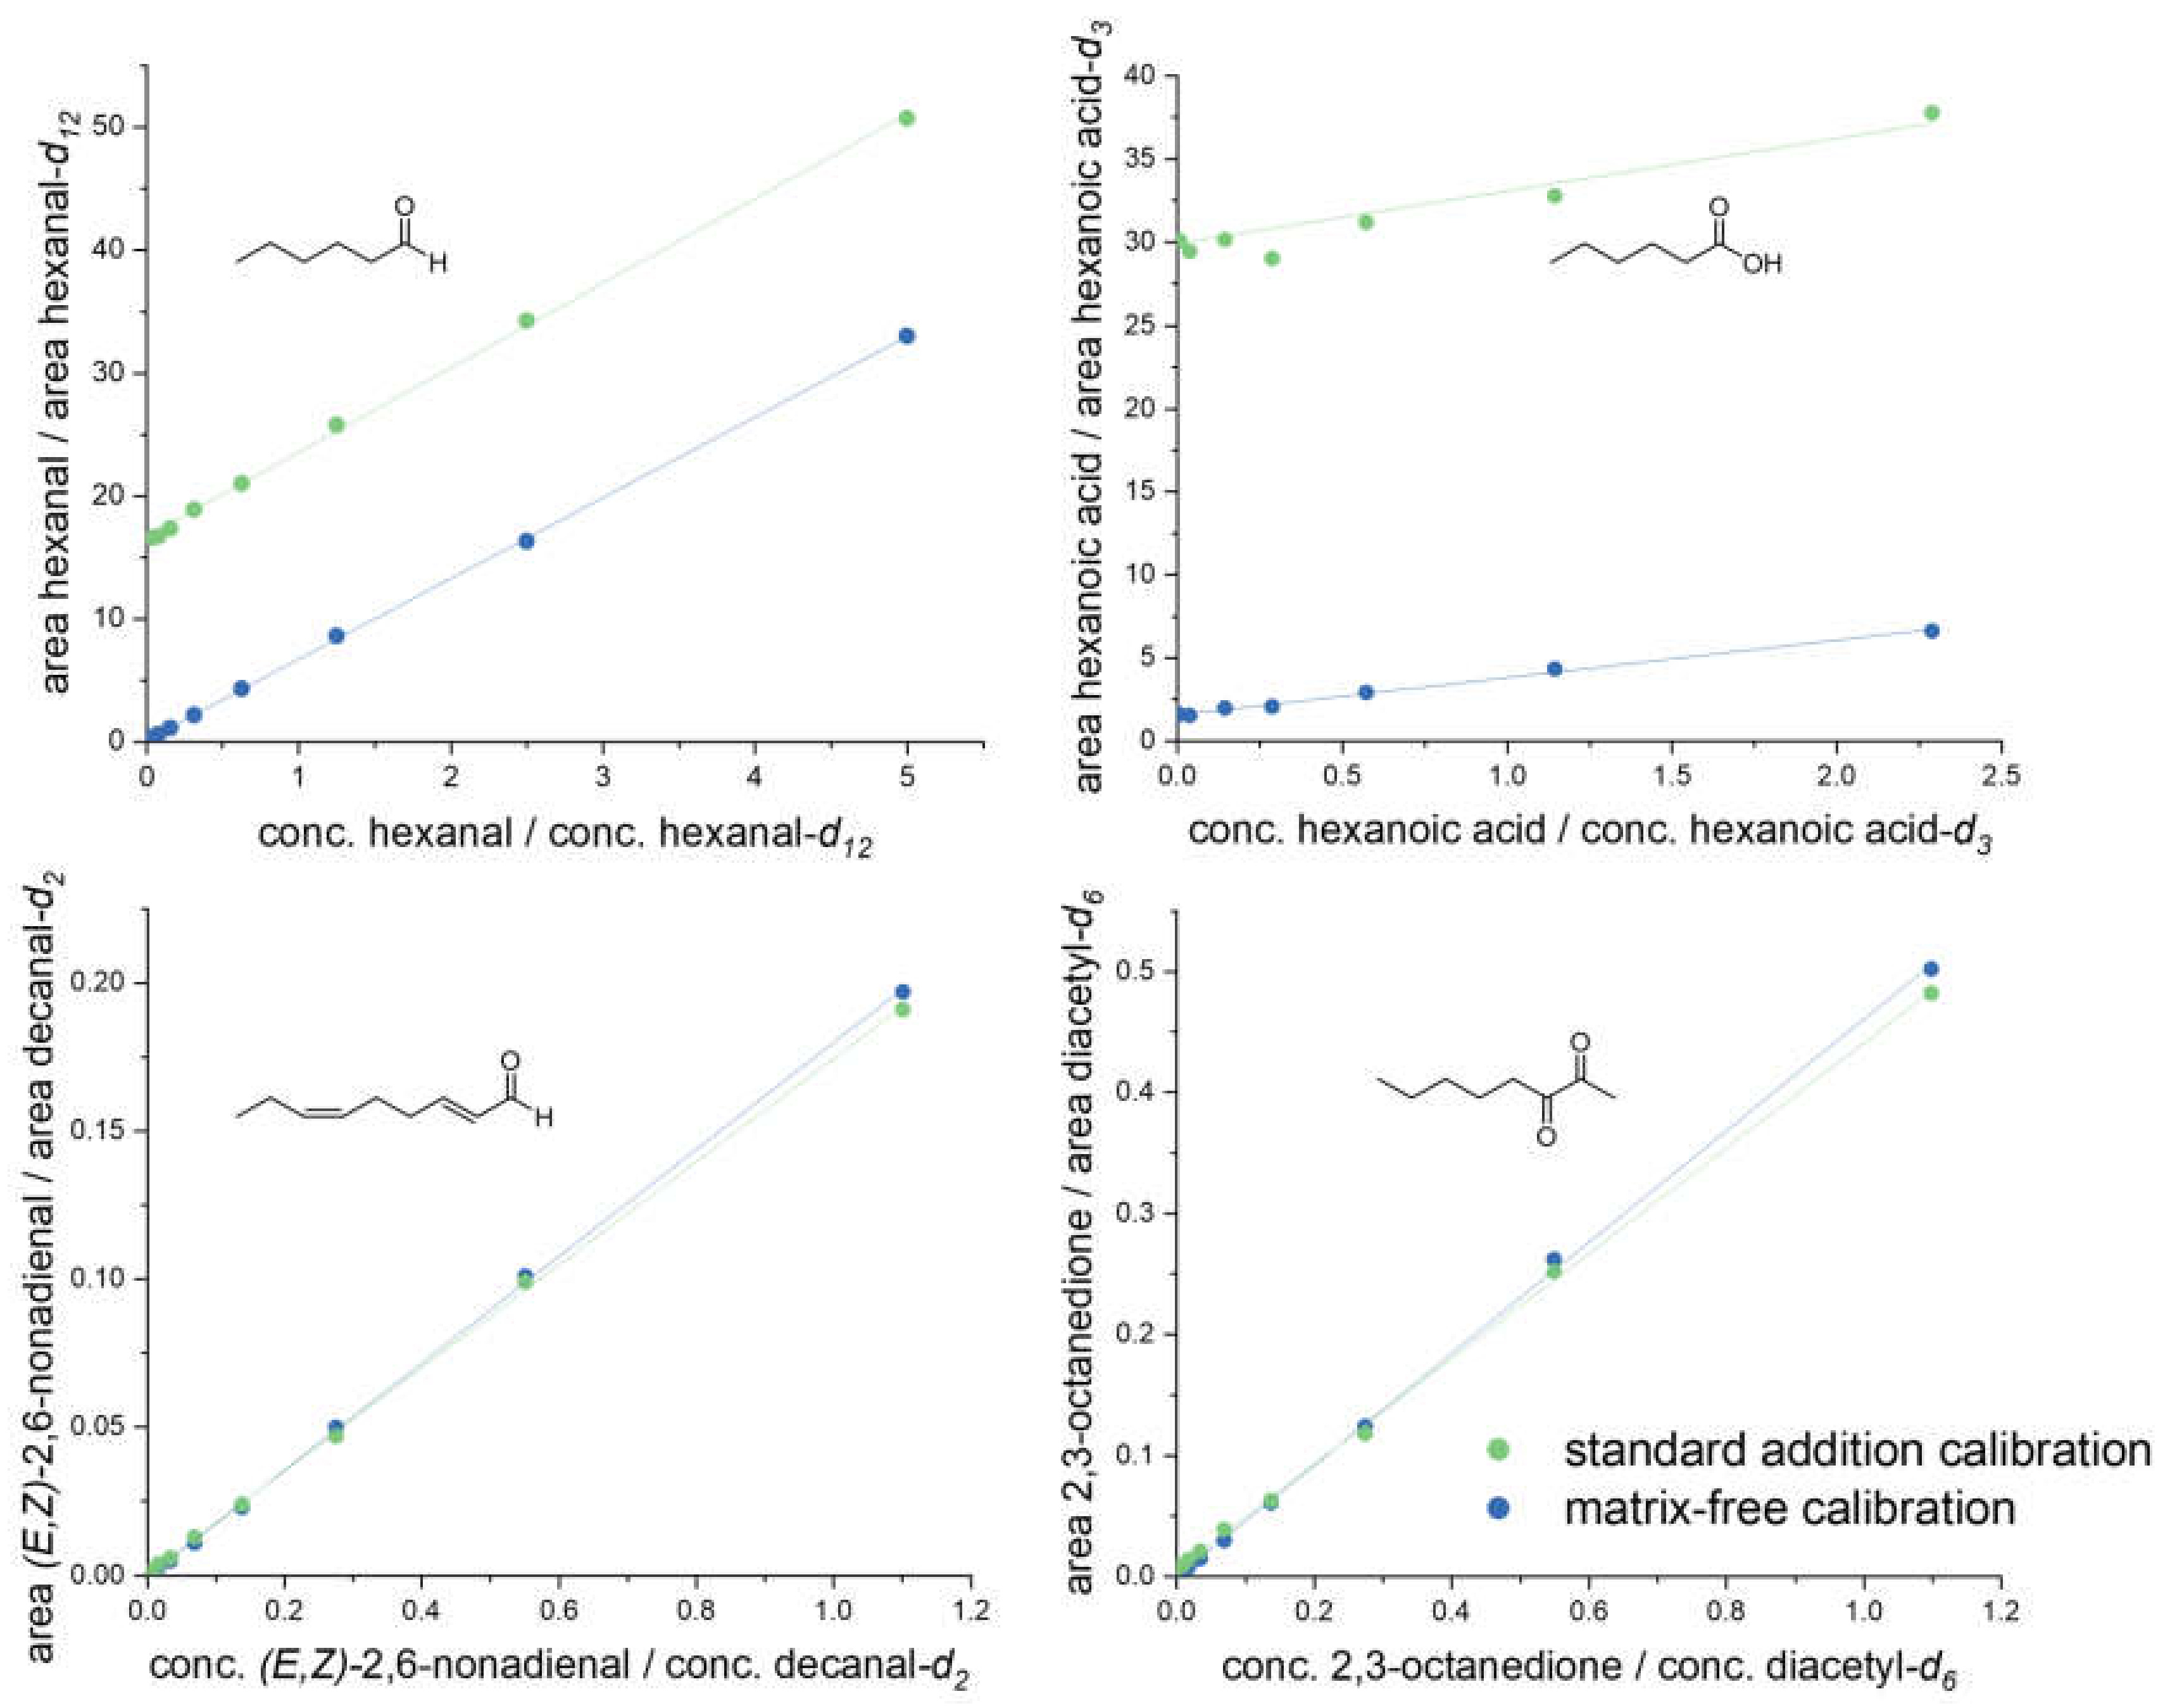
3.1. Method Development and Validation Experiments

To guarantee fast, selective, and sensitive quantitation of 3-NPH tagged odorants by means of UHPLC-MS/MS, reference solutions were initially derivatized and used for software-assisted ramping of ion source and ion path parameters by syringe infusion [15,16]. The comparison of retention times and MS spectra could confirm the presence of 2- and 3-methylbutanal, hexanal, heptanal, methional, (E)-2-octenal, (E,E)-2,4-nonadienal, (E,Z)-2,6-nonadienal, (E,E)-2,4-decadienal, (E)-2-undecenal, (E)-2-dodecenal, 2,3-octanedione, (E,E)-3,5-octadien-2-one, 2-undecanone, hexanoic acid, heptanoic acid, phenylacetaldehyde, 4-ethyl benzaldehyde, vanillin, and γ-octalactone within one single run of nine minutes (Figure 3, for MRM transitions see Table S1).
By establishing scheduled detection windows of ±30 sec, a suspension of 40 mg of protein powders in 1.0 mL acetonitrile/water derivatized with 3-NPH (Figure 1) proved appropriately sensitive to detect all individual analytes [15,16].
Validation experiments revealed no crucial matrix effects for all analytes expressed as parallel upward shifted calibration curves (standard addition calibration), e.g., for hexanal and hexanoic acid (Figure 2). Consequently, recovery rates were calculated by derivatizing known concentrations of each analyte in acetonitrile/water (50:50, v/v) and analyzing by means of 3-NPH-UHPLC-MS/MS. Determined recovery rates ranged between 80.5 and 106.9%. The LOD and LOQ were very low, varying from <0.1 to 5.8 nmol/L and <0.1 to 19.2 nmol/L, respectively (Table 2). All LOQs showed higher sensitivity than specific aroma thresholds or could be counterbalanced by increasing sample loading, guaranteeing a detection of all analytes to the full extent.
In addition, we attempted to detect the pyrazines 2,3-dimethylpyrazine, 2,5-dimethylpyrazine, 2,6-dimethylpyrazine, 2,3,5-trimethylpyrazine, 2-ethylpyrazine, 2-ethyl-5(6)-methylpyrazine, 3-isopropyl-2-methoxy-(5/6)-methylpyrazine, and 2-isobutyl-3-methoxypyrazine, described in roasted pea and pea protein [9,10,11], using the identical UHPLC-MS/MS method with specific pre-recorded positive (ESI+) tuning data of the pyrazines (MRM transitions see Table S2). However, these pyrazines could not be detected in pea protein, even when higher sample amounts were used. In principle, the method could be successfully applied for the identification of pyrazines in coffee and highly roasted cocoa samples. Therefore, we assumed that the pyrazines investigated were below the LOQ and thus they were excluded from further analysis, which is not surprising, as the pea proteins investigated were hardly heat-treated during processing.
Keeping in mind that, of the variety of more than 10,000 different volatiles, less than 3% are primarily responsible for authentic flavor among different food categories [25], a recently published UHPLC-MS/MS flavor method was also used for the analysis of further odor-active sensometabolites [16]: (Z)-3-hexenal, (Z)-2-nonenal, (E)-2-nonenal, trans-4,5-epoxy-(E)-2-decenal, acetaldehyde, diacetyl, acetoin, 1-hexen-3-one, 1-octen-3-one, acetic acid, butyric acid, 2- and 3-methylbutanoic acid, pentanoic acid, octanoic acid, nonanoic acid, decanoic acid, dodecanoic acid, tetradecanoic acid, phenylacetic acid, benzaldehyde, phenylpropanoic acid, 2-aminoacetophenone, sotolon, 2-acetyl-1-pyrroline, and 2-acetyl-2-thiazoline.
Thus, pea proteins were checked for the presence of the potential aroma-active compounds described in this chapter by UHPLC-MS/MS quantitation methodology.

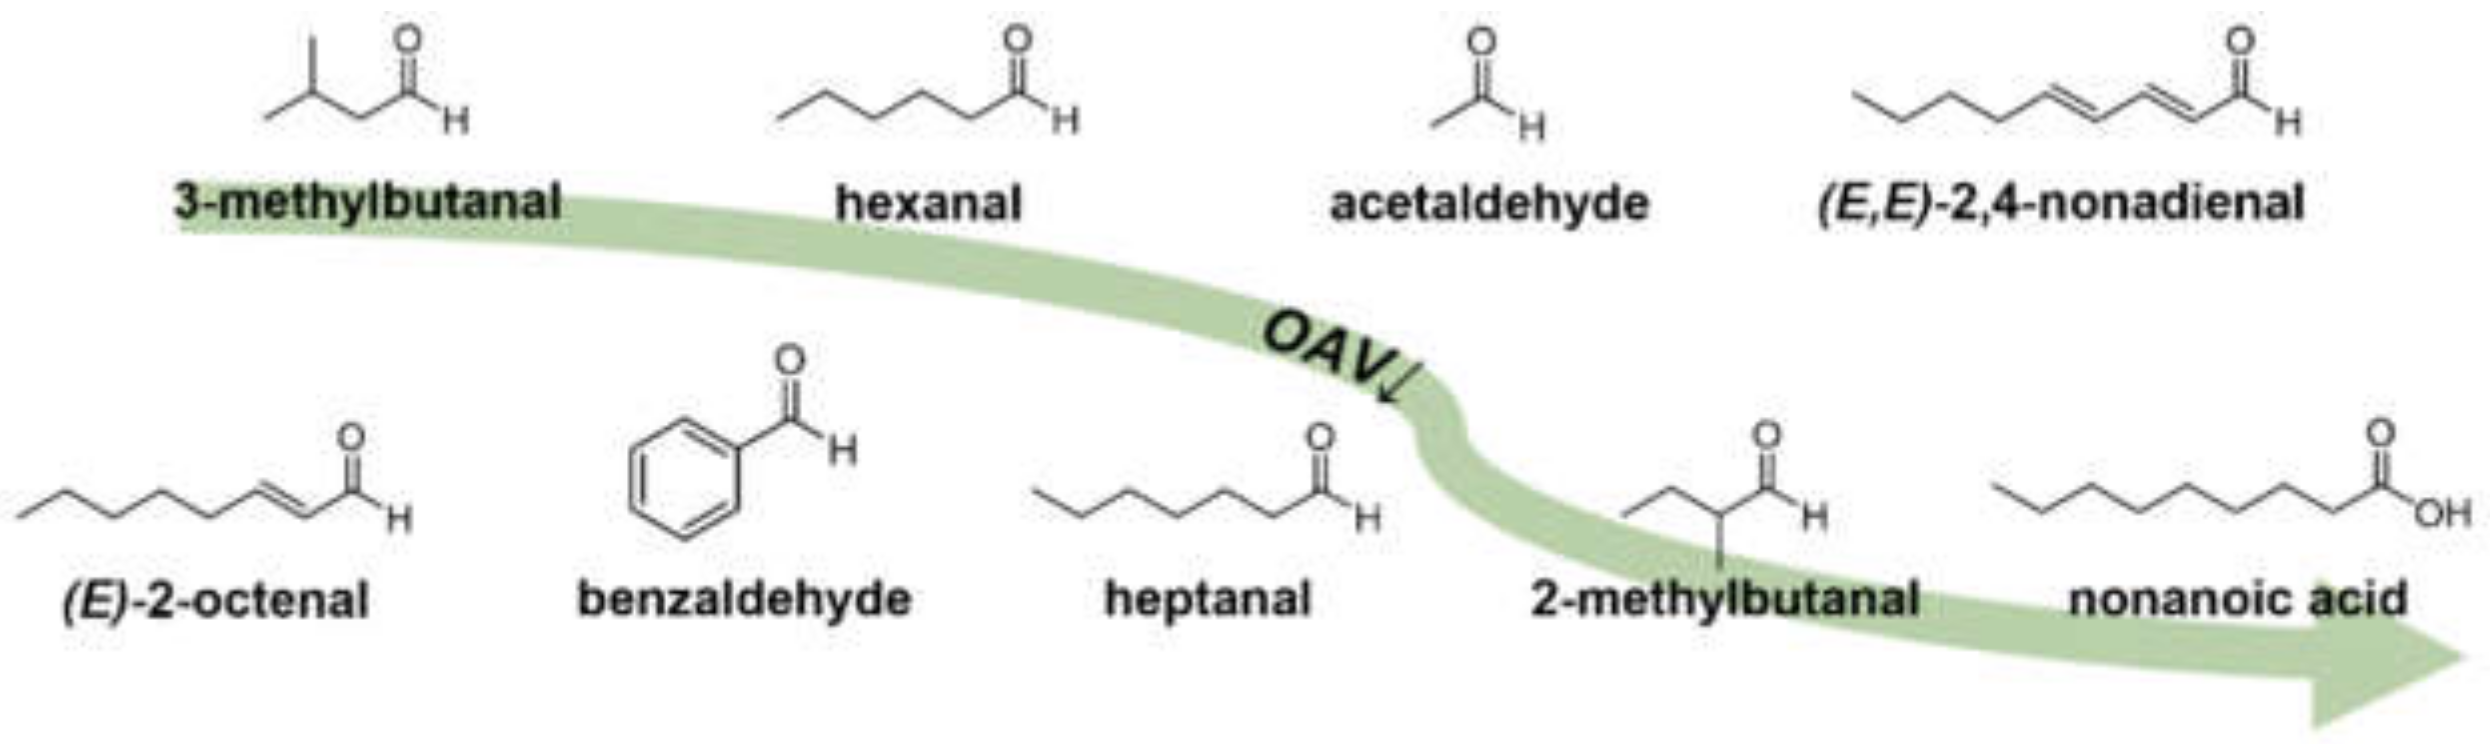
3.2. Sensomics-Assisted Aroma Decoding

Using the Sensomics approach, the aroma composition of pea protein C should be quantitatively decoded and re-engineered. Therefore, in a first step, OAV were calculated via the ratio of concentration and corresponding odor threshold in water. This procedure resulted in a list of 27 analytes with OAV ≥ 1 (Table 3), at which 3-methylbutanal (5.1 mg/kg; OAV 10186), hexanal (14.9 mg/kg; OAV 6202), acetaldehyde (72.2 mg/kg; OAV 4512), (E,E)-2,4-decadienal (101 µg/kg; OAV 3741), phenylacetaldehyde (6.1 mg/kg; OAV 1173), and (E,E)-2,4-nonadienal (53 µg/kg; OAV 1157) showed the highest OAV > 1000. In contrast, (E,Z)-2,6-nonadienal and 4-ethylbenzaldehyde could not be identified in any examined protein sample (Table S4).
Thus far, odorants in pea protein have only once been quantified by means of GC-MS, and relative quantities of several analytes were calculated using hexanal-d12 as an internal standard, yielding in concentrations of 83 mg/kg of hexanal and 2.1 mg/kg of phenylacetaldehyde. (E,E)-2,4-decadienal could not be quantitated because of coeluted peaks [10].
Compared to the compounds described above with OAV > 1000, the ranges of relative quantities in mg/kg were well in line with those reported in literature [10]. Taking all determined aroma-active compounds (Table 3) into account, reported concentrations for heptanal (16.2 mg/kg), nonanoic acid (4.3 mg/kg), methional (97 µg/kg), 2-undecanone (557 µg/kg), 2,3-octanedione (4.1 mg/kg), and (E,E)-3,5-octadien-2-one (24.4 mg/kg) were either slightly higher or, for (E)-2-octenal (312 µg/kg), benzaldehyde (6.4 mg/kg), and vanillin (268 µg/kg), marginally lower [10]. Nevertheless, a multitude of different analyte concentrations, such as for 2- and 3-methylbutanoic, pentanoic, hexanoic, heptanoic, octanoic, and dodecanoic acid, could yet not be determined in pea protein.
Based on the results by means of accelerated targeted UHPLC-MS/MS analysis, and on a SIDA using various IS with different functional groups matched on the examined analytes and added before sample preparation, the present quantitation approach provides reliable and precise insights into the quantitative aroma composition of different pea proteins (Pisum sativum L.).

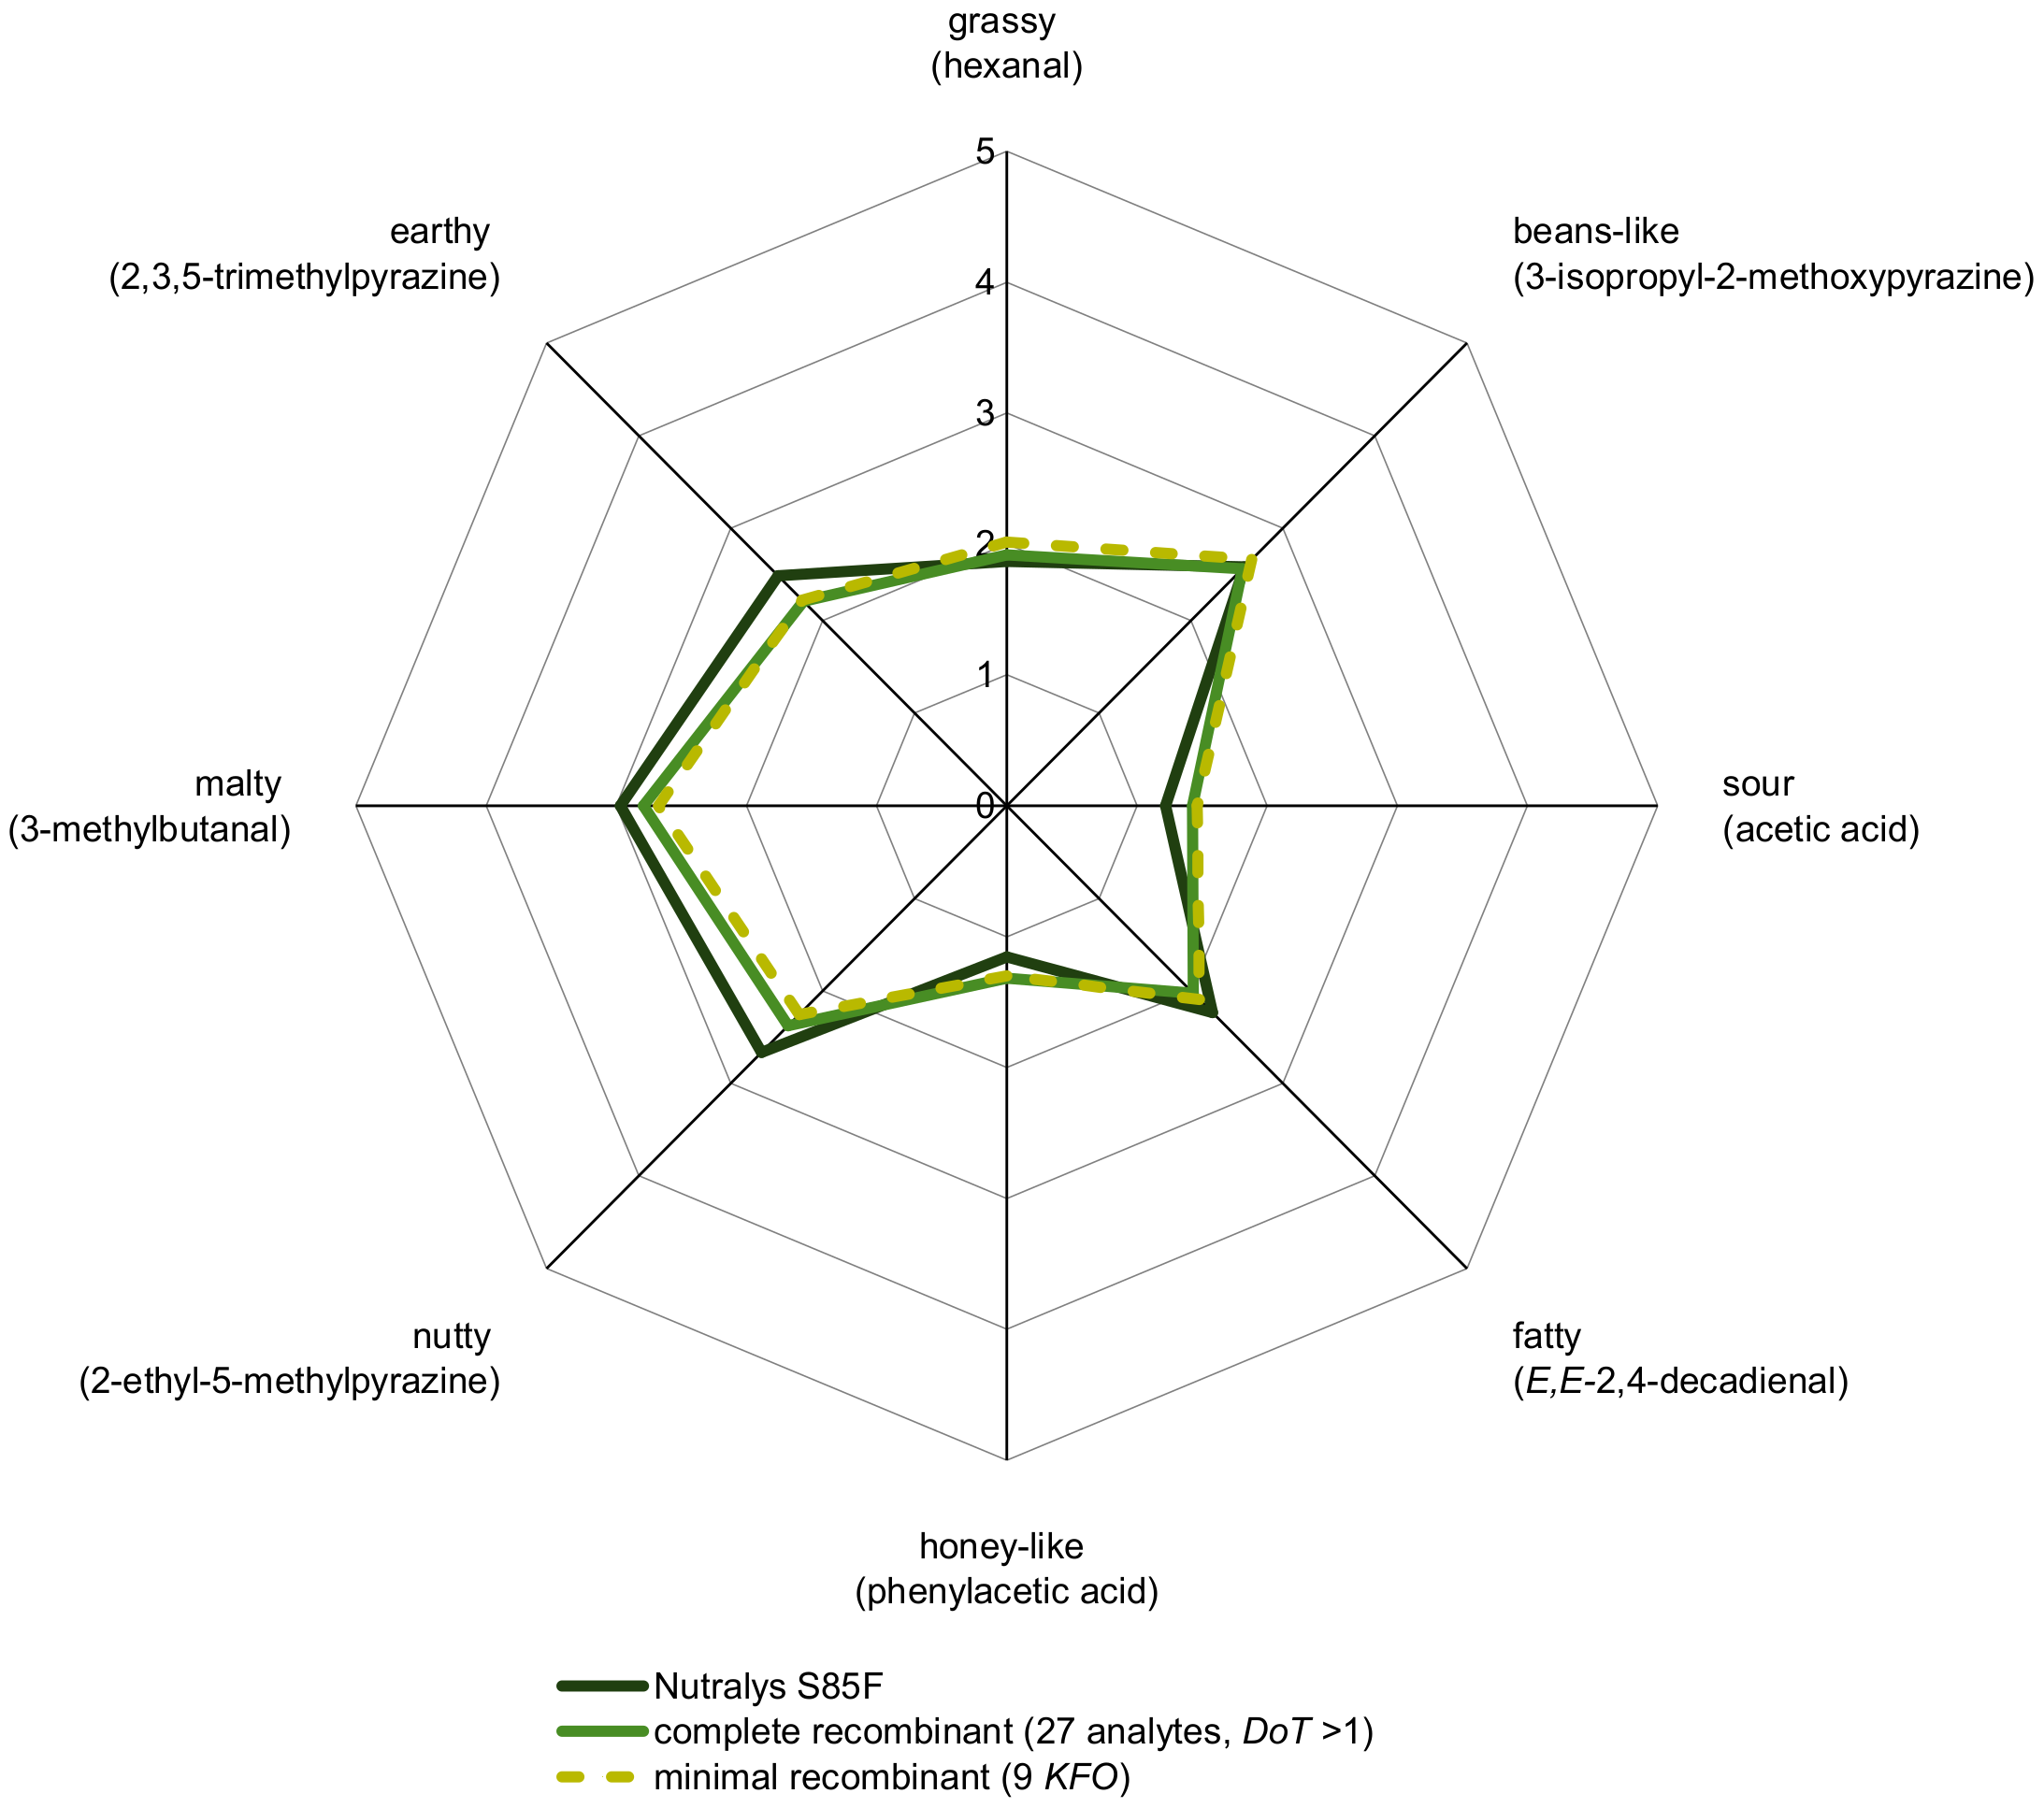
3.3. Pea Protein Aroma Simulation and Omission Experiments

By means of cAPA, a complete aroma recombinant, consisting of all 27 analytes with OAV > 1 (Table 3) in native concentrations in a deodorized pea protein solution, was evaluated sensorially in comparison to C (Figure 4). The results proved the quantified aroma compounds in their correct ratio and the successful aroma reconstitution, respectively.
In a next step, aroma compounds were omitted and evaluated sensorially via 3-AFC tests in order to highlight which of the odorants were KFO and to assess the individual impact of singly omitted odorants (tests O3–O15) or blocks (O1 and O2) (Table 4) on the overall aroma.
The first experiments revealed that an omission of all aroma-active compounds with OAV < 10 (test O1) did not lead to a significant difference (p > 5%), indicating minor importance of hexanoic, octanoic, phenylacetic, and 2-methylbutanoic acids as well as γ-octalactone, 2,3-octanedione, 2-undecanone, acetoin, and (E,E)-3,5-octadien-2-one for the overall aroma of pea protein C. In addition, the omission of the group of odorants with OAV < 100 (test O2: methional, vanillin, acetic, 3-methylbutanoic, and decanoic acids) could not be significantly (p > 5%) distinguished by the panel. For OAV > 100, all 13 odorants were individually omitted and tested against the complete recombinants, whereupon two odorants, namely 3-methylbutanal (OAV 10186, test O3) and heptanal (OAV 217, test O12), led to very highly significant differences (p < 0.1%). The omission of 2-methylbutanal (OAV 178, test O13) caused a highly significant difference (1% ≥ p < 0.1%), while omissions of hexanal (OAV 6202, test O4), acetaldehyde (OAV 4512, test O5), (E,E)-2,4-nonadienal (OAV 1157, test O8), (E)-2-octenal (OAV 533, test O9), benzaldehyde (OAV 248, test O11), and nonanoic acid (OAV 107, test O15) still led to significant differences (5% ≥ p > 1%). In contrast, omissions of (E,E)-2,4-decadienal (OAV 3741, test O6), phenylacetaldehyde (OAV 1173, test O7), and diacetyl (OAV 329, test O10) as well as (E)-2-undecenal (OAV 158, test O14) resulted in no significant differences (p > 5%) and, consequently, together with the odorants of OAV < 100, were considered as no KFO. Finally, a minimal recombinant based on these nine analytes (Figure 4) highlighted very high similarity compared to the complete recombinant consisting of 27 odorants with OAV > 1 (Table 3) and is underlining once more their role as KFO and importance on the overall aroma of pea protein C.

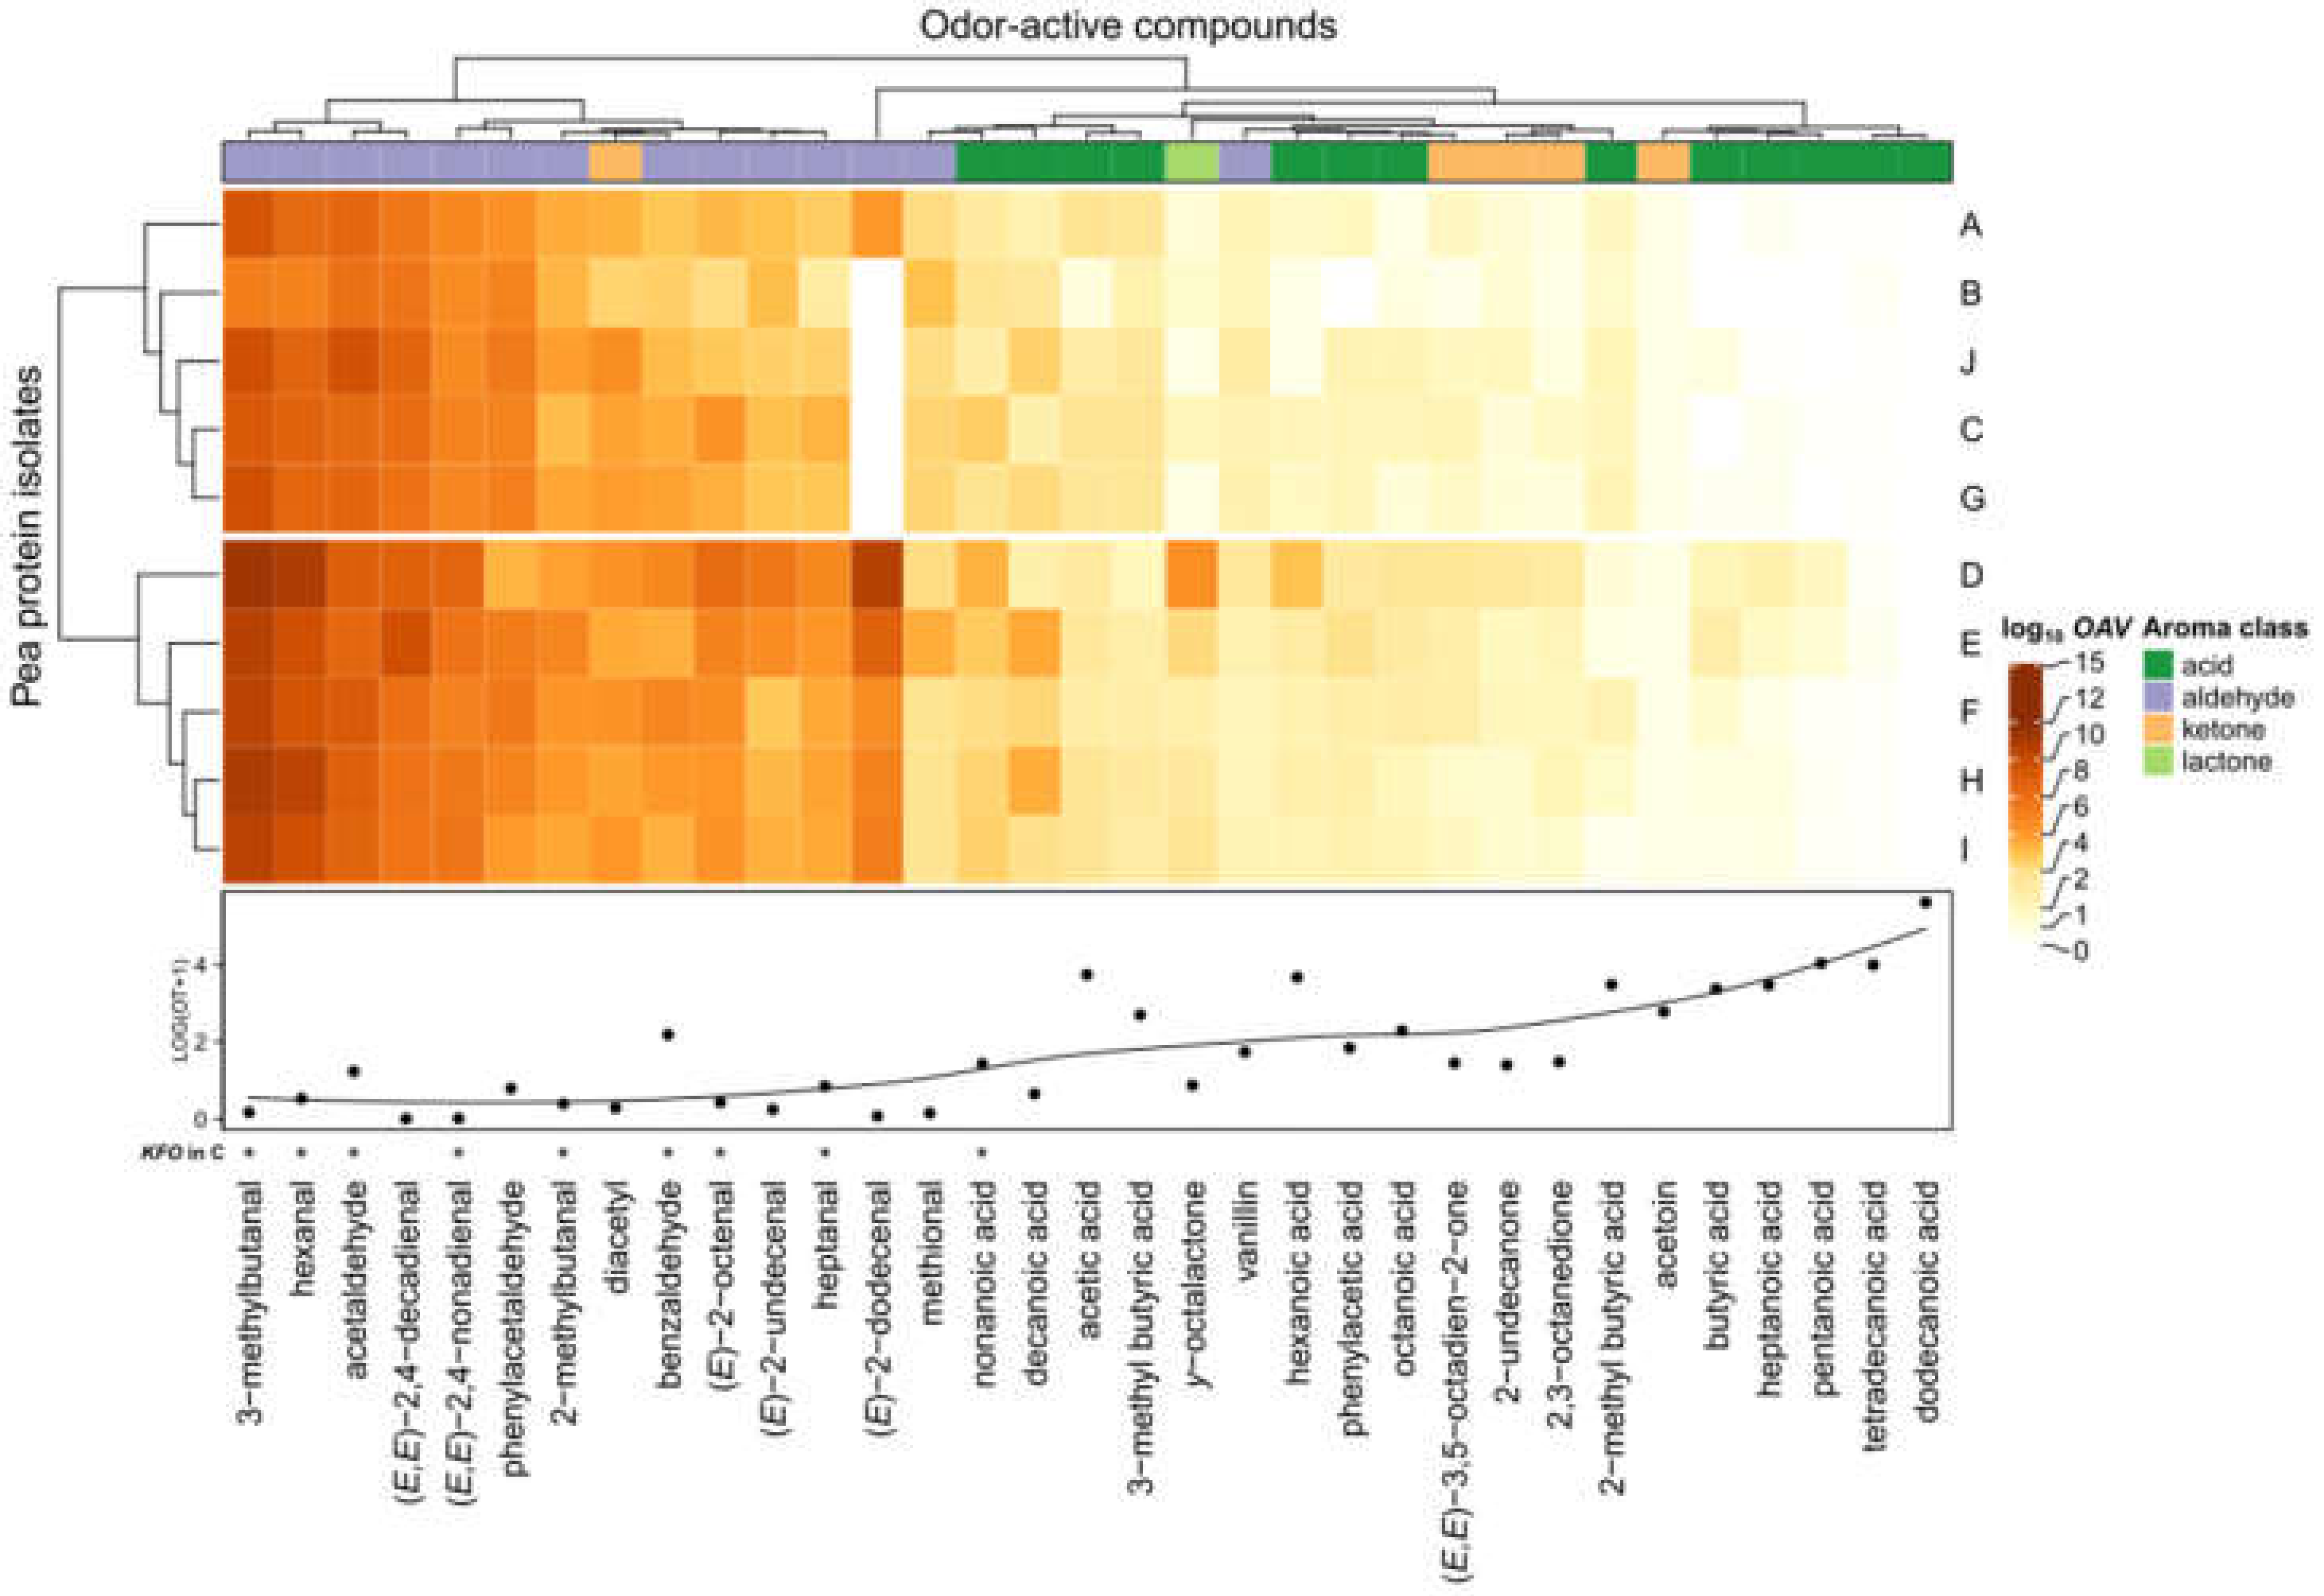
3.4. OAV Mapping of Commercially Available Pea Proteins

As aroma re-engineering and discovery of KFO by means of the Sensomics approach is complex and time-consuming, the question arose whether the impact of revealed KFO in pea protein C was also transferrable to the overall aroma of pea proteins (Pisum sativum L.) in general. Therefore, further pea protein isolates (A, B, D, E, F, G, H, I, J) were also analyzed with the described UHPLC-MS/MS methods and checked for molecular sensory differences. To be able to draw reliable conclusions, OAVs were calculated (Table S5) and logarithmically visualized based on the quantified concentrations and odor thresholds of each analyte in the examined pea protein samples (Figure 5).
The first insights indicated that mainly aldehydes with relatively low odor thresholds automatically clustered together, underlining the importance on the overall aroma among all pea proteins. Moreover, eight out of nine KFO could be spotted within this cluster, namely 3-methylbutanal, hexanal, acetaldehyde, (E,E)-2,4-nonadienal, 2-methylbutanal, benzaldehyde, (E)-2-octenal, and heptanal.
Except for nonanoic acid, also determined as KFO in C, and diacetyl, further acids, ketones, and γ-octalactone seemed to play a minor role for the aroma. Thus, statistical cluster analysis additionally substantiated the sensory results obtained by omission experiments.
Furthermore, cluster analysis also revealed intra-pea protein variations expressed by two different protein groups: A, B, J, C, G (cluster 1) and D, E, F, H, I (cluster 2). While, e.g., (E)-2-dodecenal was highly present in cluster 2, it did not exceed the OAV > 1 for pea proteins within cluster 1. Additionally, the individual contribution of KFO aldehydes slightly differed among the examined pea proteins.
In summary, OAV heatmapping highlighted comparable influences on the overall aroma of pea proteins and emphasized the group of aldehydes. Moreover, there were strong indications that the examined KFO of pea protein C were transferable as general KFO among different pea proteins (Pisum sativum L.).

4. Conclusions

Pea protein (Pisum sativum L.) could be a promising ingredient for the development of new functional foods such as meat substitutes. Unfortunately, the characteristic grassy, green, and bean-like off-flavor often distracts consumers, whereby these foods suffer from a lower acceptance and consequently need to be optimized regarding flavor. By means of high-throughput UHPLC-MS/MS analysis including 3-NPH derivatization, the presence and concentration of selected odorants, described to be important in different pea or related matrices, could be evaluated within a few minutes. OAV of the quantified analytes revealed 27 odor-active compounds, which resulted in their distinctive concentration composition in a confirmative aroma recombination. Finally, recombination and omission experiments as well as OAV heatmapping highlighted nine general key food odorants in pea protein, namely, 3-methylbutanal, hexanal, acetaldehyde, (E,E)-2,4-nonadienal, (E)-2-octenal, benzaldehyde, heptanal, 2-methylbutanal, and nonanoic acid (Figure 6).
The present investigation provides new insights into the aroma of different pea proteins (Pisum sativum L.) by KFO identification as well as cluster analysis and, therefore, may be helpful for knowledge-based flavor optimization of foods using pea protein as a (main) ingredient.

Supplementary Materials

The following are available online at https://www.mdpi.com/article/10.3390/foods11030412/s1, Table S1: MRM transitions of analyzed 3-NPH tagged odorants, Table S2: MRM transitions of pyrazines, Table S3: Used IS, IS calibration curves, and R2 of the quantified odorants, Table S4: Concentrations of the quantified odorants in different pea protein samples, Table S5: OAV of the quantified odorants in different pea protein samples and R script of OAV heatmap.

Author Contributions

F.U. developed the experimental design and quantitation methods, performed all UHPLC-MS/MS analysis, evaluated the results, created Figure 1, Figure 2, Figure 3 and Figure 4 and 6 and all tables, and wrote the first draft of the manuscript, all supervised by T.D.S., C.D. and T.H. For recombination and omission experiments, F.U. organized the sensory analyses and evaluated the results, supported by J.K. and A.S. The measured protein contents in different pea proteins were provided by C.T. under the supervision of U.K. The OAV heatmap (Figure 5) and all cluster analysis was performed by A.S. The primary supervisor of the present investigation was C.D. and, together with J.K. and T.D.S., they were the second readers of the manuscript. All authors have read and agreed to the published version of the manuscript.

Funding

This IGF Project of the FEI was supported via AiF within the program for promoting the Industrial Collective Research (IGF) of the German Ministry of Economic Affairs and Energy (BMWi), based on a resolution of the German Parliament. Project AiF 20197 N.

Institutional Review Board Statement

Not applicable.

Informed Consent Statement

Not applicable.

Data Availability Statement

All data used in this publication are saved at the Chair for Food Chemistry and Molecular Sensory Science, Freising, Germany.

Acknowledgments

We are grateful to Anneliese Köhler, Julia Schweiger, and Jörg Stein for assisting during sample preparation for quantitation and sensory recombination as well as omission experiments.

Conflicts of Interest

The authors declare that they have no conflict of interest.

References

  1. Nielsen Company. Umsatz mit Pflanzlichen Milchersatzprodukten in Deutschland Bis 2020. Available online: https://de.statista.com/statistik/daten/studie/1185175/umfrage/umsatz-mit-pflanzlichen-milchersatzprodukten-in-deutschland/ (accessed on 14 April 2021).
  2. Statistisches Bundesamt. Vegetarische und Vegane Lebensmittel: Produktion steigt im 1. Quartal 2020 um 37%. Available online: https://www.destatis.de/DE/Presse/Pressemitteilungen/Zahl-der-Woche/2020/PD20_30_p002.html (accessed on 14 April 2021).
  3. KPMG. Nachhaltigkeit ist mehr als nur ein Kurzzeitiger Trend: Consumer Barometer 01/20. Available online: https://home.kpmg/de/de/home/media/press-releases/2020/03/nachhaltigkeit-ist-mehr-als-nur-ein-kurzzeitiger-trend-consumer-barometer.html (accessed on 14 April 2021).
  4. Steinfeld, H.; Gerber, P.; Wassenaar, T.; Castel, T.; Rosales, M.; de Haan, C. Livestock’s Long Shadow: Environmental Issues and Options; FAO: Rome, Italy, 2006. [Google Scholar]
  5. Tanger, C.; Schmidt, F.; Utz, F.; Kreissl, J.; Dawid, C.; Kulozik, U. Pea protein microparticulation using extrusion cooking: Influence of extrusion parameters and drying on microparticle characteristics and sensory by application in a model milk dessert. Innov. Food Sci. Emerg. Technol. 2021, 74, 102851. [Google Scholar] [CrossRef]
  6. Mordor Intelligence. Europe Pea Protein Market—Growth, Trends and Forecasts (2017–2022). Available online: https://www.researchandmarkets.com/reports/4472989/global-pea-protein-market-growth-trends-and (accessed on 21 April 2021).
  7. Global Market Insights. Pea Protein Market Size by Product (Isolate, Concentrate, Textured), by Application (Meat Substitutes, Nutraceuticals, Sports Supplements), Industry Analysis Report, Regional Outlook, Application Potential, Price Trends, Competitive Market Share & Forecast, 2020–2026. Available online: https://www.gminsights.com/industry-analysis/pea-protein-market-report (accessed on 21 April 2021).
  8. Gläser, P.; Dawid, C.; Meister, S.; Bader-Mittermaier, S.; Schott, M.; Eisner, P.; Hofmann, T. Molecularization of Bitter Off-Taste Compounds in Pea-Protein Isolates (Pisum sativum L.). J. Agric. Food Chem. 2020, 68, 10374–10387. [Google Scholar] [CrossRef]
  9. Bi, S.; Xu, X.; Luo, D.; Lao, F.; Pang, X.; Shen, Q.; Hu, X.; Wu, J. Characterization of Key Aroma Compounds in Raw and Roasted Peas (Pisum sativum L.) by Application of Instrumental and Sensory Techniques. J. Agric. Food Chem. 2020, 68, 2718–2727. [Google Scholar] [CrossRef] [PubMed]
  10. Murat, C.; Bard, M.-H.; Dhalleine, C.; Cayot, N. Characterisation of odour active compounds along extraction process from pea flour to pea protein extract. Food Res. Int. 2013, 53, 31–41. [Google Scholar] [CrossRef]
  11. Trikusuma, M.; Paravisini, L.; Peterson, D.G. Identification of aroma compounds in pea protein UHT beverages. Food Chem. 2020, 312, 126082. [Google Scholar] [CrossRef]
  12. Flaig, M.; Qi, S.; Wei, G.; Yang, X.; Schieberle, P. Characterization of the Key Odorants in a High-Grade Chinese Green Tea Beverage (Camellia sinensis; Jingshan cha) by Means of the Sensomics Approach and Elucidation of Odorant Changes in Tea Leaves Caused by the Tea Manufacturing Process. J. Agric. Food Chem. 2020, 68, 5168–5179. [Google Scholar] [CrossRef]
  13. Poehlmann, S.; Schieberle, P. Characterization of the aroma signature of Styrian pumpkin seed oil (Cucurbita pepo subsp. pepo var. Styriaca) by molecular sensory science. J. Agric. Food Chem. 2013, 61, 2933–2942. [Google Scholar] [CrossRef]
  14. Wagner, J.; Granvogl, M.; Schieberle, P. Characterization of the Key Aroma Compounds in Raw Licorice (Glycyrrhiza glabra L.) by Means of Molecular Sensory Science. J. Agric. Food Chem. 2016, 64, 8388–8396. [Google Scholar] [CrossRef]
  15. Hofstetter, C.K.; Dunkel, A.; Hofmann, T. Unified Flavor Quantitation: Toward High-Throughput Analysis of Key Food Odorants and Tastants by Means of Ultra-High-Performance Liquid Chromatography Tandem Mass Spectrometry. J. Agric. Food Chem. 2019, 67, 8599–8608. [Google Scholar] [CrossRef]
  16. Utz, F.; Kreissl, J.; Stark, T.D.; Schmid, C.; Tanger, C.; Kulozik, U.; Hofmann, T.; Dawid, C. Sensomics-Assisted Flavor Decoding of Dairy Model Systems and Flavor Reconstitution Experiments. J. Agric. Food Chem. 2021, 69, 6588–6600. [Google Scholar] [CrossRef]
  17. Jakobsen, H.B.; Hansen, M.; Christensen, M.R.; Brockhoff, P.B.; Olsen, C.E. Aroma Volatiles of Blanched Green Peas (Pisum sativum L.). J. Agric. Food Chem. 1998, 46, 3727–3734. [Google Scholar] [CrossRef]
  18. Ebert, S.; Michel, W.; Nedele, A.-K.; Baune, M.-C.; Terjung, N.; Zhang, Y.; Gibis, M.; Weiss, J. Influence of protein extraction and texturization on odor-active compounds of pea proteins. J. Sci. Food Agric. 2021, 102, 1021–1029. [Google Scholar] [CrossRef]
  19. Bader, S.; Czerny, M.; Eisner, P.; Buettner, A. Characterisation of odour-active compounds in lupin flour. J. Sci. Food Agric. 2009, 89, 2421–2427. [Google Scholar] [CrossRef]
  20. Buettner, A.; Schieberle, P. Evaluation of aroma differences between hand-squeezed juices from Valencia late and Navel oranges by quantitation of key odorants and flavor reconstitution experiments. J. Agric. Food Chem. 2001, 49, 2387–2394. [Google Scholar] [CrossRef]
  21. Semmelroch, P.; Laskawy, G.; Blank, I.; Grosch, W. Determination of potent odourants in roasted coffee by stable isotope dilution assays. Flavour Fragr. J. 1995, 10, 1–7. [Google Scholar] [CrossRef]
  22. Poisson, L.; Schieberle, P. Characterization of the key aroma compounds in an american bourbon whisky by quantitative measurements, aroma recombination, and omission studies. J. Agric. Food Chem. 2008, 56, 5820–5826. [Google Scholar] [CrossRef]
  23. Mariotti, F.; Tomé, D.; Mirand, P.P. Converting nitrogen into protein—Beyond 6.25 and Jones’ factors. Crit. Rev. Food Sci. Nutr. 2008, 48, 177–184. [Google Scholar] [CrossRef]
  24. Han, J.; Lin, K.; Sequeira, C.; Borchers, C.H. An isotope-labeled chemical derivatization method for the quantitation of short-chain fatty acids in human feces by liquid chromatography–tandem mass spectrometry. Anal. Chim. Acta 2015, 854, 86–94. [Google Scholar] [CrossRef]
  25. Dunkel, A.; Steinhaus, M.; Kotthoff, M.; Nowak, B.; Krautwurst, D.; Schieberle, P.; Hofmann, T. Nature’s chemical signatures in human olfaction: A foodborne perspective for future biotechnology. Angew. Chem. Int. Ed. 2014, 53, 7124–7143. [Google Scholar] [CrossRef]
  26. Stone, H.; Sidel, J.L. Sensory Evaluation Practices, 4th ed.; Elsevier: Amsterdam, The Netherlands, 2012. [Google Scholar]
  27. Quadt, A.; Schönberger, S.; Schwarz, M. Statistische Auswertungen in der Sensorik: Leitfaden für die Praxis; Behr’s Verlag: Hamburg, Germany, 2009; ISBN 978-3-89947-531-9. [Google Scholar]
  28. Czerny, M.; Christlbauer, M.; Christlbauer, M.; Fischer, A.; Granvogl, M.; Hammer, M.; Hartl, C.; Moran Hernandez, N.; Schieberle, P. Re-investigation on odor thresholds of key food aroma compounds and development of an aroma language based on odor qualities of defined aqueous odorant solutions. Food Chem. 2008, 228, 265–273. [Google Scholar] [CrossRef]
  29. Kreissl, J.; Mall, V.; Steinhaus, P.; Steinhaus, M. Leibniz-LSB@TUM Odorant Database. Available online: https://www.leibniz-lsb.de/en/databases/leibniz-lsbtum-odorant-database (accessed on 29 July 2021).
  30. R Core Team. A Language and Environment for Statistical Computing; R Foundation for Statistical Computing: Vienna, Austria, 2021. [Google Scholar]
  31. Gu, Z.; Eils, R.; Schlesner, M. Complex heatmaps reveal patterns and correlations in multidimensional genomic data. Bioinformatics 2016, 32, 2847–2849. [Google Scholar] [CrossRef] [PubMed] [Green Version]
  32. Ben-Harb, S.; Saint-Eve, A.; Panouillé, M.; Souchon, I.; Bonnarme, P.; Dugat-Bony, E.; Irlinger, F. Design of microbial consortia for the fermentation of pea-protein-enriched emulsions. Int. J. Food Microbiol. 2019, 293, 124–136. [Google Scholar] [CrossRef] [PubMed]
Figure 1. Overview of applied derivatization scheme for the detection of aroma-active compounds. Adapted from [16], with permission from American Chemical Society, 2021.
Foods 11 00412 g001
Figure 2. Certain examples (hexanal, hexanoic acid, (E,Z)-2,6-nonadienal, 2,3-octanedione) of matrix calibration curves (standard addition calibration) in a suspended pea protein (C) solution, in comparison to matrix-free calibration in acetonitrile/water (50:50, v/v).
Foods 11 00412 g002
Figure 3. UHPLC-MS/MS analysis showing the mass transitions of quantifiable 3-NPH derivatized analytes and used IS in pea protein C. The signal intensity of each mass transition is normalized.
Foods 11 00412 g003
Figure 4. Aroma profile analysis of 10% C in water/triacetin (97.5:2.5, w/w) and its complete as well as minimal recombinant (10% deodorized protein in water/triacetin, 97.5:2.5, w/w). Odorants specified in brackets were used as reference attributes for the corresponding odor quality and perceived intensities were rated from 0 (not detectable) to 5 (very intense) by the panelists.
Foods 11 00412 g004
Figure 5. OAV mapping (heatmap) based on quantifiable odorants in different pea protein samples (A–J) and the corresponding odor thresholds (OT) determined in water. OAV data are log transformed. Asterisk (*) indicates KFO carried out with pea protein C by means of the Sensomics concept.
Foods 11 00412 g005
Figure 6. Chemical structures of KFO in pea protein (Pisum sativum L.) in descending OAV order, revealed by means of 3-AFC omission and OAV heatmapping.
Foods 11 00412 g006
Table 1. List of analyzed pea proteins within FEI project AiF 20197 N.
CodeCommercial NamePC (a)BatchProducer
ANutralys F85F67%W084MRoquette, Lestrem, France
BPrestige42%KO67XParrheim Foods, Saskatoon, Canada
CNutralys S85F68%W317MRoquette, Lestrem, France
DBio Erbsen Protein70%15720-30118Golden Peanut, Garstedt, Germany
EBio Erbsen Protein68%170180323Piowald, Mühbrook, Germany
F150101868%83526272Döhler, Darmstadt, Germany
GPea Pro68%06102016LSP Sports Nutrition, Bonn, Germany
HEmpro E86HV72%41266Emsland-Stärke, Emlichheim, Germany
IEmpro E8671%41266Emsland-Stärke, Emlichheim, Germany
JPisane C969%817021Cosucra Group, Warcoing, Belgium
(a) PC = Protein Content, determined using the Dumas method and a conversion factor of 5.4 (see Section 2.3).
Table 2. Performed validation experiments of important odorants in pea protein isolates.
Validated AnalyteAdd. (a)
(µmol/L)
Add. Found ± SD (b)
(µmol/L)
RSD (c)
(%)
Recovery
(%)
LOD (d)
(nmol/L)
LOQ (e)
(nmol/L)
2-/3-methylbutanal, sum0.6680.667 ± 0.0385.799.8<0.1<0.1
2-methylbutanal0.3460.344 ± 0.0092.799.5<0.1<0.1
hexanal0.3330.277 ± 0.004 1.583.02.79.0
heptanal0.3010.301 ± 0.0061.899.8<0.1<0.1
methional0.3700.336 ± 0.0082.490.80.20.5
(E)-2-octenal0.2920.259 ± 0.0031.088.80.51.7
(E,E)-2,4-nonadienal0.2740.272 ± 0.0041.599.30.20.5
(E,Z)-2,6-nonadienal0.2940.294 ± 0.0082.8100.00.20.8
(E,E)-2,4-decadienal0.2460.241 ± 0.0031.398.00.20.5
(E)-2-undecenal0.2780.267 ± 0.0207.496.20.30.9
(E)-2-dodecenal0.2750.258 ± 0.0155.793.71.44.7
2,3-octanedione0.2930.290 ± 0.0030.999.00.41.2
(E,E)-3,5-octadien-2-one0.2560.264 ± 0.0062.1103.2<0.10.3
2-undecanone0.2910.288 ± 0.0113.899.1<0.1<0.1
hexanoic acid0.3050.288 ± 0.0124.394.4<0.1<0.1
heptanoic acid0.2800.285 ± 0.0134.7101.75.819.2
phenylacetaldehyde0.2860.306 ± 0.0092.9106.9<0.10.3
4-ethyl benzaldehyde0.4000.378 ± 0.0236.194.54.715.8
vanillin0.2850.258 ± 0.0124.790.60.20.6
γ-octalactone0.3020.243 ± 0.0104.080.51.03.2
(a) Add. = Addition. (b) Add. found = Addition found, SD = Standard Deviation, determined based on replicate sample workup and analysis (n = 3). (c) RSD = Relative Standard Deviation. (d) LOD = Limit of Detection, determined based on a signal-to-noise ratio of 3. (e) LOQ = Limit of Quantitation, determined based on a signal-to-noise ratio of 10.
Table 3. Concentrations of aroma-active compounds in pea protein C in descending OAV order.
No.Aroma-Active AnalytesUsed ISOdor QualityMean ± SD (a)
(µg/kg)
RSD (b)
(%)
OT (c)
(µg/kg)
OAV (d)
13-methylbutanal (e)3-methylbutanal-d2malty5093 (5360 ± 547) (e)(10.2) (e)0.510186
2hexanalhexanal-d12green, grassy14,886 ± 190412.82.4 6202
3acetaldehyde (f)acetaldehyde-d3fresh, green72,197 ± 42315.9164512
4(E,E)-2,4-decadienaldecanal-d2fatty, deep-fried101 ± 109.80.0273736
5phenylacetaldehydephenylacetic acid-13C2flowery, honey-like6097 ± 3035.05.21173
6(E,E)-2,4-nonadienaldecanal-d2fatty, green53 ± 712.50.0461156
7(E)-2-octenalhexanal-d12fatty, nutty907 ± 80.81.7533
8diacetyl (f)diacetyl-d6butter-like316 ± 258.00.96329
9benzaldehyde (f)phenylacetic acid-13C2bitter almond-like,
marzipan-like
37,201 ± 785021.1150248
10heptanalhexanal-d12citrus-like, fatty1326 ± 1309.86.1 217
112-methylbutanal3-methylbutanal-d2malty267 ± 82.91.5178
12(E)-2-undecenaldecanal-d2soapy, metallic123 ± 86.50.78 157
13nonanoic acid (f)octanoic acid-d15moldy, pungent2776 ± 1676.026107
14methionalhexanal-d12cooked potato-like37 ± 54.70.4385
15acetic acid (f)acetic acid-13C2vinegar-like262,037 ± 10,4404.0560047
163-methylbutanoic acid (f)butyric acid-13C4sweaty23,274 ± 14256.1490 47
17decanoic acid (f)octanoic acid-d15soapy, musty51 ± 35.53.5 15
18vanillinvanillin-d3vanilla-like, sweet561 ± 183.253 11
19(E,E)-3,5-octadien-2-onediacetyl-d6woody, mushroom-like, green231 ± 187.9279
20hexanoic acidhexanoic acid-d3sweaty36,802 ± 19785.448008
21octanoic acid (f)octanoic acid-d15carrot-like, musty1536 ± 483.11908
22phenylacetic acid (f)phenylacetic acid-13C2honey-like, beeswax-like516 ± 6111.8688
23γ-octalactoneγ-nonalactone-d2coconut-like47 ± 510.56.57
242-methylbutanoic acid (f)butyric acid-13C4malty, fruity, sweaty21,419 ± 10144.731007
252,3-octanedionediacetyl-d6mushroom-like, dill-like, broccoli-like141 ± 138.9294.8
262-undecanonedecanal-d2soapy, green68 ± 46.5242.8
27acetoin (f)diacetyl-d6butter-like, carrot-like978 ± 70.75901.7
(a) Mean = arithmetic mean, SD = Standard Deviation, determined based on replicate sample workup and analysis (n = 3). (b) RSD = Relative Standard Deviation. (c) OT = Odor Threshold in water, taken from the Leibniz-LSB@TUM odorant database [29]. (d) Concentration divided by the odor threshold and expressed as OAV (Odor Activity Value). (e) The concentration of 3-methylbutanal was determined by subtraction the sum value (in brackets) from the 2-methylbutanal concentration. (f) Quantified by an additional 3-NPH-UHPLC-MS/MS method published for dairy analysis [16].
Table 4. Omission experiments applied to the aroma model of pea protein C.
TestOdorant(s) Omitted (a)OAVp Value (%)Significance (b)
O119–27<1023.8NS
O214–18<10019.1NS
O31, 3-methylbutanal10186<0.1***
O42, hexanal62022.6*
O53, acetaldehyde45124.8*
O64, (E,E)-2,4-decadienal37369.2NS
O75, phenylacetaldehyde117321.4NS
O86, (E,E)-2,4-nonadienal11564.8*
O97, (E)-2-octenal5331.3*
O108, diacetyl32915.6NS
O119, benzaldehyde2484.0*
O1210, heptanal217<0.1***
O1311, 2-methylbutanal1780.7**
O1412, (E)-2-undecenal15723.0NS
O1513, nonanoic acid1074.0*
(a) Odorant numbers refer to Table 3. (b) NS, no significance (p > 5%); *, significance (5% ≥ p > 1%); **, highly significance (1% ≥ p > 0.1%); ***, very highly significance (p ≤ 0.1%).
Publisher’s Note: MDPI stays neutral with regard to jurisdictional claims in published maps and institutional affiliations.

