
Carbon Footprint: The Case of Four Chicken Meat Products Sold on the Spanish Market

 , ,
, , 
 and
and 
Abstract
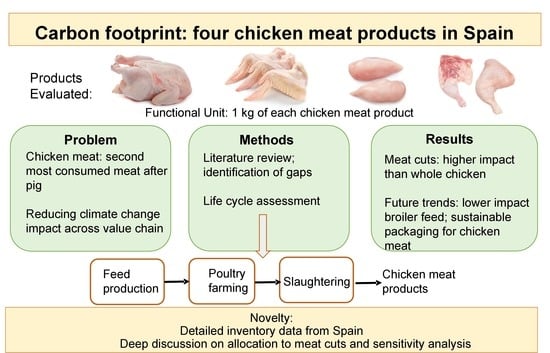
1. Introduction
2. Literature Review of LCA Studies Applied to Chicken Meat Production

| Allocation | Result | ||||||
|---|---|---|---|---|---|---|---|
| Reference | Country | Scope | Functional Unit (FU) | FCR (kg Feed/kg Weight Gain) | Days to Slaughter/ % Mortality | Breeder Farm | kg CO2 eq./kg FU |
| [28] | United States | Cradle-to-farm gate | 1 t live-weight poultry | 1.9 | 48 days NS | 1. Gross chemical energy content 2. Manure replacing chemical fertilisers | 1.39 |
| [7] | United Kingdom | Cradle-to-farm gate | 1000 kg of expected edible carcass | NS | 39 days 3.5% | Economic | 4.41 |
| [27] | Iran | Cradle-to-farm gate | 1 kg live chicken | NS | NS NS | NS | 6.83 |
| [25] | United States | Cradle-to-farm gate | 1000 kg of live poultry and spent hens | 1.94 | 47 days 4% | Biophysical: metabolised energy | 1.28 (in 2010) |
| [30] | Argentina | Only grow-out farm | 1 t live chicken | 2.02 | 49.5 days 6.85% | NA | 2.03–2.22 |
| [29] | Brazil | Only grow-out farm | 1 kg live chicken | 1.89 | 50 days 3.8% | NA | 2.70 |
| [31] | Brazil | Only grow-out farm | 1 kg live chicken | 1.40–1.82 | 28–49 days 3–4% | NA | 1.33–1.56 |
| [32] | Japan | Only grow-out farm | 1 kg live chicken | 1.98 | 52 days NS | NA | 1.86 |
| Allocation | Result | |||||
|---|---|---|---|---|---|---|
| Reference | Country | Scope | Functional Unit (FU) | Breeder Farm | Slaughterhouse | kg CO2 eq./kg FU |
| [34] | Finland | Cradle-to-retail gate | 1000 kg honey-marinated and sliced broiler fillet at retail store | NS | NS | 3.64 |
| [26] | Australia | Cradle-to-retail | 1 t of roast chicken | Economic Economic | Economic Economic | 3.71 |
| 1 t of breast fillet | 9.98 | |||||
| [35] | Reunion Island, France | Cradle-to slaughterhouse gate | 1 t packed whole carcass | 1. Economic 2. Avoiding allocation for manure by substitution. | 1.Economic 2. Avoiding allocation for waste used as fertiliser by substitution | 2.48 |
| [9] | France Brazil | Cradle-to-slaughterhouse gate | 1 t of cooled and packaged chicken | NS NS | NS NS | 3.10 1.99–2.75 |
| [20] | Portugal | Cradle-to-slaughterhouse gate | 1.2 kg of broiler chicken meat | NA | No allocation | 2.46 |
| [36] | Iran | Cradle-to-slaughterhouse gate | 1 t of packed chicken meat | NS | NS | 2.9 (summer)–5.3 (winter) |
| [33] | Italy | Cradle-to-slaughterhouse gate | 1 kg chicken carcass | NA | No allocation | 5.52 |
| [37] | Tunisia | Cradle-to-slaughterhouse gate | 1 kg chicken carcass | NS | NS | 3.3 |
| [8] | Australia | Cradle-to-slaughterhouse gate | 1 kg of chilled chicken (whole bird) | NA NA | Economic Economic | 2.8–3.4 |
| 1 kg of boneless, skinless chicken portions | 3.9–4.79 | |||||
| [38] | Mexico | Cradle-to-slaughterhouse gate | 1 kg chicken carcass | Mass | Mass | 2.79 |
| [10] | Serbia | Cradle-to-grave | 1 kg chicken meat | Mass | Mass | 3.62 |
3. Materials and Methods
3.1. Goal and Scope
3.2. Inventory
3.2.1. Feed Production
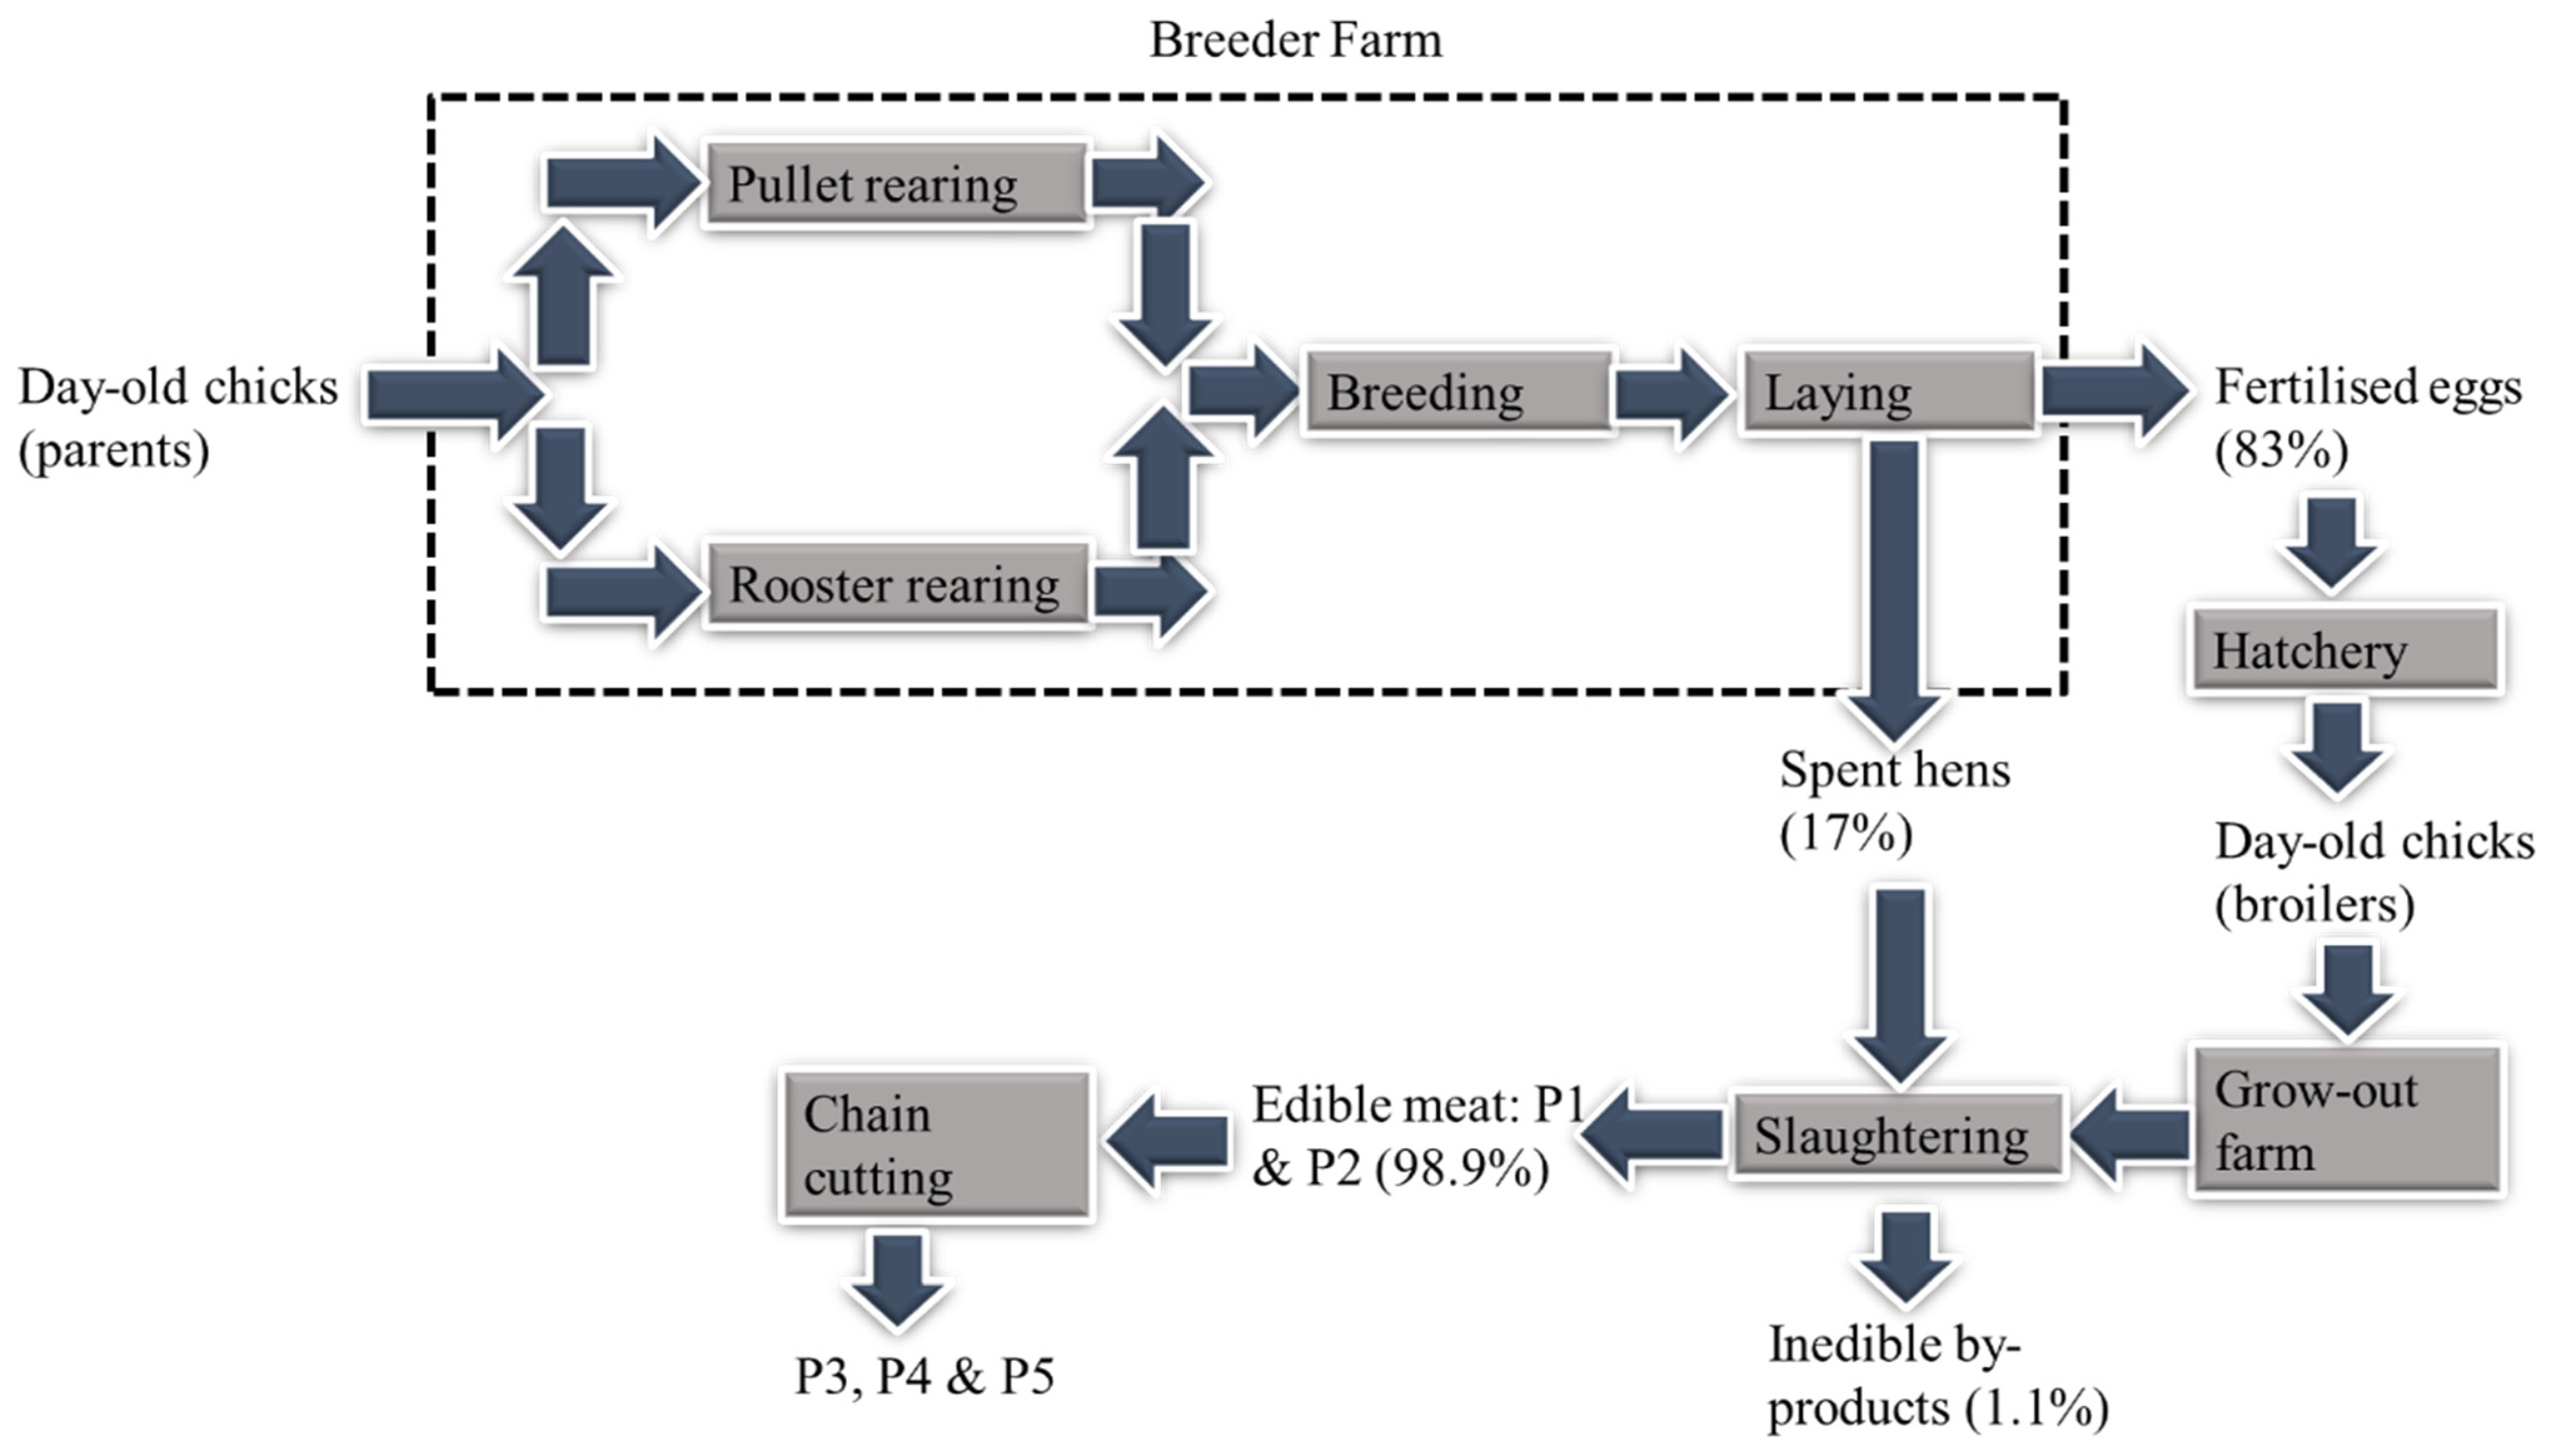
3.2.2. Breeder Farm and Hatchery
3.2.3. Grow-Out Farm and Slaughterhouse
4. Results, Discussion, and Sensitivity Analysis
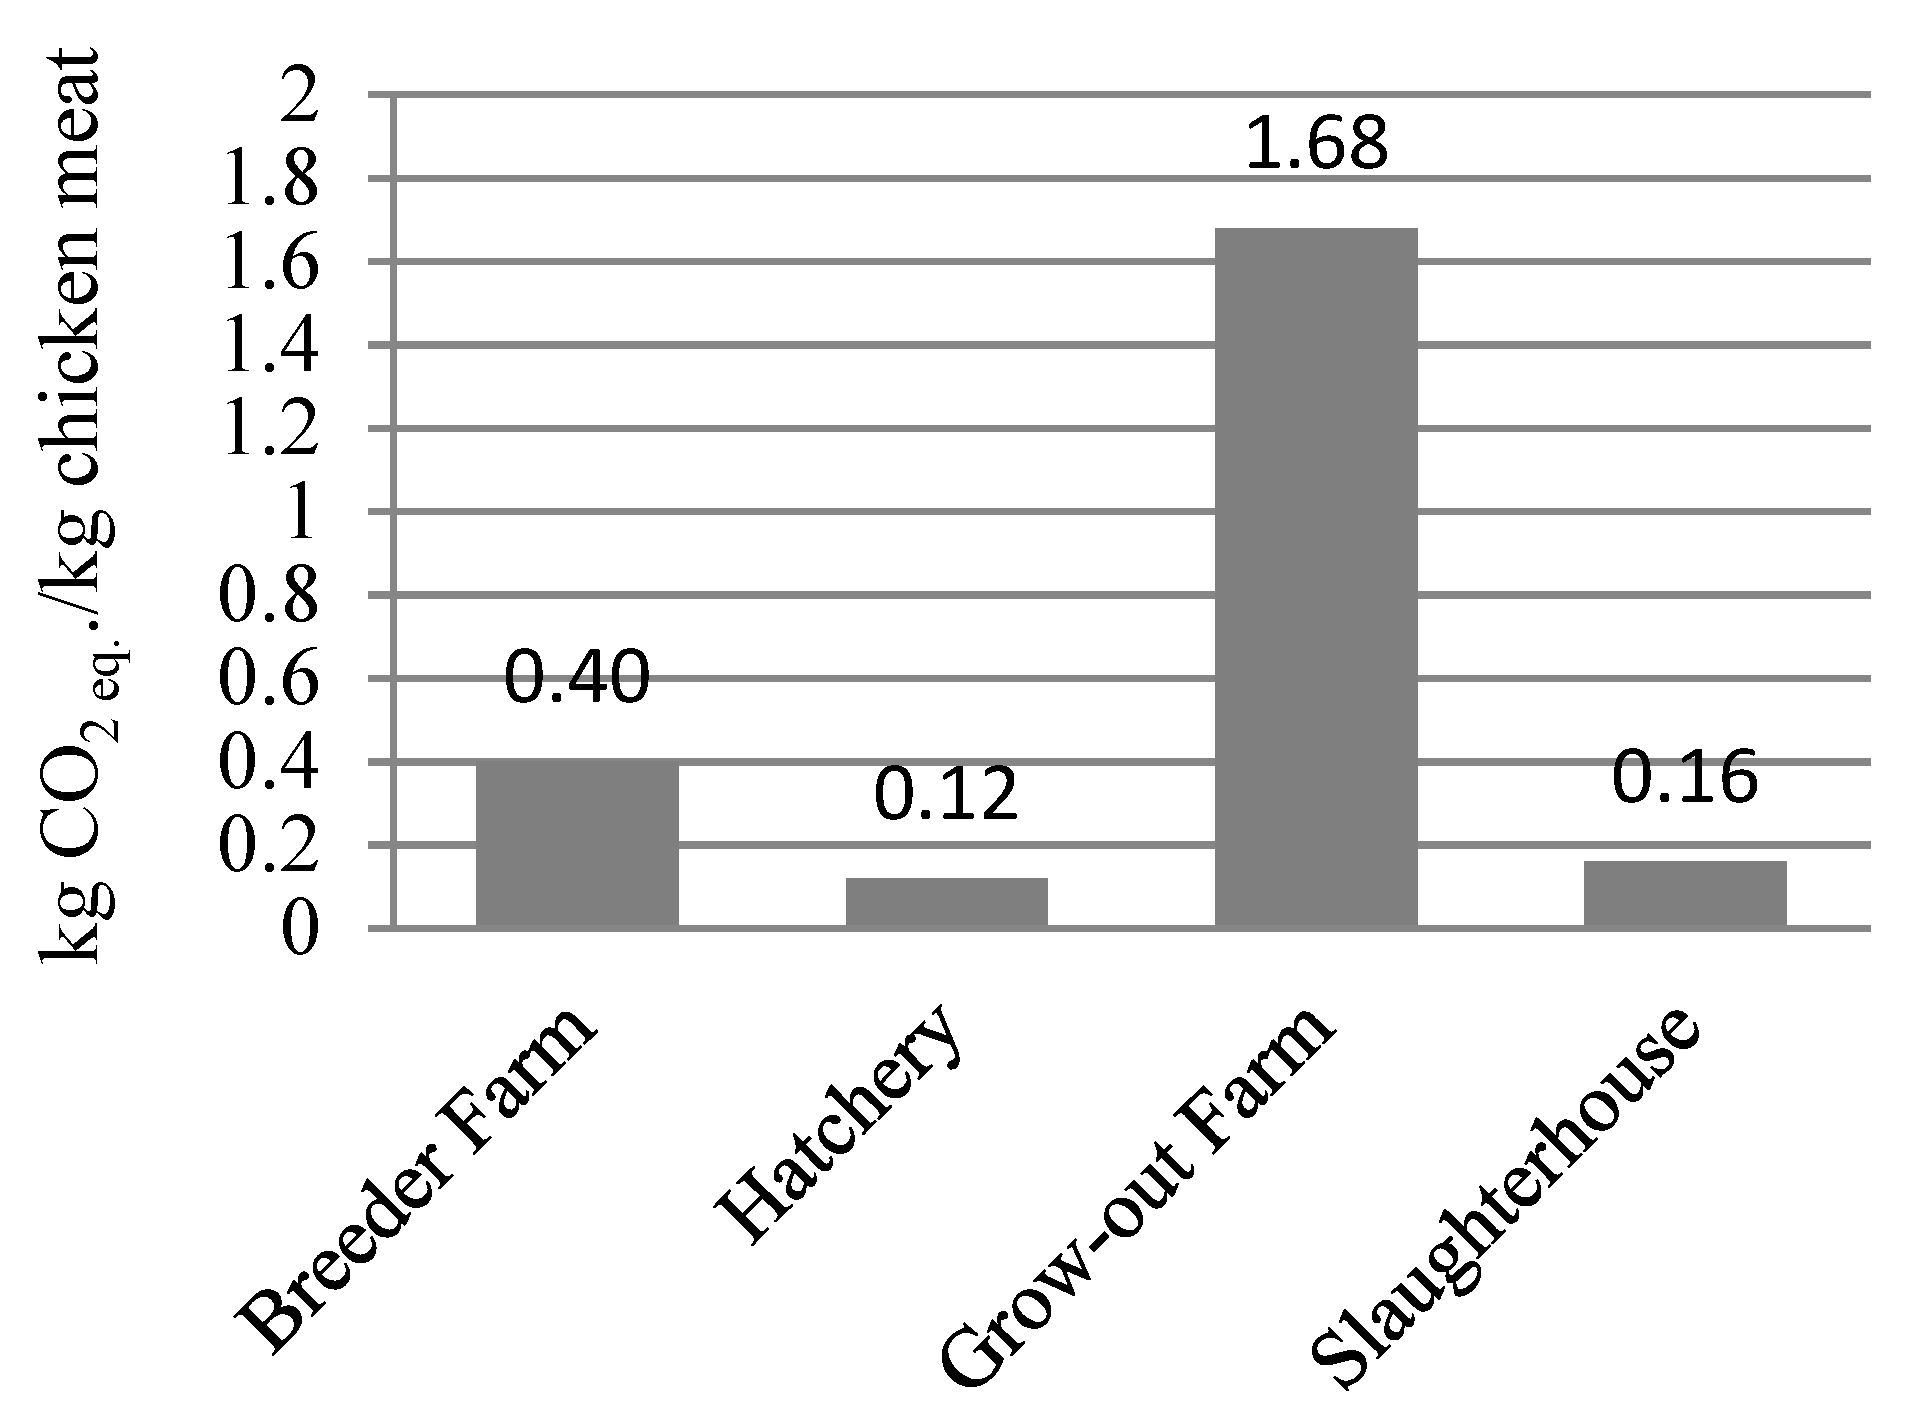
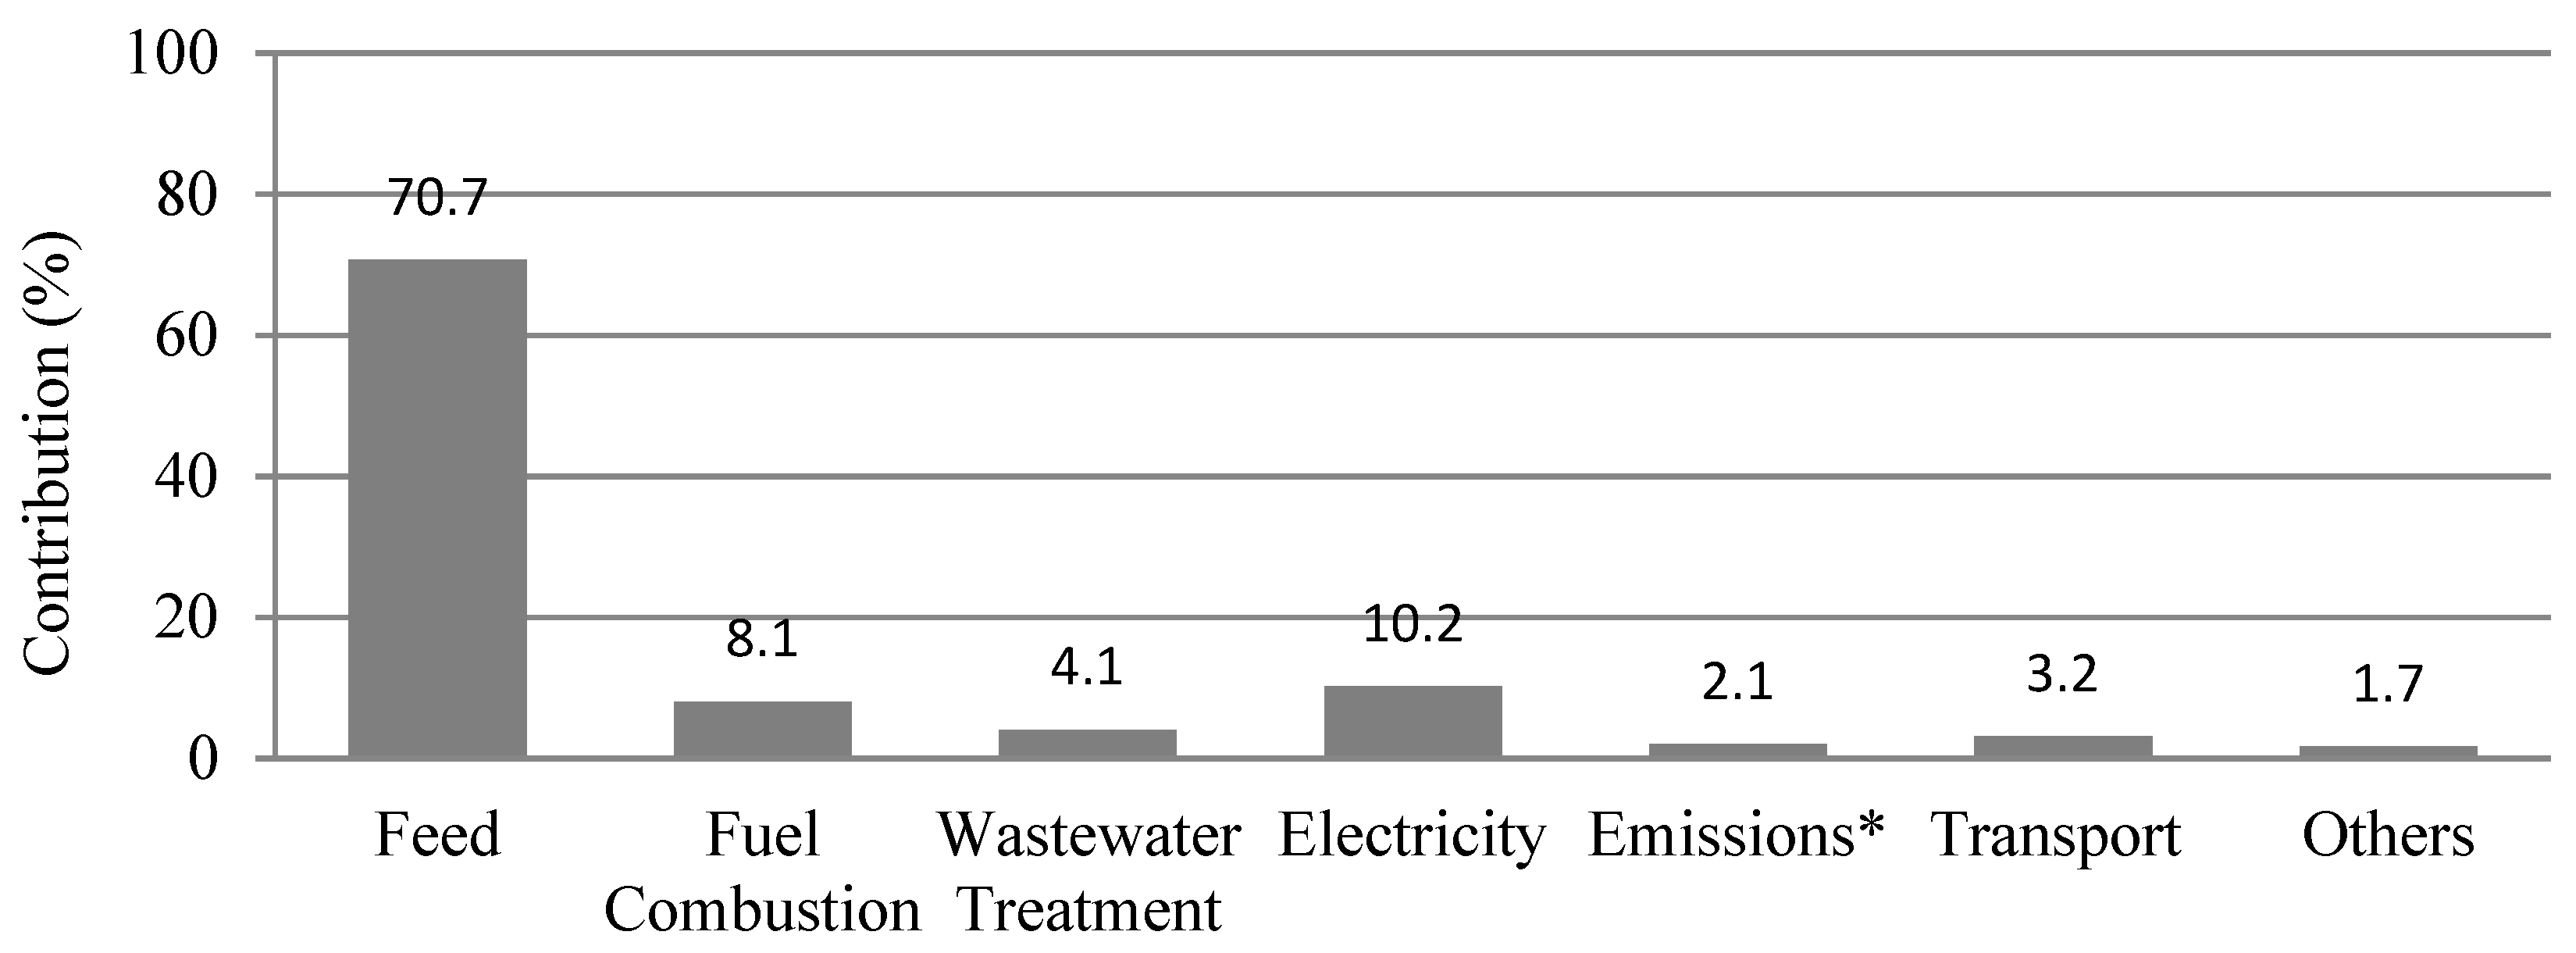
4.1. Results and Discussion: Whole Carcass, without Packaging (P1)
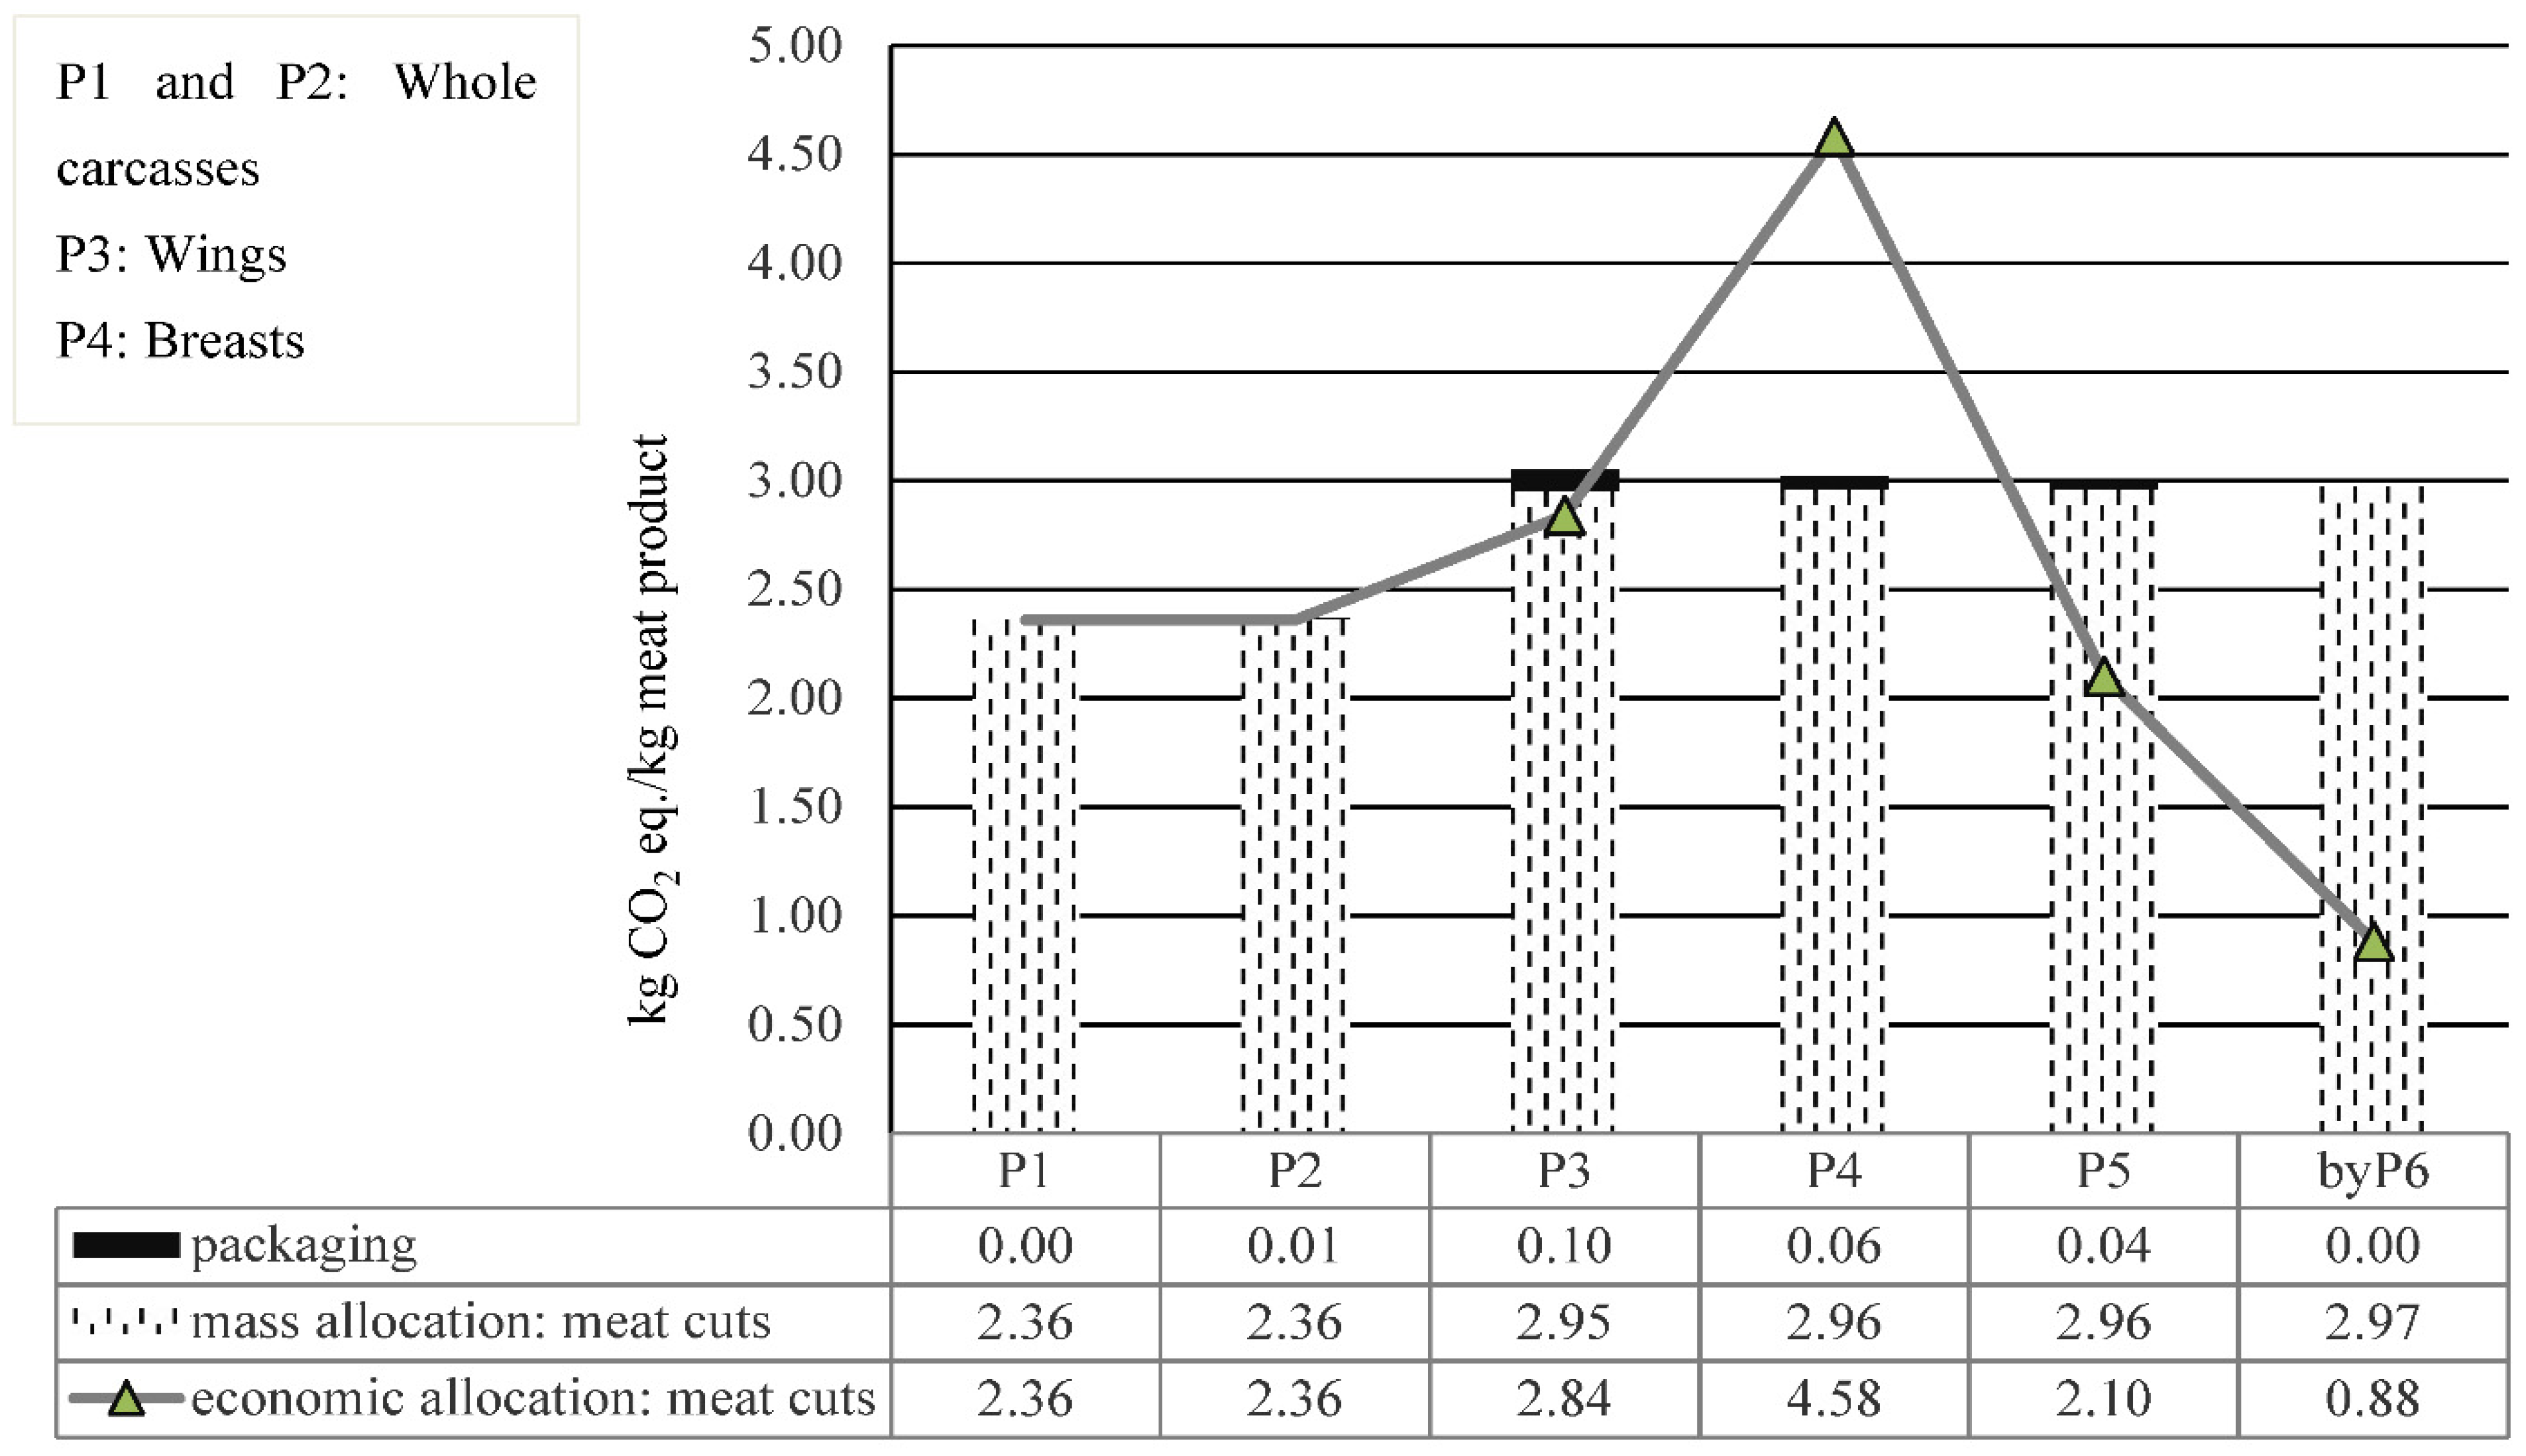
4.2. Results and Discussion: Meat Cuts (P3, P4, P5, and byP6) and Packaging
4.3. Sensitivity Analysis
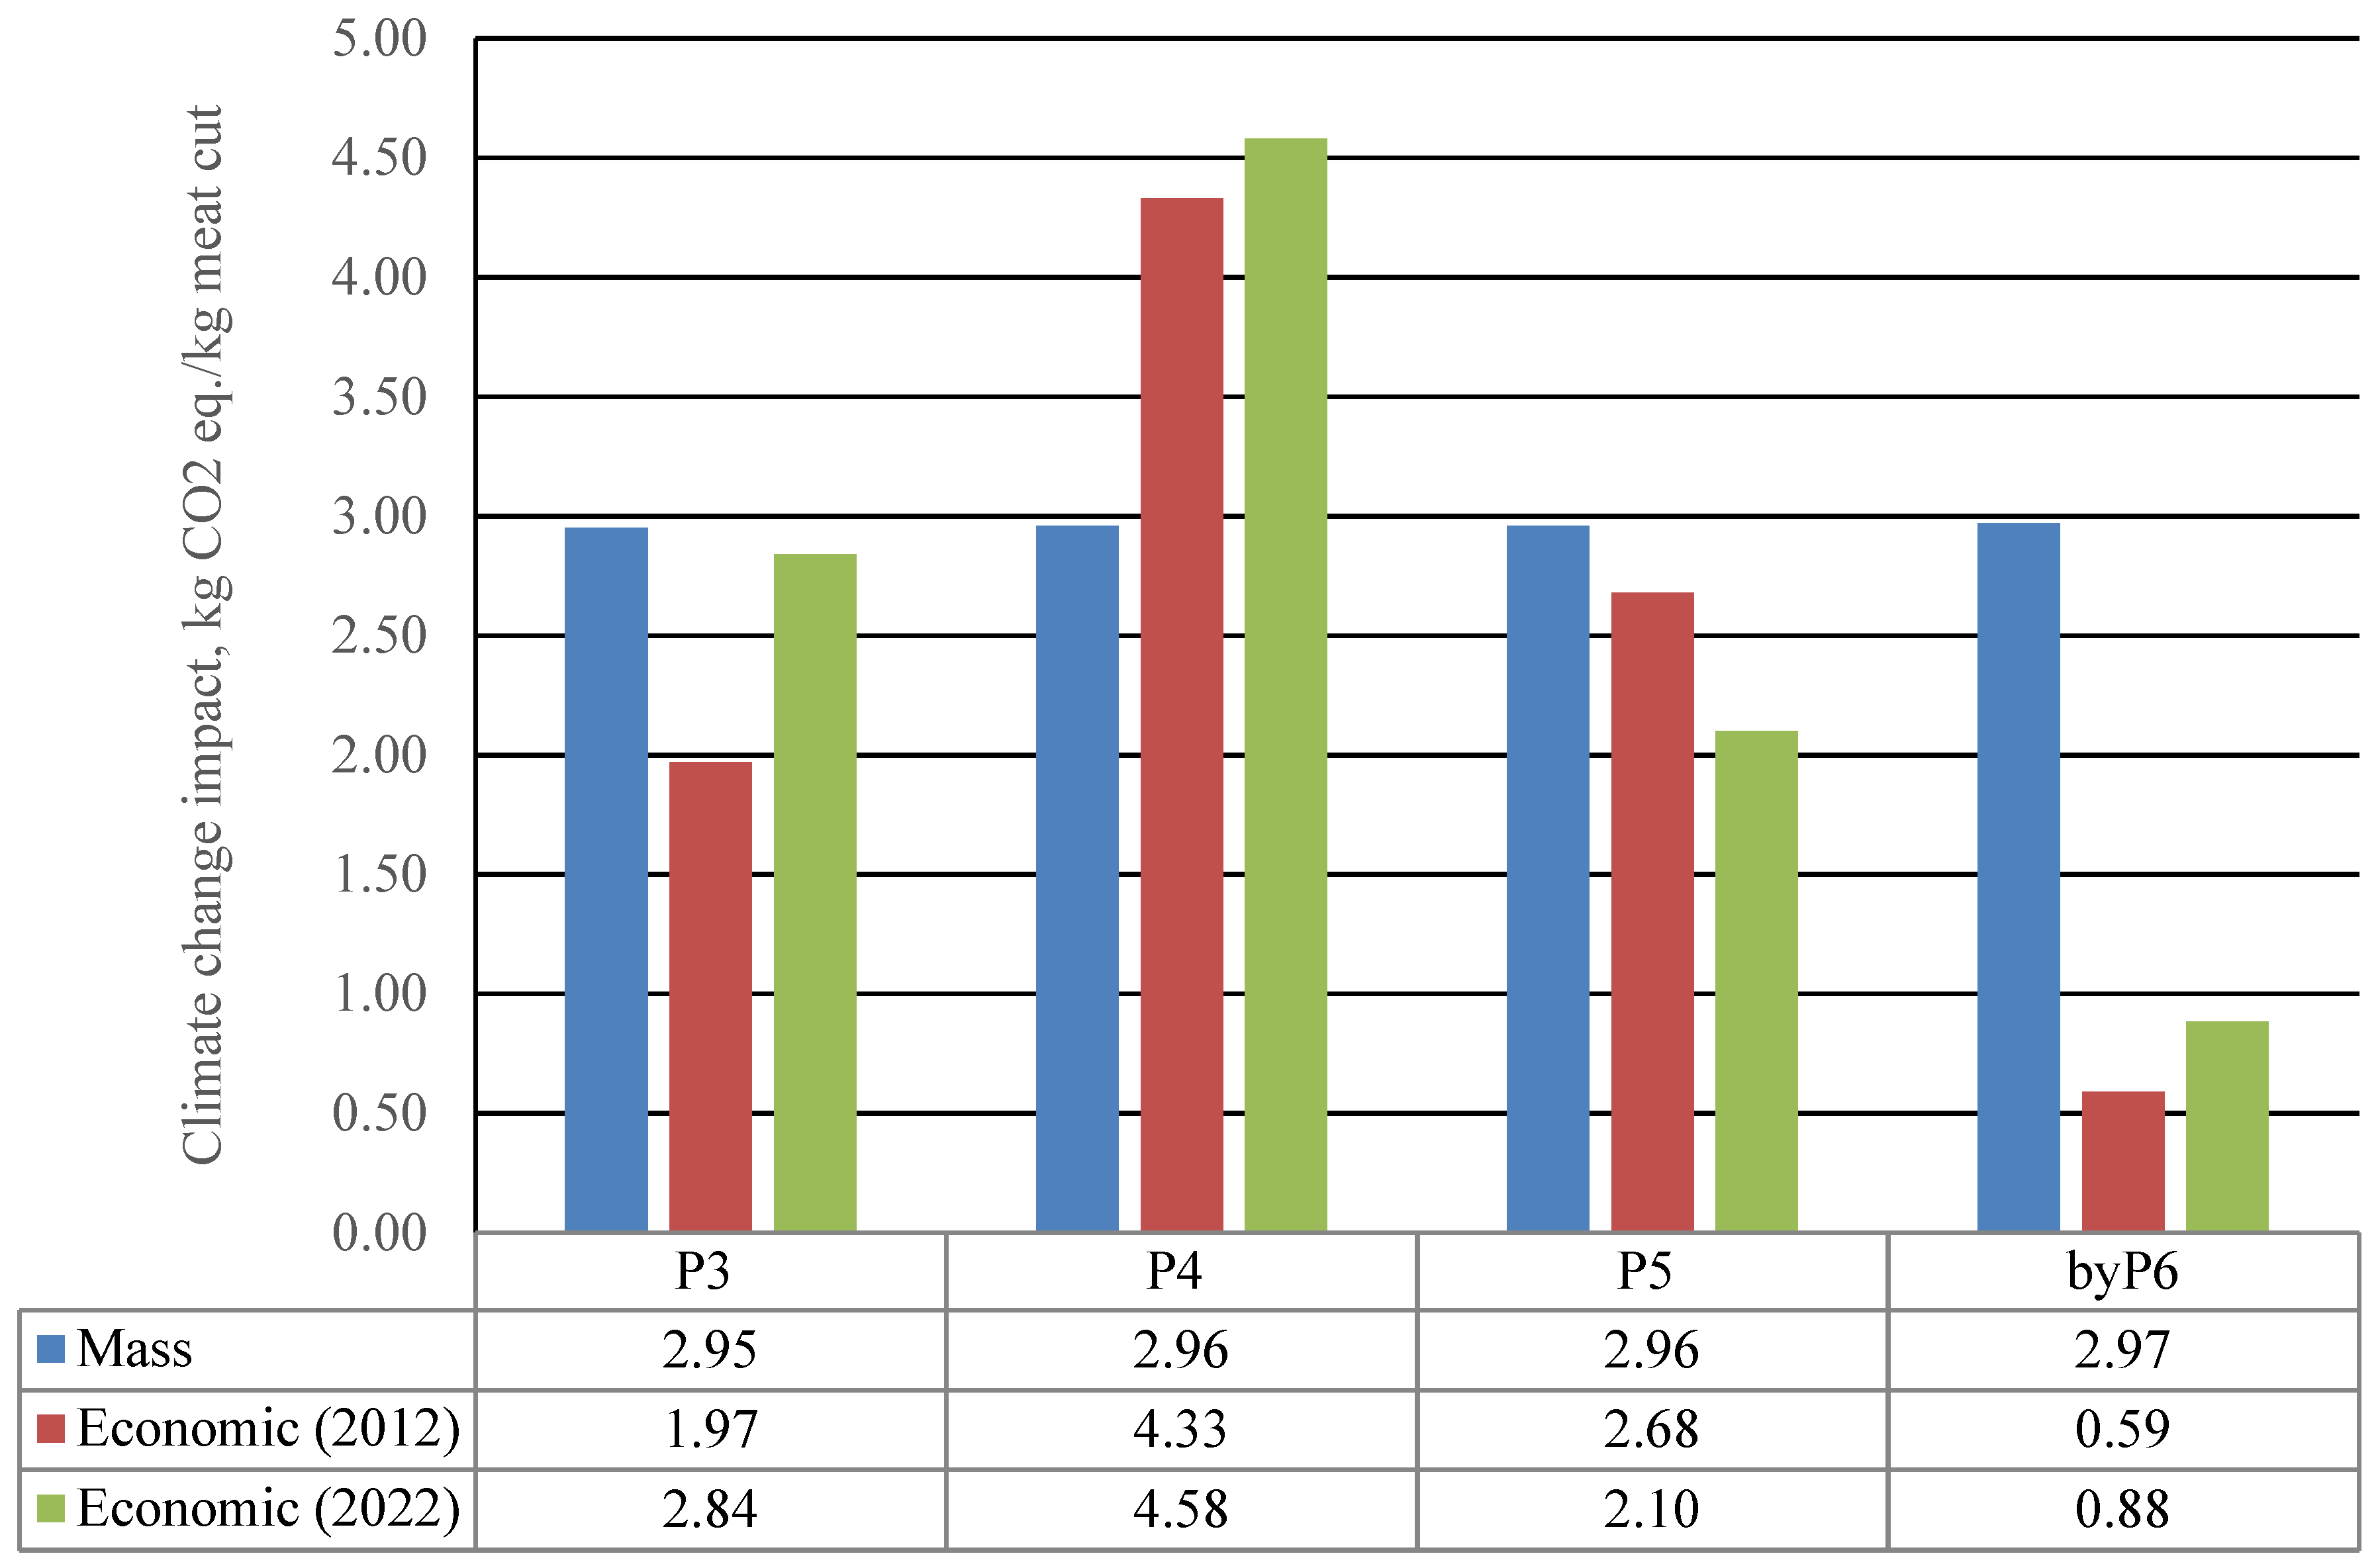
4.3.1. Allocation to Meat Cuts
4.3.2. Food Waste
5. Conclusions and Future Trends
Author Contributions
Funding
Data Availability Statement
Conflicts of Interest
References
- Peyraud, J.-L.; MacLeod, M. Study on Future of EU Livestock: How to Contribute to a Sustainable Agricultural Sector? Final Report; European Commission Directorate-General for Agriculture and Rural Development: Brussels, Belgium, 2020. [Google Scholar]
- EUROSTAT Agricultural Production—Livestock and Meat—Statistics Explained. Available online: https://ec.europa.eu/eurostat/statistics-explained/index.php?title=Agricultural_production_-_livestock_and_meat&oldid=427096#Meat_production (accessed on 6 June 2022).
- European Commission. EU Agricultural Outlook for Market Income 2019–2030; European Commission Directorate-General for Agriculture and Rural Development: Brussels, Belgium, 2019. [Google Scholar]
- European Commission. EU Agricultural Outlook for Markets, Income and Environment, 2020–2030; European Commission Directorate-General for Agriculture and Rural Development: Brussels, Belgium, 2020. [Google Scholar]
- DG AGRI Dashboard: Poultry Meat Broiler. Available online: https://ec.europa.eu/info/sites/default/files/food-farming-fisheries/farming/documents/poultry-meat-dashboard_en.pdf (accessed on 26 October 2021).
- Röös, E.; Patel, M.; Spångberg, J.; Carlsson, G.; Rydhmer, L. Limiting livestock production to pasture and by-products in a search for sustainable diets. Food Policy 2016, 58, 1–13. [Google Scholar] [CrossRef]
- Leinonen, I.; Williams, A.; Wiseman, J.; Guy, J.; Kyriazakis, I. Predicting the environmental impacts of chicken systems in the United Kingdom through a life cycle assessment: Broiler production systems. Poult. Sci. 2012, 91, 8–25. [Google Scholar] [CrossRef] [PubMed]
- Wiedemann, S.; McGahan, E.; Murphy, C. Resource use and environmental impacts from Australian chicken meat production. J. Clean. Prod. 2017, 140, 675–684. [Google Scholar] [CrossRef]
- Da Silva, V.P.; van der Werf, H.; Soares, S.R.; Corson, M. Environmental impacts of French and Brazilian broiler chicken production scenarios: An LCA approach. J. Environ. Manag. 2014, 133, 222–231. [Google Scholar] [CrossRef]
- Skunca, D.; Tomasevic, I.; Nastasijevic, I.; Tomovic, V.; Djekic, I. Life cycle assessment of the chicken meat chain. J. Clean. Prod. 2018, 184, 440–450. [Google Scholar] [CrossRef]
- De Vries, M.; de Boer, I. Comparing environmental impacts for livestock products: A review of life cycle assessments. Livest. Sci. 2010, 128, 1–11. [Google Scholar] [CrossRef]
- ISO 14040; Environmental Management—Life Cycle Assessment—Principles and Framework. International Organisation for Standardisation: Geneva, Switzerland, 2006.
- ISO 14044; Environmental Management—Life Cycle Assessment—Requirements and Guidelines. International Organisation for Standardisation: Geneva, Switzerland, 2006.
- ISO 14067; Greenhouse Gases—Carbon Footprint of Products—Requirements and Guidelines for Quantification. International Organisation for Standardisation: Geneva, Switzerland, 2018.
- Gerber, P.J.; Steinfeld, H.; Henderson, B.; Mottet, A.; Opio, C.; Dijkman, J.; Falcucci, A.; Tempio, G. Tackling Climate Change through Livestock—A Global Assessment of Emissions and Mitigation Opportunities; Food and Agriculture Organization of the United Nations (FAO): Rome, Italy, 2013. [Google Scholar]
- MacLeod, M.J.; Vellinga, T.; Opio, C.; Falcucci, A.; Tempio, G.; Henderson, B.; Makkar, H.; Mottet, A.; Robinson, T.; Steinfeld, H.; et al. Invited review: A position on the Global Livestock Environmental Assessment Model (GLEAM). Animal 2018, 12, 383–397. [Google Scholar] [CrossRef]
- PAS 2050:2011; Specification for the Assessment of the Life Cycle Greenhouse Gas Emissions of Goods and Services. British Standards Institution: London, UK, 2011.
- FAO. Greenhouse Gas Emissions and Fossil Energy Use from Poultry Supply Chains: Guidelines for Assessment; Live-stock Environmental Assessment and Performance Partnership; FAO: Rome, Italy, 2016. [Google Scholar]
- Wiedemann, S.G.; Dunn, J.; Senior, N.; Biggs, L. Nutritional and Environmental Comparison of Chicken and Plant Protein; AgriFutures Australia: Wagga Wagga, NSW, Australia, 2020; ISBN 9781760531324. [Google Scholar]
- González-García, S.; Gomez-Fernández, Z.; Dias, A.C.; Feijoo, G.; Moreira, M.T.; Arroja, L. Life Cycle Assessment of broiler chicken production: A Portuguese case study. J. Clean. Prod. 2014, 74, 125–134. [Google Scholar] [CrossRef]
- Weidema, B.P.; Wesnæs, M.; Hermansen, J.; Kristensen, T.; Halberg, N. Environmental Improvement Potentials of Meat and Dairy Products; Institute for Prospective Technological Studies, JRC European Commission: Seville, Spain, 2008. [Google Scholar]
- MacLeod, M.; Gerber, P.; Mottet, A.; Tempio, G.; Falcucci, A.; Opio, C.; Vellinga, T.; Henderson, B.; Steinfeld, H. Greenhouse Gas Emissions from Pig and Chicken Supply Chains—A Global Life Cycle Assessment; Food and Agriculture Organization of the United Nations (FAO): Rome, Italy, 2013. [Google Scholar]
- Abín, R.; Laca, A.; Laca, A.; Díaz, M. Environmental assesment of intensive egg production: A Spanish case study. J. Clean. Prod. 2018, 179, 160–168. [Google Scholar] [CrossRef]
- Pardo, G.; Ciruelos, A.; López, N.; González, L.; Ramos, S.; Zufía, J. Environmental improvement of a chicken product through Life Cycle Assessment methodology. In Proceedings of the 8th International Conference on Life Cycle Assessment in the Agri-Food Sector (LCA Food 2012), Saint Malo, France, 1–4 October 2012; Corson, M.S., van der Werf, H.M.G., Eds.; INRA: Rennes, France, 2012; pp. 82–87. [Google Scholar]
- Putman, B.; Thoma, G.; Burek, J.; Matlock, M. A retrospective analysis of the United States poultry industry: 1965 compared with 2010. Agric. Syst. 2017, 157, 107–117. [Google Scholar] [CrossRef]
- Bengtsson, J.; Seddon, J. Cradle to retailer or quick service restaurant gate life cycle assessment of chicken products in Australia. J. Clean. Prod. 2013, 41, 291–300. [Google Scholar] [CrossRef]
- Pishgar-Komleh, S.H.; Akram, A.; Keyhani, A.; van Zelm, R. Life cycle energy use, costs, and greenhouse gas emission of broiler farms in different production systems in Iran—A case study of Alborz province. Environ. Sci. Pollut. Res. 2017, 24, 16041–16049. [Google Scholar] [CrossRef] [PubMed]
- Pelletier, N. Environmental performance in the US broiler poultry sector: Life cycle energy use and greenhouse gas, ozone depleting, acidifying and eutrophying emissions. Agric. Syst. 2008, 98, 67–73. [Google Scholar] [CrossRef]
- Lima, N.D.D.S.; Nääs, I.D.A.; Garcia, R.G.; de Moura, D.J. Environmental impact of Brazilian broiler production process: Evaluation using life cycle assessment. J. Clean. Prod. 2019, 237, 117752. [Google Scholar] [CrossRef]
- Arrieta, E.M.; González, A.D. Energy and carbon footprints of chicken and pork from intensive production systems in Argentina. Sci. Total Environ. 2019, 673, 20–28. [Google Scholar] [CrossRef] [PubMed]
- Martinelli, G.; Vogel, E.; Decian, M.; Farinha, M.J.U.S.; Bernardo, L.V.M.; Borges, J.A.R.; Gimenes, R.M.T.; Garcia, R.G.; Ruviaro, C.F. Assessing the eco-efficiency of different poultry production systems: An approach using life cycle assessment and economic value added. Sustain. Prod. Consum. 2020, 24, 181–193. [Google Scholar] [CrossRef]
- Ogino, A.; Oishi, K.; Setoguchi, A.; Osada, T. Life Cycle Assessment of sustainable broiler production systems: Effects of low-protein diet and litter incineration. Agriculture 2021, 11, 921. [Google Scholar] [CrossRef]
- Cesari, V.; Zucali, M.; Sandrucci, A.; Tamburini, A.; Bava, L.; Toschi, I. Environmental impact assessment of an Italian vertically integrated broiler system through a Life Cycle approach. J. Clean. Prod. 2017, 143, 904–911. [Google Scholar] [CrossRef]
- Katajajuuri, J.M.; Grönroos, J.; Usva, K. Environmental Impacts and Related Improvement Options of Supply Chain of Chicken Meat. In Proceedings of the 6th International Conference on LCA in the Agri-Food Sector, Zurich, Switzerland, 12–14 November 2008; pp. 125–126. [Google Scholar]
- Thévenot, A.; Aubin, J.; Tillard, E.; Vayssières, J. Accounting for farm diversity in Life Cycle Assessment studies—The case of poultry production in a tropical island. J. Clean. Prod. 2013, 57, 280–292. [Google Scholar] [CrossRef]
- Kalhor, T.; Rajabipour, A.; Akram, A.; Sharifi, M. Environmental impact assessment of chicken meat production using life cycle assessment. Inf. Process. Agric. 2016, 3, 262–271. [Google Scholar] [CrossRef]
- Ibidhi, R.; Hoekstra, A.; Gerbens-Leenes, W.; Chouchane, H. Water, land and carbon footprints of sheep and chicken meat produced in Tunisia under different farming systems. Ecol. Indic. 2017, 77, 304–313. [Google Scholar] [CrossRef]
- López-Andrés, J.J.; Aguilar-Lasserre, A.A.; Morales-Mendoza, L.F.; Azzaro-Pantel, C.; Pérez-Gallardo, J.R.; Rico-Contreras, J.O. Environmental impact assessment of chicken meat production via an integrated methodology based on LCA, simulation and genetic algorithms. J. Clean. Prod. 2018, 174, 477–491. [Google Scholar] [CrossRef]
- Huijbregts, M.A.J.; Steinmann, Z.J.N.; Elshout, P.M.F.; Stam, G.; Verones, F.; Vieira, M.; Zijp, M.; Hollander, A.; van Zelm, R. ReCiPe2016: A harmonised life cycle impact assessment method at midpoint and endpoint level. Int. J. Life Cycle Assess. 2017, 22, 138–147. [Google Scholar] [CrossRef]
- Goedkoop, M.; Heijungs, R.; Huijbregts, M.A.; de Schryver, A.; Struijs, J.; van Zelm, R. ReCiPe 2008: A Life Cycle Impact Assessment Method Which Comprises Harmonised Category Indicators at the Midpoint and Endpoint Levels_First Edition Characterisation. Available online: https://www.rivm.nl/documenten/a-lcia-method-which-comprises-harmonised-category-indicators-at-midpoint-and-endpoint (accessed on 16 November 2021).
- Sphera Life Cycle Assessment Product Sustainability (GaBi) Software. Available online: https://sphera.com/life-cycle-assessment-lca-software/ (accessed on 18 July 2022).
- Bustillo-Lecompte, C.; Mehrvar, M. Slaughterhouse Wastewater: Treatment, Management and Resource Recovery. In Physico-Chemical Wastewater Treatment and Resource Recovery; Farooq, R., Ahmad, Z., Eds.; IntechOpen: London, UK, 2017; pp. 153–174. [Google Scholar]
- Pulles, T.; Gillenwater, M.; Radunsky, K. CO2 emissions from biomass combustion Accounting of CO2 emissions from biomass under the UNFCCC. Carbon Manag. 2022, 13, 181–189. [Google Scholar] [CrossRef]
- Wang, S.-Y.; Huang, D.-J. Assessment of greenhouse gas emissions from poultry enteric fermentation. Asian Australas. J. Anim. Sci. 2005, 18, 873–878. [Google Scholar] [CrossRef]
- IPCC. 2006 IPCC Guidelines for National Greenhouse Gas Inventories, Prepared by the National Greenhouse Gas Inventories Programme; Eggleston, H.S., Buendia, L., Miwa, K., Ngara, T., Tanabe, K., Eds.; IGES: Hayama, Japan, 2006. [Google Scholar]
- Vellinga, T.V.; Blonk, H.; Marinussen, M.; van Zeist, W.J.; de Boer, I.J.M.; Starmans, D. Methodology Used in FeedPrint: A Tool Quantifying Greenhouse Gas Emissions of Feed Production and Utilization; Wageningen UR Livestock Research: Lelystad, The Netherlands, 2013. [Google Scholar]
- Williams, A.G.; Audsley, E.; Sandars, D.L. Determining the Environmental Burdens and Resource Use in the Production of Agricultural and Horticultural Commodities; Main Report; Defra Research Project IS0205; Cranfield University and Defra: Bedford, UK, 2006.
- Aviagen Optimising Broiler Feed Conversion Ratio. Available online: http://ap.aviagen.com/assets/Uploads/AAServiceBulletinFCRJuly2011.pdf (accessed on 28 October 2021).
- Mainali, B.; Emran, S.B.; Silveira, S. Greenhouse gas mitigation using poultry litter management techniques in Bangladesh. Energy 2017, 127, 155–166. [Google Scholar] [CrossRef]
- Weidema, B. Consequential versus Normative Food LCAs. 2.-0 LCA Consultants. Available online: https://lca-net.com/blog/consequential-versus-normative-food-lcas/ (accessed on 8 June 2022).
- MAPA Resumen Semanal de La Situación de Los Mercados Nacionales. Available online: https://www.mapa.gob.es/es/ganaderia/estadisticas/informesemanalpreciosdeproductosganaderosn11-2022_tcm30-438394.pdf (accessed on 8 June 2022).
- Beretta, C.; Stoessel, F.; Baier, U.; Hellweg, S. Quantifying food losses and the potential for reduction in Switzerland. Waste Manag. 2012, 33, 764–773. [Google Scholar] [CrossRef]
- FAO. Global Food Losses and Food Waste—Extent, Causes and Prevention; FAO: Rome, Italy, 2011. [Google Scholar]
- Hanson, C.; Mitchell, P. The Business Case for Reducing Food Loss and Waste. Champions 12.3. Available online: https://champions123.org/publication/business-case-reducing-food-loss-and-waste (accessed on 17 February 2022).
- Cooreman-Algoed, M.; Boone, L.; Taelman, S.E.; Van Hemelryck, S.; Brunson, A.; Dewulf, J. Impact of consumer behaviour on the environmental sustainability profile of food production and consumption chains—A case study on chicken meat. Resour. Conserv. Recycl. 2021, 178, 106089. [Google Scholar] [CrossRef]
- Heller, M.C.; Selke, S.E.M.; Keoleian, G.A. Mapping the influence of food waste in food packaging environmental performance assessments. J. Ind. Ecol. 2018, 23, 480–495. [Google Scholar] [CrossRef]
- Williams, H.; Lindström, A.; Trischler, J.; Wikström, F.; Rowe, Z. Avoiding food becoming waste in households—The role of packaging in consumers’ practices across different food categories. J. Clean. Prod. 2020, 265, 121775. [Google Scholar] [CrossRef]
- Wikström, F.; Williams, H.; Venkatesh, G. The influence of packaging attributes on recycling and food waste behaviour—An environmental comparison of two packaging alternatives. J. Clean. Prod. 2016, 137, 895–902. [Google Scholar] [CrossRef]
- Van Velzen, E.U.T.; Linnemann, A. Modified atmosphere packaging of fresh meats–sudden partial adaptation caused an increase in sustainability of dutch supply chains of fresh meats. Packag. Technol. Sci. 2007, 21, 37–46. [Google Scholar] [CrossRef]


| Product ID | Chicken Meat Product | Packaging Type |
|---|---|---|
| P1 | Whole carcass | No packaging |
| P2 | Whole carcass | PE bag |
| P3 | Chicken wings | PET tray with PET film |
| P4 | Chicken breasts | PP-PA bag |
| P5 | Chicken leg quarters | PS-PVC tray with PVC film |
| Product | Mass (kg/Whole Carcass) | €/kg (Year: 2022) | Allocation | |
|---|---|---|---|---|
| Mass (%) | Economic (%) | |||
| P3 (wings) | 0.21 | 4.42 | 13.5 | 13.0 |
| P4 (breasts) | 0.54 | 6.95 | 35.5 | 55.0 |
| P5 (leg quarters) | 0.62 | 3.25 | 40.9 | 29.0 |
| byP6 (edible offal) | 0.51 * | 1.24 * | 10.1 | 3.0 |
| Life Cycle Inventory | Values | |
|---|---|---|
| Inputs | Breeder Farm | Hatchery |
| Day-old chicks (Parents) | 5.17 × 10⁻³ | - |
| Feed, kg | 2.56 × 10⁻¹ | - |
| Electricity, kWh | 1.34 × 10⁻² | 9.59 × 10⁻² |
| Propane, kg | 8.93 × 10⁻⁴ | 7.61 × 10⁻⁴ |
| Diesel, kg | 1.17 × 10⁻³ | 1.01 × 10⁻⁴ |
| Water, kg | 6.45 × 10⁻¹ | 3.47 × 10⁻¹ |
| Bedding (wood shaving/rice husk), kg | 3.82 × 10⁻³ | - |
| Cleaning and disinfection, kg | 2.08 × 10⁻³ | 2.34 × 10⁻³ |
| Transport, tonne-kilometre (tkm) | 6.58 × 10⁻² | 2.96 × 10⁻² |
| Outputs | ||
| Day-old broiler chick (~40 g) | - | 5.61 × 10⁻¹ |
| Wastes: | ||
| Wastewater, m3 | 6.50 × 10⁻⁴ | 2.92 × 10⁻⁴ |
| Rendering material, kg | 2.18 × 10⁻³ | - |
| SANDACH *, kg | - | 3.20 × 10⁻² |
| Sewage sludge, kg | - | 5.41 × 10⁻³ |
| Emissions (manure and enteric fermentation): | ||
| Methane (CH4), kg | 1.35 × 10⁻⁵ | - |
| Nitrous oxide (N2O), kg | 3.22 × 10⁻⁶ | - |
| Name | Value |
|---|---|
| Yearly production, birds | 24,000,000 |
| Initial weight, g | 40 |
| Final weight, g | 2590 |
| Average days to maturity, days | 44.5 |
| Mortality (%) | 5.47 |
| Feed conversion ratio (FCR) | 1.70 * |
| Life Cycle Inventory | Values | |
|---|---|---|
| Inputs | Grow-Out Farm | Slaughterhouse |
| Broiler chicks | 5.61 × 10⁻¹ | - |
| Broilers | - | 5.30 × 10⁻¹ |
| Feed, kg | 3.04 × 10 | - |
| Electricity, kWh | 9.12 × 10⁻² | 1.94 × 10⁻¹ |
| Natural gas, kg | - | 1.10 × 10⁻² |
| Propane, kg | 2.44 × 10⁻² | - |
| Diesel, kg | 1.94 × 10⁻³ | 3.42 × 10⁻⁴ |
| Biomass, kg | 3.88 × 10⁻² | - |
| Bedding (wood shaving/straw/rice husk), kg | 1.22 × 10⁻¹ | - |
| Water, kg | 6.14 × 10 | 5.66 × 10 |
| Refrigerant (ammonia: NH3), kg | - | 2.79 × 10⁻⁵ |
| Cleaning and disinfection, kg | 1.59 × 10⁻² | 1.97 × 10⁻³ |
| Transport, tonne-kilometre (tkm) | 8.48 × 10⁻¹ | 1.73 × 10⁻² |
| Outputs | ||
| Chicken meat (whole carcass), kg | - | 1.00 × 10 |
| Inedible by-products*, kg | - | 3.76 × 10⁻¹ |
| Wastes: | ||
| Rendering material, kg | 7.95 × 10⁻² | - |
| Wastewater, m3 | 1.75 × 10⁻³ | 5.56 × 10⁻³ |
| Sewage sludge, kg | - | 4.38 × 10⁻² |
| Emissions (manure and enteric fermentation): | ||
| Methane (CH4), kg | 9.13 × 10⁻⁵ | - |
| Nitrous oxide (N2O), kg | 1.54 × 10⁻⁴ | - |
| Allocation Type | |||||
|---|---|---|---|---|---|
| Mass | Economic | ||||
| 2012 | 2022 | ||||
| Product ID | Allocation (%) | Average Price per kg (€/kg) | Allocation (%) | Average Price per kg (€/kg) | Allocation (%) |
| P3 | 13.5 | 1.97 | 9.0 | 4.42 | 13.0 |
| P4 | 35.5 | 4.40 | 52.0 | 6.95 | 55.0 |
| P5 | 40.9 | 2.71 | 37.0 | 3.25 | 29.0 |
| byP6 | 10.1 | 0.52 | 2.0 | 1.24 | 3.0 |
Publisher’s Note: MDPI stays neutral with regard to jurisdictional claims in published maps and institutional affiliations. |
© 2022 by the authors. Licensee MDPI, Basel, Switzerland. This article is an open access article distributed under the terms and conditions of the Creative Commons Attribution (CC BY) license (https://creativecommons.org/licenses/by/4.0/).
Share and Cite
Tetteh, H.; Bala, A.; Fullana-i-Palmer, P.; Balcells, M.; Margallo, M.; Aldaco, R.; Puig, R. Carbon Footprint: The Case of Four Chicken Meat Products Sold on the Spanish Market. Foods 2022, 11, 3712. https://doi.org/10.3390/foods11223712
Tetteh H, Bala A, Fullana-i-Palmer P, Balcells M, Margallo M, Aldaco R, Puig R. Carbon Footprint: The Case of Four Chicken Meat Products Sold on the Spanish Market. Foods. 2022; 11(22):3712. https://doi.org/10.3390/foods11223712
Chicago/Turabian StyleTetteh, Harrison, Alba Bala, Pere Fullana-i-Palmer, Mercè Balcells, María Margallo, Rubén Aldaco, and Rita Puig. 2022. "Carbon Footprint: The Case of Four Chicken Meat Products Sold on the Spanish Market" Foods 11, no. 22: 3712. https://doi.org/10.3390/foods11223712
APA StyleTetteh, H., Bala, A., Fullana-i-Palmer, P., Balcells, M., Margallo, M., Aldaco, R., & Puig, R. (2022). Carbon Footprint: The Case of Four Chicken Meat Products Sold on the Spanish Market. Foods, 11(22), 3712. https://doi.org/10.3390/foods11223712