Article

E-nose, E-tongue Combined with GC-IMS to Analyze the Influence of Key Additives during Processing on the Flavor of Infant Formula

1
College of Animal Science, Xinjiang Agriculture University, Urumchi 830091, China
2
Key Laboratory of Quality & Safety Control for Milk and Dairy Products of Ministry of Agriculture and Rural Affairs, Institute of Animal Sciences, Chinese Academy of Agricultural Sciences, Beijing 100193, China
3
State Key Laboratory of Animal Nutrition, Institute of Animal Sciences, Chinese Academy of Agricultural Sciences, Beijing 100193, China
*
Authors to whom correspondence should be addressed.
Foods 2022, 11(22), 3708; https://doi.org/10.3390/foods11223708
Submission received: 9 October 2022 / Revised: 7 November 2022 / Accepted: 14 November 2022 / Published: 18 November 2022

Abstract

:
In order to analyze the influence of key additives during processing on the flavor of infant formula, the headspace-gas chromatography-ion mobility spectrometry, electronic tongue, and electronic nose techniques were used to evaluate flavor during the processing of stage 1 infant formula milk powder (0–6 months), including the analysis of seven critical additives. A total of 41 volatile compounds were identified, involving 12 aldehydes, 11 ketones, 9 esters, 4 olefins, 2 alcohols, 2 furans, and 1 acid. The electronic nose metal oxide sensor W5S had the highest response, followed by W1S and W2S, illustrating that these three sensors had great effects on distinguishing samples. The response results of the electronic tongue showed that the three sensory attributes of bitter, salty, and umami, as well as the richness of aftertaste, were more prominent, which contributed significantly to evaluating the taste profile and distinguishing among samples. Raw milk is an essential control point in the flavor formation process of stage 1 infant formula milk powder. Demineralized whey powder is the primary source of potential off-flavor components in hydrolyzed milk protein infant formula. This study revealed the quality characteristics and flavor differences of key additives in the production process of stage 1 infant formula milk powder, which could provide theoretical guidance for the quality control and sensory improvement of the industrialized production of infant formula.

1. Introduction

Flavor is one of the main drivers for consumer food preference [1]. In dairy products, flavor chemistry is used to uncover the process of flavor perception by finding specific compounds responsible for specific odors, tastes, or chemical aesthetics [2,3]. Infancy is the first critical period for growth and development. The taste development in early infants is closely related to the food composition during pregnancy and lactation, which also affects the food exposure degree and the ability of accepting food during childhood [4,5,6]. In addition, the effect of taste experience on later physiology and behavior in early postnatal development has been verified by animal experiments [7]. The taste stimulation for infants, which is brought by amniotic fluid, breast milk, and formula powder, plays a vital part in the subsequent feeding degree and dietary preferences of infants. Breast milk has a comprehensive nutritional composition and is the most ideal food for newborn babies. However, due to the insufficient breast milk of many mothers, stage 1 infant formula milk powder is one of the food sources for infants with incomplete development of digestion and absorption functions. Therefore, it is particularly important to study the flavor substances of infant formula milk powder.
In the process of evaluating flavor at the molecular level, gas chromatography–mass spectrometry (GC-MS) is frequently used for the identification of volatile organic compounds in dairy. Compared with this traditional method, headspace-gas chromatography-ion mobility spectrometry (HS-GC-IMS), which is an emerging technology, has many advantages, such as low detection limit, fast pretreatment, and intuitive analysis [8,9]. It also enables the visual analysis of volatile components, establishment of fingerprints, and separation of isomers [10,11]. Electronic tongue (E-tongue) and electronic nose (E-nose) can simulate the olfactory system and gustatory perceptions of humans, both consisting of an array of sensors and suitable pattern recognition [12,13]. They are often used in the food industry for food assessment and to differentiate the sensory quality by describing the overall odors and the nuances in taste [11]. The application of intelligent sensory analysis compensates for the individual differences among human subjects and expands the application scope of descriptive sensory analysis. For samples that cannot be tasted directly, analytical conditions are available.
Research on the flavor of infant formula milk powder has mainly focused on the lipid oxidation [14,15], the hydrolysis of milk protein [16,17,18,19,20], different breeds or raw materials [21], and the difference between infant formula milk powder and breast milk [22,23]. However, factors that may affect the flavors of milk powder products are speculated. Stage 1 infant formula is supplement nutrition for newborn babies aged 0–6 months. Compared with the infant formulas in other stages, the added supplements and the aroma components are simpler. By analyzing the basic products, not only can the importance of raw materials be better understood, basic data support for subsequent research is also provided.
In this study, we obtained all the added ingredients in the production of stage 1 infant formula and discussed the sensory quality differences between key additives through GC-IMS combined with intelligent sensory technology (electronic nose and electronic tongue). The purposes of this study were to investigate the evolution of flavor during processing, speculate the factors that may affect the sensory quality of infant formula milk powder products, which might provide reference for flavor quality control in the production process, and present new insights into improving milk powder aroma.

2. Materials and Methods

2.1. Samples

Samples from various milk powder processing stages were obtained for analysis at a large dairy company in China. A total of seven key original supplementary materials were collected from the stage 1 infant formula production process. There was raw milk (RM), pasteurized milk (PM), demineralized whey (DW), demineralized whey powder (DWP), hydrolyzed whey protein powder (HWP), whey protein powder supplemented with alpha lactalbumin (WPA), and infant formula (IF). All the samples were stored at −20 °C until testing.

2.2. GC–IMS Analysis

Analyses of flavor components were performed on a GC-IMS Flavor Spec (G.A.S, Beijing, China). The chromatographic column used for the analyses was a non-polar capillary column MXT-5 (15 m × 0.53 mm × 1.0 μm). Samples of 3 mL were placed in 20 mL headspace vials. The samples were incubated at 40 °C for 30 min and rotated at 500 rpm during incubation.
The column temperature was kept at 60 °C. Nitrogen (99.999%) was used as the carrier gas. The flow rate was first set at 2 mL/min for 2 min, then increased to 10 mL/min within 8 min, then increased to 100 mL/min within 10 min, and finally increased to 150 mL/min within 10 min and held for 5 min.

2.3. E-nose Analysis

Volatile flavor was analyzed using a PEN 3 electronic nose (Airsense Analytics Inc., Schwerin, Germany) with ten metal oxide conductivity gas sensors. They consisted of a sample acquisition system, a metal oxide sensor array, a data acquisition system, and a Win Muster signal processing software. The main groups were detected, and the corresponding ranges of sensitive gases are shown in Table 1.
The 8.0 mL sample was placed into a 20 mL headspace vial. The incubation temperature was 40 °C ± 2 °C, and equilibration was carried out at a speed of 960 rpm/min for 300 s. The E–nose was applied with a detection time of 200 s, a cleaning time of 300 s, and an injection flow rate of 300 mL/min. After each sample analysis, the system was purged with filtered air for 300 s before the next sample injection to reestablish the instrument baseline. To ensure the accuracy of the E-nose test results, three groups were performed in parallel, and stable data were selected for statistical analysis during the measurement process.

2.4. E-tongue Analysis

E-tongue analysis was operated using the Taste-Sensing System SA 402B (Intelligent Sensor Technology Co., Ltd., Atsugi, Japan). The E-tongue device was equipped with 5 sensors (CT0, CA0, C00, AE1, and AAE) that were sensitive to the sour, salty, umami, bitter, and astringent tastes of the sample (Table 2). They also rated bitter aftertaste, astringent aftertaste, and richness.
The samples were first thawed at room temperature, properly diluted, and filtered through double-layer gauze. The taste sensors and reference electrodes of the E-tongue were pre-activated for more than 24 h. A 30 mL sample was added into a special sample cup in duplicate. The sample was measured repeatedly more than 4 times. After filtering and correcting the data, E-tongues turned electrical signals into relish signals to reflect the taste information of the sample through built-in plug-ins. They calculated the theoretical charge density at the membrane surface using the Gouy–Chapman theory and the Poisson–Boltzmann equation and then investigated the lipid/polymer membrane’s responses to sour, umami, salty, bitter, astringent, richness, bitter aftertaste, and astringent aftertaste.

2.5. Statistical Analysis

Volatile substance data was performed using the LAV software (version 2.2.1), GC-IMS Library Search, Reporter plugin, Gallery plot plugin, and Dynamic PCA plugin in GC-IMS. The odor profile and taste attribute scores of the samples were calculated using excel. The taste profile and principal component analysis of the samples were analyzed using the plugin of the E-tongue. Correlation analysis was performed using The Unscrambler X×10.4. Thermographic analysis was drawn through Prism.

3. Results and Discussion

3.1. Volatile Organic Compounds Result

The volatile components in the original supplementary material samples at whole processing stages were carried out by GC-IMS. The retention time and migration time were combined for qualitative analysis. The 3D topographic map can intuitively express the difference (Figure 1A). The volatile organic compound types in the critical additives were slightly similar, but the signal intensities were quite different. The volatile organic components of the 2D topographic plots of the critical additions at whole processing stages are shown in Figure 1B. The background of the GC-IMS spectra is blue, and the red vertical line at abscissa 1.0 is the reactive ion peak (RIP) after normalization. In the topographic plot, the ordinate represents the retention time (s) of the gas chromatogram, and the abscissa represents the ion migration time. The colors indicate the signal strength of the compounds, with the white color as the lower concentration and the red color as the higher concentration; the intensity increases as the color deepens. After the data was normalized, each point on the right side of the reactive ion peak marked a volatile flavor substance or its dimer [25,26].
The Figure 1 shows that most of the differences are reflected in the first 300 s of the analysis. The main components of the difference are small molecules and low boiling-point compounds, which can quickly separate and analyze the peaks in the chromatographic column. Figure 1B compares demineralized whey powder, hydrolyzed whey protein powder, and whey protein powder supplemented with alpha lactalbumin samples; the amount and color of speckles in raw milk, pasteurized milk, and demineralized whey samples were more significantly intense, which indicated that both the quantity and content of volatile constituents were higher. Raw milk sample was used as a guide in Figure 1C, and the topographic plot of the other six critical additions were subtracted from the base value. The background is shown in white after subtracting the same components. However, red represents the higher concentration of the volatile component, and lower values are indicated by blue [27,28].
The volatile compounds in the seven key original supplementary materials were qualitatively performed using the spectral library with GC-IMS. The identities of the compounds were determined using double comparisons of retention time and migration time (Table 3). There were altogether 41 flavor compounds that were identified, including the monomer and its polymer, 12 aldehydes, 2 alcohols, 11 ketones, 9 esters, 4 olefins, 1 acid, and 2 furans. It was detected that one analyte might produce multiple signals, which included protonated monomers and proton-bound dimers or trimers [28]. IMS provided the second separation of compounds that was closely related to the high proton affinity or concentration of the compounds in the analytes [27,28]. Some high concentration components were performed by both monomer and dimer forms, such as 2-heptanone, ethyl hexanoate, heptane, and beta-Pinene.
To clarify the variances in the compositions of volatile compounds, all peaks were selected for fingerprint comparisons (Figure 2). Each row in the fingerprint spectrum represents a signal peak in the total chosen for analysis, and each column represents the signal response of the same volatile substances in the samples.
The substances in the A region could be used as the characteristic of raw milk for its higher content. There were ethyl caproate, ethyl butyrate, ethyl caprylate, butyl acetate, 2,3-butanedione, ethanol, ethyl propionate, ethyl pentanoate, and acetone. Esters can be synthesized by alcoholysis or chemical esterification of fatty acids and alcohols [29]. For example, it has been reported that ethyl butyrate was obtained by esterification of butyric acid with ethanol. Esters are unique flavor components in raw milk, usually described as sweet and fruity. It is considered a flavor description that positively contributes to the sensory quality and weakens the pungent taste of fatty acids and the bitter taste of amino groups [30,31,32].
There was a high imprint similarity between raw milk and pasteurized milk. The substances in the B region were the unique components with high contents in pasteurized milk. These differential components were mainly caused by thermal processing. As a result of the limitations of the GC-IMS spectral library, the substances in the B region were difficult to qualitatively analyze. It was reported that these compounds may be aldehydes, ketones, or sulfur-containing compounds, such as carbon disulfide (CS2), hydrogen sulfide (H2S), and dimethyl sulfide (DMS), etc. They act as aroma components and precursors in reactions, producing more complex aroma compounds [33,34,35].
The volatile compounds, which were detected in demineralized whey, included a variety of components, mainly phenylacetaldehyde, β-pinene, methyl heptanoate, pentanol, isobutyraldehyde, isobutyl acetate, 4-methyl-2-pentanone, 2-acetyl furan, 3-methyl butyric acid, and 3-methyl butyraldehyde. They had the strongest specificity and played an important role in distinguishing demineralized whey from other samples, including a variety of components, mainly phenylacetaldehyde and β-pinene. Aldehydes are typically formed from amino acids, converted into intermediate imines by enzymatic transacylation, and then decarboxylated or degraded by Strecker [35,36]. These compounds usually have lower thresholds and more significant impacts on the overall flavor.
The substances marked in the C region were unique components with high contents in hydrolyzed whey protein powder, including 2-octanone, 2-heptanone, and α-phellandrene. Breast milk and infant formula are rich in lipid-derived volatile compounds, consisting mainly of carbonyl and alcohol compounds. Infant formula contains more heat-treatment-related volatiles than breast milk [14,16], and terpenes are common in formula and breast milk [17,22]. Carbonyl compounds, such as 2-ketones and aldehydes, are thought to be the crucial aromatic components in milk. They are often described as specific aromas even at lower thresholds, such as fishy, rancid, paint-like, soapy, metallic, green, and fruity [18]. When the content exceeds a certain value, it will have an oxidation and spoilage odor, with negative impacts on the flavor. The compounds marked in area D are used to distinguish the hydrolyzed whey protein powder sample from the others. However, these compounds are not accurately qualitative in the GC-IM spectrum library. Therefore, we only marked signals in the spectrum but gave no accurate material information.
As shown in the E region, the contents of (E)-2-decenal, ethyl 3-methylbutyrate, and valeraldehyde in whey protein powder supplemented with alpha lactalbumin were higher than those of the other sample groups. It has been reported that (E)-2-Decenal contributes to the fat taste in infant formula but produces an unpleasant jarring taste when present at high levels, which can be used as an indicator of product spoilage [37,38].
The highest levels in infant formular were trans-2-heptenal and benzaldehyde, marked in the F region. Carbonyl compounds and alcohols have been reported to be the key components in breast milk and infant formula. Benzaldehyde has been reported as a key aromatic active compound, described as an almond flavor [23]. (E)-2-heptenal was also detected in infant formula and was described as a fruity and soapy odor that contributed significantly to the odor of the milk powder [39]. Usually, the content in infant formula milk powder is higher than breast milk [23]. Most of the production of flavor substances was related to the degradation and metabolism of flavor precursors, such as amino acids and fatty acids.
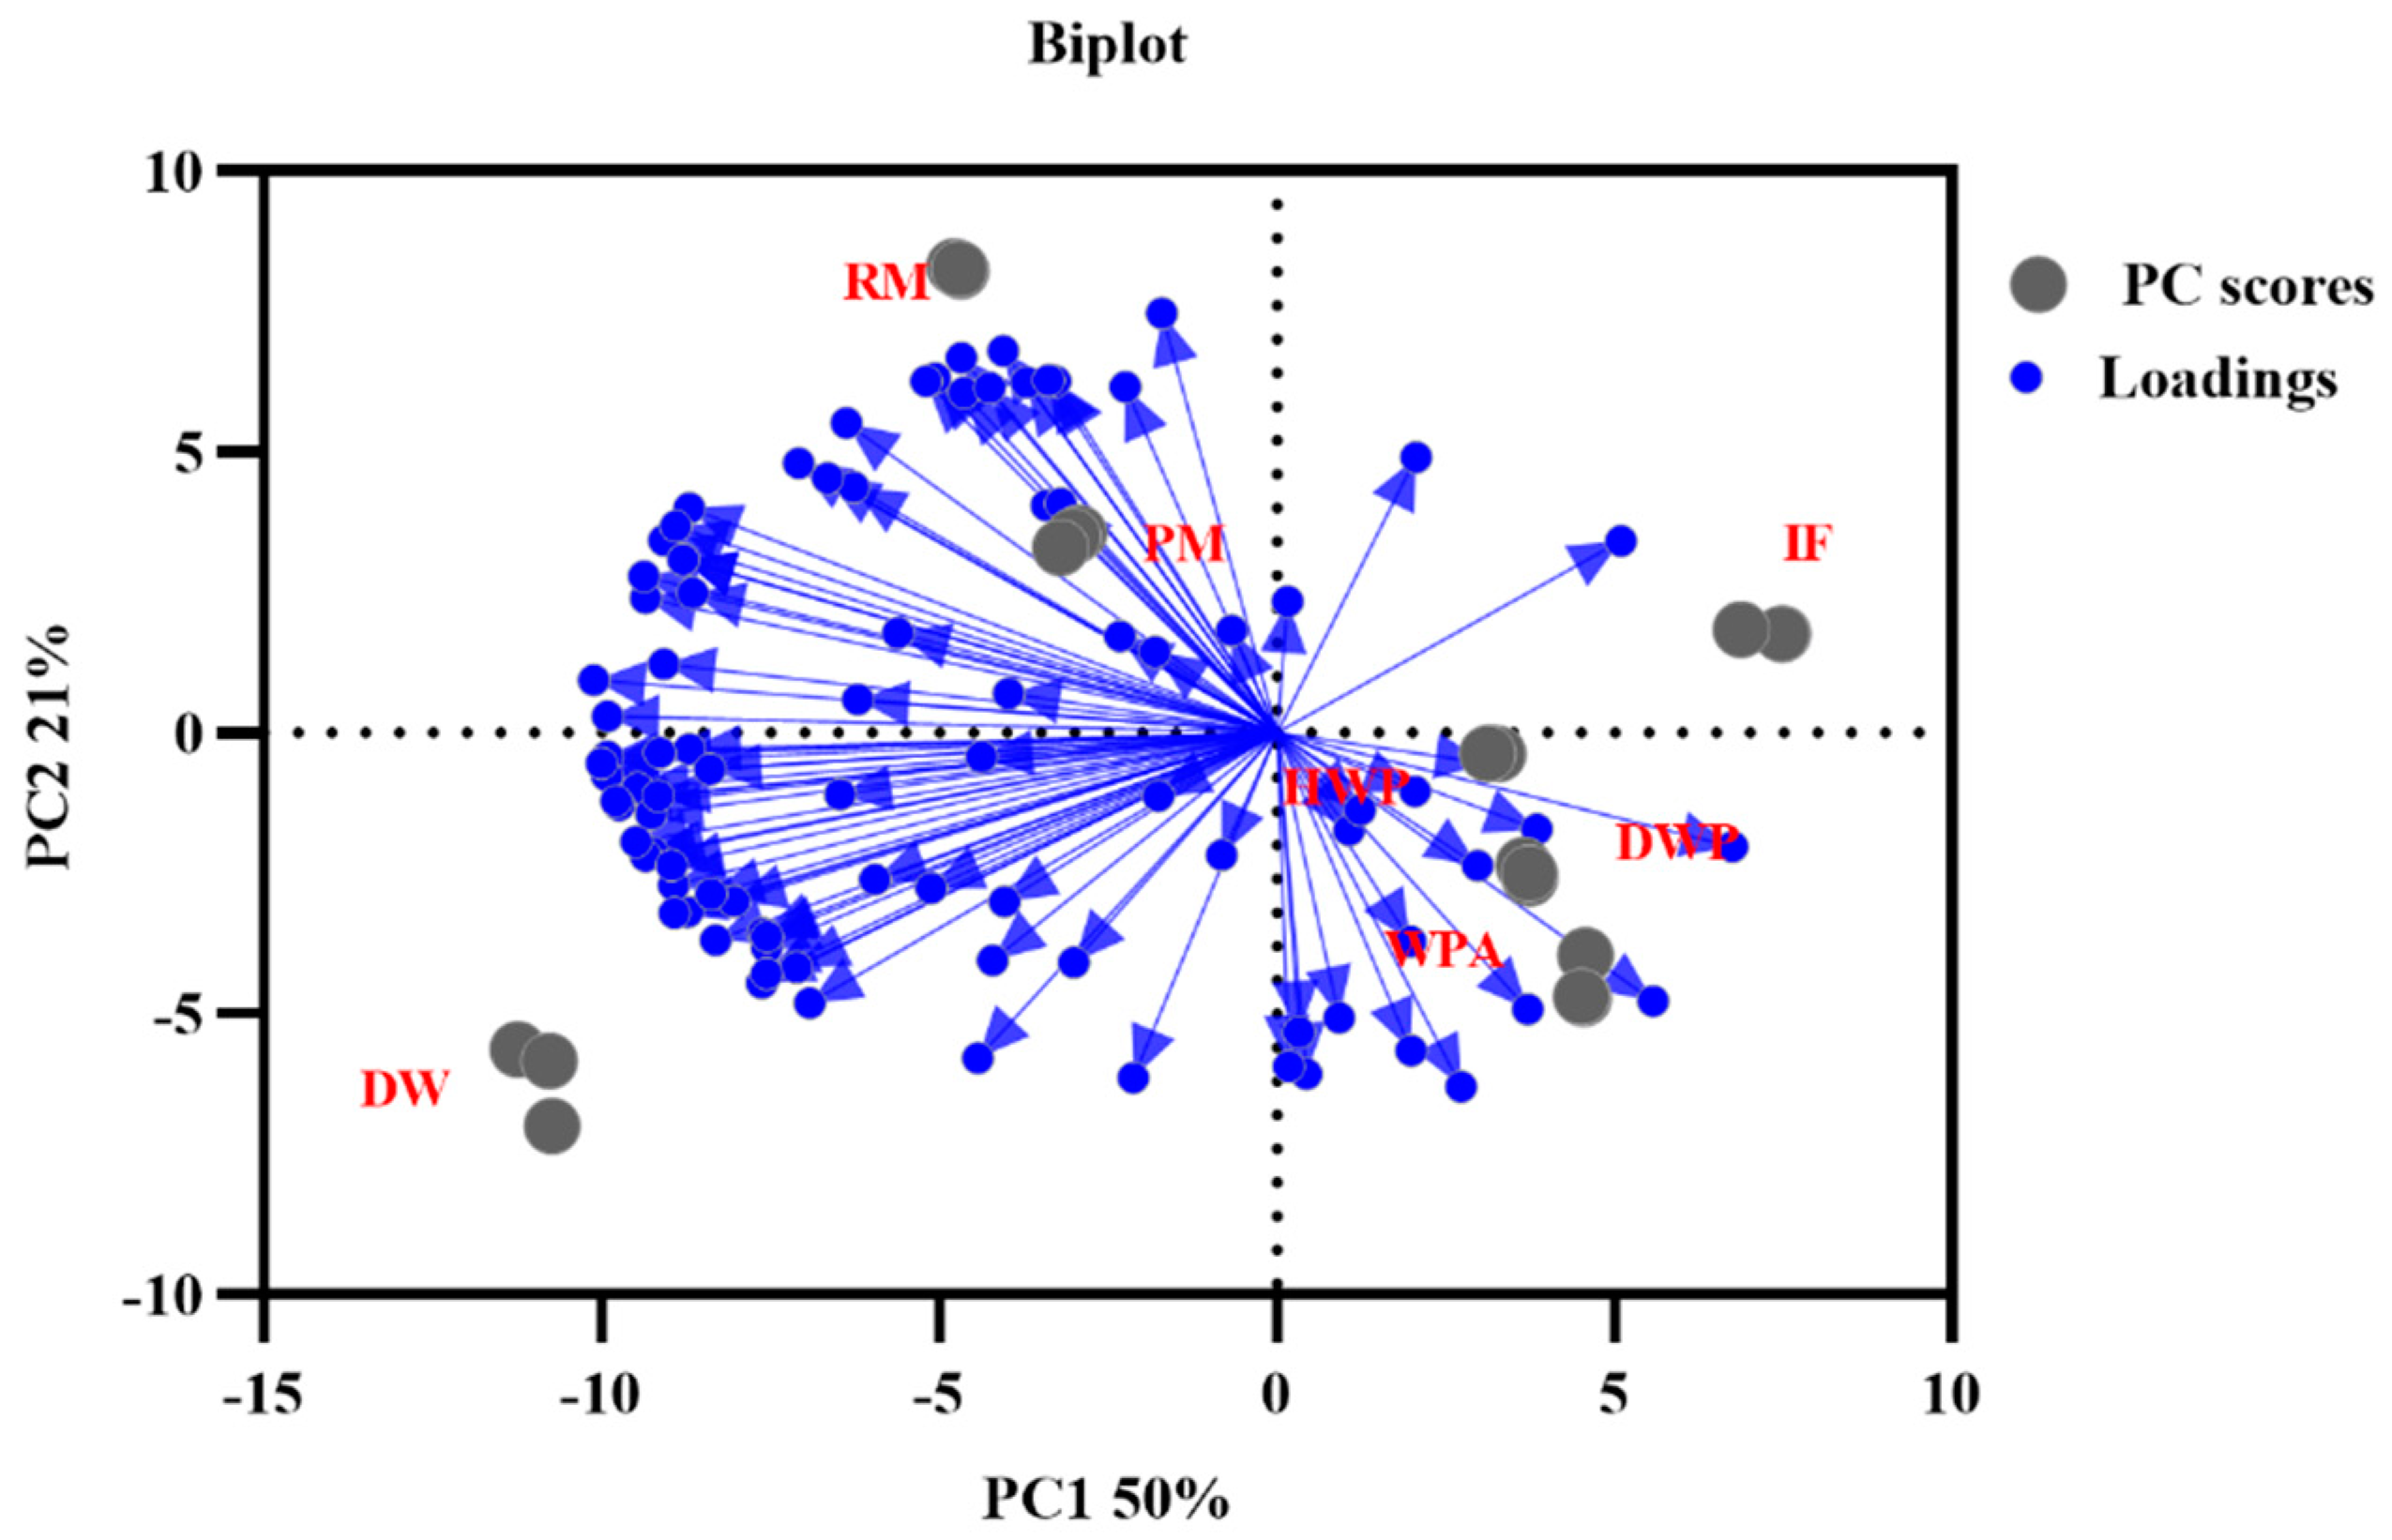
To highlight the differences among seven key original supplementary materials, PCA and FSA were indicated based on the signal intensity of the compounds (Figure 3). The contribution rates of PC1 and PC2 were 50% and 21%, and the cumulative contribution rate was 71% (>70%). The PCA diagram showed a clear separation between each group of seven crucial additions and did not overlap. It can be seen from Figure 3 that except for some outliers, the score distribution is relatively compact, indicating that all samples have consistent responses to the system. The loading plot indicated that the radial length of each variable was obviously different, which shows that these compounds have different influences on distinguishing samples. The responses of all the monomers and their polymers were selected as variables, and their positions in the figure were consistent with the results of the fingerprint spectra. The whey protein powder supplemented with alpha lactalbumin was close to demineralized whey powder, hydrolyzed whey protein powder, and infant formula. It indicated that the detected volatile organic compounds were relatively similar. There were obvious distance differences between these four samples and the demineralized whey, pasteurized milk, and raw milk.
As shown in Figure 4, the bottom area showed the normal distribution for each sample. The longer distance indicated a larger pronounced difference. However, the volatile organic compounds in demineralized whey powder, hydrolyzed whey protein powder, and whey protein powder supplemented with alpha-lactalbumin were similar. The FSA results were basically the same as those of the principal component analysis; therefore, it further confirmed the conclusions.

3.2. E-nose Analysis Results

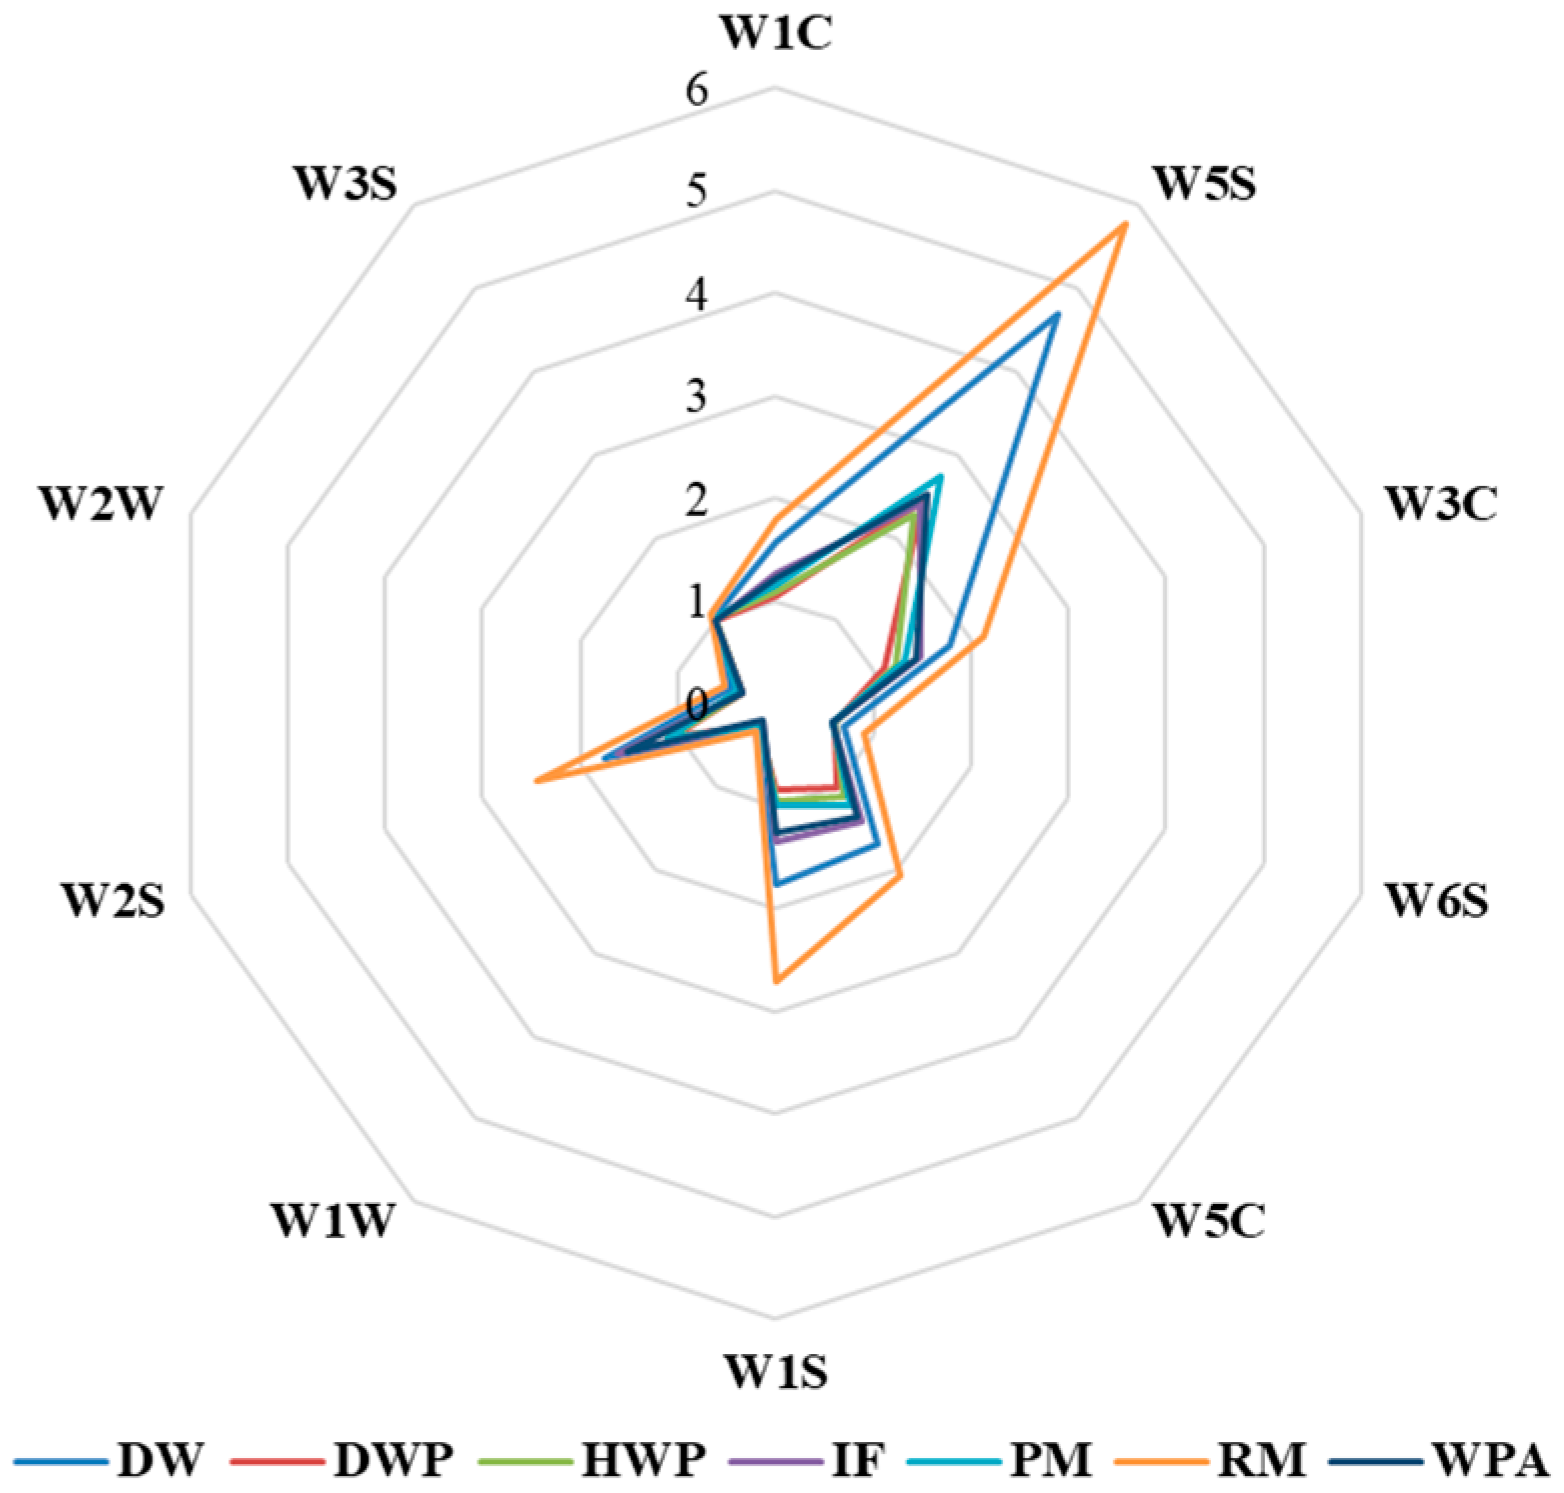
In Figure 5, the W5S, W1S, and W2S sensors had intense responses to the odors of seven key additions, and the differences in flavor were mainly distinguished by W5S, W1S, and W2S. Compared with these sensors, the responses of the W3C, W1C, and W5C sensors were slightly weaker. The response differences between the samples were easy to distinguish. There were significant differences in the contents of aromatic compounds, benzenes, amino olefins, exercise aromatics, and long-chain alkanes. The changes of the W2W and W6S sensors were not significant, and the contents of sulfur- and chlorine-containing compounds were lower; there were no significant differences, which did not contribute much to the discrimination of the samples.
Partial least square regression analysis (PLSR) was used to simplify the data structure and carry out correlation analysis between the two groups of variables, which further explained the potential relationship between the electronic nose sensors and the compounds identified by GC-IMS. The correlation load diagram is shown in Figure 6 with 10 sensors of the E-nose as the X variable and the response of the VOCs as the Y variable. There were many compounds detected by GC-IMS, but their contributions to the overall flavor varied greatly due to their different threshold values and contents. Compounds indicated that they can be well-explained by the model located only between the two ellipses. Most of the compounds had a high correlation with the E-nose sensors, especially esters. We believe that these VOCs contributed a lot in distinguishing samples.

3.3. E-tongue Analysis Results

As shown in Table 4, raw milk and pasteurized milk had lower responses to astringency aftertaste; other samples had no response to the two taste attributes of sourness and astringency. In terms of bitterness attributes, all samples had higher responses, and demineralized whey powder samples had the most prominent response, followed by hydrolyzed whey protein powder and infant formula, which was consistent with previous studies. Hydrolyzed protein refers to the fragmentation of complete proteins into small molecular proteins, peptide fragments, or amino acids, which are obtained by enzymatic hydrolysis or acid hydrolysis to reduce the sensitization of macromolecular proteins [19]. Infants fed hydrolyzed protein formula often suffer from indigestion, which can be somewhat relieved by the use of hydrolyzed IF with a flavorful taste. Bitterness is strongly related to the degree of hydrolysis and may also be affected by enzymes used for hydrolysis and the hydrolysis process. Limited bitterness in foods is acceptable, but high levels of bitter peptides and bitter amino acids can limit consumer choice [20,22,40]. At present, there is little research on the flavor of hydrolyzed protein milk powder, and the research of hydrolyzed protein infant formula milk powder and complementary food is also a topic worthy of further study.
The salty properties of demineralized whey and demineralized whey powder were significantly lower than those of other components, which was consistent with their own processes [15,16]. Hydrolyzed whey protein powder was significantly different from other additions in the taste evaluation, and the response to the salty taste sensor was the strongest, followed by the umami taste sensor. The raw milk and pasteurized milk also scored higher on the savory attribute [41,42]. There were no differences in the performances of astringent and bitter aftertastes for any of the samples. The responses of the samples to the sour taste were different, but they were all below the tasteless point, which was not within the perception range. Hydrolyzed whey protein powder had the highest response in terms of richness, and all samples responded with significant differences.
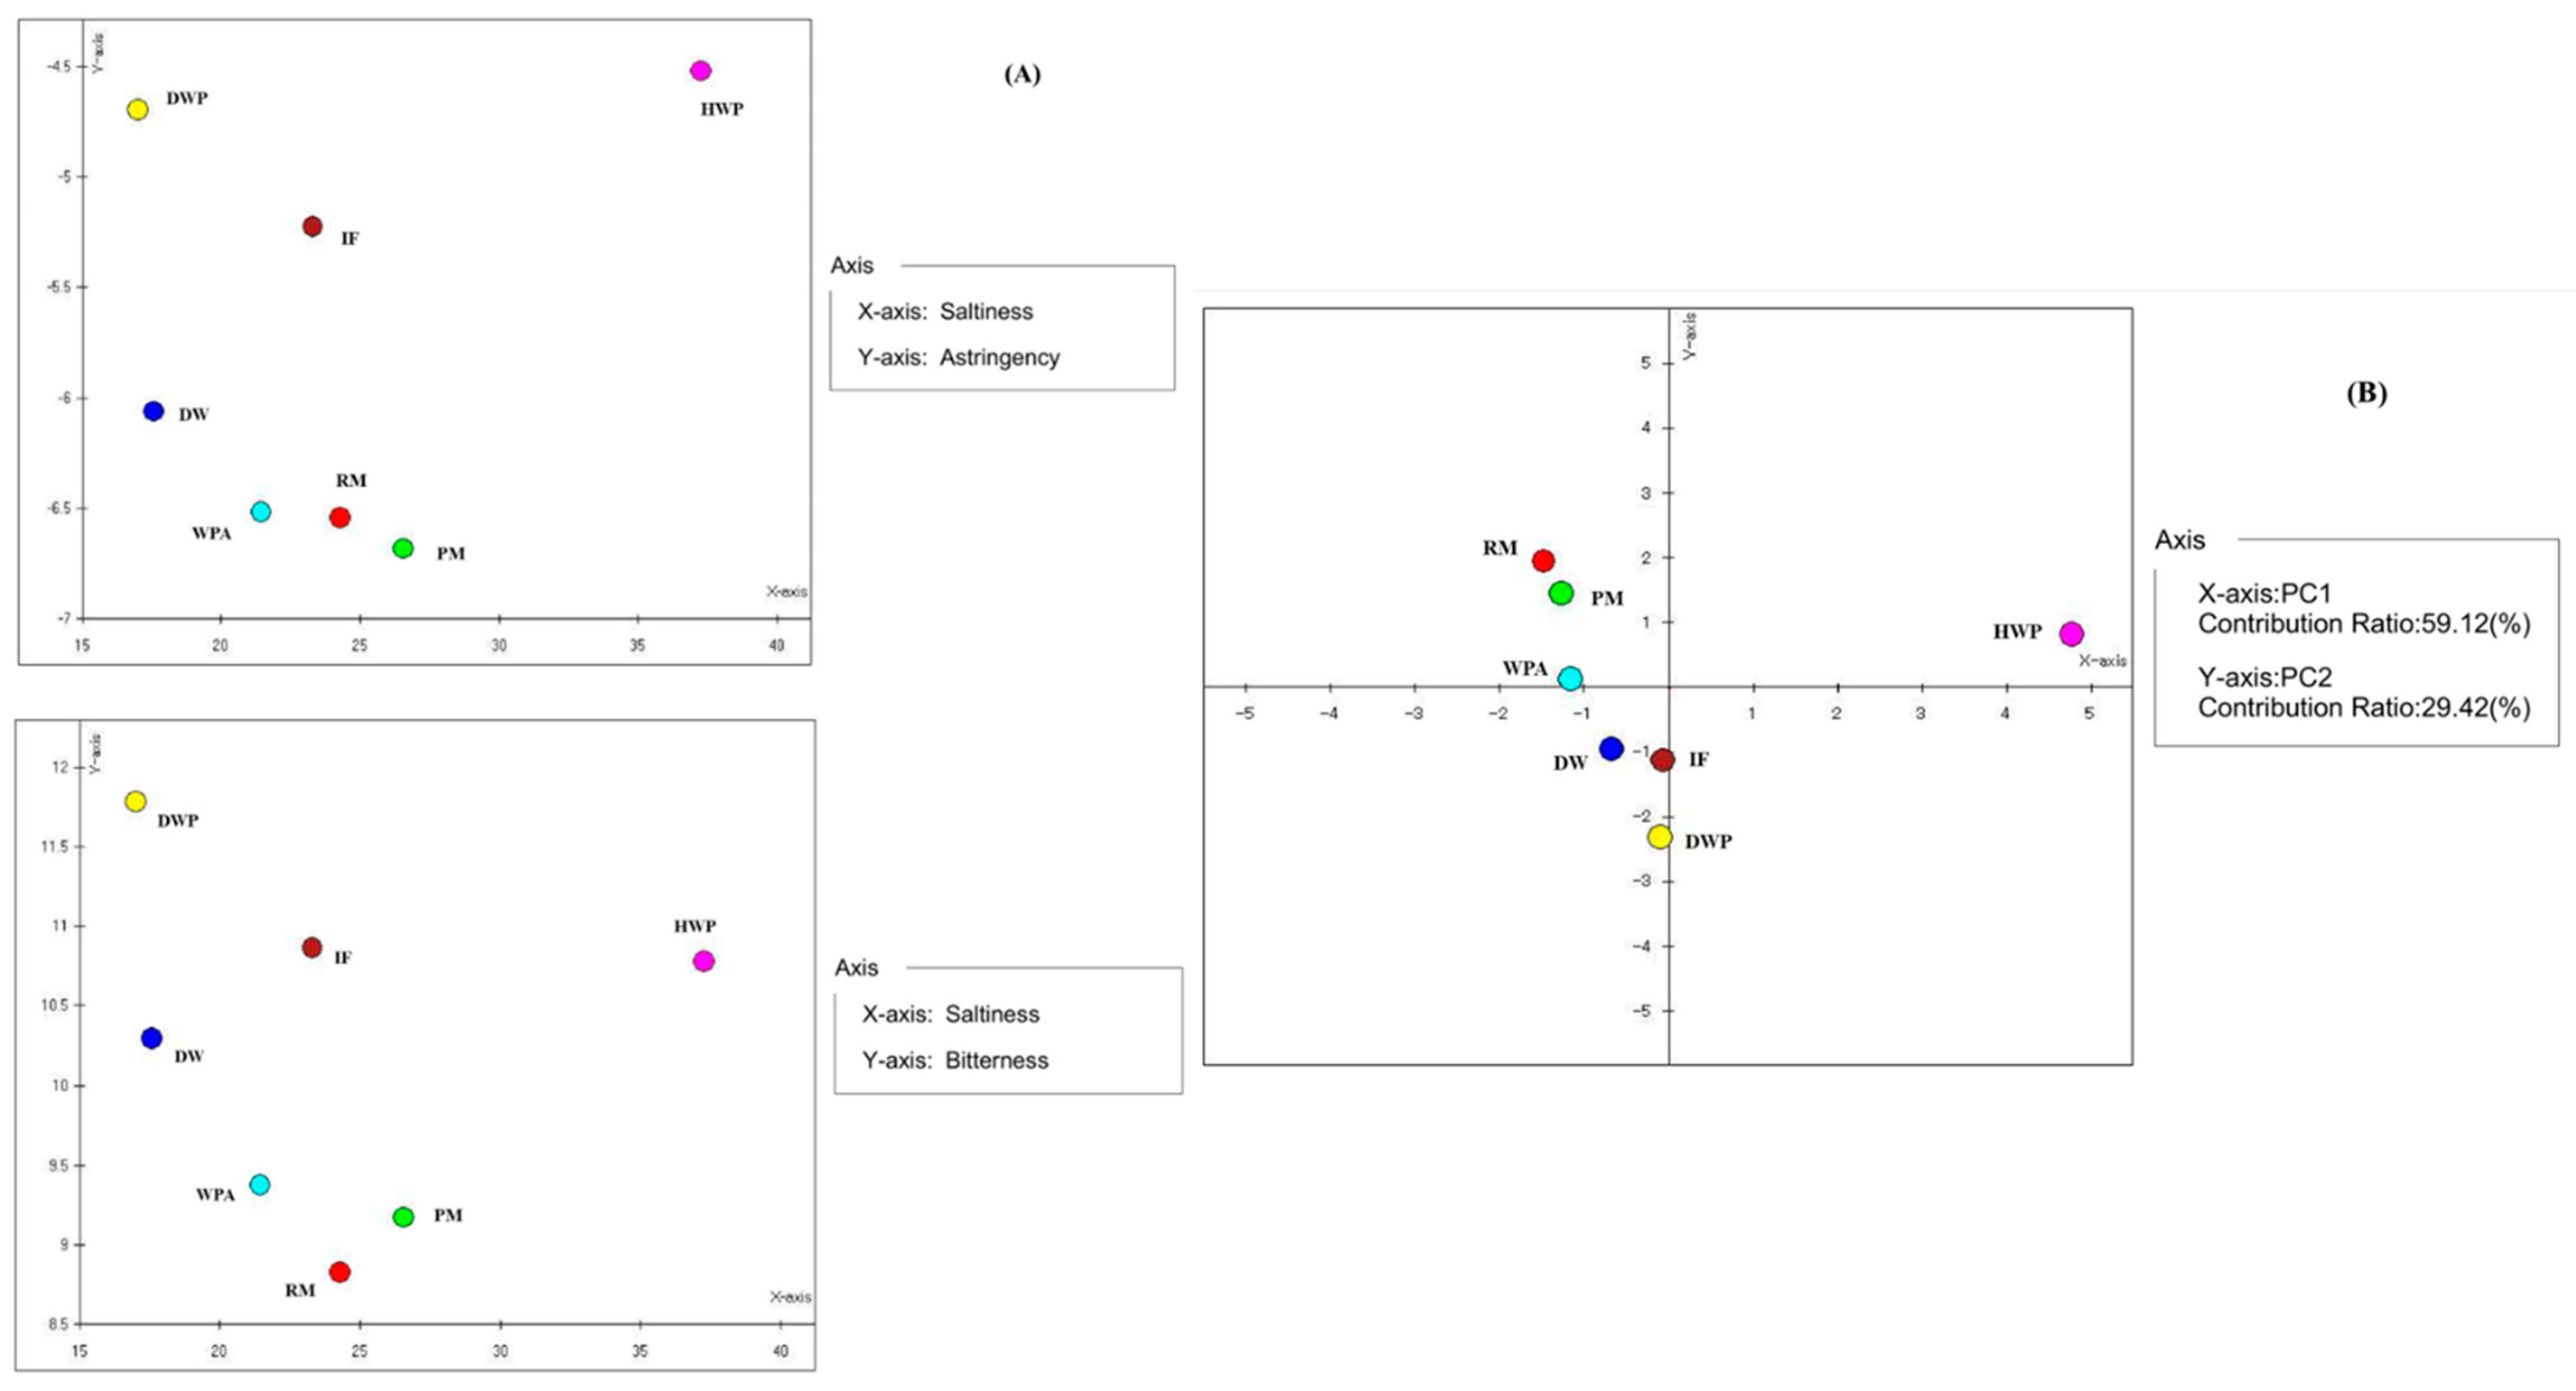
The signal responses of the five artificial lipid membrane sensors were analyzed in pairs using the analysis software of the E-tongue instrument. As shown in the scatter plot of saltiness–astringency and saltiness–bitterness (Figure 7A), hydrolyzed whey protein powder, demineralized whey powder, and infant formula indicated obvious outliers, which may be due to the fact that these three samples underwent the spray-drying process and were more consistent in taste. The outlier status of demineralized whey may be due to the special nature of the desalted whey, which is desalinated and therefore, has a lower response to the salty taste attribute. Pasteurized milk, raw milk, and alpha protein-added whey protein powder were closely distributed in the astringency–salty group distinction. Hydrolyzed whey protein powder showed a significant difference with other samples in the process of salty group distinction (Figure 7B).
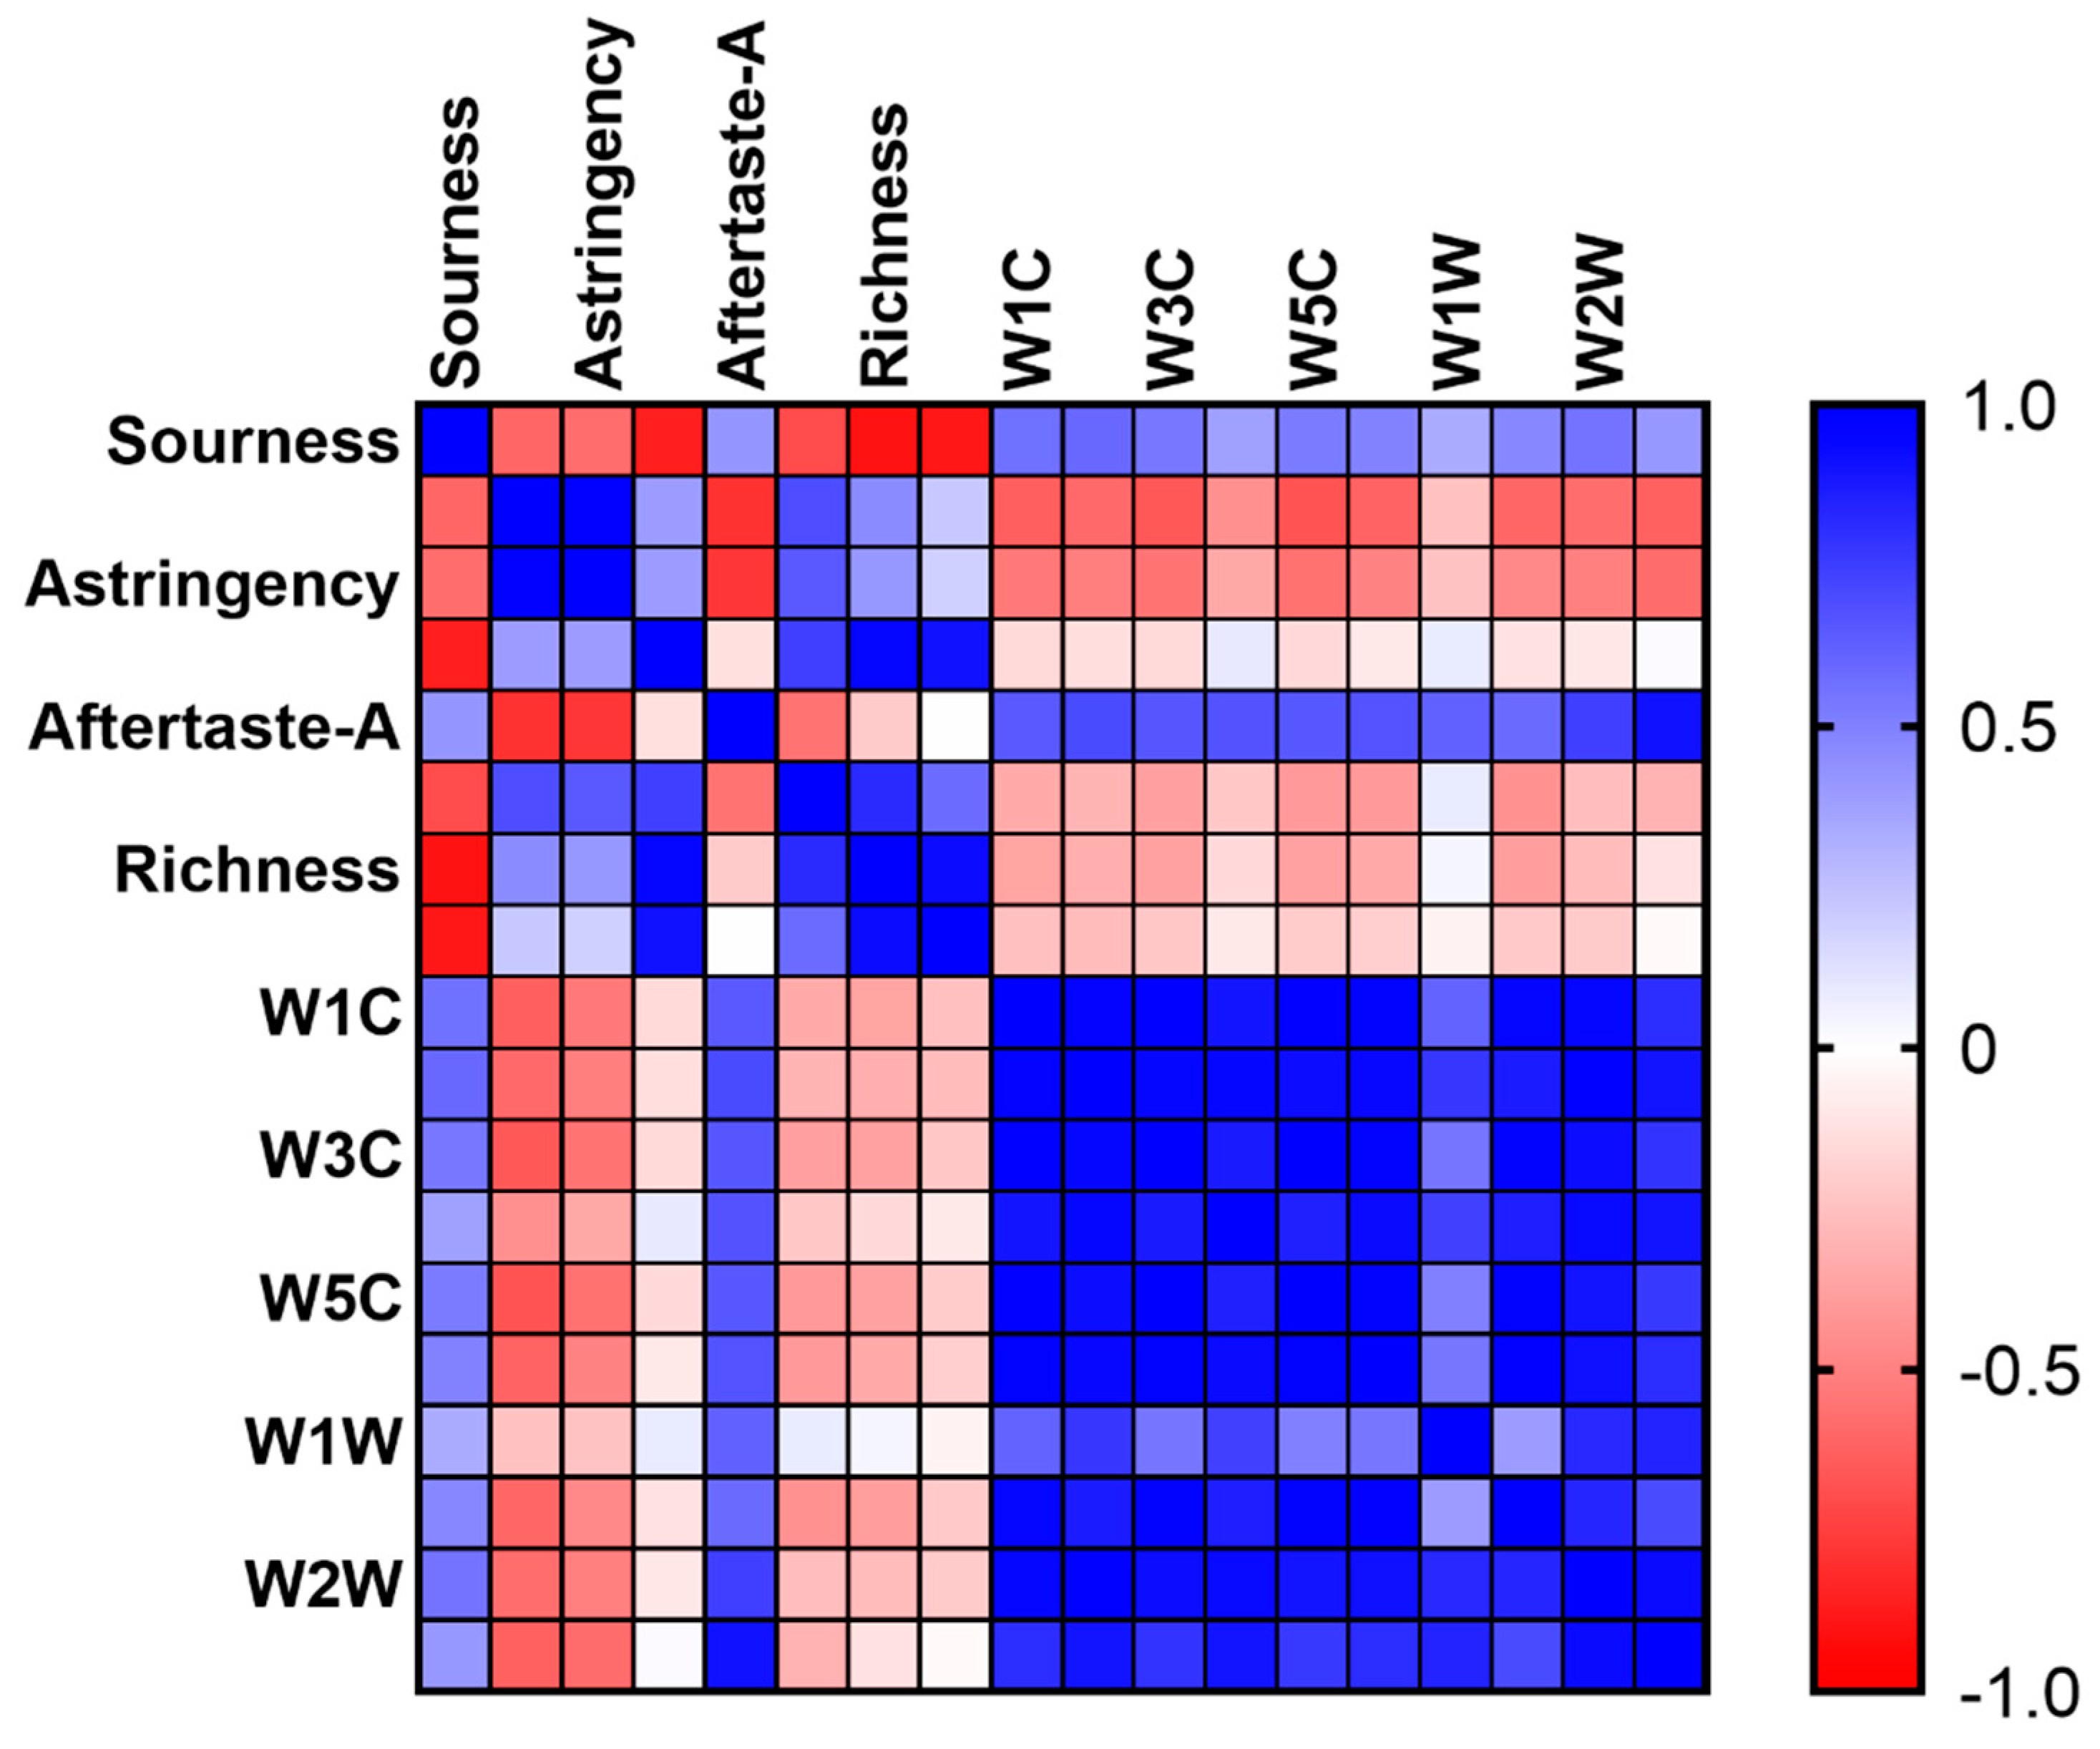
Most of the sensors showed a negative correlation in E-nose and E-tongue (Figure 8). Sourness and Aftertaste-A showed positive correlations with ten sensors of E-nose, respectively. There was a highly positive correlation between Aftertaste-A and W3S. Bitterness, astringency, and umami showed highly negative correlations with the ten sensors of E-nose except W1W. In this experiment, the samples were distinguished by evaluating the volatile flavors and tastes. The functions of E-nose and E-tongue are related to a certain extent. These two methods were combined to evaluate the samples, which guaranteed the accuracy of the results.

4. Conclusions

In this study, the diversity of flavor compounds in critical additions at the first stages of the infant formula processing line were analyzed by HS-GC-IMS, E-tongue, and E-nose. In total, 41 volatile substances were identified, including the monomer and its polymer, by HS-GC-IMS in seven key original supplementary materials. There were 12 aldehydes, 2 alcohols, 11 ketones, 9 esters, 4 olefins, 1 acid, and 2 furans. The intelligent sensory technology could distinguish between the differences in flavor of each critical addition.
The contents of characteristic volatile compounds in raw milk were much higher than in the other samples. Raw milk is an essential control point in the flavor formation process of stage 1 infant formula milk powder. The quality of raw materials determines the quality of the final product. Demineralized whey powder is the primary source of potential off-flavor components in hydrolyzed milk protein infant formula. Through the rational application of HS-GC-IMS, combined with intelligent sensory technology, the in-depth understanding of the flavor formation of infant formula in the production line can provide potential ideas for improving processing methods, quality control of raw milk, and optionally added excipients.

Author Contributions

Methodology, X.C. and H.G.; Software, H.G.; Investigation, H.L.; Writing—original draft, X.C.; Writing—review & editing, Y.Z., N.Z., H.L. and J.W.; Funding acquisition, J.W. All authors have read and agreed to the published version of the manuscript.

Funding

This research was supported by the China Agriculture Research System of MOF and MARA and the Agricultural Science and Technology Innovation Program (ASTIP-IAS12).

Data Availability Statement

Data are contained within the article.

Conflicts of Interest

The authors declare that they have no conflict of interest.

References

  1. Yu, P.; Low, M.Y.; Zhou, W. Design of experiments and regression modelling in food flavour and sensory analysis: A review. Trends Food Sci. Technol. 2018, 71, 202–215. [Google Scholar] [CrossRef]
  2. Su, X.Q.; Tortorice, M.; Ryo, S.; Li, X.; Waterman, K.; Hagon, A.; Yin, Y. Sensory lexicons and formation pathways of off-aromas in dairy ingredients: A review. Molecules 2020, 25, 569. [Google Scholar] [CrossRef] [PubMed]
  3. Jeleń, H.H.; Majcher, M.; Dziadas, M. Microextraction techniques in the analysis of food flavor compounds: A review. Anal. Chim. Acta 2012, 738, 13–26. [Google Scholar] [CrossRef]
  4. Mennella, J.A.; Jagnow, C.P.; Beauchamp, G.K. Prenatal and postnatal flavor learning by human infants. Pediatr. Res. 2001, 107, E88. [Google Scholar] [CrossRef] [Green Version]
  5. Harding, J.E.; Cormack, B.E.; Alexander, T.; Alseriler, J.M.; Bloomfield, F.H. Advances in nutrition of the newborn infant. Lancet 2017, 389, 1660–1668. [Google Scholar] [CrossRef]
  6. Witt, M.; Reutter, K. Embryonic and early fetal development of human taste buds: A transmission electron microscopical study. Anat. Rec. 1996, 246, 507–523. [Google Scholar] [CrossRef]
  7. Rosenstein, D.; Oster, H. Differential facial responses to four basic tastes in newborns. Child Dev. 1988, 59, 1555–1568. [Google Scholar] [CrossRef]
  8. Zhang, H.J.; Yuan, Y.S.; Zhu, X.X.; Xu, R.Z.; Shen, H.S.; Zhang, Q.; Ge, X.Z. The effect of different extraction methods on extraction yield, physicochemical properties, and volatile compounds from field muskmelon seed oil. Foods 2022, 11, 721. [Google Scholar] [CrossRef] [PubMed]
  9. Li, M.Q.; Du, H.T.; Lin, S.Y. Flavor changes of tricholoma matsutake singer under different processing conditions by using HS-GC-IMS. Foods 2021, 10, 531. [Google Scholar] [CrossRef]
  10. Feng, X.Y.; Wang, H.W.; Wang, Z.R.; Huagn, Y.M.; Jian, Q.K. Discrimination and characterization of the volatile organic compounds in eight kinds of huajiao with geographical indication of China using electronic nose, HS-GC-IMS and HS-SPME-GC–MS. Food Chem. 2022, 375, 131671. [Google Scholar] [CrossRef]
  11. Hou, H.; Liu, C.; Lu, X.S.; Fang, D.L.; Hu, Q.H.; Zhang, Y.Y.; Zhao, L.Y. Characterization of flavor frame in shiitake mushrooms (Lentinula edodes) detected by HS-GC-IMS coupled with electronic tongue and sensory analysis: Influence of drying techniques. LWT 2021, 146, 111402. [Google Scholar] [CrossRef]
  12. Niu, Y.W.; Wang, R.L.; Xiao, Z.B.; Zhu, J.C.; Sun, X.X.; Wang, P.P. Characterization of ester odorants of apple juice by gas chromatography-olfactometry, quantitative measurements, odour threshold, aroma intensity and electronic nose. Food Res. Int. 2019, 120, 92–101. [Google Scholar] [CrossRef] [PubMed]
  13. Li, X.Q.; Yang, Y.H.; Zhu, Y.T.; Jin, Q.; Ben, A.L. A novel strategy for discriminating different cultivation and screening odor and taste flavor compounds in Xinhui tangerine peel using E-nose, E-tongue, and chemometrics. Food Chem. 2022, 384, 132519. [Google Scholar] [CrossRef] [PubMed]
  14. Wang, Z.; Wang, H.; Wang, C.J.; Yang, X. Volatile component analysis in infant formula using SPME coupled with GC × GC-TOFMS. Anal. Methods 2019, 11, 5017–5022. [Google Scholar] [CrossRef]
  15. Birch, L.; Anderson, H.; Chiva, M. Acquisition of food preferences and eating patterns in children. In Eating Disorders and Obesity: A Comprehensive Handbook; Danone Institute: Levallois-Perret, France, 2002; pp. 75–79. [Google Scholar]
  16. Hausner, H.; Philipsen, M.; Skov, T.H.; Petersen, M.A. Characterization of the volatile composition and variations between infant formulas and mother’s milk. Chemosens Percept. 2009, 2, 79–93. [Google Scholar] [CrossRef]
  17. Alim, A.; Song, H.L.; Raza, A.; Hua, J.C. Identification of bitter constituents in milk-based infant formula with hydrolysed milk protein through a sensory-guided technique. Int. Dairy J. 2020, 110, 104803. [Google Scholar] [CrossRef]
  18. Yang, P.; Liu, C.; Song, H.L.; Wang, L.J.; Wang, X.Q.; Hua, J.C. Sensory-directed flavor analysis of off-flavor compounds in infant formula with deeply hydrolyzed milk protein and their possible sources. LWT 2020, 119, 108861. [Google Scholar] [CrossRef]
  19. Golkar, A.; Milani, J.M.; Vasiljevic, T. Altering allergenicity of cow’s milk by food processing for applications in infant formula. Crit. Rev. Food Sci. Nutr. 2019, 59, 159–172. [Google Scholar] [CrossRef]
  20. Liu, X.; Jiang, D.; Peterson, D.G. Identification of bitter peptides in whey protein hydrolysate. J. Agric. Food Chem. 2014, 62, 5719–5725. [Google Scholar] [CrossRef]
  21. Chavez-Servin, J.L.; Castellote, A.I.; Lopez-Sabater, M.C. Volatile compounds and fatty acid profiles in commercial milk-based infant formulae by static headspace gas chromatography: Evolution after opening the packet. Food Chem. 2008, 107, 558–569. [Google Scholar] [CrossRef]
  22. Leksrisompong, P.P.; Miracle, R.E.; Drake, M.A. Characterization of flavor of whey protein hydrolysates. J. Agric. Food Chem. 2010, 58, 6318–6327. [Google Scholar] [CrossRef]
  23. Zhang, H.; Zhang, Y.; Wang, L.J.; Song, H.L. Detection of odor difference between human milk and infant formula by sensory-directed analysis. Food Chem. 2022, 382, 132348. [Google Scholar] [CrossRef] [PubMed]
  24. Shen, D.Y.; Song, H.L.; Zou, T.T.; Li, M.K. Characterization of odor-active compounds in moso bamboo (Phyllostachys pubescens Mazel) leaf via gas chromatography-ion mobility spectrometry, one-and two-dimensional gas chromatography-olfactory-mass spectrometry, and electronic nose. Food Res. Int. 2022, 152, 110916. [Google Scholar] [CrossRef] [PubMed]
  25. Yao, W.S.; Cai, Y.X.; Liu, D.Y.; Chen, Y.; Li, J.R.; Zhang, M.C.; Chen, N.; Zhang, H. Analysis of flavor formation during production of Dezhou braised chicken using headspace-gas chromatography-ion mobility spec-trometry (HS-GC-IMS). Food Chem. 2022, 370, 130989. [Google Scholar] [CrossRef]
  26. Lin, R.R.; Yuan, H.F.; Wang, C.R.; Yang, Q.Y.; Guo, Z.B. Study on the Flavor Compounds of Fo Tiao Qiang under Different Thawing Methods Based on GC–IMS and Electronic Tongue Technology. Foods 2022, 11, 1330. [Google Scholar] [CrossRef] [PubMed]
  27. Zhan, F.L.; Sun, L.X.; Zhao, G.M.; Li, M.Y.; Zhu, Z.C. Multiple Technologies Combined to Analyze the Changes of Odor and Taste in Daokou Braised Chicken during Processing. Foods 2022, 11, 963. [Google Scholar] [CrossRef] [PubMed]
  28. Huang, G.X.; Li, N.; Liu, K.Z.; Yang, J.Y.; Zhao, S.G.; Zheng, N.; Zhou, J.H.; Zhang, Y.D.; Wang, J.Q. Effect of Flaxseed Supplementation in Diet of Dairy Cow on the Volatile Organic Compounds of Raw Milk by HS-GC–IMS. Front. Nutr. 2022, 9, 831178. [Google Scholar] [CrossRef]
  29. Colahan-Sederstrom, P.M.; Peterson, D.G. Inhibition of key aroma compound generated during ultrahigh-temperature processing of bovine milk via epicatechin addition. J. Agric. Food Chem. 2005, 53, 398–402. [Google Scholar] [CrossRef] [PubMed]
  30. Bendall, J.G. Aroma compounds of fresh milk from New Zealand cows fed different diets. J. Agric. Food Chem. 2001, 49, 4825–4832. [Google Scholar] [CrossRef]
  31. Manzocchi, E.; Martin, B.; Bord, C.; Verdier-Metz, I.; Bouchon, M.; Maechi, M.D.; Constant, I.; Giller, K.; Kreuzer, M.; Berard, J.; et al. Feeding cows with hay, silage, or fresh herbage on pasture or indoors affects sensory properties and chemical composition of milk and cheese. J. Dairy Sci. 2021, 104, 5285–5302. [Google Scholar] [CrossRef]
  32. Braggins, T.; Jamieson, P.; Luckman, M.; Nickless, E.; Yang, D.; Andrewes, P. Variability between farms of New Zealand raw bovine milk flavour: Identification and characterisation of odorous outliers. Int. Dairy J. 2020, 111, 104835. [Google Scholar] [CrossRef]
  33. Jo, Y.; Carter, B.G.; Barbano, D.M.; Drake, M.A. Identification of the source of volatile sulfur compounds produced in milk during thermal processing. J. Dairy Sci. 2019, 102, 8658–8669. [Google Scholar] [CrossRef] [PubMed]
  34. Hedegaard, R.V.; Kristensen, D.; Nielsen, J.H. Comparison of descriptive sensory analysis and chemical analysis for oxidative changes in milk. J. Dairy Sci. 2006, 89, 495–504. [Google Scholar] [CrossRef] [Green Version]
  35. Zhang, Y.M.; Yi, S.N.; Lu, J.; Pang, X.Y.; Xu, X.X.; Lv, J.P.; Zhang, S.W. Effect of different heat treatments on the Maillard reaction products, volatile compounds and glycation level of milk. Int. Dairy J. 2021, 123, 105182. [Google Scholar] [CrossRef]
  36. Siciliano, R.A.; Mazzeo, M.F.; Arena, S.; Renzone, G.; Scaloni, A. Mass spectrometry for the analysis of protein lactosylation in milk products. Food Res. Int. 2013, 54, 988–1000. [Google Scholar] [CrossRef]
  37. Lesme, H.; Rannou, C.; Famelart, M.H.; Bouhalab, S.; Prost, C. Yogurts enriched with milk proteins: Texture properties, aroma release and sensory perception. Trends Food Sci. Technol. 2020, 98, 140–149. [Google Scholar] [CrossRef]
  38. Jiang, Y.J.; Yang, X.Y.; Jin, H.N.; Feng, X.H.; Tian, F.; Yang, S.; Ren, Y.W.; Man, C.X.; Zhang, w. Shelf-life prediction and chemical characteristics analysis of milk formula during storage. LWT 2021, 144, 111268. [Google Scholar] [CrossRef]
  39. Li, Y.H.; Zhang, L.W.; Wang, W.J.; Han, X. Differences in particle characteristics and oxidized flavor as affected by heat-related processes of milk powder. J. Dairy Sci. 2013, 96, 4784–4793. [Google Scholar] [CrossRef] [Green Version]
  40. Banik, D.D.; Medler, K.F. Bitter, sweet, and umami signaling in taste cells: It’s not as simple as we thought. Curr. Opin. Physiol. 2021, 20, 159–164. [Google Scholar] [CrossRef]
  41. Barbano, D.M.; Ma, Y.; Santos, M.V. Influence of raw milk quality on fluid milk shelf life. J. Dairy Sci. 2006, 89, E15–E19. [Google Scholar] [CrossRef]
  42. Lee, A.P.; Barbano, D.M.; Drake, M.A. The influence of ultra-pasteurization by indirect heating versus direct steam injection on skim and 2% fat milks. J. Dairy Sci. 2017, 100, 1688–1701. [Google Scholar] [CrossRef] [PubMed]
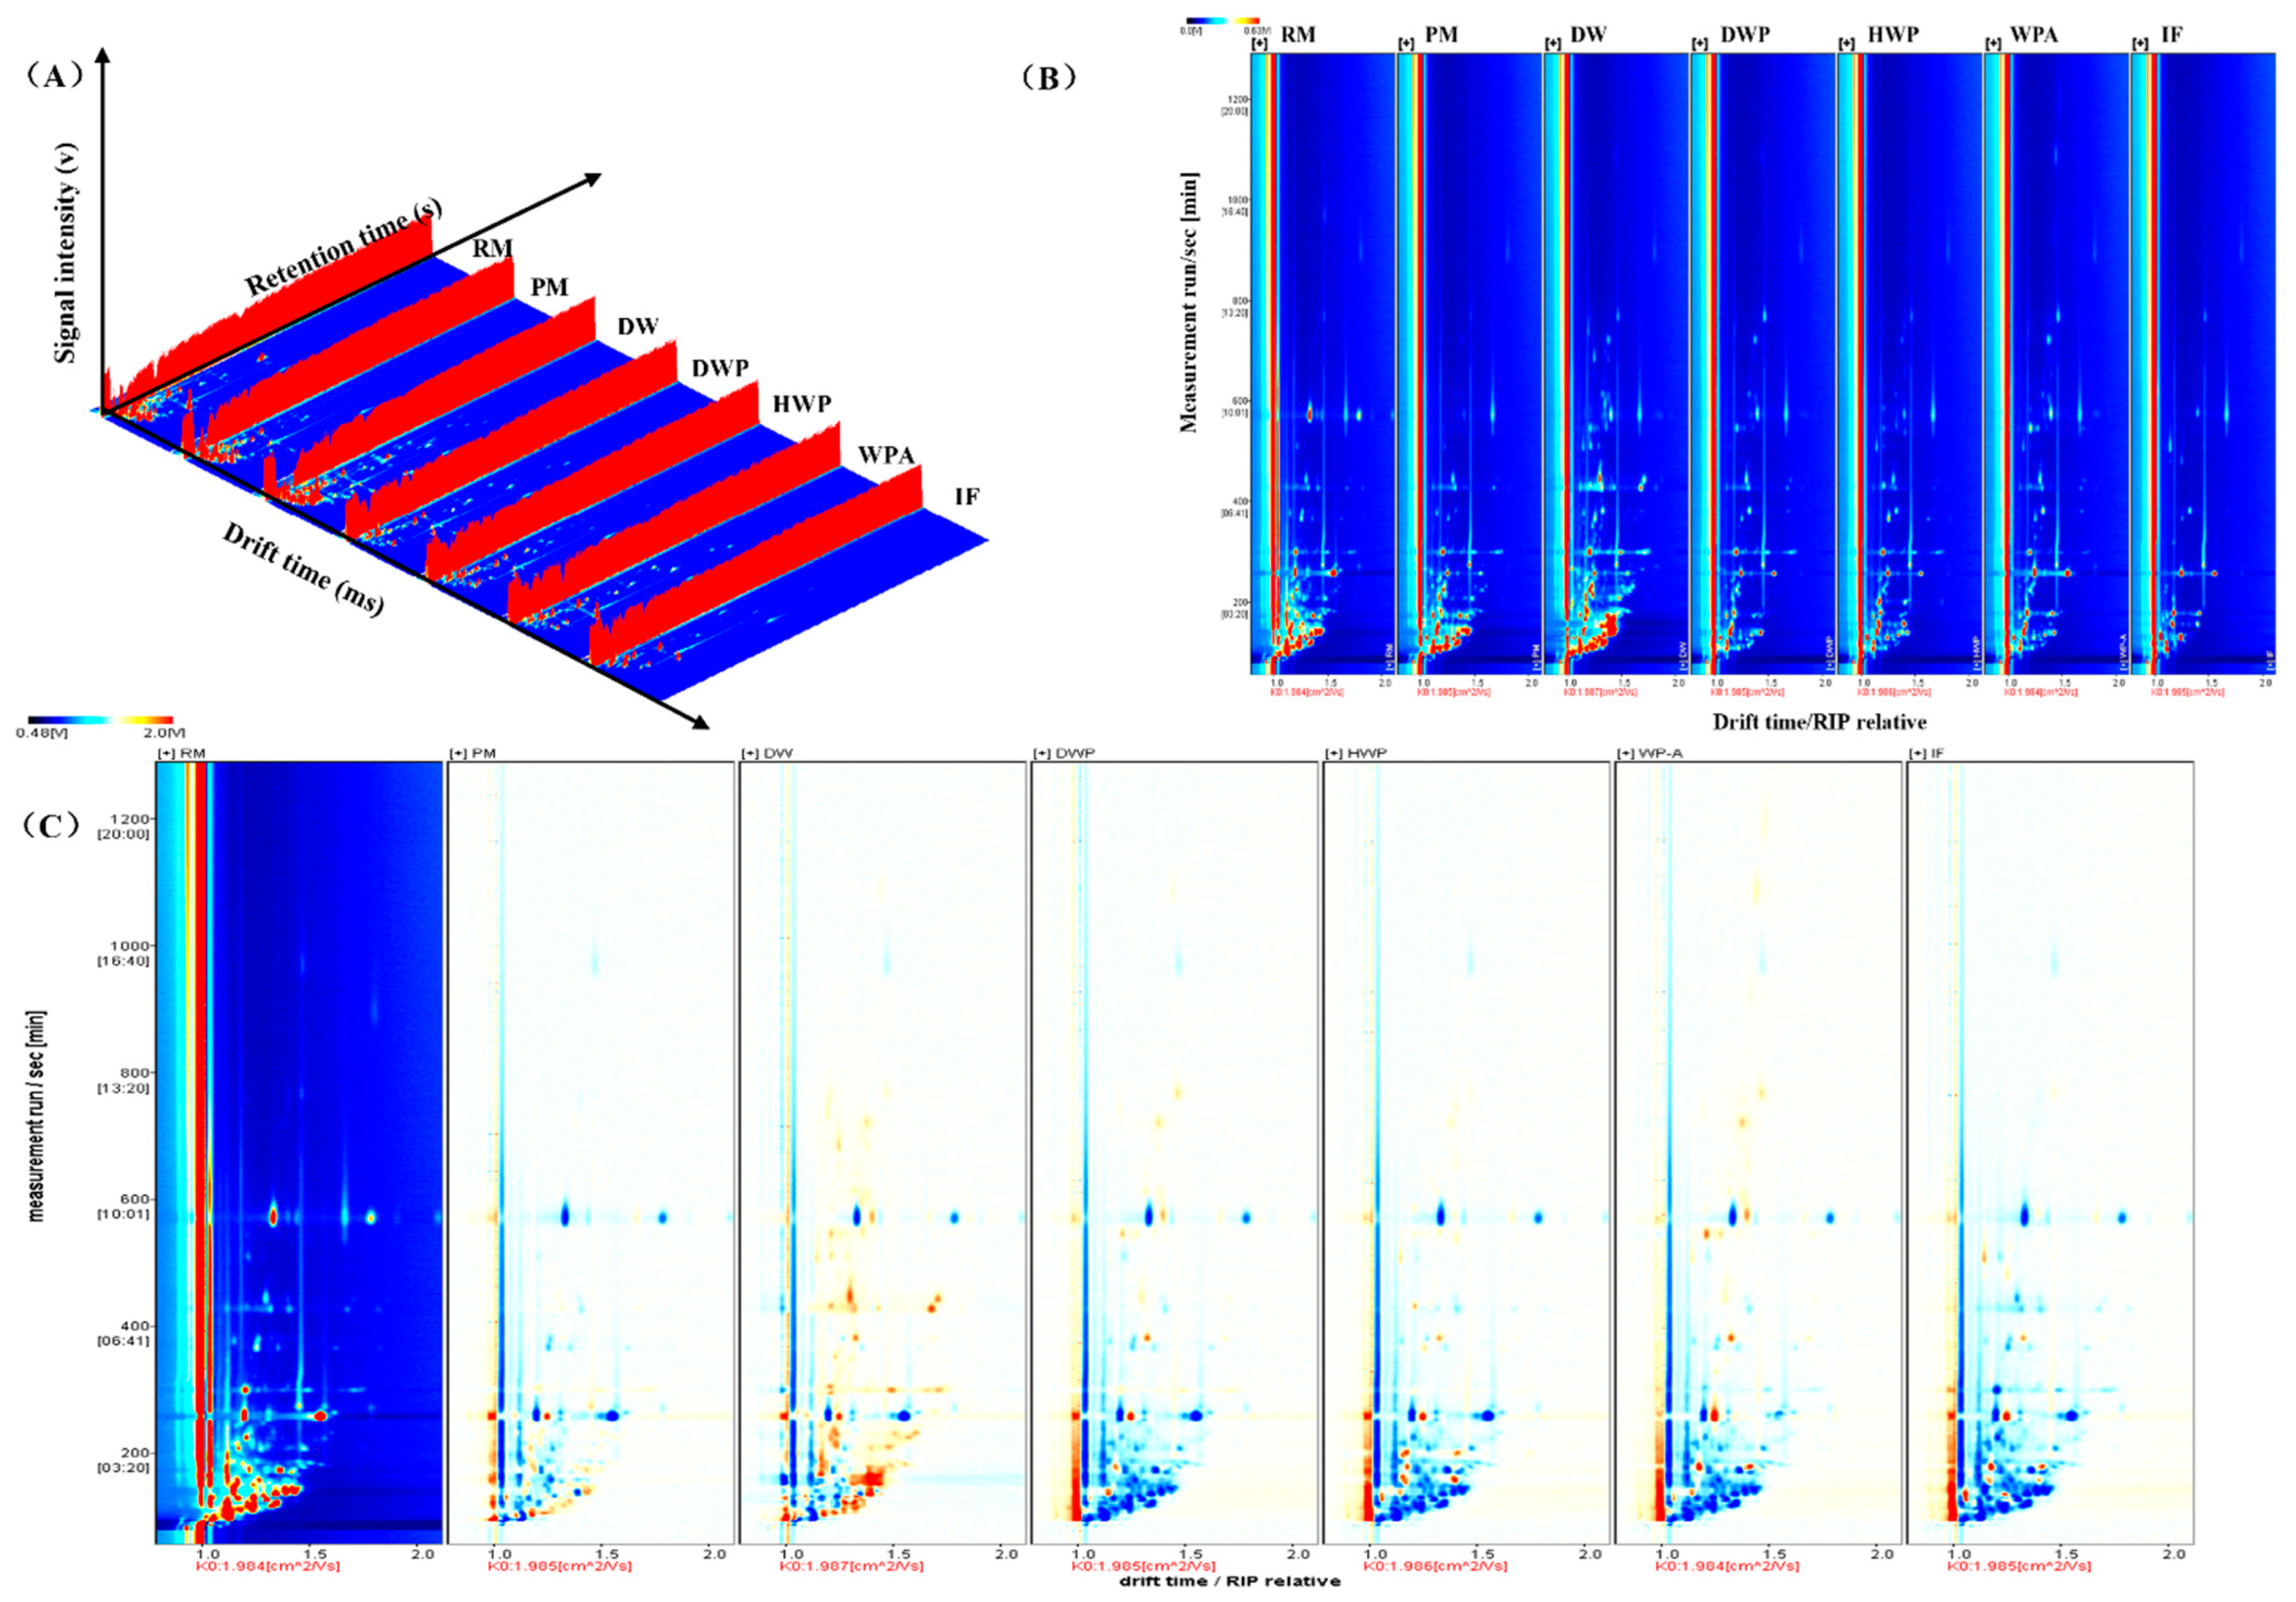
Figure 1. GC-IMS analysis results: (A) 3D-topographic, (B) topographic plot of GC-IMS spectra, and the (C) comparison results under the spectral diagram. RM, raw milk; PM, pasteurized milk; DW, demineralized whey; DWP, demineralized whey powder; HWP, hydrolyzed whey protein powder; WPA, whey protein powder with added alpha-lactalbumin; IF, infant formula.
Foods 11 03708 g001
Figure 2. GC-IMS fingerprint spectra. A–F region represent the characteristics of sample RM, PM, DW, DWP, HWP; WPA and IF. RM, raw milk; PM, pasteurized milk; DW, demineralized whey; DWP, demineralized whey powder; HWP, hydrolyzed whey protein powder; WPA, whey protein powder with added alpha-lactalbumin; IF, infant formula.
Foods 11 03708 g002
Figure 3. Principal component analysis (PCA) and different variance loading plots according to the quantitative results. RM, raw milk; PM, pasteurized milk; DW, demineralized whey; DWP, demineralized whey powder; HWP, hydrolyzed whey protein powder; WPA, whey protein powder with added alpha-lactalbumin; IF, infant formula.
Foods 11 03708 g003
Figure 4. The results of the fingerprint similarity analysis (FSA). RM, raw milk; PM, pasteurized milk; DW, demineralized whey; DWP, demineralized whey powder; HWP, hydrolyzed whey protein powder; WPA, whey protein powder with added alpha-lactalbumin; IF, infant formula.
Foods 11 03708 g004
Figure 5. Distribution of the volatile compound species in the samples using E-nose sensors. RM, raw milk; PM, pasteurized milk; DW, demineralized whey; DWP, demineralized whey powder; HWP, hydrolyzed whey protein powder; WPA, whey protein powder with added alpha-lactalbumin; IF, infant formula.
Foods 11 03708 g005
Figure 6. Correlation of sensors and VOCs.
Foods 11 03708 g006
Figure 7. The scatter plot, Saltness-Bitterness and Saltness-Astringency (A) and principal component results of E-tongue (B). RM, raw milk; PM, pasteurized milk; DW, demineralized whey; DWP, demineralized whey powder; HWP, hydrolyzed whey protein powder; WPA, whey protein powder with added alpha-lactalbumin; IF, infant formula.
Foods 11 03708 g007
Figure 8. Correlation analysis between E-nose and E-tongue; blue represents a positive correlation, and red represents a negative correlation.
Foods 11 03708 g008
Table 1. Metal oxide conductivity gas sensors of the E-nose [24].
NO.SensorPerformance Description
(Sensitivity to)
Main Detection GroupSensor Corresponding Group Threshold (mL/m3)
1W5Snitrogen oxidesNO21
2W1SmethylCH4100
3W2Salcohols, ketones, and aldehydesCO100
4W3CammoniaC6H610
5W1CbenzeneC7H810
6W5Cshort-chain aromatic compounds and olefinC3H81
7W1Wsulfur compoundsH2S1
8W2Worganic sulfidesH2S1
9W6ShydrogenH2100
10W3Slong-chain alkanesCH4100
Table 2. Artificial lipid sensors of the E-tongue.
NO.SensorsCharacteristics
1CT0Saltiness
2CA0Sourness
3AAEUmami, Richness
4AE1Astringency, Aftertaste-A
5C00Bitterness, Aftertaste-B
Table 3. GC-IMS compound results.
CountCompoundCAS#FormulaMWRIRt [s]Dt [a.u.]
Aldehyde
12-Methyl-propanalC78842C4H8O72.1565.7132.6311.10393
23-MethylbutanalC590863C5H10O86.1630156.4091.17527
3PentanalC110623C5H10O86.1680.7178.1041.18418
42-Pentenal(E)C1576870C5H8O84.1757.2232.4441.1137
5HexanalC66251C6H12O100.2786257.6631.25466
6HeptanalC111717C7H14O114.2896.6381.1031.33043
72-heptenal(E)C18829555C7H12O112.2956.9481.551.25549
8BenzaldehydeC100527C7H6O106.1970506.6111.15146
9OctanalC124130C8H16O128.21003.1572.5721.41471
10PhenylacetaldehydeC122781C8H8O120.21063.6684.9331.25699
11n-NonanalC124196C9H18O142.21101.3765.9881.47438
12(E)-2-DecenalC3913813C10H18O154.31248.91186.1041.48774
Ketone
1AcetoneC67641C3H6O58.1467.9103.1961.12659
22,3-ButanedioneC431038C4H6O286.1554128.681.1711
32-ButanoneC78933C4H8O72.1562.2131.4271.06066
42-PentanoneC107879C5H10O86.1670.9173.7111.12572
53-Hydroxy-2-butanoneC513860C4H8O288.1716.1200.5491.0539
6Methyl isobutyl ketoneC108101C6H12O100.2725207.061.17904
72-HexanoneC591786C6H12O100.2774.4247.1781.19207
8CyclopentanoneC120923C5H8O84.1787.7259.211.10492
92-HeptanoneC110430C7H14O114.2885.7366.1081.26143
10CyclohexanoneC108941C6H10O98.1894.2377.5681.15368
112-OctanoneC111137C8H16O128.2991549.6171.33151
Esters
1Ethyl propanoateC105373C5H10O2102.1696.4186.8911.14908
2Isobutyl acetateC110190C6H12O2116.2759.4234.2441.2371
3Ethyl butyrateC105544C6H12O2116.2788.3259.7261.20472
4Acetic acid butyl esterC123864C6H12O2116.2793.7264.7611.62477
5Ethyl 3-methylbutyrateC108645C7H14O2130.2855.7329.381.2617
6Ethyl pentanoateC539822C7H14O2130.2896.4380.7331.2681
7Ethyl hexanoateC123660C8H16O2144.21004574.1471.34172
8Methyl heptanoateC106730C8H16O2144.21016.7596.0431.35772
9Ethyl octanoateC106321C10H20O2172.31181.1970.4441.48244
Olefin
1Alpha-PineneC80568C10H16136.2929.8433.5271.21834
2Beta-PineneC127913C10H16136.2971.5509.5141.22342
3MyrceneC123353C10H16136.2988.9545.0981.21596
4Alpha-PhellandreneC99832C10H16136.21009582.7131.2157
Furan
12-AcetylfuranC1192627C6H6O2110.1926.8428.4381.12462
22-pentylfuranC3777693C9H14O138.2988.5544.2441.25556
Alcohol
1EthanolC64175C2H6O46.1437.495.4311.05592
2Isopentyl alcoholC123513C5H12O88.1733.8213.7531.24258
Acid
13-Methylbutanoic acidC503742C5H10O2102.1828.7299.4971.20925
Note, MW, molecular weight; RI, retention index; Rt, retention time; Dt, drift time.
Table 4. The taste values.
CHSourness
[a.u.]
Saltiness
[a.u.]
Bitterness
[a.u.]
Astringency
[a.u.]
Umami
[a.u.]
Aftertaste-A
[a.u.]
Aftertaste-B
[a.u.]
Richness
[a.u.]
Tasteless−13−6000000
RM−46.87 ab24.27 c8.83 d−6.54 d14.14 e0.04 a0.31 b1.58 bc
PM−48.63 c26.52 b9.17 d−6.68 d14.76 d0.02 b0.21 c2.36 b
DW−46.2 a17.55 e10.30 c−6.06 c17.33 b−0.1 c0.24 c0.18 d
DWP−47.95 bc16.99 e11.79 a−4.70 a15.55 c−0.11 cd0.21 c0.78 d
HWP−56.92 e37.24 a10.78 ab−4.52 a18.99 a−0.13 d0.40 a8.51 a
WP-A−47.99 bc21.42 d9.38 d−6.52 d14.86 d−0.09 c0.22 c1.22 bcd
IF−49.99 d23.27 c10.87 b−5.22 b15.00 cd−0.1 cd0.21 c0.85 cd
p-value00.012000.0030.03600
Note: Different lowercase letters (a–e) in the same row indicate significant differences between different taste values (p < 0.05).
Publisher’s Note: MDPI stays neutral with regard to jurisdictional claims in published maps and institutional affiliations.