


Inductively Coupled Plasma-Mass Spectrometry (ICP-MS), a Useful Tool in Authenticity of Agricultural Products’ and Foods’ Origin

 , , ,
, , ,  , and
, and
Abstract
1. Introduction
- (a)
- Protected designation of origin (PDO/food, agricultural products, and wines). All the production stages are taken place in specific geographical region.
- (b)
- Protected geographical indication (PGI/food, agricultural products, and wines). At least one of the production stages are taken place in specific geographical region.
- (c)
- Geographical indication (GI/Spirit drinks, and aromatized wines). In this category, at least one stage of the production should be in a specific area.
2. ICP-MS: Understanding the Basic Principles
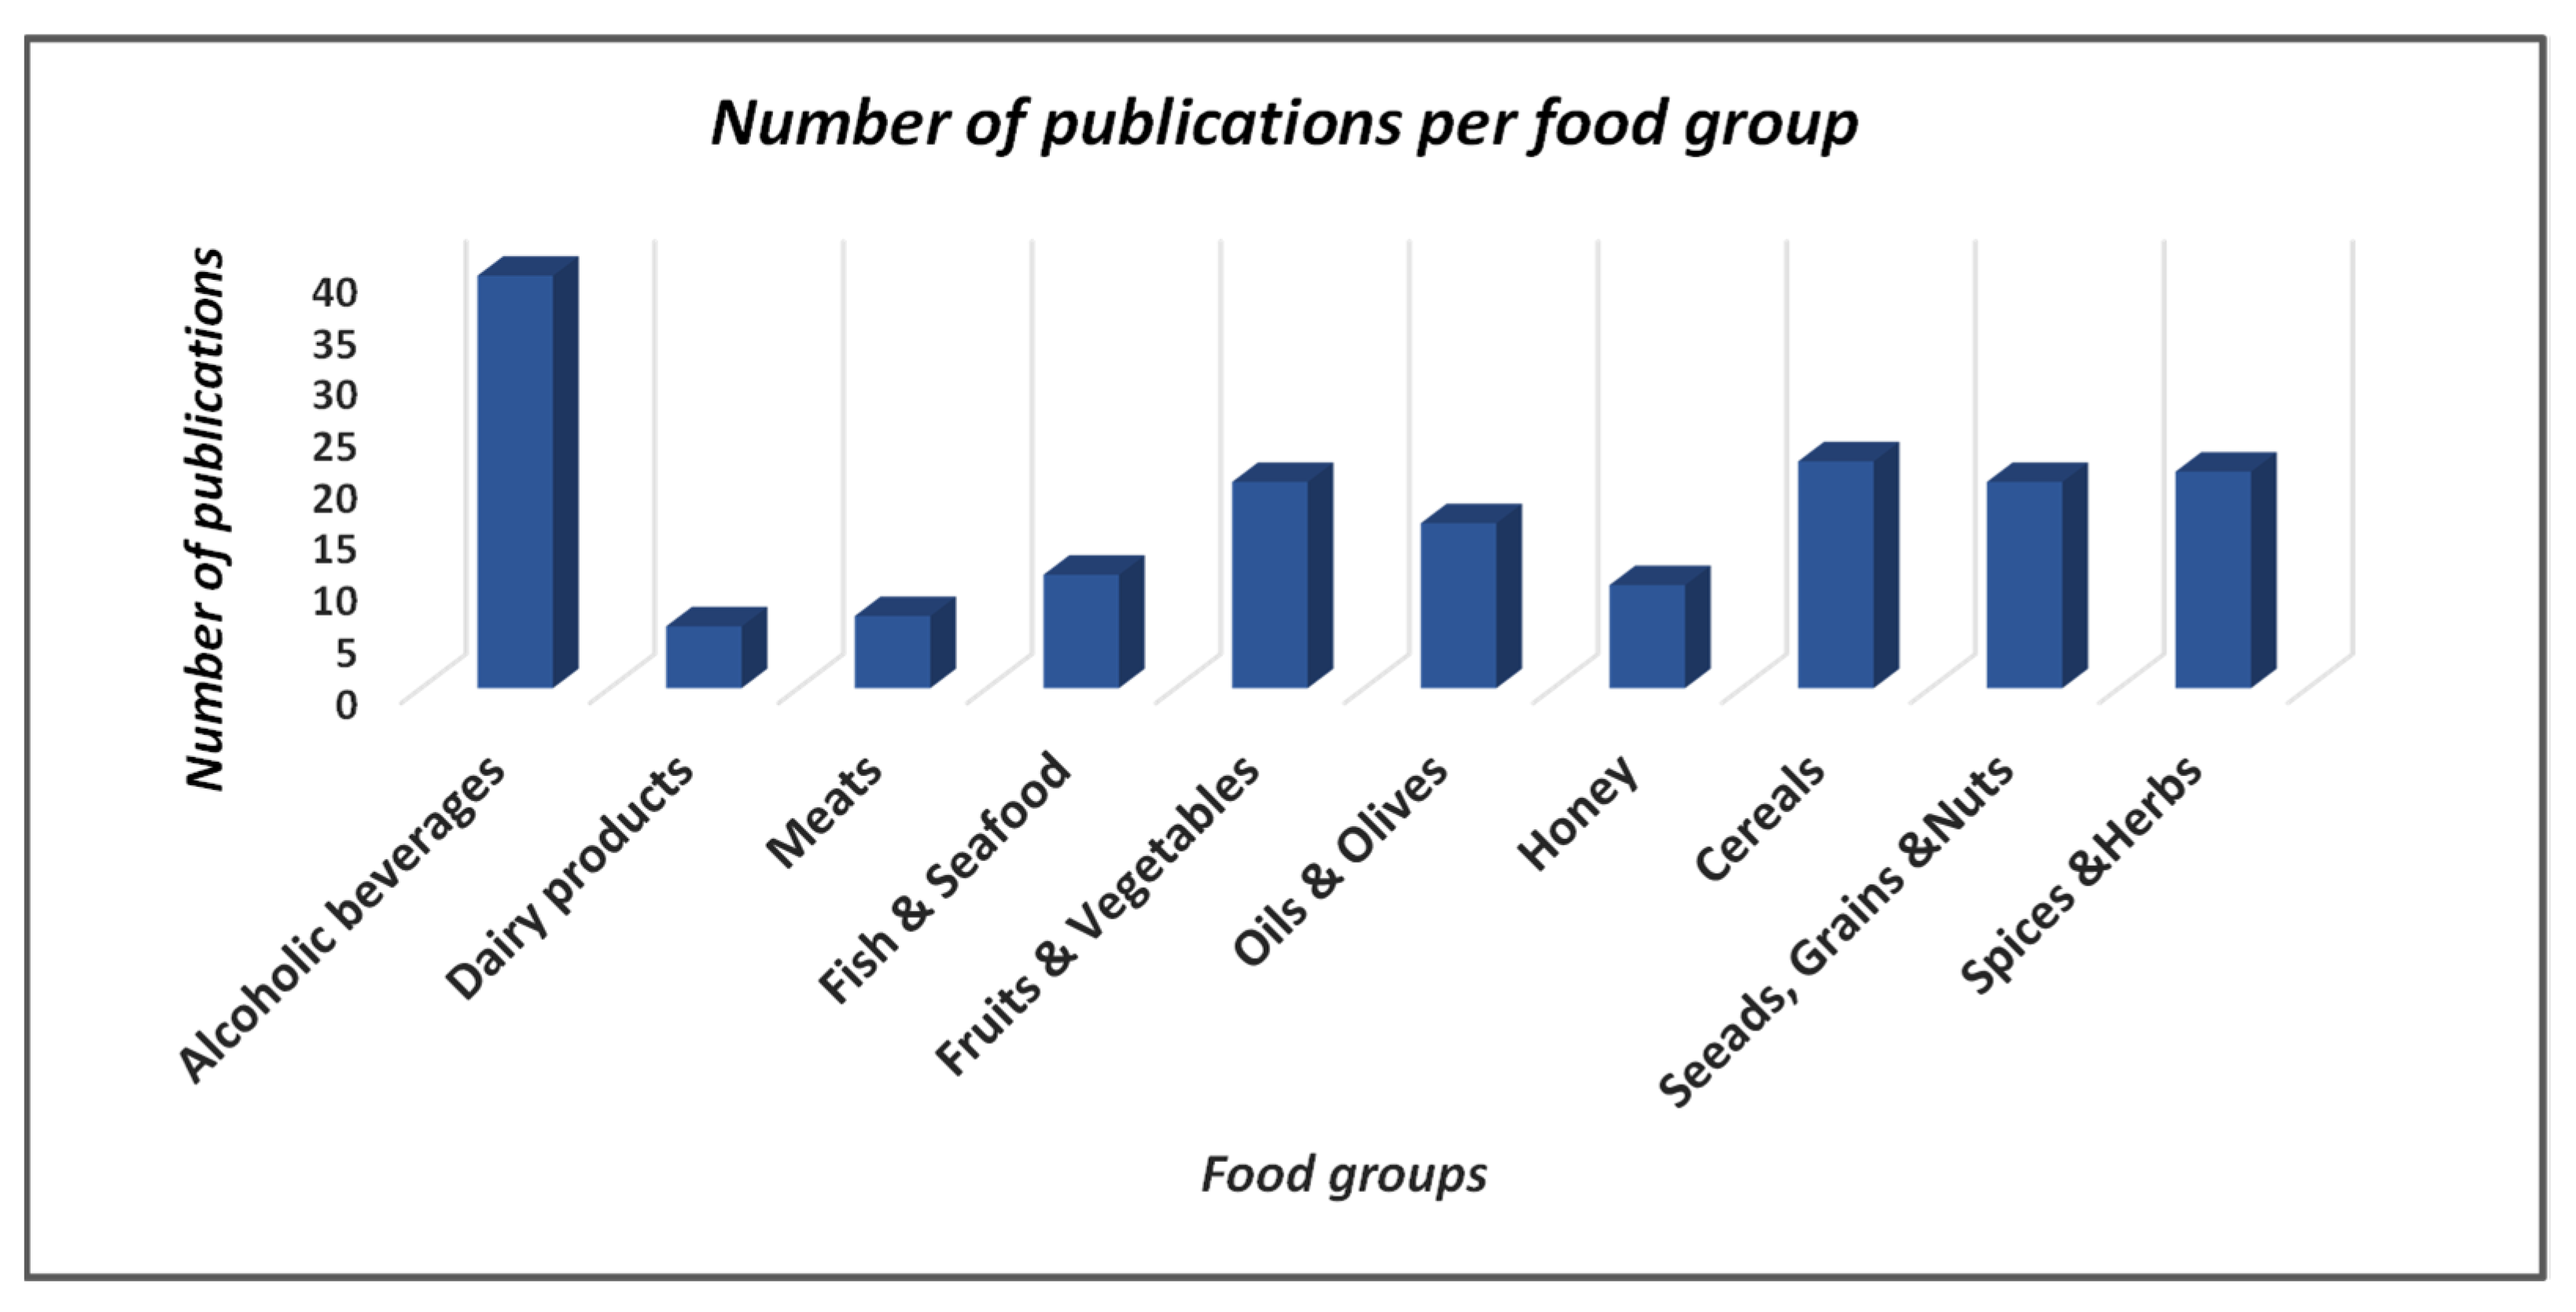
3. Database and Literature Search
4. Discussion
4.1. Alcoholic Beverages
4.2. Dairy Products: Milk and Cheese
4.3. Meats
4.4. Fish and Seafood
4.5. Vegetables, Mushrooms and Fruits
4.6. Oils and Olives
4.7. Honey
4.8. Cereals
4.9. Seeds and Nuts
4.10. Spices and Herbs

| Product | Measured Elements | Region | References | |
|---|---|---|---|---|
| 1. | Alcoholic Beverages (Wine) | Li, Be, Na, Mg, Al, K, Ca, Sc, Ti, V, Mn, Co, Ni, Ga, As, Se, Rb, Sr, Mo, Cs, Ba, La, Ce, W, and Pb | Australia | [40] |
| 2. | Alcoholic Beverages (Wine) | Al, As, Ba, Be, Bi, Ca, Cd, Co, Cr, Cs, Cu, Fe, Ga, In, K, Li, Mg, Mn, Ni, Pb, Rb, Se, Na, Ag, Sr, Tl, V, and U | Romania | [41] |
| 3. | Alcoholic Beverages (Wine) | Al, Cd, Co, Cr, Cu, Li, Mn, Ni, P, Pb, Rb, Sr, and Zn | California (USA) | [42] |
| 4. | Alcoholic Beverages (Wine) | B, Ba, Ca, Co, Cr, Cs, Cu, Fe, Ga, K, Li, Mg, Mn, Na, Ni, P, Rb, S, Sc, Si, Sr, Ti, Zn, Zr, Al, As, Cd, Ce, La, Mo, Nd, Pb, Sb, Sn, U, V, W, and Y | Spain | [43] |
| 5. | Alcoholic Beverages (Wine) | Al, As, B, Ba, Ca, Co, Cu, Fe, K, Mg, Mn, Na, Ni, P, Pb, Sr, and Zn | Portuguese | [44] |
| 6. | Alcoholic Beverages (Wine) | 87Sr/86Sr | Romania | [61] |
| 7. | Alcoholic Beverages (Wine) | Na, Mg, Al, K, Ca, Mn, Fe, Cu, Zn, Rb, Sr, Li, Cd, Cs, and Ba | China | [60] |
| 8. | Alcoholic Beverages (Wine) | Ce, Dy, Er, Eu, Gd, Ho, La, Lu, Nd, Pr, Re, Sm, Ta, Tb, Tm, V, Y, and Yb | Italy | [64] |
| 9. | Alcoholic Beverages (Wine) | As, Be, Bi, Co, Cr, Cu, K, Li, In, Tl, Se, Rb, V, U, Mg, Ni, Ba, Al, Cd, Fe, Ag, Ni and Zn | Romania | [45] |
| 10. | Alcoholic Beverages (Wine) | Na, Mg, P, K, Ca, Cu, Co, Cr, Zn, Sn, Fe, Mn, Li, Be, B, V, Sr, Ba, Al, Ag, Ni, As, Sn, Hg, Pb, Sb, Cd, Ti, Ga, Zr, Nb, Pd, Te, La, Sm, Ho, Tm, Yb, W, Os, Au, Tl, Th, and U | Greece | [46] |
| 11. | Alcoholic Beverages (Wine) | Li, V, Co, Ni, Ga, Mo, Cd, Sb, Cs, Ba, Ce, Nd, Ta, W, Tl, Pb, P, B, Si, Ca, Mn, Sr, K, and Rb | California (USA) | [47] |
| 12. | Alcoholic Beverages (Wine) | Mg, K, Ca, V, Mn, Fe, Co, Ni, Cu, Zn, Ga, As, Se, Rb, Sr, Mo, Cd, Ba, Pb, and U. 207Pb/206Pb, 208Pb/206Pb, 204Pb/206Pb, and 87Sr/86Sr | Argentina | [62] |
| 13. | Alcoholic Beverages (Wine) | Li, Be, V, Mn, Co, Ni, Cu, Ge, As, Rb, Sr, Mo, Cd, Ba, Hg, Tl, Pb, and Bi | Argentina | [48] |
| 14. | Alcoholic Beverages (Wine) | Ag, Al, As, Ba, Be, Bi, Ca, Cd, Co, Cr, Cs, Cu, Fe, Ga, In, K, Li, Mg, Mn, Na, Ni, Pb, Rb, Se, Sr, Tl, V, U, Zn, and Hg | Romania | [63] |
| 15. | Alcoholic Beverages (Wine) | Cu, Ni, Ca, Fe, B, Mg, As, Sb, Mn, Sn, P, Al, Zn, U, Sr, Cr, S, Co, Ba, La, Mo, Ti, Pb, Ce and V | Okanagan Valley (B.C., Canada) | [38] |
| 16. | Alcoholic Beverages (Wine) | Li, Be, Mg, Al, P, Cl, Ca, Ti, V, Mn, Fe, Co, Ni, Cu, Zn, As, Se, Br, Rb, Sr, Mo, Ag, Cd, Sb, I, Cs, Ba, La, Ce, Tl, Pb, Bi, Th, and U | Okanagan Valley, and Niagara Region (Canada) | [49] |
| 17. | Alcoholic Beverages (Wine) | Al, As, Ba, Be, Bi, Cd, Co, Cr, Cu, Fe, Li, Mn, Mo, Ni, Pb, Se, Sr, Ti, Tl, V, Zn, U, Sn, Sb, and Ga | Croatia | [50] |
| 18. | Alcoholic Beverages (Wine) | Sr, Rb, Ni, Co, Pb, Mn, Cd, Ga and Cs | New Zealand | [65] |
| 19. | Alcoholic Beverages (Wine) | Na, Mg, P, K, Ca, Al, Cr, Mn, Fe, Co, Ni, Cu, Zn, As, Se, Sr, Cd, Cs, Ba, and Pb | Spain | [51] |
| 20. | Alcoholic Beverages (Champagne) | K, Ca, Mg, Na, B, Fe, Al, Mn, Sr, Rb, Ba, Cu, Ni, Pb, Cr, and Li | 6 different brands of different vintages between 1983 and 2016 | [52] |
| 21. | Alcoholic Beverages (Wine) | Al, As, B, Ba, Ca, Ce, Cs, Co, Cr, Cu, Er, Eu, Fe, Ga, K, Mg, Mn, Mo, Na, Ni, P, Pb, Rh, Rb, Sb, Sn, Sr, Ti, Tl, Zn, and V | West coast of the USA | [53] |
| 22. | Alcoholic Beverages (Wine) | Ag, Al, As, B, Ba, Be, Ca, Cd, Ce, Co, Cr, Cs, Cu, Dy, Er, Eu, Fe, Ga, Gd, Hf, K, La, Li, Mg, Mn, Mo, Na, Nd, Ni, P, Pb, Pr, Rb, Re, Rh, Sb, Se, Sn, Sr, Ti, Tl, Tm, U, V, W, Yb, and Zn | California (USA) | [54] |
| 23. | Alcoholic Beverages (Wine) | Ag, B, Ba, Be, Bi, Cd, Co, Cr, Cu, Li, Mn, Mo, Ni, Pb, Rb, Sb, Sn, Sr, Te, Tl, U, and Zn | Italy, France, Poland, Spain, Slovakia, Australia, Portugal, Bulgaria, Germany, Hungary, Moldova, Chile, Austria, South Africa, New Zealand, Ukraine, Argentina, Czech Republic, Greece, UK, Armenia, and USA | [55] |
| 24. | Alcoholic Beverages (Wine) | Li, Be, Al, Sc, V, Cr, Mn, Fe, Co, Ni, Cu, Zn, Ge, Br, Rb, Sr, Y, Zr, Nb, Pd, Ag, Cd, Ba, Pr, Nd, Sm, Eu, Gd, Tb, Dy, Ho, Er, Tm, Yb, Lu, Hf, Ta, W, Re, Pt, Tl, Pb, Bi, U, Mo, Sn, Sb, La, and Ce | Portuguese | [56] |
| 25. | Alcoholic Beverages (Wine) | Na, K, P, Mg, and Ca | Greece | [57] |
| 26. | Alcoholic Beverages (Wine) | La, Ce, Pr, Nd, Sm, Eu, Gd, Tb, Dy, Ho, Er, Tm and Yb | Italy | [7] |
| 27. | Alcoholic Beverages (Wine) | Ag, Al, As, B, Ba, Bi, Cd, Co, Cr, Cu, Fe, Hg, Li, Mn, Mo, Na, Ni, Pb, Sb, Se, Sn, Sr, Ti, Tl, V, Zn, and Zr | Poland | [58] |
| 28. | Alcoholic Beverages (Wine) | Li, Al, V, Cr, Mn, Co, Ni, Cu, Rb, Sr, Mo, Ag, Cd, Ba, Tl, Pb, Bi, U, Be, Fe, As, Se, and Zn | Poland, Hungary, Moldova, and Bulgaria | [59] |
| 29. | Alcoholic Beverages (Wine) | La, Ce, Pr, Nd, Pm, Sm, Eu, Gd, Tb, Dy, Ho, Er, Tm, Yb, and Lu. | Italy | [66] |
| 30. | Alcoholic Beverages (Wine) | Li, Be, A1, Sc, Ti, V, Cr, Mn, Fe, Co, Ni, Cu, Zn, Ga, Ge, As, Se, Br, Rb, Sr, Y, Zr, Nb, Mo, Ru, Rh, Pd, Ag, Cd, In, Sn, Sb Te, I, Cs, Ba, La, Ce, Pr, Nd, Sm, Eu, Gd, Tb, Dy, Ho, Er, Tm, Yb, Lu, Hf, Ta, W, Re, Os, Ir, Pt, Au, Hg, Tl, Pb, Bi, Th, and U | Spain, and England | [39] |
| 31. | Alcoholic Beverages (Whiskey) | Al, Ti, V, Cr, Mn, Fe, Ni, Co, CU, Zn, Ga, As, Se, Rb, Sr, Zr, Mo, Nb, Ru, Rh, Pd, Ag, Cd, Sn, Sb, Te, Cs, Ba, La, Ce, Pr, Nd, Sm, Eu, Gd, Dy, Ho, Er, Tm, Yb, Lu, Hf, Ta, W, Re, Ir, Pt, Au, Tl, Pb, Th, and U | USA | [67] |
| 32. | Alcoholic Beverages (Whiskey) | Ag, Al, As, B, Ba, Be, Bi, Ca, Cd, Co, Cr, Cu, Fe, Ga, K, Li, Mg, Mn, Mo, Na, Ni, Pb, Rb, Se, Sr, Te, Tl, U, V, and Zn | Scotland, Ireland, and USA | [68] |
| 33. | Alcoholic Beverages (Whiskey) | Ag, Al, B, Ba, Be, Bi, Cd, Co, Cr, Cu, Li, Mn, Mo, Ni, Pb, Sb, Sn, Sr, Te, Tl, U, and V | Scotland, the USA, Ireland, Poland, Japan, the United Kingdom, India, Azerbaijan, Slovakia, Wales, and Bulgaria | [69] |
| 34. | Alcoholic Beverages (Cider) | 87Sr/86Sr, Li, Be, B, Al, Sc, Ti, V, Cr, Mn, Fe, Co, Ni, Cu, Zn, Ga, As, Se, Rb, Sr, Y, Mo, Cd, Sn, Sb, Cs, Ba, La, Ce, W, Tl, Pb, Bi, Th, and U | England, Switzerland, France, and Spain | [70] |
| 35. | Alcoholic Beverages (Cider) | Li, Be, B, Al, Sc, Ti, V, Cr, Mn, Fe, Co, Ni, Cu, Zn, Ga, As, Se, Rb, Sr, Y, Mo, Cd, Sn, Sb, Cs, Ba, La, Ce, W, Tl, Pb, Bi, Th and U | Spain, England, France, and Switzerland | [71] |
| 36. | Alcoholic Beverages (Beer) | V, Cr, Co, Ni, As, Se, Mo, Cd, In, Sb, Cs, Pb, Bi, and U | USA | [72] |
| 37. | Alcoholic Beverages (Beer) | Al, As, Ba, Cd, Co, Cr, Cu, Fe, Mo, Mn, Ni, Se, Sr, Pb, and Zn | Hungary, Belgium, the Czech Republic, Germany and Austria | [73] |
| 38. | Alcoholic Beverages (Beer) | K, Ca, Mg, Fe, Al, Mn, Zn, Na, Sr, Cu, Ti, Ba, Ni, Mo, V, Cr, Pb, Co, As, Se, Sn, Sb, U, and Cd | USA and Germany | [74] |
| 39. | Alcoholic Beverages (Beer) | Nb, Fe, Rb, Zr, Mg, Ni, and Zn | Cavalese, and Imér | [75] |
| 40. | Alcoholic Beverages (Liquor) | V, Cr, Mn, Ni, Co, As, Se, Sr, Mo, Cd, Sb, Ba, Pb, Bi, Al, Fe, and K | China | [76] |
| 41. | Milk and Dairy (Cow and Buffalo Milk) | P, S, K, Ca, V, Cr, Mn, Fe, Co, Zn, Ga, Rb, Sr, Mo, Cs and Ba | Italy | [77] |
| 42. | Milk and Dairy (Cow Milk) | Li, Al, Cr, Mn, Fe, Co, Ni, Cu, Zn, As, Se, Sr, Cd, Ba, Pb, and Bi | Sri Lanka | [8] |
| 43. | Milk and Dairy (Cow and Goat Milk) | Al, V, Cr, Mn, Fe, Co, Ni, Cu, Zn, As, Se, Sr, Cd, Cs, Ba, Pb, U, La, Ce, Pr, Nd, Sm, Eu, Gd, Tb, Dy, Ho, Er, Yb, Lu, and Y | Italy | [78] |
| 44. | Milk and Dairy (Cow Milk) | Sc, Ti, V, Cr, Mn, Fe, Co, Ni, Cu, Zn, Rb, Sr, Y, Zr, Sn, Sb, Ba, La, Ce, Pr, Nd, Sm, Eu, Gd, Tb, Dy, Ho, Er, Tm, Yb, Lu, Pb, Th, and U | Italy | [79] |
| 45. | Milk and Dairy (Cheese) | Ca, Mg, Na, K, Cu, Mn, Mo, and I | Finland, England, Germany, Austria, France, and Switzerland | [80] |
| 46. | Milk and Dairy (Cheese) | Li, Na, Mn, Fe, Cu, Se, Rb, Sr, Mo, Ba, Re, Bi, and U | Italy | [81] |
| 47. | Meat (Yak) | Na, Mg, Al, K, Ca, Sc, V, Cr, Mn, Fe, Co, Ni, Cu, Zn, As, Se, Rb, Sr, Y, Mo, Ru, Rh, Pd, Ag, Cd, Sn, Sb, Te, Cs, Ba, La, Ce, Pr, Nd, Sm, Eu, Gd, Tb, Dy, Ho, Er, Tm, Lu, Yb, Hf, Ir, Pt, Au, Tl, Pb, Th, and U | Qinghai-Tibetan | [84] |
| 48. | Meat (Rabbit) | As, Be, Ca, Cd, Co, Cr, Cu, Fe, Li, Mg, Mn, Mo, Ni, Pb, Sb, Se, Sr, Ti, Tl, V, Zn, Ce, Dy, Er, Eu, Gd, Ho, La, Lu, Nd, Pr, Sm, Tb, Tm, Yb, Sc, Y, Th and U | Lemnos (Greece) | [85] |
| 49. | Meat (Pork) | Ba, Be, Bi, Cd, Co, Cr, Cu, Cs, Ga, Li, Mn, Ni, Pb, Rb, Se, Sr, U, and V | Korea, USA, Germany, Austria, Netherlands, and Belgium | [87] |
| 50. | Meat (Mutton) | Be, Na, Al, Ca, V, Cr, Mn, Fe, Co, Ni, Cu, Zn, As, Se, Ag, Sb, Ba, Tl, Pb, Th, and U | China | [88] |
| 51. | Meat (Cured Ham) | Zn, Fe, Rb, Cu, Sr, Al, Mn, Se, Ni, Cs, Cr, Ba, Li, As, Pb, V, Cd, Sc, Co, Ga, Tl, Y, Nd, Gd, Pr, Be, U, Sm, Dy, Yb, Eu, Ho, Tb, Tm, Rb/Sr, and 87Sr/86Sr | Europe | [89] |
| 52. | Meat (Rabbit) | Ce, Dy, Er, Eu, Gd, Ho, La, Lu, Nd, Pr, Sc, Sm, Tb, Tm, Y, Yb, Th, and U | Lemnos (Greece) | [86] |
| 53. | Meat (Beef) | Na, Al, K, V, Cr, Mn, Fe, Ni, Cu, Rb, Sr, Mo, Cs, and Ba | Europe, USA, South America, Australia, and New Zealand | [83] |
| 54. | Fish and Seafood (Sea Cucumber) | Al, V, Cr, Mn, Fe, Co, Ni, Cu, Zn, As, Se, Mo, Cd, Hg, and Pb | Bohai Sea, Yellow Sea, and East China Sea (China) | [92] |
| 55. | Fish and Seafood (Mussels) | Ag, As, Ba, Cd, Co, Cr, Cu, Ga, Mn, Mo, Nb, Ni, Pb, Rb, Sb, Se, Sn, Sr, Te, Tl, V, Zn, Ta, Zr; Ce, Dy, Er, Eu, Gd, Ho, La, Lu, Nd, Pr, Sm, Th, Tm, U, Y, and Yb | Spain, and France | [94] |
| 56. | Fish and Seafood (Salmon) | B, Ba, Fe, K, Mg, Mn, Na, Pb, S, Sr, U and Zn | Norway | [96] |
| 57. | Fish and Seafood (various Marine Species) | Cr, Mn, Fe, Co, Cu, Zn, As, Se, Rb, Sr, Mo, Ni, Cd, Sn, I, Ti, Ba, Hg, Pb, and Bi | China | [104] |
| 58. | Fish and Seafood (Mussels) | Al, As, Cd, Co, Cr, Cu, Fe, Hg, Mn, Mo, Ni, Pb, Se, Sn, V, and Zn | Mediterranean Sea (Venice Lagoon) | [95] |
| 59. | Fish and Seafood (Cuttlefish) | Na, Mg, K, Ca, P, Cu, Zn, Cr, Fe, Mo, Co, V, Ni, Mn, As, Cd, Pb, and Hg | Mediterranean Sea (Sicilian Coasts) | [97] |
| 60. | Fish and Seafood (Manila Clam) | Na, Mg, Al, K, V, Mn, Fe, Co, Cu, Zn, As, Se, Rb, Sr, Mo, Pd, Cd, Sn, Sb, Cs, Ba, La, Ce, Pb, and U | China | [98] |
| 61. | Fish and Seafood (Mitten Crab) | Na, Mg, Al, K, Ca, Mn, Cu, Zn, Sr, and Ba | China | [99] |
| 62. | Fish and Seafood (Sea Bass) | La, Eu, Ho, Er, Lu, and Tb | Mediterranean Sea | [100] |
| 63. | Fish and Seafood (Sea Cucumber) | Li, V, Cr, Mn, Co, Ni, Cu, As, Sn, Sr, Ag, Cd, Se, Ba, Pb, Bi, Y, La, Ce, Pr, Nd, Sm, Eu, Gd, Tb, Dy, Ho, Er, Tm, Yb, Lu, and Sc | China | [93] |
| 64. | Fish and Seafood (Shrimps) | Pb, Cd, As, P, and S | Senegal, Mozambique, North Atlantic, Argentina, and Nigeria | [101] |
| 65. | Fish and Seafood (Caviar) | Cl, Na, P, S, K, Mg, Ca, Zn, Br, Fe, Mn, Si, Sr, Rb, Cu, I, Se, As, Ba, Al, B, Co, Pb, Ag, Mo, Li, Ti, Hg, Cs, Ni, Ge, Sn, Cd, V, Cr, Sb, Pb, Te, U, Tl, Zr, Nd, Ga, Rh, La, Y, Ce, W, Be, Ta, Bi, Gd, Ru, Pr, Se, Sm, Th, Eu, Re, Dy, Au, Nb, Er, Yb, Hf, Tb, Ho, Pt, Tm, Os, Lu, and Ir | Sweeden, and Finland | [102] |
| 66. | Fish and Seafood (Anchovy) | Li, Be, B, Al, V, Cr, Fe, Mn, Ni, Cu, Zn, Co, Ga, Ge, As, Se, Rb, Sr, Zr, Mo, Ru, Cd, In, Sn, Sb, Te, Cs, Ba, Hf, Ta, Re, Pt, Tl, Pb, Bi, Th, La, Ce, Pr, Nd, U, Y, Sm, Eu, Gd, Tb, Dy, Ho, Er, Tm, Yb, Lu, Na, Mg, P, K, Ca, Mn, Cu, Zn | Cantabria, Tunisia, and Croatia | [103] |
| 67. | Vegetables (Onion) | Al, Ba, Ca, Cd, Ce, Cr, Dy, Eu, Fe, Ga, Gd, Ho, La, Mg, Mn, Na, Nd, Ni, Pr, Rb, Sm, Sr, Tl, Y, and Zn | Calabria (Italy) | [106] |
| 68. | Vegetables (Onion) | Co, Ni, Cu, Rb, Mo, Cd, and Cs | Japan, China, the United States, New Zealand, Thailand, Australia, and Chile | [107] |
| 69. | Vegetables (Garlic) | Cr, Ni, Cu, As, Se, Sb, Ba, Pb, Zn, Fe, Mg, Ca, Al, Na, K, Mn and Cd | Spain, Tunisia, and Italy | [108] |
| 70. | Vegetables (Garlic) | Li, B, Na, Mg, P, S, Ca, Ti, Mn, Fe, Cu, Ni, Zn, Rb, Sr, Mo, Cd, and Ba | Argentine, Canada, Chile, Korea, Mexico, Pakistan, Thailand, United States, and Vietnam | [109] |
| 71. | Vegetables (Soybean) | Ag, As, Ba, Ca, Cd, Co, Cr, Cu, Fe, K, Mg, Mn, Mo, Na, Ni, Pb, Sb, Se, Sn, Sr, Ti, Tl, V and Zn | Zhejiang, Heilongjiang, Hebei, Inner Mongolia, Henan, Hainan, and Fujian (China) | [110] |
| 72. | Vegetables (Tomato, Pepper, Eggplant) | Mn, Fe, Cu, Zn, Cr, Ni, Cd, and Pb | Romania | [111] |
| 73. | Vegetables (Peper Capsicum annuum L.) | Ar, Ba, Ca, Cd, Co, Cr, Cs, Cu, Fe, K, Mn, Mg, P, Mo, Ni, Na, Pb, Rb, Sb, Sn, Tl, Y, Sr, and Zn | Xiazi, Huaxi, and Hezhang (China) | [112] |
| 74. | Vegetables (Chili peppers) | Al, As, Ba, Ca, Cd, Ce, Co, Cr, Cs, Cu, Dy, Fe, Ga, La, Li, Mg, Mn, Na, Nd, Ni, Pb, Pr, Rb, Sc, Se, Sr, Tl, Tm, V, Y, Yb, and Zn | Calabria (Italy) | [113] |
| 75. | Vegetables (Tomato) | Al, As, Ba, Be, Ca, Cd, Ce, Cu, Dy, Fe, K, La, Lu, Mg, Mn, Na, Nd, Pb, Rb, Sm, Sr, Th, U, V, and Zn | Italy, China, Greece and California | [114] |
| 76. | Vegetables (Tomato) | Y, La, Ce, Pr, Nd, Sm, Eu, Gd, Tb, Dy, Ho, and Yb | Italy | [115] |
| 77. | Vegetables (Tomato) | Li, Be, B, Na, Mg, Al, P, K, Ca, V, Cr, Mn, Fe, Co, Ni, Cu, Zn, Ga, Ge, As, Se, Rb, Sr, Y, Mo, Ag, Cd, Sn, Sb, Cs, Ba, La, Ce, Pr, Nd, Sm, Eu, Gd, Dy, Ho, Tm, Yb, Ir, Tl, Pb, U | Italy | [116] |
| 78. | Vegetables (Chinese cabbage) | Mn, Cu, Sr, Ba, S, Co, Cr, Li, Ni, Ti, V, and Zn | China, and Korea | [117] |
| 79. | Mushrooms (Truffles) | Li, Na, Mg, Al, K, V, Cr, Mn, Co, Ni, Cu, Ga, Rb, Sr, Mo, Ag, Cd, Te, Ba, Tl, Pb, Bi, U, Sc, Y, La, Ce, Pr, Nd, Sm, Eu, Gd, Tb, Dy, Ho, Er, Tm, Yb, Lu, Th, Be, B, Fe, Zn, As, and Se | Bulgaria, Romania, Croatia, Hungary, Iran, Slovenia, Italy, Spain, Australia, and China | [118] |
| 80. | Fruits (Lemon) | K, Ca, Mg, Na, Fe, Zn, B, Cu, Al, Mn, Ni, Cr, Pb, Co, As, Se, Cd, Sb, V, La, Ce, Pr, Nd, Sm, Eu, Gd, Tb, Dy, Ho, Er, Tm, and Lu | Italy, and Turkey | [119] |
| 81. | Fruits (Apples) | Ag, Al, As, Be, Bi, Cd, Co, Cr, Cu, Fe, Ga, In, Mn, Mo, Ni, Pb, Rb, Se, Sn, Tl, U, V, Zn, La, Ce, Pr, Nd, Sm, Eu, Gd, Tb, Dy, Ho, Er, Tm, and and Lu | Italy | [120] |
| 82. | Fruits (Mango) | Li, Be, B, Na, Mg, Al, P, K, Ca, V, Cr, Mn, Fe, Co, Ni, Cu, Zn, Ga, Ge, As, Se, Rb, Sr, Y, Mo, Pd, Ag, Cd, In, Sn, Sb, Te, Cs, Ba, La, Ce, Pr, Nd, Sm, Eu, Gd, Dy, Er, Tm, Yb, Re, Ir, Pt, Au, Hg, Pb, Th and U | Spain, Senegal, Ivory Coast, Equatorial Guinea, Peru, Mexico, and Brazil | [121] |
| 83. | Fruits (Avocado) | Li, Be, B, Na, Mg, Al, P, K, Ca, Cr, Mn, Fe, Co, Ni, Cu, Zn, Ga, Ge, As, Se, Rb, Sr, Y, Mo, Pd, Ag, Cd, Sn, Sb, Cs, Ba, La, Ce, Pr, Nd, Sm, Eu, Gd, Dy, Ho, Er, Tm, Yb, Hg, Pb, and U | Spain, Brazil, Chile, Colombia, Kenya, Mexico, Peru, and South Africa | [122] |
| 84. | Fruits (Pear) | Al, As, B, Be, Ca, Cd, Co, Cr, Cu, Fe, K, Li, Mg, Mn, Mo, Na, Ni, P, Pb, Se, Sn, Sr, Tl and Zn | Portuguese | [123] |
| 85. | Fruits (Jackfruits) | Ba, Al, Ca, Co, Cs, Cr, Cu, Fe, Ga, S, K, Li, Mg, Mn, Na, Ni, Mo, Rb, Ti, U, B, Zn, Si, and Xe | India | [124] |
| 86. | Fruits (Clementine) | Ag, Al, As, Ba, Be, Bi, Ca, Cd, Co, Cr, Cs, Cu, Fe, Ga, In, K, Li, Mg, Mn, Na, Ni, Pb, Rb, Se, Sr, Tl, V, U, Zn, Ce, Dy, Er, Eu, Gd, Ho, La, Lu, Nd, Pr, Sm, Sc, Tb, Th, Tm, Y, and Yb | Calabria (Italy) | [125] |
| 87. | Oil (EVOO) | Be, Mg, Ca, Sc, Cr, Mn, Fe, Co, Ni, As, Se, Sr, Y, Cd, Sb, Sm, Eu, and Gd | Italy | [126] |
| 88. | Oil (EVOO) | Li, B, Na, Mg, K, Ca, Mn, Co, Cu, Ga, Se, Rb, Sr, Mo, Cd, Cs, Ba, La, Ce, Nd, Sm, Eu, Yb, Tl, Pb, and U | Italy | [127] |
| 89. | Oil (EVOO) | Mg, K, Ca, V, Mn, Zn, Rb, Sr, Cs, La, Ce, Sm, Eu, U | European Region | [128] |
| 90. | Oil (VOO) | Y, La, Ce, Pr, Nd, Sm, Gd, Tb, Dy, Ho, Er, Tm, Yb, and Th | Zakynthos, Iraklio, Lakonia, and Messinia (Greece) | [129] |
| 91. | Oil (VOO) | Al, As Ba, Ca, Co, Cr, Cs, Cu, Fe, Ga, Hf, K, Li, Mo, Mn, Mg Na, Sr, Nb, Ni, Pb, Rb, Sc, Se, Sn, and Ta | Spain | [130] |
| 92. | Oil (VOO) | V, Mn, Ni, Cu, Ba, Na, K, Ca, Fe, Mg, Pb, As, Co, Cr, and Zn | İzmir, Manisa, Aydın, Muğla, Bursa, and Edremit Bay (Turkey) | [131] |
| 93. | Oil (EVOO) | Na, Mg, V, Fe, Mn, Zn, As, Rb, Sr, Ba, and Pb | Tunisia | [132] |
| 94. | Oil (EVOO) | Sc, Ti, V, Cr, Mn, Fe, Co, Ni, Cu, Rb, Sr, Y, Cd, Sb, Ba, La, Ce, Pr, Nd, Sm, Eu, Gd, Tb, Dy, Ho, Er, Tm, Yb, Lu, W, Tl, Pb, Th, and U | Italy (different varieties) | [133] |
| 95. | Oil (EVOO) | B, Na, P, Ca, Li, Mg, Fe, Cu, and As | Tunisia | [134] |
| 96. | Oil (EVOO) | Li, Be, B, Na, Mg, Al, Si, P, K, Ca, Ti, V, Cr, Mn, Fe, Co, Ni, Cu, Zn, Ga, As, Se, Rb, Sr, Zr, Nb, Mo, Ag, Cd, Sn, Sb, Te, Cs, Ba, La, Ce, Pr, Nd, Tb, Dy, W, Tl, Pb, Bi, and U | Tuscany, Umbria, Apulia, Sardinia, Sicily, Abruzzo, Campania, and Marche (Italy) | [135] |
| 97. | Oil (EVOO) | Ag, Al, As, B, Ba, Ca, Cd, Co, Cr, Cs, Cu, Fe, Ga, Ge, K, Li, Mg, Mn, Mo, Na, Ni, P, Pb, Rb, Sb, Se, Si, Sn, Sr, Ti, V, W, Zn, Zr, Ce, Dy, Er, Eu, Gd, Ho, La, Lu, Nd, Pr, Sm, Sc, Tb, Tm, Yb, and Y | Tunisia | [136] |
| 98. | Oil (VOO) and Olives | Al, As, Cd, Co, Cr, Cu, Fe, Ni, Pb, Sb, and V | Spain | [137] |
| 99. | Olives | Sr, Cu, Rb, Ti, Ni, Sn, Cr, V, Co, Sb Cd, Pb, As, and Zr | Italy | [138] |
| 100. | Oil (EVOO) | As, Ba, Ca, Cd, Co, Cr, Cu, Fe, K, Mg, Mn, Ni, Rb, Sr, Pb, V, and Zn | Tunisia, and Europe | [9] |
| 101. | Different types of oil | Ag, As, Ba, Be, Cd, Co, Cu, Fe, Hg, Mn, Mo, Ni, Pb, Sb, Ti, Tl, and V | Spain | [139] |
| 102. | Oil (VCO) | Na, Mg, Al, P, Ca, Cr, Mn, Fe, Ni, Cu, Zn, Se, Rb, Sr, Mo, Cs, and Pb | Kerala, Karnataka, Andhra, Tamil Nadu, Goa (India) | [141] |
| 103. | Honey | Al, B, Ba, Ca, Cd, Cr, Cu, K, Mg, Mn, Na, Ni, Pb, Sr, and Zn | Poland | [142] |
| 104. | Honey | Al, Cu, Pb, Zn, Mn, Cd, Tl, Co, Ni, Rb, Ba, Be, Bi, U, V, Fe, Pt, Pd, Te, Hf, Mo, Sn, Sb, P, La, Mg, I, Sm, Tb, Dy, Sd, Th, Pr, Nd, Tm, Yb, Lu, Gd, Ho, Er, Ce, and Cr | Brazil | [143] |
| 105. | Honey | Na, Mg, P, K, Ca, Mn, Fe, Cu, Zn, Rb, Sr, and Ba | China | [144] |
| 106. | Honey | Mn, Cu, Cr, Ni, Se, Pb, Cd, and As | Sicily, and Calabria (Italy) | [145] |
| 107. | Honey | As, Cd, Cr, Cu, Hg, Fe, Mn, Ni, Pb, and Zn | Romania | [147] |
| 108. | Honey | Ag, Al, As, Au, B, Ba, Be, Bi, Ca, Cd, Ce, Cs, Cr, Co, Cu, Dy, Er, Eu, Fe, Ga, Gd, Ge, Hg, Hf, Ho, Rb, K, La, Li, Lu, Mg, Mn, Mo, Na, Nb, Nd, Ni, Os, P, Pb, Pd, Pt, Pr, Re, Ru, Se, Sb, Sr, Sm, Sn, Ta, Tb, Te, Th, Tl, Tm, Ti, U, V, W, Y, Yb, Zn and Zr. | Africa, Asia, Europe, North America, and Oceania | [146] |
| 109. | Honey | Al, As, Ba, Ca, Cd, Co, Cr, Cu, Mg, Mn, Na, Ni, K, Pb, Sr, Ti, V and Zn | Romania | [148] |
| 110. | Honey | Al, As, Au, Ba, Co, Cr, Cs, Cu, Fe, In, Ir, Mg, Mn, Pb, Pd, Pt, Rb, Sb, Se, Te, Th, Tl, U, V, Zn, Ce, Dy, Eu, Er, Gd, Ho, La, Lu, Nd, Pr, Sm, Tb, Tm, Yb, and Zn | Santa Catarina, Paraná, and Rio Grande do Sul (Brazil) | [149] |
| 111. | Honey | Li, Mg, Mn, Ni, Co, Cu, Sr, Ba, Pb, Y, La, Ce, Pr, Nd, Sm, Eu, Gd, Tb, Dy, Ho, Er, Tm, Yb, and Lu | Greece, Bulgaria, Romania, Italy, Thailand, and Poland | [150] |
| 112. | Honey | Ag, As, Ba, Be, Bi, Cd, Co, Cr, Cu, Fe, Hg, Li, Mn, Mo, Ni, Pb, Sb, Sn, Sr, Te, Tl, V, and Zn | Sardinia (Italy) | [151] |
| 113. | Cereals (Wheat) | Cd, Pb, Se, and Sr | USA, Canada, and Europe | [155] |
| 114. | Cereals (Wheat) | Be, Na, Mg, Al, K, Ca, V, Mn, Fe, Cu, Zn, Mo, Cd, Ba, and Th) | China | [156] |
| 115. | Cereals (Wheat) | K/Rb, Ca/Sr, Ba, 87Sr/86Sr, Co, Mo, Zn, Mn, Eu, δ13C, and Na | Buenos Aires, Córdoba, and Entre Ríos | [157] |
| 116. | Cereals (Wheat) | Be, Na, Mg, Ca, Sc, Ti, V, Cr, Mn, Fe, Co, Cu, Zn, Ga, Se, Rb, Sr, Y, Zr, Cd, Cs, and Pb | China | [158] |
| 117. | Cereals (Wheat) | Mg, Al, Ca, Mn, Fe, Cu, Zn, As, Sr, Mo, Cd, Ba, and Pb | China | [159] |
| 118. | Cereals (Maize) | B, Na, Mg, Al, P, K, Ca, V, Cr, Mn, Fe, Co, Ni, Cu, Zn, As, Se, Rb, Sr, Mo, Cd, Cs, Ba, Pb, and U | China | [161] |
| 119. | Cereals (Wheat, Barley), and Legumes (Faba Bean) | Li, Be, B, Na, Mg, Al, Si, P, S, Cl, K, Ca, Sc, Ti, V, Cr, Mn, Fe, Co, Ni, Cu, Zn, Ga, Ge, As, Se, Br, Rb, Sr, Y, Zr, Nb, Mo, Ru, Rh, Pd, Ag, Cd, In, Sn, Sb, Te, I, Cs, Ba, La, Ce, Pr, Nd, Sm, Eu, Gd, Tb, Dy, Ho, Er, Tm, Yb, Lu, Hf, Ta, W, Re, Os, Ir, Pt, Au, Hg, Tl, Pb, Bi, Th, and U | Zealand, Central Jutland, and South Jutland | [160] |
| 120. | Rice | Ni, Mo, As, and Cd | Vietnam | [162] |
| 121. | Rice | Ni, Mo, As, and Cd | Vietnam | [163] |
| 122. | Rice | B, Ho, Gd, Mg, Rb, Se, and W | India, Pakistan, USA, France, Italy, Spain, | [164] |
| 123. | Rice | Al, Fe, Co, Ni, Cu, Rb, Sr, and Ba | Japan, USA, China, and Thailand | [165] |
| 124. | Rice | Mg, K, Ca, Na, Be, Mn, Ni, Cu, Cd, Fe, Al, Cr, Zn, Sb, and Pb | China | [166] |
| 125. | Rice | B, Co, Sr, Mo, Cd, Cs, Ba, Pb, Ti, V, As, Se, Mn, Cu, Rb, Mg, Al, Cr, Fe, Ni, and Zn | Thailand, France, Japan, India, Italy, and Pakistan | [167] |
| 126. | Rice | As, B, Ba, Ca, Cd, Ce, Co, Cr, Cu, Fe, K, La, Mg, Mn, Mo, P, Pb, Rb, Se and Zn | Brazil | [168] |
| 127. | Rice | B, Mg, Al, Ti, V, Cr, Mn, Fe, Ni, Zn, Ga, As, Sr, Cd, Sn, Sb, Ba, Pb, Bi, and Tl | China | [169] |
| 128. | Rice | Al, As, Ba, Bi, Cd, Ca, Cr, Co, Cu, Fe, Pb, Li, Mg, Mn, Mo, Ni, K, Se, Na, Sr, Tl, Ti, Zn, La, Ce, Pr, Nd, Sm, Eu, Ho, Er and Yb | China | [170] |
| 129. | Rice | 87Sr/86Sr, 207Pb/206Pb, 208Pb/207Pb, Li, Be, Na, Mg, Al, Ca, Ti, V, Cr, Mn, Fe, Co, Ni, Cu, Zn, Rb, Sr, Mo, Ag, Cd, Sn, Sb, Ba, Pb, and Bi | China, Thailand, and Malaysia | [171] |
| 130. | Rice | B, Na, Mg, Al, K, Ca, Sc, Ti, V, Cr, Mn, Fe, Co, Ni, Cu, Zn, Ga, Ge, As, Se, Rb, Sr, Nb, Mo, Ag, Cd, Cs, Ba, Hg, and Pb | Heilongjiang, Liaoning, Jiangsu, Hubei, and Guangxi | [172] |
| 131. | Rice | Na, Mg, Al, Si, P, S, K, Ca, Sc, Ti, Cr, Mn, Fe, Co, Ni, Cu, Zn, Ga, Ge, As, Se, Br, Rb, Sr, Y, Mo, Ba, La, Ce, Au, and Pb | India, and Pakistan | [173] |
| 132. | Rice | Mn, Rb, Co, and Mo | Thailand | [174] |
| 133. | Rice | B, Na, Mg, Al, K, Ca, Sc, Ti, V, Cr, Mn, Fe, Co, Ni, Cu, Zn, Ga, Ge, As, Se, Rb, Sr, Nb, Mo, Ag, Cd, Cs, Ba, Hg, and Pb | China, India, Vietnam, and Ghana | [175] |
| 134. | Rice | Ag, Al, As, Ba, Be, Bi, Ca, Cd, Co, Cr, Cs, Cu, Fe, Ga, In, K, Li, Mg, Mn, Na, Ni, Pb, Rb, Se, Sr, Tl, U, V, Zn, Ce, Dy, Er, Eu, Gd, Ho, La, Lu, Nd, Pr, Sc, Sm, Tb, Th, Tm, and Y | Vietnam | [176] |
| 135. | Coffee | Ba, Ca, Cu, Fe, Mg, Mn, P, Si, K, and S | Ethiopia | [178] |
| 136. | Coffee | B, Na, Mg, Al, Cr, Mn, Fe, Co, Ni, Cu, Zn, Ga, Rb, Sr, Mo, Ba, Pb, Bi, Y, La, Ce, Pr, Sm, Nd, Eu, Dy, Th, Sc, Ho, and Gd | Hawaii, Kauai, Maui, Molokai, and Oahu | [179] |
| 137. | Coffee | K, Mg, Ca, Fe, Al, Mn, Cu, Ba, Sr, Zn, Cr, Pb, Ni, V, Co, Ga, U, Cd, Ag, Li, In, Bi, Th, and Tl | Brazil, Ethiopia, Kenya, Columbia, and India | [180] |
| 138. | Coffee | Na, Ca, K, Mg, Al, As, Pb, Ni, Zn, Cu, Mn, Cd, Fe, Hg, and Cr | Germany, Netherlands, Italy, Austria, Slovenia, France, Romania, Brazil, and Greece | [181] |
| 139. | Coffee | Li, Be, B, Na, Mg, Al, P, K, Ca, Ti, V, Cr, Mn, Fe, Co, Ni, Cu, Zn, Ga, Ge, As, Se, Rb, Sr, Y, Mo, Pd, Ag, Cd, Sn, Sb, Te, Cs, Ba, La, Ce, Pr, Nd, Sm, Eu, Gd, Dy, Er, Tm, Yb, Re, Ir, Pt, Au, Hg, Tl, Pb, Bi and U | Central/South America, Africa, and Asia | [182] |
| 140. | Coffee | Ba, Ca, Cu, Fe, K, Mg, Mn, P, Sr, Sc, and Zn | Espirito Santo, Minas Gerais, and São Paolo (Brazil) | [183] |
| 141. | Cocoa | Li, Be, B, Na, Mg, Al, P, K, Ca, Ti, V, Cr, Mn, Fe, Co, Ni, Cu, Zn, Ga, Ge, As, Se, Rb, Sr, Y, Mo, Pd, Ag, Cd, In, Sn, Sb, Te, Cs, Ba, La, Ce, Pr, Nd, Sm, Eu, Gd, Dy, Er, Tm, Yb, Re, Ir, Pt, Au, Hg, Tl, Pb, Bi, Th, and U | Africa, Asia, Central and South America | [184] |
| 142. | Cocoa | Na, Cr, La, Ce, Mo, Cs, Ga, Ti, Y, Ba, Rb, Zn, Sr, Fe, Mg, Al, Co, Cu, Cd, Mn, Ni, As, Pb, and V | Congo, Mexico, Ecuador, Venezuela, Costa Rica, Vanuatu, and Trinidad | [185] |
| 143. | Cocoa | B, Ba, Ca, Cd, Co, Cr, Cs, Cu, K, Ni, Mg, Mn, Mo, P, S, Sr, V, and Zn | Africa, Asia Pasific, Central/South America | [186] |
| 144. | Legumes (Cowpeas) | Ag, As, Ba, Be, Cd, Cs, Co, Cr, Cu, Mo, Ni, Pb, Sb, Se, Sn, Sr, Tl, Rb, V, and Zn | Argentina | [188] |
| 145. | Legumes (Yellow Split Pea) | Y, La, Ce, Pr, Nd, Sm, Eu, Gd, Dy, Ho, Er, Yb, Th, Sc, B, Al, Cr, Mn, Fe, Co, Ni, Cu, Zn, Se, Cd, Ba, and Tl | Santorini, different places of Greece, India, Canada, USA, Iran, and Australia | [189] |
| 146. | Legumes (Faba Beans) | Y, La, Ce, Pr, Nd, Sm, Eu, Gd, Tb, Dy, Ho, Er, Tm, Yb, Lu, Be, Al, Cr, Mn, Fe, Co, Ni, Cu, Zn, Cd, and Ba | Santorini (Greece) | [190] |
| 147. | Legumes (Faba Beans) | Li, B, Na, Mg, Al, P, S, K, Ca, Cr, Mn, Fe, Co, Ni, Cu, Zn, As, Se, Mo, Cd, Ba, La, Hg, and Pb | Manitoba and Saskatchewan (Canada) | [191] |
| 148. | Legumes (Common Beans) | N, Mg, P, S, K, Ca, Mn, Fe, Cu, Na, Cr, Co, Zn, and Mo | Slovenia | [192] |
| 149. | Nuts (Hazelnuts) | La, Ce, Pr, Nd, Sm, Eu, Gd, Tb, Dy, 165Ho, Er, Tm, Yb, and Lu | Italy, and Turkey | [193] |
| 150. | Nuts (Pistachio) | La, Ce, Pr, Nd, Sm, Eu, Gd, Tb, Dy, Ho, Er, Tm, and Yb | Greece, and Turkey | [194] |
| 151. | Nuts (Peanuts) | K, Ca, Mg, Na, Al, Fe, Zn, Mn, Ni, Sr, Mo, Cu, Se, V, Co, As, Cd, Cr, and Pb | China | [195] |
| 152. | Nuts (Walnuts) | Li, Be, B, Na, Mg, Al, K, Ca, Sc, V, Cr, Mn, Fe, Co, Ni, Cu, Zn, Ga, As, Se, Rb, Sr, Y, Mo, Ag, Cd, Te, Ba, La, Ce, Pr, Nd, Sm, Eu, Gd, Tb, Dy, Ho, Er, Tm, Yb, Lu, Tl, Pb, Bi, Th, and U | Switzerland, Chile, China, Germany, France, Hungary, Italy, Pakistan, Turkey, and USA | [196] |
| 153. | Nuts (Almonds) | Li, B, Al, Ti, Mn, Fe, Ni, Cu, Zn, Rb, Y, Ag, Cd, Ba, Ce, Tl, and U | Australia, Spain, Iran, Italy, Morocco, USA | [197] |
| 154. | Sesame seeds | Mg, Al, K, Ca, Cr, Mn, Co, Ni, Cu, Zn, Rb, Sr, Cd, Ba, and Pb | Korean, Chinese, and Indian | [198] |
| 155. | Spices | Cr, Co, Ni, Cu, Hg, Cd, Pb, and As | 17 Different Countries | [200] |
| 156. | Spices (red pepper flake) | Al, V, Cr, Mn, Fe, Ni, Cu, Zn, As, Cd, and Pb | Southeast Anatolia Region, the Mediterranean Region, and the Central Anatolia Region (Turkey) | [201] |
| 157. | Spices (Black pepper) | Mg, K, Ca, Ti, Cr, Mn, Fe, Co, Ni, Cu, Se, Sr, Y, Mo, Sb, Ba, Pt, and Pb | Vietnam, Pakistan, and India | [202] |
| 158. | Spices (Chili) | Ba, Be, Co, Cr, Cu, Fe, Ga, Li, Mn, Ni, Rb, Se, Sr, V, Zn, As, Cd, In, Pb, and Tl | South Korea, China, and Vietnam | [203] |
| 159. | Spices (Hot/Sweet Paprika) | K, Mg, Fe, Zn, Cu, Mn, B, Al, Co, Ni, Se, Mo, As, Pb, and Cd | Serbia, and Hungry (Comparison with literature samples from Spain, Turkey, and Poland) | [204] |
| 160. | Spices | 87Sr/86Sr, Rb, Sr, Y, Zr, Mo, Cd, Ba, Pb, Th, U, Mg, Ca, Sc, Ti, Cr, Mn, Fe, Co, Ni, Cu, Zn, As, and REE | Hungary, Spain, Romania, France, Senegal, China, and Germany | [205] |
| 161. | Saffron | Li, Be, B, Na, Mg, Al, K, Ca, Sc, Ti, V, Cr, Mn, Fe, Co, Ni, Cu, Zn, Ga, As, Rb, Sr, Y, Zr, Nb, Mo, Ag, Cd, Cs, Ba, La, Ce, Pr, Nd, Sm, Eu, Dy, Ho, Er, Hf, Re, Pb | Italy, Morocco and Iran | [206] |
| 162. | Saffron | Fe, Ca, Na, Mg, Sr, Ag, Al, As, Ba, Be, Cd, Co, Cr, Cu, Mn, Mo, Ni, Pb, Sb, Tl, V, Zn, and U | Italy, and Iran | [207] |
| 163. | Herbs | Ag, Al, As, B, Ba, Be, Bi, Ca, Cd, Co, Cr, Cu, Fe, K, Li, Mg, Mn, Mo, Na, Ni, P, Pb, Sb, Se, Si, Sn, Sr, Ti, V, Zn, Zr | China | [208] |
| 164. | Spices, and Herbs | Fe, Zn, Cr, Ni, Cu, Se, Pb, As, K, Ca, Mg, Na, Co, Mn, Hg and Cd | Italy, and Tunisia | [209] |
| 165. | Spices, and Herbs | Na, Mg, K, Ca, Cr, Mn, Fe, Co, Ni, Cu, Zn, As, Se, Cd, Hg, and Pb | Algeria | [210] |
| 166. | Herbs | Zn, Cd, Co, Cr, Cu, Ca, Mg, Mn, Mo, Ni, Pb, Sr, Fe, Na, and K | China | [211] |
| 167. | Tea | La, Ce, Pr, Nd, Sm, Eu, Gd, Tb, Dy, Ho, Er, Tm, Yb, Lu, Sc, and Y | China | [213] |
| 168. | Tea | 109Ag/107Ag, 138Ba/137Ba, 81Br/79Br, 112Cd/111Cd, 114Cd/112Cd, 114Cd/111Cd, 53Cr/52Cr, 72Ge/70Ge, 74Ge/72Ge, 74Ge/70Ge, 202Hg/200Hg, 7Li/6Li, 96Mo/95Mo, 98Mo/96Mo, 98Mo/95Mo, 60Ni/58Ni, 207Pb/206Pb, 208Pb/207Pb, 208Pb/206Pb, 123Sb/121Sb, 80Se/78Se, 120Sn/118Sn, 88Sr/86Sr, 47Ti/46Ti, and 48Ti/47Ti, 48Ti/46Ti, 205Tl/203Tl, 66Zn/64Zn, 68Zn/66Zn, 68Zn/64Zn, 71Ga/69Ga, 153Eu/151Eu, 154Sm/152Sm, 158Gd/156Gd, 160Gd/158Gd, 160Gd/156Gd, 164Dy/162Dy, 168Er/166Er, 174Yb/172Yb, 176Lu/175Lu | China | [214] |
| 169. | Tea | 109Ag/107Ag, 138Ba/137Ba, 81Br/79Br, 112Cd/111Cd, 114Cd/112Cd, 114Cd/111Cd, 53Cr/52Cr, 72Ge/70Ge, 74Ge/72Ge, 74Ge/70Ge, 202Hg/200Hg, 7Li/6Li, 96Mo/95Mo, 98Mo/96Mo, 98Mo/95Mo, 60Ni/58Ni, 207Pb/206Pb, 208Pb/207Pb, 208Pb/206Pb, 123Sb/121Sb, 80Se/78Se, 120Sn/118Sn, 88Sr/86Sr, 47Ti/46Ti, and 48Ti/47Ti, 48Ti/46Ti, 205Tl/203Tl, 66Zn/64Zn, 68Zn/66Zn, 68Zn/64Zn, 71Ga/69Ga, 153Eu/151Eu, 154Sm/152Sm, 158Gd/156Gd, 160Gd/158Gd, 160Gd/156Gd, 164Dy/162Dy, 168Er/166Er, 174Yb/172Yb, 176Lu/175Lu | China | [215] |
| 170. | Tea | V, Cr, Co, Ga, Sr, Mo, Cd, Pb, Na, Al, Fe, Ni, Cu, Zn, Rb, and Ba | China | [216] |
| 171. | Tea | 86 Mineral elements | China | [217] |
| 172. | Tea | Ag, As, Ba, Be, Bi, Br, Cd, Co, Cr, Ge, Hg, Li, Mo, Nb, Ni, Pb, Rb, Sb, Se, Sn, Sr, Ti, Tl, V, Zn, Cs, Hf, Y, La, Ce, Pr, Nd, Eu, Sm, Gd, Dy, Ho, Er, Tm, Yb, Lu, Sc, and Tb | China | [221] |
| 173. | Tea | Ag, Al, As, Ba, Be, Bi, Ca, Cd, Co, Cr, Cs, Cu, Fe, Ga, In, K, Li, Mg, Mn, Na, Ni, Pb, Rb, Se, Sr, Tl, U, V, Zn, Ce, Dy, Er, Eu, Gd, Ho, La, Lu, Nd, Pr, Sc, Sm, Tb, Th, Tm, and Y | China | [218] |
| 174. | Tea | Ti, Cr, Co, Ni, Cu, Zn, Rb, Cd, Cs, Ba, Sr, Ca, Mg, and Mn | China | [219] |
| 175. | Tea | Al, Ba, Ca, Cd, Ce, Co, Cr, Cs, Cu, Fe, K, Li, Mn, Ni, P, Pb, Rb, Sr, Tl, U, Y, and Zn | China | [220] |
5. Conclusions
Author Contributions
Funding
Institutional Review Board Statement
Informed Consent Statement
Conflicts of Interest
References
- Crandall, P.G.; Mauromoustakos, A.; O’Bryan, C.A.; Thompson, K.C.; Yiannas, F.; Bridges, K.; Francois, C. Impact of the Global Food Safety Initiative on Food Safety Worldwide: Statistical Analysis of a Survey of International Food Processors. J. Food Prot. 2017, 80, 1613–1622. [Google Scholar] [CrossRef] [PubMed]
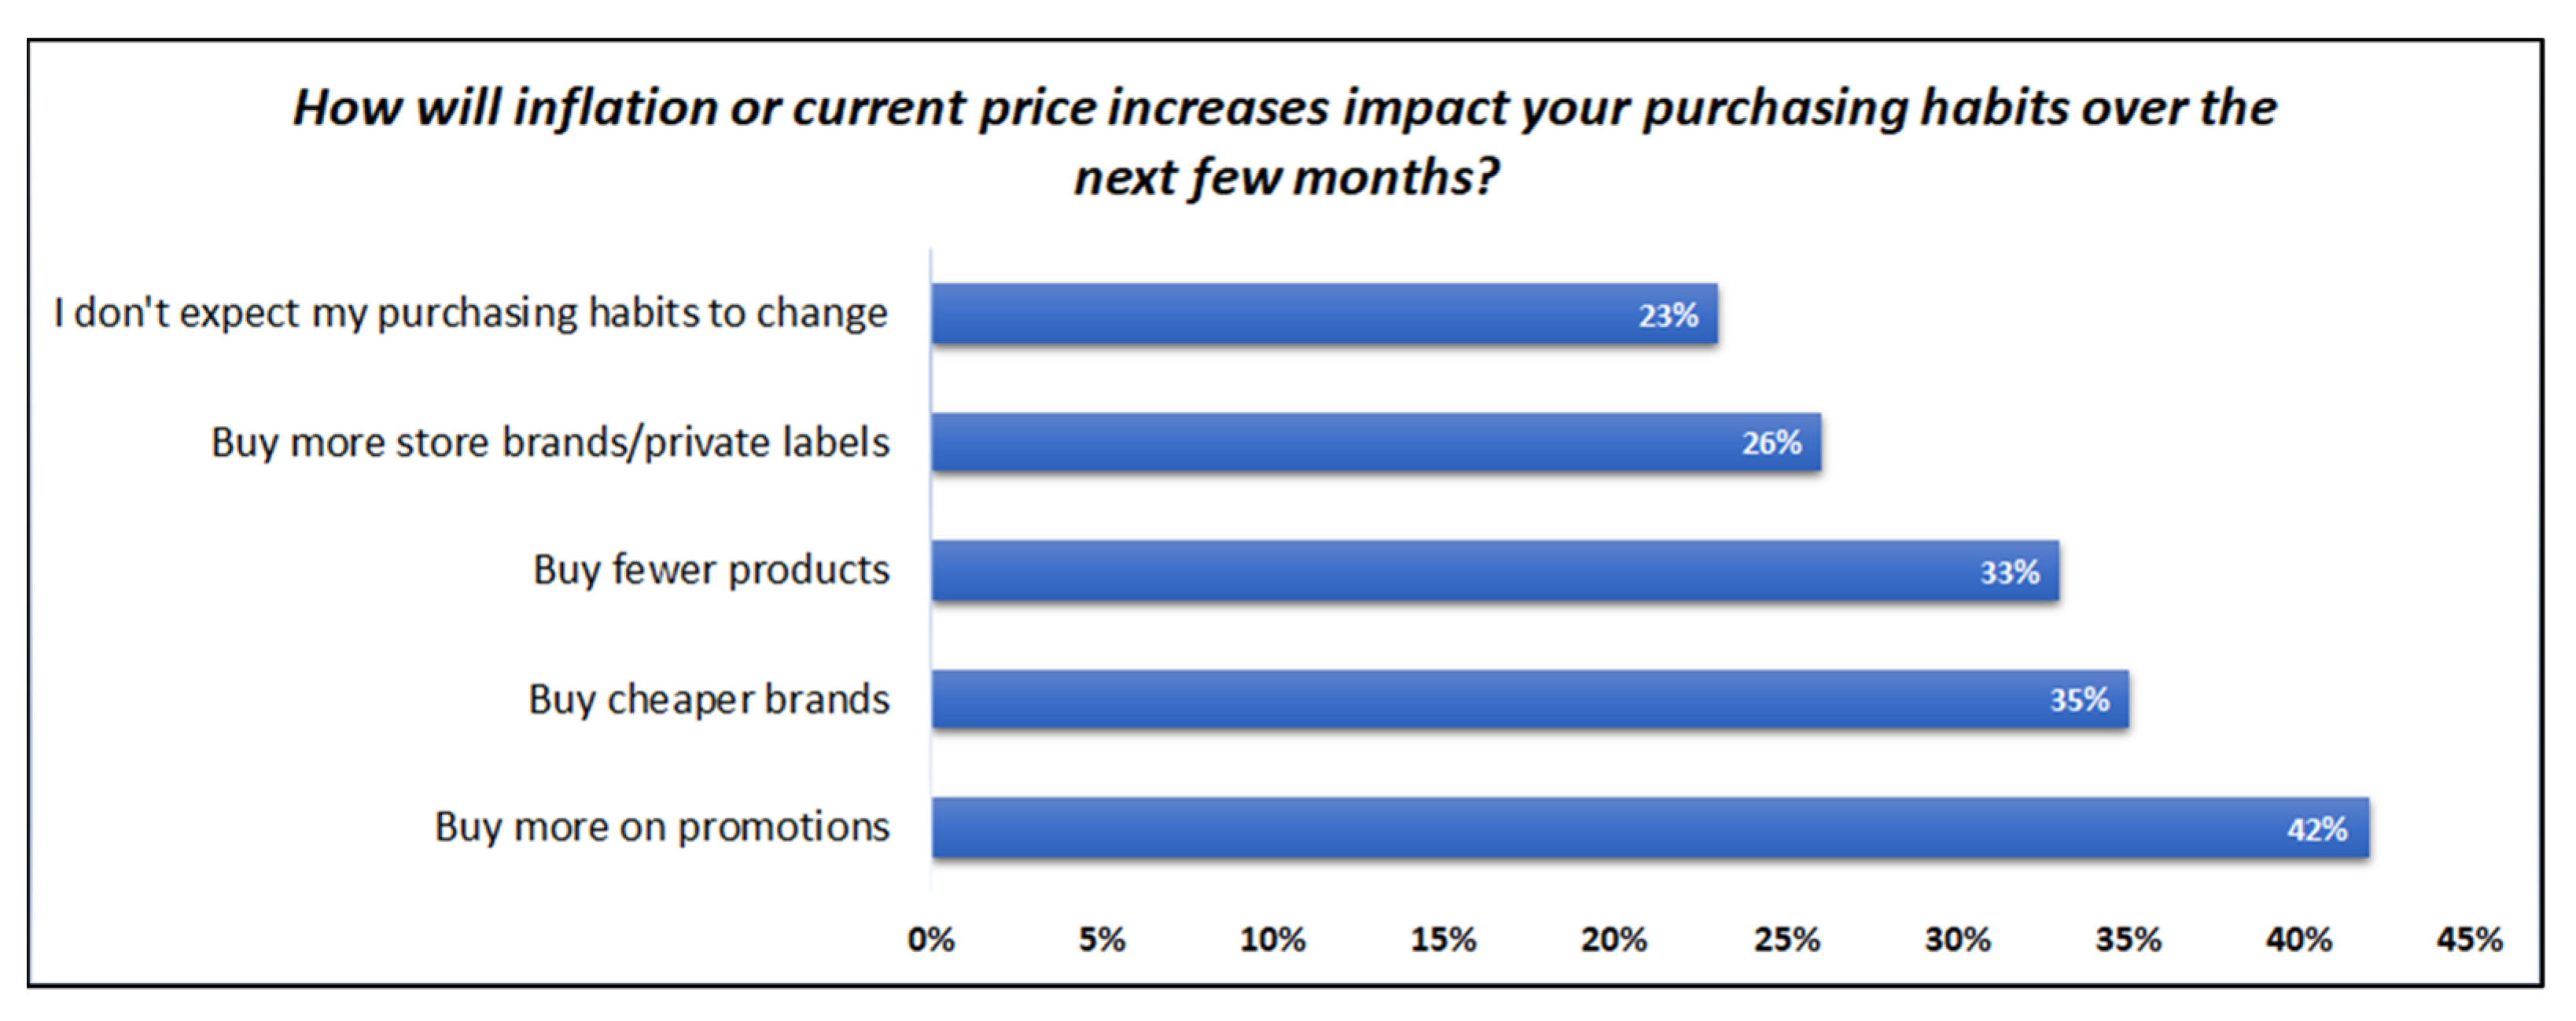
- How Inflation is Changing Consumer Behavior. Available online: https://www.ipsos.com/en-us/knowledge/consumer-shopper/How-Inflation-is-Changing-Consumer-Behavior (accessed on 2 August 2022).
- Food Safety. Available online: https://www.who.int/news-room/fact-sheets/detail/food-safety (accessed on 1 August 2022).
- Sharma, A. Food Adulteration: A Review. Sci. Eng. Technol. 2017, 5, 686–689. [Google Scholar] [CrossRef]
- Maione, C.; Barbosa, R.M. Recent applications of multivariate data analysis methods in the authentication of rice and the most analyzed parameters: A review. Crit. Rev. Food Sci. Nutr. 2019, 59, 1868–1879. [Google Scholar] [CrossRef] [PubMed]
- Quinn, B.; McCarron, P.; Hong, Y.; Birse, N.; Wu, D.; Elliott, C.T.; Ch, R. Elementomics combined with dd-SIMCA and K-NN to identify the geographical origin of rice samples from China, India, and Vietnam. Food Chem. 2022, 386, 132738. [Google Scholar] [CrossRef]
- Aceto, M.; Bonello, F.; Musso, D.; Tsolakis, C.; Cassino, C.; Osella, D. Wine Traceability with Rare Earth Elements. Beverages 2018, 4, 23. [Google Scholar] [CrossRef]
- Kalpage, M.; Dissanayake, C.; Diyabalanage, S.; Chandrajith, R.; Frew, R.; Fernando, R. Stable Isotope and Element Profiling for Determining the Agroclimatic Origin of Cow Milk within a Tropical Country. Foods 2022, 11, 275. [Google Scholar] [CrossRef]
- Nasr, E.G.; Epova, E.N.; de Diego, A.; Souissi, R.; Hammami, M.; Abderrazak, H.; Donard, O.F. X Trace Elements Analysis of Tunisian and European Extra Virgin Olive Oils by ICP-MS and Chemometrics for Geographical Discrimination. Foods 2022, 11, 82. [Google Scholar] [CrossRef]
- Nasr, E.G.; Epova, E.N.; Sebilo, M.; Larivière, D.; Hammami, M.; Souissi, R.; Abderrazak, H.; Donard, O.F.X. Olive Oil Traceability Studies Using Inorganic and Isotopic Signatures: A Review. Molecules 2022, 27, 2014. [Google Scholar] [CrossRef]
- Dimitrakopoulou, M.-E.; Vantarakis, A. Does Traceability Lead to Food Authentication? A Systematic Review from A European Perspective. Food Rev. Int. 2021. [Google Scholar] [CrossRef]
- Patriarca, M.; Barlow, N.; Cross, A.; Hill, S.; Robson, A.; Taylor, A.; Tyson, J. Atomic spectrometry update: Review of advances in the analysis of clinical and biological materials, foods and beverages. J. Anal. At. Spectrom. 2022, 37, 410–473. [Google Scholar] [CrossRef]
- Katerinopoulou, K.; Kontogeorgos, A.; Salmas, C.E.; Patakas, A.; Ladavos, A. Geographical Origin Authentication of Agri-Food Products: A Review. Foods 2020, 9, 489. [Google Scholar] [CrossRef] [PubMed]
- Aceto, M. Chapter 9—Food Forensics. In Comprehensive Analytical Chemistry; Picó, Y., Ed.; Elsevier: Amsterdam, The Netherlands, 2015; Volume 68, pp. 441–514. [Google Scholar] [CrossRef]
- Rodrigues, C.; Maia, R.; Lauteri, M.; Brugnoli, E.; Máguas, C. Chapter 4—Stable Isotope Analysis. In Comprehensive Analytical Chemistry; de la Guardia, M., Gonzálvez, A., Eds.; Elsevier: Amsterdam, The Netherlands, 2013; Volume 60, pp. 77–99. [Google Scholar] [CrossRef]
- Laursen, K.H.; Hansen, T.H.; Persson, D.P.; Schjoerring, J.K.; Husted, S. Multi-elemental fingerprinting of plant tissue by semi-quantitative ICP-MS and chemometrics. J. Anal. At. Spectrom. 2009, 24, 1198–1207. [Google Scholar] [CrossRef]
- Fortunato, G.; Mumic, K.; Wunderli, S.; Pillonel, L.; Bosset, J.O.; Gremaud, G. Application of strontium isotope abundance ratios measured by MC-ICP-MS for food authentication. J. Anal. At. Spectrom. 2004, 19, 227–234. [Google Scholar] [CrossRef]
- Barbaste, M.; Halicz, L.; Galy, A.; Medina, B.; Emteborg, H.; Adams, F.C.; Lobinski, R. Evaluation of the accuracy of the determination of lead isotope ratios in wine by ICP MS using quadrupole, multicollector magnetic sector and time-of-flight analyzers. Talanta 2001, 54, 307–317. [Google Scholar] [CrossRef]
- Rodushkin, I.; Engström, E.; Baxter, D.C. Isotopic analyses by ICP-MS in clinical samples. Anal. Bioanal. Chem. 2013, 405, 2785–2797. [Google Scholar] [CrossRef] [PubMed]
- Penanes, P.A.; Galán, A.R.; Huelga-Suarez, G.; Rodríguez-Castrillón, J.Á.; Moldovan, M.; Alonso, J.I.G. Isotopic measurements using ICP-MS: A tutorial review. J. Anal. At. Spectrom. 2022, 37, 701–726. [Google Scholar] [CrossRef]
- Li, Q.; Wang, Z.; Mo, J.; Zhang, G.; Chen, Y.; Huang, C. Imaging gold nanoparticles in mouse liver by laser ablation inductively coupled plasma mass spectrometry. Sci. Rep. 2017, 7, 2965. [Google Scholar] [CrossRef]
- da Silva, I.J.S.; Lavorante, A.F.; Paim, A.P.S.; da Silva, M.J. Microwave-assisted digestion employing diluted nitric acid for mineral determination in rice by ICP OES. Food Chem. 2020, 319, 126435. [Google Scholar] [CrossRef]
- Bulska, E.; Wagner, B. Quantitative aspects of inductively coupled plasma mass spectrometry. Philos. Trans. R. Soc. A Math. Phys. Eng. Sci. 2016, 374, 20150369. [Google Scholar] [CrossRef]
- Sharp, B.L. Pneumatic nebulisers and spray chambers for inductively coupled plasma spectrometry. A review. Part 1. Nebulisers. J. Anal. At. Spectrom. 1988, 3, 613–652. [Google Scholar] [CrossRef]
- Sharp, B.L. Pneumatic nebulisers and spray chambers for inductively coupled plasma spectrometry. A review. Part 2. Spray chambers. J. Anal. At. Spectrom. 1988, 3, 939–963. [Google Scholar] [CrossRef]
- Formation of Doubly Charged Atomic Ions in the Inductively Coupled Plasma—ScienceDirect. Available online: https://www.sciencedirect.com/science/article/pii/S0584854701003019 (accessed on 5 August 2022).
- Miller, P.E.; Denton, M.B. The quadrupole mass filter: Basic operating concepts. J. Chem. Educ. 1986, 63, 617. [Google Scholar] [CrossRef]
- Wilschefski, S.; Baxter, M. Inductively Coupled Plasma Mass Spectrometry: Introduction to Analytical Aspects. Clin. Biochem. Rev. 2019, 40, 115–133. [Google Scholar] [CrossRef] [PubMed]
- Eickhorst, T.; Seubert, A. Germanium dioxide as internal standard for simplified trace determination of bromate, bromide, iodate and iodide by on-line coupling ion chromatography-inductively coupled plasma mass spectrometry. J. Chromatogr. A 2004, 1050, 103–109. [Google Scholar] [CrossRef]
- Carter, J.A.; Barros, A.I.; Nóbrega, J.A.; Donati, G.L. Traditional Calibration Methods in Atomic Spectrometry and New Calibration Strategies for Inductively Coupled Plasma Mass Spectrometry. Front. Chem. 2018, 6, 504. [Google Scholar] [CrossRef]
- Palmer, C.D.; Lewis, M.E.; Geraghty, C.M.; Barbosa, F.; Parsons, P.J. Determination of lead, cadmium and mercury in blood for assessment of environmental exposure: A comparison between inductively coupled plasma–mass spectrometry and atomic absorption spectrometry. Spectrochim. Acta Part B At. Spectrosc. 2006, 61, 980–990. [Google Scholar] [CrossRef]
- Praamsma, M.L.; Arnason, J.G.; Parsons, P.J. Monitoring Mn in whole blood and urine: A comparison between electrothermal atomic absorption and inorganic mass spectrometry. J. Anal. At. Spectrom. 2011, 26, 1224–1232. [Google Scholar] [CrossRef]
- Huang, C.; Beauchemin, D. Direct multielemental analysis of human serum by ICP-MS with on-line standard addition using flow injection. J. Anal. At. Spectrom. 2003, 18, 951–952. [Google Scholar] [CrossRef]
- Haldimann, M.; Zimmerli, B.; Als, C.; Gerber, H. Direct determination of urinary iodine by inductively coupled plasma mass spectrometry using isotope dilution with iodine-129. Clin. Chem. 1998, 44, 817–824. [Google Scholar] [CrossRef]
- Keyes, W.R.; Turnlund, J.R. Determination of molybdenum and enriched Mo stable isotope concentrations in human blood plasma by isotope dilution ICP-MS. J. Anal. At. Spectrom. 2002, 17, 1153–1156. [Google Scholar] [CrossRef]
- May, T.W.; Wiedmeyer, R.H. A table of polyatomic interferences in ICP-MS. At. Spectrosc. 1998, 19, 6. [Google Scholar]
- Drivelos, S.A.; Georgiou, C.A. Multi-element and multi-isotope-ratio analysis to determine the geographical origin of foods in the European Union. TrAC Trends Anal. Chem. 2012, 40, 38–51. [Google Scholar] [CrossRef]
- Greenough, J.D.; Longerich, H.P.; Jackson, S.E. Element fingerprinting of Okanagan Valley wines using ICP-MS: Relationships between wine composition, vineyard and wine colour. Aust. J. Grape Wine Res. 1997, 3, 75–83. [Google Scholar] [CrossRef]
- Baxter, M.J.; Crews, H.M.; Dennis, M.J.; Goodall, I.; Anderson, D. The determination of the authenticity of wine from its trace element composition. Food Chem. 1997, 60, 443–450. [Google Scholar] [CrossRef]
- Ranaweera, R.K.R.; Gilmore, A.M.; Capone, D.L.; Bastian, S.E.P.; Jeffery, D.W. Authentication of the geographical origin of Australian Cabernet Sauvignon wines using spectrofluorometric and multi-element analyses with multivariate statistical modelling. Food Chem. 2021, 335, 127592. [Google Scholar] [CrossRef]
- Feher, I.; Magdas, D.A.; Dehelean, A.; Sârbu, C. Characterization and classification of wines according to geographical origin, vintage and specific variety based on elemental content: A new chemometric approach. J. Food Sci. Technol. 2019, 56, 5225–5233. [Google Scholar] [CrossRef] [PubMed]
- da Costa, N.L.; Ximenez, J.P.B.; Rodrigues, J.L.; Barbosa, F.; Barbosa, R. Characterization of Cabernet Sauvignon wines from California: Determination of origin based on ICP-MS analysis and machine learning techniques. Eur. Food Res. Technol. 2020, 246, 1193–1205. [Google Scholar] [CrossRef]
- Granell, B.; Izquierdo-Llopart, A.; Sahuquillo, À.; López-Sánchez, J.F.; Saurina, J. Characterization of Musts, Wines, and Sparkling Wines Based on Their Elemental Composition Determined by ICP-OES and ICP-MS. Beverages 2022, 8, 3. [Google Scholar] [CrossRef]
- Rodrigues, S.M.; Otero, M.; Alves, A.A.; Coimbra, J.; Coimbra, M.A.; Pereira, E.; Duarte, A.C. Elemental analysis for categorization of wines and authentication of their certified brand of origin. J. Food Compos. Anal. 2011, 24, 548–562. [Google Scholar] [CrossRef]
- Geana, I.; Iordache, A.; Ionete, R.; Marinescu, A.; Ranca, A.; Culea, M. Geographical origin identification of Romanian wines by ICP-MS elemental analysis. Food Chem. 2013, 138, 1125–1134. [Google Scholar] [CrossRef]
- Pasvanka, K.; Kostakis, M.; Tarapoulouzi, M.; Nisianakis, P.; Thomaidis, N.S.; Proestos, C. ICP–MS Analysis of Multi-Elemental Profile of Greek Wines and Their Classification According to Variety, Area and Year of Production. Separations 2021, 8, 119. [Google Scholar] [CrossRef]
- Tanabe, C.K.; Nelson, J.; Boulton, R.B.; Ebeler, S.E.; Hopfer, H. The Use of Macro, Micro, and Trace Elemental Profiles to Differentiate Commercial Single Vineyard Pinot noir Wines at a Sub-Regional Level. Molecules 2020, 25, 2552. [Google Scholar] [CrossRef] [PubMed]
- Azcarate, S.M.; Martinez, L.D.; Savio, M.; Camiña, J.M.; Gil, R.A. Classification of monovarietal Argentinean white wines by their elemental profile. Food Control 2015, 57, 268–274. [Google Scholar] [CrossRef]
- Taylor, V.F.; Longerich, H.P.; Greenough, J.D. Multielement Analysis of Canadian Wines by Inductively Coupled Plasma Mass Spectrometry (ICP-MS) and Multivariate Statistics. J. Agric. Food Chem. 2003, 51, 856–860. [Google Scholar] [CrossRef]
- Kruzlicova, D.; Fiket, Ž.; Kniewald, G. Classification of Croatian wine varieties using multivariate analysis of data obtained by high resolution ICP-MS analysis. Food Res. Int. 2013, 54, 621–626. [Google Scholar] [CrossRef]
- Pérez-Álvarez, E.P.; Garcia, R.; Barrulas, P.; Dias, C.; Cabrita, M.J.; Garde-Cerdán, T. Classification of wines according to several factors by ICP-MS multi-element analysis. Food Chem. 2019, 270, 273–280. [Google Scholar] [CrossRef]
- Cellier, R.; Berail, S.; Epova, E.; Barre, J.; Claverie, F.; van Leeuwen, C.; Milcent, S.; Ors, P.; Donard, O.F.X. The stability of major and trace element concentrations from musts to Champagne during the production process. OENO One 2022, 56, 29–40. [Google Scholar] [CrossRef]
- Lima, M.M.M.; Hernandez, D.; Yeh, A.; Reiter, T.; Runnebaum, R.C. Reproducibility of elemental profile across two vintages in Pinot noir wines from fourteen different vineyard sites. Food Res. Int. 2021, 141, 110045. [Google Scholar] [CrossRef]
- Grainger, C.; Yeh, A.; Byer, S.; Hjelmeland, A.; Lima, M.M.M.; Runnebaum, R.C. Vineyard site impact on the elemental composition of Pinot noir wines. Food Chem. 2021, 334, 127386. [Google Scholar] [CrossRef]
- Gajek, M.; Pawlaczyk, A.; Szynkowska-Jozwik, M.I. Multi-Elemental Analysis of Wine Samples in Relation to Their Type, Origin, and Grape Variety. Molecules 2021, 26, 214. [Google Scholar] [CrossRef]
- Rocha, S.; Pinto, E.; Almeida, A.; Fernandes, E. Multi-elemental analysis as a tool for characterization and differentiation of Portuguese wines according to their Protected Geographical Indication. Food Control 2019, 103, 27–35. [Google Scholar] [CrossRef]
- Pasvanka, K.; Tzachristas, A.; Kostakis, M.; Thomaidis, N.; Proestos, C. Geographic characterization of Greek wine by inductively coupled plasma–mass spectrometry macroelemental analysis. Anal. Lett. 2019, 52, 2741–2750. [Google Scholar] [CrossRef]
- Płotka-Wasylka, J.; Frankowski, M.; Simeonov, V.; Polkowska, Ż.; Namieśnik, J. Determination of Metals Content in Wine Samples by Inductively Coupled Plasma-Mass Spectrometry. Molecules 2018, 23, 2886. [Google Scholar] [CrossRef] [PubMed]
- Karasinski, J.; Elguera, J.C.T.; Ibarra, A.A.G.; Wrobel, K.; Bulska, E.; Wrobel, K. Comparative Evaluation of Red Wine from Various European Regions Using Mass Spectrometry Tools. Anal. Lett. 2018, 51, 2645–2659. [Google Scholar] [CrossRef]
- Hao, X.; Gao, F.; Wu, H.; Song, Y.; Zhang, L.; Li, H.; Wang, H. From Soil to Grape and Wine: Geographical Variations in Elemental Profiles in Different Chinese Regions. Foods 2021, 10, 3108. [Google Scholar] [CrossRef] [PubMed]
- Geană, E.-I.; Sandru, C.; Stanciu, V.; Ionete, R.E. Elemental Profile and 87Sr/86Sr Isotope Ratio as Fingerprints for Geographical Traceability of Wines: An Approach on Romanian Wines. Food Anal. Methods 2017, 10, 63–73. [Google Scholar] [CrossRef]
- Di Paola-Naranjo, R.D.; Baroni, M.V.; Podio, N.S.; Rubinstein, H.R.; Fabani, M.P.; Badini, R.G.; Inga, M.; Ostera, H.A.; Cagnoni, M.; Gallegos, E.; et al. Fingerprints for Main Varieties of Argentinean Wines: Terroir Differentiation by Inorganic, Organic, and Stable Isotopic Analyses Coupled to Chemometrics. J. Agric. Food Chem. 2011, 59, 7854–7865. [Google Scholar] [CrossRef]
- Bora, F.D.; Donici, A.; Rusu, T.; Bunea, A.; Popescu, D.; Bunea, C.I. Elemental Profile and 207Pb/206Pb, 208Pb/206Pb, 204Pb/206Pb, 87Sr/86Sr Isotope Ratio as Fingerprints for Geographical Traceability of Romanian Wines. Not. Bot. Horti Agrobot. Cluj-Napoca 2018, 46, 223–239. [Google Scholar] [CrossRef]
- Bronzi, B.; Brilli, C.; Beone, G.M.; Fontanella, M.C.; Ballabio, D.; Todeschini, R.; Consonni, V.; Grisoni, F.; Parri, F.; Buscema, M. Geographical identification of Chianti red wine based on ICP-MS element composition. Food Chem. 2020, 315, 126248. [Google Scholar] [CrossRef]
- Angus, N.S.; O’keeffe, T.J.; Stuart, K.R.; Miskelly, G.M. Regional classification of New Zealand red wines using inductively-coupled plasma-mass spectrometry (ICP-MS). Aust. J. Grape Wine Res. 2006, 12, 170–176. [Google Scholar] [CrossRef]
- Aceto, M.; Robotti, E.; Oddone, M.; Baldizzone, M.; Bonifacino, G.; Bezzo, G.; Di Stefano, R.; Gosetti, F.; Mazzucco, E.; Manfredi, M.; et al. A traceability study on the Moscato wine chain. Food Chem. 2013, 138, 1914–1922. [Google Scholar] [CrossRef] [PubMed]
- Hopfer, H.; Gilleland, G.; Ebeler, S.E.; Nelson, J. Elemental Profiles of Whisk(e)y Allow Differentiation by Type and Region. Beverages 2017, 3, 8. [Google Scholar] [CrossRef]
- Pawlaczyk, A.; Gajek, M.; Jozwik, K.; Szynkowska, M.I. Multielemental Analysis of Various Kinds of Whisky. Molecules 2019, 24, 1193. [Google Scholar] [CrossRef]
- Gajek, M.; Pawlaczyk, A.; Jóźwik, K.; Szynkowska-Jóźwik, M.I. The Elemental Fingerprints of Different Types of Whisky as Determined by ICP-OES and ICP-MS Techniques in Relation to Their Type, Age, and Origin. Foods 2022, 11, 1616. [Google Scholar] [CrossRef] [PubMed]
- García-Ruiz, S.; Moldovan, M.; Fortunato, G.; Wunderli, S.; García Alonso, J.I. Evaluation of strontium isotope abundance ratios in combination with multi-elemental analysis as a possible tool to study the geographical origin of ciders. Anal. Chim. Acta 2007, 590, 55–66. [Google Scholar] [CrossRef]
- Gajek, M.; Pawlaczyk, A.; Wysocki, P.; Szynkowska-Jozwik, M.I. Elemental Characterization of Ciders and Other Low-Percentage Alcoholic Beverages Available on the Polish Market. Molecules 2021, 26, 2186. [Google Scholar] [CrossRef]
- Mahmood, N.; Petraco, N.; He, Y. Elemental fingerprint profile of beer samples constructed using 14 elements determined by inductively coupled plasma-mass spectrometry (ICP-MS): Multivariation analysis and potential application to forensic sample comparison. Anal. Bioanal. Chem. 2012, 402, 861–869. [Google Scholar] [CrossRef]
- Alexa, L.; Kántor, A.; Kovács, B.; Czipa, N. Determination of micro and trace elements of commercial beers. J. Microbiol. Biotechnol. Food Sci. 2018, 7, 432–436. [Google Scholar] [CrossRef]
- Lafontaine, S.; Thomson, D.; Schubert, C.; Müller, I.; Kyle, M.; Biendl, M.; Conn, S.; Schüll, F.; Lutz, A.; Ligare, M.; et al. How deviations in the elemental profile of Humulus lupulus grown throughout the U.S. and Germany influence hop and beer quality. Food Chem. 2022, 395, 133543. [Google Scholar] [CrossRef]
- Pepi, S.; Chicca, M.; Telloli, C.; Di Roma, A.; Grisenti, P.; Tessari, U.; Vaccaro, C. Discrimination of geographical origin of hop (Humulus lupulus L.) using geochemical elements combined with statistical analysis. Environ. Geochem. Health 2019, 41, 1559–1576. [Google Scholar] [CrossRef]
- Xiong, Q.; Lin, Y.; Wu, W.; Hu, J.; Li, Y.; Xu, K.; Wu, X.; Hou, X. Chemometric intraregional discrimination of Chinese liquors based on multi-element determination by ICP-MS and ICP-OES. Appl. Spectrosc. Rev. 2021, 56, 115–127. [Google Scholar] [CrossRef]
- Benincasa, C.; Lewis, J.; Sindona, G.; Tagarelli, A. The use of multi element profiling to differentiate between cowand buffalo milk. Food Chem. 2008, 110, 257–262. [Google Scholar] [CrossRef] [PubMed]
- Tedesco, R.; del CarmenVilloslada Hidalgo, M.; Vardè, M.; Kehrwald, N.M.; Barbante, C.; Cozzi, G. Trace and rare earth elements determination in milk whey from the Veneto region, Italy. Food Control 2021, 121, 107595. [Google Scholar] [CrossRef]
- Aceto, M.; Musso, D.; Calà, E.; Arieri, F.; Oddone, M. Role of Lanthanides in the Traceability of the Milk Production Chain. J. Agric. Food Chem. 2017, 65, 4200–4208. [Google Scholar] [CrossRef]
- Pillonel, L.; Badertscher, R.; Froidevaux, P.; Haberhauer, G.; Hölzl, S.; Horn, P.; Jakob, A.; Pfammatter, E.; Piantini, U.; Rossmann, A.; et al. Stable isotope ratios, major, trace and radioactive elements in emmental cheeses of different origins. LWT Food Sci. Technol. 2003, 36, 615–623. [Google Scholar] [CrossRef]
- Camin, F.; Bertoldi, D.; Santato, A.; Bontempo, L.; Perini, M.; Ziller, L.; Stroppa, A.; Larcher, R. Validation of methods for H, C, N and S stable isotopes and elemental analysis of cheese: Results of an international collaborative study. Rapid Commun. Mass Spectrom. 2015, 29, 415–423. [Google Scholar] [CrossRef] [PubMed]
- Franke, B.M.; Gremaud, G.; Hadorn, R.; Kreuzer, M. Geographic origin of meat—Elements of an analytical approach to its authentication. Eur. Food Res. Technol. 2005, 221, 493–503. [Google Scholar] [CrossRef]
- Heaton, K.; Kelly, S.D.; Hoogewerff, J.; Woolfe, M. Verifying the geographical origin of beef: The application of multi-element isotope and trace element analysis. Food Chem. 2008, 107, 506–515. [Google Scholar] [CrossRef]
- Hao, L.; Yang, X.; Huang, Y.; Hocquette, J.-F.; Bryant, R.H.; Xun, W.; Niu, J.; Sun, L.; Chai, S.; Ding, L.; et al. Yak Etinin Coğrafi Kökenini Doğrulamak Amacıyla Mineral Elementlerin Kullanılması. Kafkas. Univ. Vet. Fak. Derg. 2019, 25, 93–98. [Google Scholar] [CrossRef]
- Danezis, G.P.; Pappas, A.C.; Zoidis, E.; Papadomichelakis, G.; Hadjigeorgiou, I.; Zhang, P.; Brusic, V.; Georgiou, C.A. Game meat authentication through rare earth elements fingerprinting. Anal. Chim. Acta 2017, 991, 46–57. [Google Scholar] [CrossRef]
- Danezis, G.P.; Zoidis, E.; Zhang, P.; Pappas, A.C.; Tsagkaris, A.S.; Papachristidis, C.A.; Papadomichelakis, G.; Hadjigeorgiou, I.; Georgiou, C.A. Tissue distribution of rare earth elements in wild, commercial and backyard rabbits. Meat Sci. 2019, 153, 45–50. [Google Scholar] [CrossRef] [PubMed]
- Kim, J.S.; Hwang, I.M.; Lee, G.H.; Park, Y.M.; Choi, J.Y.; Jamila, N.; Khan, N.; Kim, K.S. Geographical origin authentication of pork using multi-element and multivariate data analyses. Meat Sci. 2017, 123, 13–20. [Google Scholar] [CrossRef]
- Sun, S.; Guo, B.; Wei, Y.; Fan, M. Multi-element analysis for determining the geographical origin of mutton from different regions of China. Food Chem. 2011, 124, 1151–1156. [Google Scholar] [CrossRef]
- Epova, E.N.; Bérail, S.; Zuliani, T.; Malherbe, J.; Sarthou, L.; Valiente, M.; Donard, O.F.X. 87Sr/86Sr isotope ratio and multielemental signatures as indicators of origin of European cured hams: The role of salt. Food Chem. 2018, 246, 313–322. [Google Scholar] [CrossRef] [PubMed]
- Bandoniene, D.; Walkner, C.; Zettl, D.; Meisel, T. Rare Earth Element Labeling as a Tool for Assuring the Origin of Eggs and Poultry Products. J. Agric. Food Chem. 2018, 66, 11729–11738. [Google Scholar] [CrossRef] [PubMed]
- Bandoniene, D.; Walkner, C.; Ringdorfer, F.; Meisel, T. Authentication of meat and dairy products using rare earth element labeling and detection by solution based and laser ablation ICP-MS. Food Res. Int. 2020, 132, 109106. [Google Scholar] [CrossRef] [PubMed]
- Liu, X.; Xue, C.; Wang, Y.; Li, Z.; Xue, Y.; Xu, J. The classification of sea cucumber (Apostichopus japonicus) according to region of origin using multi-element analysis and pattern recognition techniques. Food Control 2012, 23, 522–527. [Google Scholar] [CrossRef]
- Kang, X.; Zhao, Y.; Shang, D.; Zhai, Y.; Ning, J.; Sheng, X. Elemental analysis of sea cucumber from five major production sites in China: A chemometric approach. Food Control 2018, 94, 361–367. [Google Scholar] [CrossRef]
- Costas-Rodríguez, M.; Lavilla, I.; Bendicho, C. Classification of cultivated mussels from Galicia (Northwest Spain) with European Protected Designation of Origin using trace element fingerprint and chemometric analysis. Anal. Chim. Acta 2010, 664, 121–128. [Google Scholar] [CrossRef]
- Cubadda, F.; Raggi, A.; Coni, E. Element fingerprinting of marine organisms by dynamic reaction cell inductively coupled plasma mass spectrometry. Anal. Bioanal. Chem. 2006, 384, 887–896. [Google Scholar] [CrossRef]
- Flem, B.; Moen, V.; Finne, T.E.; Viljugrein, H.; Kristoffersen, A.B. Trace element composition of smolt scales from Atlantic salmon (Salmo salar L.), geographic variation between hatcheries. Fish. Res. 2017, 190, 183–196. [Google Scholar] [CrossRef]
- Bua, G.D.; Albergamo, A.; Annuario, G.; Zammuto, V.; Costa, R.; Dugo, G. High-Throughput ICP-MS and Chemometrics for Exploring the Major and Trace Element Profile of the Mediterranean Sepia Ink. Food Anal. Methods 2017, 10, 1181–1190. [Google Scholar] [CrossRef]
- Zhao, H.; Zhang, S. Effects of sediment, seawater, and season on multi-element fingerprints of Manila clam (Ruditapes philippinarum) for authenticity identification. Food Control 2016, 66, 62–68. [Google Scholar] [CrossRef]
- Luo, R.; Jiang, T.; Chen, X.; Zheng, C.; Liu, H.; Yang, J. Determination of geographic origin of Chinese mitten crab (Eriocheir sinensis) using integrated stable isotope and multi-element analyses. Food Chem. 2019, 274, 1–7. [Google Scholar] [CrossRef] [PubMed]
- Varrà, M.O.; Ghidini, S.; Zanardi, E.; Badiani, A.; Ianieri, A. Authentication of European sea bass according to production method and geographical origin by light stable isotope ratio and rare earth elements analyses combined with chemometrics. Ital. J. Food Saf. 2019, 81, 7872. [Google Scholar] [CrossRef] [PubMed]
- Ortea, I.; Gallardo, J.M. Investigation of production method, geographical origin and species authentication in commercially relevant shrimps using stable isotope ratio and/or multi-element analyses combined with chemometrics: An exploratory analysis. Food Chem. 2015, 170, 145–153. [Google Scholar] [CrossRef]
- Rodushkin, I.; Bergman, T.; Douglas, G.; Engström, E.; Sörlin, D.; Baxter, D.C. Authentication of Kalix (N.E. Sweden) vendace caviar using inductively coupled plasma-based analytical techniques: Evaluation of different approaches. Anal. Chim. Acta 2007, 583, 310–318. [Google Scholar] [CrossRef]
- Varrà, M.O.; Husáková, L.; Patočka, J.; Ghidini, S.; Zanardi, E. Classification of transformed anchovy products based on the use of element patterns and decision trees to assess traceability and country of origin labelling. Food Chem. 2021, 360, 129790. [Google Scholar] [CrossRef]
- Guo, L.; Gong, L.; Yu, Y.; Zhang, H. Multi-element Fingerprinting as a Tool in Origin Authentication of Four East China Marine Species. J. Food Sci. 2013, 78, C1852–C1857. [Google Scholar] [CrossRef]
- Varrà, M.O.; Ghidini, S.; Husáková, L.; Ianieri, A.; Zanardi, E. Advances in Troubleshooting Fish and Seafood Authentication by Inorganic Elemental Composition. Foods 2021, 10, 270. [Google Scholar] [CrossRef]
- Furia, E.; Naccarato, A.; Sindona, G.; Stabile, G.; Tagarelli, A. Multielement Fingerprinting as a Tool in Origin Authentication of PGI Food Products: Tropea Red Onion. J. Agric. Food Chem. 2011, 59, 8450–8457. [Google Scholar] [CrossRef] [PubMed]
- Ariyama, K.; Aoyama, Y.; Mochizuki, A.; Homura, Y.; Kadokura, M.; Yasui, A. Determination of the Geographic Origin of Onions between Three Main Production Areas in Japan and Other Countries by Mineral Composition. J. Agric. Food Chem. 2007, 55, 347–354. [Google Scholar] [CrossRef] [PubMed]
- Vadalà, R.; Mottese, A.F.; Bua, G.D.; Salvo, A.; Mallamace, D.; Corsaro, C.; Vasi, S.; Giofrè, S.V.; Alfa, M.; Cicero, N.; et al. Statistical Analysis of Mineral Concentration for the Geographic Identification of Garlic Samples from Sicily (Italy), Tunisia and Spain. Foods 2016, 5, 20. [Google Scholar] [CrossRef] [PubMed]
- Smith, R.G. Determination of the Country of Origin of Garlic (Allium sativum) Using Trace Metal Profiling. J. Agric. Food Chem. 2005, 53, 4041–4045. [Google Scholar] [CrossRef] [PubMed]
- Nguyen-Quang, T.; Bui-Quang, M.; Truong-Ngoc, M. Rapid Identification of Geographical Origin of Commercial Soybean Marketed in Vietnam by ICP-MS. J. Anal. Methods Chem. 2021, 2021, e5583860. [Google Scholar] [CrossRef]
- Voica, C.; Roba, C.; Feher, I.; Magdas, D.A. Elemental Analysis and Metal Intake of Romanian Vegetables. Anal. Lett. 2017, 50, 2755–2771. [Google Scholar] [CrossRef]
- Zhang, J.; Yang, R.; Chen, R.; Li, Y.C.; Peng, Y.; Wen, X. Geographical origin discrimination of pepper (Capsicum annuum L.) based on multi-elemental concentrations combined with chemometrics. Food Sci. Biotechnol. 2019, 28, 1627–1635. [Google Scholar] [CrossRef]
- Naccarato, A.; Furia, E.; Sindona, G.; Tagarelli, A. Multivariate class modeling techniques applied to multielement analysis for the verification of the geographical origin of chili pepper. Food Chem. 2016, 206, 217–222. [Google Scholar] [CrossRef]
- Lo Feudo, G.; Naccarato, A.; Sindona, G.; Tagarelli, A. Investigating the Origin of Tomatoes and Triple Concentrated Tomato Pastes through Multielement Determination by Inductively Coupled Plasma Mass Spectrometry and Statistical Analysis. J. Agric. Food Chem. 2010, 58, 3801–3807. [Google Scholar] [CrossRef]
- Bettinelli, M.; Spectroscopy, A. ICP-MS determination of REEs in tomato plants and related products: A new analytical tool to verify traceability. At. Spectrosc. 2005, 26, 41–50. [Google Scholar]
- Bontempo, L.; Camin, F.; Manzocco, L.; Nicolini, G.; Wehrens, R.; Ziller, L.; Larcher, R. Traceability along the production chain of Italian tomato products on the basis of stable isotopes and mineral composition. Rapid Commun. Mass Spectrom. 2011, 25, 899–909. [Google Scholar] [CrossRef] [PubMed]
- Bong, Y.-S.; Shin, W.-J.; Gautam, M.K.; Jeong, Y.-J.; Lee, A.-R.; Jang, C.-S.; Lim, Y.-P.; Chung, G.-S.; Lee, K.-S. Determining the geographical origin of Chinese cabbages using multielement composition and strontium isotope ratio analyses. Food Chem. 2012, 135, 2666–2674. [Google Scholar] [CrossRef]
- Segelke, T.; von Wuthenau, K.; Neitzke, G.; Müller, M.-S.; Fischer, M. Food Authentication: Species and Origin Determination of Truffles (Tuber spp.) by Inductively Coupled Plasma Mass Spectrometry and Chemometrics. J. Agric. Food Chem. 2020, 68, 14374–14385. [Google Scholar] [CrossRef] [PubMed]
- Potortì, A.G.; Di Bella, G.; Mottese, A.F.; Bua, G.D.; Fede, M.R.; Sabatino, G.; Salvo, A.; Somma, R.; Dugo, G.; Lo Turco, V. Traceability of Protected Geographical Indication (PGI) Interdonato lemon pulps by chemometric analysis of the mineral composition. J. Food Compos. Anal. 2018, 69, 122–128. [Google Scholar] [CrossRef]
- Squadrone, S.; Brizio, P.; Stella, C.; Mantia, M.; Pederiva, S.; Giordanengo, G.; Pistone, G.; Abete, M.C. Distribution and bioaccumulation of trace elements and lanthanides in apples from Northwestern Italy. J. Trace Elem. Med. Biol. 2020, 62, 126646. [Google Scholar] [CrossRef]
- Muñoz-Redondo, J.M.; Bertoldi, D.; Tonon, A.; Ziller, L.; Camin, F.; Moreno-Rojas, J.M. Tracing the geographical origin of Spanish mango (Mangifera indica L.) using stable isotopes ratios and multi-element profiles. Food Control 2021, 125, 107961. [Google Scholar] [CrossRef]
- Muñoz-Redondo, J.M.; Bertoldi, D.; Tonon, A.; Ziller, L.; Camin, F.; Moreno-Rojas, J.M. Multi-element and stable isotopes characterization of commercial avocado fruit (Persea americana Mill) with origin authentication purposes. Food Control 2022, 137, 108975. [Google Scholar] [CrossRef]
- Coelho, I.; Matos, A.S.; Teixeira, R.; Nascimento, A.; Bordado, J.; Donard, O.; Castanheira, I. Combining multielement analysis and chemometrics to trace the geographical origin of Rocha pear. J. Food Compos. Anal. 2019, 77, 1–8. [Google Scholar] [CrossRef]
- Debbarma, N.; Manivannan, S.; Muddarsu, V.R.; Umadevi, P.; Upadhyay, S. Ionome signatures discriminates the geographical origin of jackfruits (Artocarpus heterophyllus Lam.). Food Chem. 2021, 339, 127896. [Google Scholar] [CrossRef]
- Benabdelkamel, H.; Di Donna, L.; Mazzotti, F.; Naccarato, A.; Sindona, G.; Tagarelli, A.; Taverna, D. Authenticity of PGI “Clementine of Calabria” by Multielement Fingerprint. J. Agric. Food Chem. 2012, 60, 3717–3726. [Google Scholar] [CrossRef]
- Benincasa, C.; Lewis, J.; Perri, E.; Sindona, G.; Tagarelli, A. Determination of trace element in Italian virgin olive oils and their characterization according to geographical origin by statistical analysis. Anal. Chim. Acta 2007, 585, 366–370. [Google Scholar] [CrossRef] [PubMed]
- Camin, F.; Larcher, R.; Perini, M.; Bontempo, L.; Bertoldi, D.; Gagliano, G.; Nicolini, G.; Versini, G. Characterisation of authentic Italian extra-virgin olive oils by stable isotope ratios of C, O and H and mineral composition. Food Chem. 2010, 118, 901–909. [Google Scholar] [CrossRef]
- Camin, F.; Larcher, R.; Nicolini, G.; Bontempo, L.; Bertoldi, D.; Perini, M.; Schlicht, C.; Schellenberg, A.; Thomas, F.; Heinrich, K.; et al. Isotopic and Elemental Data for Tracing the Origin of European Olive Oils. J. Agric. Food Chem. 2010, 58, 570–577. [Google Scholar] [CrossRef] [PubMed]
- Farmaki, E.G.; Thomaidis, N.S.; Minioti, K.S.; Ioannou, E.; Georgiou, C.A.; Efstathiou, C.E. Geographical Characterization of Greek Olive Oils Using Rare Earth Elements Content and Supervised Chemometric Techniques. Anal. Lett. 2012, 45, 920–932. [Google Scholar] [CrossRef]
- Beltrán, M.; Sánchez-Astudillo, M.; Aparicio, R.; García-González, D.L. Geographical traceability of virgin olive oils from south-western Spain by their multi-elemental composition. Food Chem. 2015, 169, 350–357. [Google Scholar] [CrossRef]
- Gumus, Z.P.; Celenk, V.U.; Tekin, S.; Yurdakul, O.; Ertas, H. Determination of trace elements and stable carbon isotope ratios in virgin olive oils from Western Turkey to authenticate geographical origin with a chemometric approach. Eur. Food Res. Technol. 2017, 243, 1719–1727. [Google Scholar] [CrossRef]
- Damak, F.; Asano, M.; Baba, K.; Suda, A.; Araoka, D.; Wali, A.; Isoda, H.; Nakajima, M.; Ksibi, M.; Tamura, K. Interregional traceability of Tunisian olive oils to the provenance soil by multielemental fingerprinting and chemometrics. Food Chem. 2019, 283, 656–664. [Google Scholar] [CrossRef]
- Aceto, M.; Calà, E.; Musso, D.; Regalli, N.; Oddone, M. A preliminary study on the authentication and traceability of extra virgin olive oil made from Taggiasca olives by means of trace and ultra-trace elements distribution. Food Chem. 2019, 298, 125047. [Google Scholar] [CrossRef]
- Wali, A.; Damak, F.; Kawada, K.; Isoda, H.; Tamura, K.; Ksibi, M. The effects of geographic region and cultivar on oxidative stability and elemental analysis of Tunisian extra virgin olive oil. Eur. Food. Res. Technol. 2021, 247, 1401–1409. [Google Scholar] [CrossRef]
- Astolfi, M.L.; Marini, F.; Frezzini, M.A.; Massimi, L.; Capriotti, A.L.; Montone, C.M.; Canepari, S. Multielement Characterization and Antioxidant Activity of Italian Extra-Virgin Olive Oils. Front. Chem. 2021, 9, 769620. [Google Scholar] [CrossRef]
- Damak, F.; Bougi, M.S.M.; Araoka, D.; Baba, K.; Furuya, M.; Ksibi, M.; Tamura, K. Soil geochemistry, edaphic and climatic characteristics as components of Tunisian olive terroirs: Relationship with the multielemental composition of olive oils for their geographical traceability. Eur. Mediterr. J. Environ. Integr. 2021, 6, 37. [Google Scholar] [CrossRef]
- Llorent-Martínez, E.J.; Fernández-de Córdova, M.L.; Ortega-Barrales, P.; Ruiz-Medina, A. Quantitation of Metals During the Extraction of Virgin Olive Oil from Olives Using ICP-MS after Microwave-assisted Acid Digestion. J. Am. Oil Chem. Soc. 2014, 91, 1823–1830. [Google Scholar] [CrossRef]
- Pucci, E.; Palumbo, D.; Puiu, A.; Lai, A.; Fiorani, L.; Zoani, C. Characterization and Discrimination of Italian Olive (Olea europaea sativa) Cultivars by Production Area Using Different Analytical Methods Combined with Chemometric Analysis. Foods 2022, 11, 1085. [Google Scholar] [CrossRef] [PubMed]
- Llorent-Martínez, E.J.; Ortega-Barrales, P.; Fernández-de Córdova, M.L.; Domínguez-Vidal, A.; Ruiz-Medina, A. Investigation by ICP-MS of trace element levels in vegetable edible oils produced in Spain. Food Chem. 2011, 127, 1257–1262. [Google Scholar] [CrossRef] [PubMed]
- de Souza, R.M.; Toloza, C.A.T.; Aucélio, R.Q. Fast determination of trace metals in edible oils and fats by inductively coupled plasma mass spectrometry and ultrasonic acidic extraction. J. Trace Elem. Miner. 2022, 1, 100003. [Google Scholar] [CrossRef]
- Amit; Jamwal, R.; Kumari, S.; Kelly, S.; Cannavan, A.; Singh, D.K. Assessment of geographical origin of virgin coconut oil using inductively coupled plasma mass spectrometry along with multivariate chemometrics. Curr. Res. Food Sci. 2022, 5, 545–552. [Google Scholar] [CrossRef]
- Chudzinska, M.; Baralkiewicz, D. Application of ICP-MS method of determination of 15 elements in honey with chemometric approach for the verification of their authenticity. Food Chem. Toxicol. 2011, 49, 2741–2749. [Google Scholar] [CrossRef]
- Batista, B.L.; da Silva, L.R.S.; Rocha, B.A.; Rodrigues, J.L.; Berretta-Silva, A.A.; Bonates, T.O.; Gomes, V.S.D.; Barbosa, R.M.; Barbosa, F. Multi-element determination in Brazilian honey samples by inductively coupled plasma mass spectrometry and estimation of geographic origin with data mining techniques. Food Res. Int. 2012, 49, 209–215. [Google Scholar] [CrossRef]
- Chen, H.; Fan, C.; Chang, Q.; Pang, G.; Hu, X.; Lu, M.; Wang, W. Chemometric Determination of the Botanical Origin for Chinese Honeys on the Basis of Mineral Elements Determined by ICP-MS. J. Agric. Food Chem. 2014, 62, 2443–2448. [Google Scholar] [CrossRef]
- Di Bella, G.; Lo Turco, V.; Potortì, A.G.; Bua, G.D.; Fede, M.R.; Dugo, G. Geographical discrimination of Italian honey by multi-element analysis with a chemometric approach. J. Food Compos. Anal. 2015, 44, 25–35. [Google Scholar] [CrossRef]
- Zhou, X.; Taylor, M.P.; Salouros, H.; Prasad, S. Authenticity and geographic origin of global honeys determined using carbon isotope ratios and trace elements. Sci. Rep. 2018, 8, 14639. [Google Scholar] [CrossRef] [PubMed]
- Oroian, M.; Prisacaru, A.; Hretcanu, E.C.; Stroe, S.-G.; Leahu, A.; Buculei, A. Heavy Metals Profile in Honey as a Potential Indicator of Botanical and Geographical Origin. Int. J. Food Prop. 2016, 19, 1825–1836. [Google Scholar] [CrossRef]
- Voica, C.; Iordache, A.M.; Ionete, R.E. Multielemental characterization of honey using inductively coupled plasma mass spectrometry fused with chemometrics. J. Mass Spectrom. 2020, 55, e4512. [Google Scholar] [CrossRef]
- Silva, B.; Gonzaga, L.V.; Maltez, H.F.; Samochvalov, K.B.; Fett, R.; Costa, A.C.O. Elemental profiling by ICP-MS as a tool for geographical discrimination: The case of bracatinga honeydew honey. J. Food Compos. Anal. 2021, 96, 103727. [Google Scholar] [CrossRef]
- Drivelos, S.A.; Danezis, G.P.; Halagarda, M.; Popek, S.; Georgiou, C.A. Geographical origin and botanical type honey authentication through elemental metabolomics via chemometrics. Food Chem. 2021, 338, 127936. [Google Scholar] [CrossRef]
- Mara, A.; Deidda, S.; Caredda, M.; Ciulu, M.; Deroma, M.; Farinini, E.; Floris, I.; Langasco, I.; Leardi, R.; Pilo, M.I.; et al. Multi-Elemental Analysis as a Tool to Ascertain the Safety and the Origin of Beehive Products: Development, Validation, and Application of an ICP-MS Method on Four Unifloral Honeys Produced in Sardinia, Italy. Molecules 2022, 27, 2009. [Google Scholar] [CrossRef]
- Padovan, G.J.; Rodrigues, L.P.; A.Leme, I.; Jong, D.D.; S.Marchini, J. Presence of C4 Sugars in Honey Samples Detected by The Carbon Isotope Ratio Measured by IRMS. Eurasian J. Anal. Chem. 2007, 2, 134–141. [Google Scholar]
- Detection of Adulteration of Commercial Honey Samples by the 13C/12C Isotopic Ratio—ScienceDirect. Available online: https://www.sciencedirect.com/science/article/pii/S0308814602005046?via%3Dihub (accessed on 17 September 2022).
- Tsagkaris, A.S.; Koulis, G.A.; Danezis, G.P.; Martakos, I.; Dasenaki, M.; Georgiou, C.A.; Thomaidis, N.S. Honey authenticity: Analytical techniques, state of the art and challenges. RSC Adv. 2021, 11, 11273–11294. [Google Scholar] [CrossRef]
- Branch, S.; Burke, S.; Evans, P.; Fairman, B.; Briche, C.S.J.W. A preliminary study in determining the geographical origin of wheat using isotope ratio inductively coupled plasma mass spectrometry with 13C, 15N mass spectrometry. J. Anal. At. Spectrom. 2003, 18, 17–22. [Google Scholar] [CrossRef]
- Zhao, H.; Guo, B.; Wei, Y.; Zhang, B.; Sun, S.; Zhang, L.; Yan, J. Determining the Geographic Origin of Wheat Using Multielement Analysis and Multivariate Statistics. J. Agric. Food Chem. 2011, 59, 4397–4402. [Google Scholar] [CrossRef]
- Podio, N.S.; Baroni, M.V.; Badini, R.G.; Inga, M.; Ostera, H.A.; Cagnoni, M.; Gautier, E.A.; García, P.P.; Hoogewerff, J.; Wunderlin, D.A. Elemental and Isotopic Fingerprint of Argentinean Wheat. Matching Soil, Water, and Crop Composition to Differentiate Provenance. J. Agric. Food Chem. 2013, 61, 3763–3773. [Google Scholar] [CrossRef] [PubMed]
- Zhao, H.; Guo, B.; Wei, Y.; Zhang, B. Multi-element composition of wheat grain and provenance soil and their potentialities as fingerprints of geographical origin. J. Cereal Sci. 2013, 57, 391–397. [Google Scholar] [CrossRef]
- Liu, H.; Wei, Y.; Zhang, Y.; Wei, S.; Zhang, S.; Guo, B. The effectiveness of multi-element fingerprints for identifying the geographical origin of wheat. Int. J. Food Sci. Technol. 2017, 52, 1018–1025. [Google Scholar] [CrossRef]
- Laursen, K.H.; Schjoerring, J.K.; Olesen, J.E.; Askegaard, M.; Halekoh, U.; Husted, S. Multielemental Fingerprinting as a Tool for Authentication of Organic Wheat, Barley, Faba Bean, and Potato. J. Agric. Food Chem. 2011, 59, 4385–4396. [Google Scholar] [CrossRef]
- Wang, F.; Zhao, H.; Yu, C.; Tang, J.; Wu, W.; Yang, Q. Determination of the geographical origin of maize (Zea mays L.) using mineral element fingerprints. J. Sci. Food Agric. 2020, 100, 1294–1300. [Google Scholar] [CrossRef] [PubMed]
- Phuong, T.D.; Kokot, S.; Chuong, P.V.; Khiem, D.T. Elemental content of Vietnamese ricePart 1. Sampling, analysis and comparison with previous studies. Analyst 1999, 124, 553–560. [Google Scholar] [CrossRef]
- Kokot, S.; Phuong, T.D. Elemental content of Vietnamese ricePart 2.† Multivariate data analysis. Analyst 1999, 124, 561–569. [Google Scholar] [CrossRef]
- Kelly, S.; Baxter, M.; Chapman, S.; Rhodes, C.; Dennis, J.; Brereton, P. The application of isotopic and elemental analysis to determine the geographical origin of premium long grain rice. Eur Food Res Technol 2002, 214, 72–78. [Google Scholar] [CrossRef]
- Ariyama, K.; Shinozaki, M.; Kawasaki, A. Determination of the Geographic Origin of Rice by Chemometrics with Strontium and Lead Isotope Ratios and Multielement Concentrations. J. Agric. Food Chem. 2012, 60, 1628–1634. [Google Scholar] [CrossRef]
- Shen, S.; Xia, L.; Xiong, N.; Liu, Z.; Sun, H. Determination of the geographic origin of rice by element fingerprints and correlation analyses with the soil of origin. Anal. Methods 2013, 5, 6177–6185. [Google Scholar] [CrossRef]
- Cheajesadagul, P.; Arnaudguilhem, C.; Shiowatana, J.; Siripinyanond, A.; Szpunar, J. Discrimination of geographical origin of rice based on multi-element fingerprinting by high resolution inductively coupled plasma mass spectrometry. Food Chem. 2013, 141, 3504–3509. [Google Scholar] [CrossRef] [PubMed]
- Borges, E.M.; Gelinski, J.M.L.N.; de Oliveira Souza, V.C.; Barbosa, F., Jr.; Batista, B.L. Monitoring the authenticity of organic rice via chemometric analysis of elemental data. Food Res. Int. 2015, 77, 299–309. [Google Scholar] [CrossRef]
- Du, M.; Fang, Y.; Shen, F.; Mao, B.; Zou, Y.; Li, P.; Pei, F.; Hu, Q. Multiangle discrimination of geographical origin of rice based on analysis of mineral elements and characteristic volatile components. Int. J. Food Sci. Technol. 2018, 53, 2088–2096. [Google Scholar] [CrossRef]
- Qian, L.; Zhang, C.; Zuo, F.; Zheng, L.; Li, D.; Zhang, A.; Zhang, D. Effects of fertilizers and pesticides on the mineral elements used for the geographical origin traceability of rice. J. Food Compos. Anal. 2019, 83, 103276. [Google Scholar] [CrossRef]
- Liu, Z.; Zhang, W.; Zhang, Y.; Chen, T.; Shao, S.; Zhou, L.; Yuan, Y.; Xie, T.; Rogers, K.M. Assuring food safety and traceability of polished rice from different production regions in China and Southeast Asia using chemometric models. Food Control 2019, 99, 1–10. [Google Scholar] [CrossRef]
- Xu, F.; Kong, F.; Peng, H.; Dong, S.; Gao, W.; Zhang, G. Combing machine learning and elemental profiling for geographical authentication of Chinese Geographical Indication (GI) rice. npj Sci. Food. 2021, 5, 18. [Google Scholar] [CrossRef]
- Arif, M.; Chilvers, G.; Day, S.; Naveed, S.A.; Woolfe, M.; Rodionova, O.Y.; Pomerantsev, A.L.; Kracht, O.; Brodie, C.; Mihailova, A.; et al. Differentiating Pakistani long-grain rice grown inside and outside the accepted Basmati Himalayan geographical region using a ‘one-class’ multi-element chemometric model. Food Control 2021, 123, 107827. [Google Scholar] [CrossRef]
- Kongsri, S.; Sricharoen, P.; Limchoowong, N.; Kukusamude, C. Tracing the Geographical Origin of Thai Hom Mali Rice in Three Contiguous Provinces of Thailand Using Stable Isotopic and Elemental Markers Combined with Multivariate Analysis. Foods 2021, 10, 2349. [Google Scholar] [CrossRef]
- McGrath, T.F.; Shannon, M.; Chevallier, O.P.; Ch, R.; Xu, F.; Kong, F.; Peng, H.; Teye, E.; Akaba, S.; Wu, D.; et al. Food Fingerprinting: Using a Two-Tiered approach to Monitor and Mitigate Food Fraud in Rice. J. AOAC Int. 2021, 104, 16–28. [Google Scholar] [CrossRef]
- Bui, M.Q.; Quan, T.C.; Nguyen, Q.T.; Tran-Lam, T.-T.; Dao, Y.H. Geographical origin traceability of Sengcu rice using elemental markers and multivariate analysis. Food Addit. Contam. Part B 2022, 15, 177–190. [Google Scholar] [CrossRef]
- Qian, L.; Zuo, F.; Zhang, C.; Zhang, D. Geographical Origin Traceability of Rice: A Study on the Effect of Processing Precision on Index Elements. Food Sci. Technol. Res. 2019, 25, 619–624. [Google Scholar] [CrossRef]
- Mehari, B.; Redi-Abshiro, M.; Chandravanshi, B.S.; Combrinck, S.; McCrindle, R. Characterization of the Cultivation Region of Ethiopian Coffee by Elemental Analysis. Anal. Lett. 2016, 49, 2474–2489. [Google Scholar] [CrossRef]
- Rodrigues, C.; Brunner, M.; Steiman, S.; Bowen, G.J.; Nogueira, J.M.F.; Gautz, L.; Prohaska, T.; Máguas, C. Isotopes as Tracers of the Hawaiian Coffee-Producing Regions. J. Agric. Food Chem. 2011, 59, 10239–10246. [Google Scholar] [CrossRef] [PubMed]
- Albals, D.; Al-Momani, I.F.; Issa, R.; Yehya, A. Multi-element determination of essential and toxic metals in green and roasted coffee beans: A comparative study among different origins using ICP-MS. Sci. Prog. 2021, 104, 00368504211026162. [Google Scholar] [CrossRef] [PubMed]
- Voica, C.; Feher, I.; Iordache, A.M.; Cristea, G.; Dehelean, A.; Magdas, D.A.; Mirel, V. Multielemental Analysis of Coffee by Inductively Coupled Plasma-Mass Spectrometry. Anal. Lett. 2016, 49, 2627–2643. [Google Scholar] [CrossRef]
- Santato, A.; Bertoldi, D.; Perini, M.; Camin, F.; Larcher, R. Using elemental profiles and stable isotopes to trace the origin of green coffee beans on the global market. J. Mass Spectrom. 2012, 47, 1132–1140. [Google Scholar] [CrossRef]
- de Gois, J.S.; Lucena, I.O.; Paulo, S.D.O.; da Silva, A.P.; Lima, I.C.A.; Luna, A.S. A high-throughput method for multi-element determination in green coffee beans using diluted nitric acid and ultrasound energy. Anal. Methods 2018, 10, 1656–1661. [Google Scholar] [CrossRef]
- Bertoldi, D.; Barbero, A.; Camin, F.; Caligiani, A.; Larcher, R. Multielemental fingerprinting and geographic traceability of Theobroma cacao beans and cocoa products. Food Control 2016, 65, 46–53. [Google Scholar] [CrossRef]
- Acierno, V.; de Jonge, L.; van Ruth, S. Sniffing out cocoa bean traits that persist in chocolates by PTR-MS, ICP-MS and IR-MS. Food Res. Int. 2020, 133, 109212. [Google Scholar] [CrossRef]
- Vanderschueren, R.; Montalvo, D.; De Ketelaere, B.; Delcour, J.A.; Smolders, E. The elemental composition of chocolates is related to cacao content and origin: A multi-element fingerprinting analysis of single origin chocolates. J. Food Compos. Anal. 2019, 83, 103277. [Google Scholar] [CrossRef]
- Perez, M.; Lopez-Yerena, A.; Vallverdú-Queralt, A. Traceability, authenticity and sustainability of cocoa and chocolate products: A challenge for the chocolate industry. Crit. Rev. Food Sci. Nutr. 2022, 62, 475–489. [Google Scholar] [CrossRef] [PubMed]
- Pérez-Rodríguez, M.; Gaiad, J.E.; Hidalgo, M.J.; Avanza, M.V.; Pellerano, R.G. Classification of cowpea beans using multielemental fingerprinting combined with supervised learning. Food Control 2019, 95, 232–241. [Google Scholar] [CrossRef]
- Drivelos, S.A.; Higgins, K.; Kalivas, J.H.; Haroutounian, S.A.; Georgiou, C.A. Data fusion for food authentication. Combining rare earth elements and trace metals to discriminate “Fava Santorinis” from other yellow split peas using chemometric tools. Food Chem. 2014, 165, 316–322. [Google Scholar] [CrossRef] [PubMed]
- Drivelos, S.A.; Danezis, G.P.; Haroutounian, S.A.; Georgiou, C.A. Rare earth elements minimal harvest year variation facilitates robust geographical origin discrimination: The case of PDO “Fava Santorinis”. Food Chem. 2016, 213, 238–245. [Google Scholar] [CrossRef] [PubMed]
- Khazaei, H.; Vandenberg, A. Seed Mineral Composition and Protein Content of Faba Beans (Vicia faba L.) with Contrasting Tannin Contents. Agronomy 2020, 10, 511. [Google Scholar] [CrossRef]
- Pipan, B.; Sinkovič, L.; Pipan, B. Multi-elemental composition, nutrients and total phenolics in seeds of Phaseolus vulgaris L. breeding material. J. Elem. 2021, 26, 613–623. [Google Scholar] [CrossRef]
- Oddone, M.; Aceto, M.; Baldizzone, M.; Musso, D.; Osella, D. Authentication and Traceability Study of Hazelnuts from Piedmont, Italy. J. Agric. Food Chem. 2009, 57, 3404–3408. [Google Scholar] [CrossRef]
- Kalogiouri, N.P.; Manousi, N.; Klaoudatos, D.; Spanos, T.; Topi, V.; Zachariadis, G.A. Rare Earths as Authenticity Markers for the Discrimination of Greek and Turkish Pistachios Using Elemental Metabolomics and Chemometrics. Foods 2021, 10, 349. [Google Scholar] [CrossRef]
- Chen, L.; Ding, M.; Li, Z.; Li, X.; Deng, L. Determination of macro, micro and toxic element concentrations in peanuts from main peanut producing areas of China by ICP-MS: A pilot study on the geographical characterization. RSC Adv. 2022, 12, 16790–16797. [Google Scholar] [CrossRef]
- Segelke, T.; von Wuthenau, K.; Kuschnereit, A.; Müller, M.-S.; Fischer, M. Origin Determination of Walnuts (Juglans regia L.) on a Worldwide and Regional Level by Inductively Coupled Plasma Mass Spectrometry and Chemometrics. Foods 2020, 9, 1708. [Google Scholar] [CrossRef]
- von Wuthenau, K.; Segelke, T.; Müller, M.-S.; Behlok, H.; Fischer, M. Food authentication of almonds (Prunus dulcis mill.). Origin analysis with inductively coupled plasma mass spectrometry (ICP-MS) and chemometrics. Food Control 2022, 134, 108689. [Google Scholar] [CrossRef]
- Choi, Y.H.; Hong, C.K.; Kim, M.; Jung, S.O.; Park, J.; Oh, Y.H.; Kwon, J.-H. Multivariate analysis to discriminate the origin of sesame seeds by multi-element analysis inductively coupled plasma-mass spectrometry. Food Sci. Biotechnol. 2017, 26, 375–379. [Google Scholar] [CrossRef] [PubMed]
- Herbs and Spices (2019–2021). Available online: https://food.ec.europa.eu/safety/agri-food-fraud/eu-coordinated-actions/coordinated-control-plans/herbs-and-spices-2019-2021_en (accessed on 21 September 2022).
- Voica, C.; Nechita, C.; Iordache, A.M.; Roba, C.; Zgavarogea, R.; Ionete, R.E. ICP-MS Assessment of Essential and Toxic Trace Elements in Foodstuffs with Different Geographic Origins Available in Romanian Supermarkets. Molecules 2021, 26, 7081. [Google Scholar] [CrossRef]
- Tokalıoğlu, Ş.; Dokan, F.K.; Köprü, S. ICP-MS multi-element analysis for determining the origin by multivariate analysis of red pepper flakes from three different regions of Turkey. LWT 2019, 103, 301–307. [Google Scholar] [CrossRef]
- Ahmad, R.; Ahmad, N.; Amir, M.; Aljishi, F.; Alamer, M.H.; Al-Shaban, H.R.; Alsadah, Z.A.; Alsultan, B.M.; Aldawood, N.A.; Chathoth, S.; et al. Quality variation and standardization of black pepper (Piper nigrum): A comparative geographical evaluation based on instrumental and metabolomics analysis. Biomed. Chromatogr. 2020, 34, e4772. [Google Scholar] [CrossRef]
- Hwang, I.M.; Moon, E.W.; Lee, H.-W.; Jamila, N.; Su Kim, K.; Ha, J.-H.; Kim, S.H. Discrimination of Chili Powder Origin Using Inductively Coupled Plasma–Mass Spectrometry (ICP-MS), Inductively Coupled Plasma–Optical Emission Spectroscopy (ICP-OES), and Near Infrared (NIR) Spectroscopy. Anal. Lett. 2019, 52, 932–947. [Google Scholar] [CrossRef]
- Poór, P.; Poór, P.; Ördög, A.; Tari, I.; Bátori, Z.; Štajner, D.; Popović, B. Comparison of the mineral content of processed spice samples of sweet and hot paprika from the Szeged region. J. Elem. 2018, 23, 521–530. [Google Scholar] [CrossRef]
- Brunner, M.; Katona, R.; Stefánka, Z.; Prohaska, T. Determination of the geographical origin of processed spice using multielement and isotopic pattern on the example of Szegedi paprika. Eur. Food Res. Technol. 2010, 231, 623–634. [Google Scholar] [CrossRef]
- Perini, M.; Pianezze, S.; Ziller, L.; Ferrante, M.; Ferella, F.; Nisi, S.; Foschi, M.; D’Archivio, A.A. Stable isotope ratio analysis combined with inductively coupled plasma-mass spectrometry for geographical discrimination between Italian and foreign saffron. J. Mass Spectrom. 2020, 55, e4595. [Google Scholar] [CrossRef]
- D’Archivio, A.A.; Di Vacri, M.L.; Ferrante, M.; Maggi, M.A.; Nisi, S.; Ruggieri, F. Geographical discrimination of saffron (Crocus sativus L.) using ICP-MS elemental data and class modeling of PDO Zafferano dell’Aquila produced in Abruzzo (Italy). Food Anal. Methods 2019, 12, 2572–2581. [Google Scholar] [CrossRef]
- Zhu, L.; Xu, J.; Dou, P.; Dou, D.; Huang, L. The rhizosphere soil factors on the quality of wild-cultivated herb and its origin traceability as well as distinguishing from garden-cultivated herb: Mountainous forest cultivated ginseng for example. Ind. Crops Prod. 2021, 172, 114078. [Google Scholar] [CrossRef]
- Potortì, A.G.; Bua, G.D.; Lo Turco, V.; Ben Tekaya, A.; Beltifa, A.; Ben Mansour, H.; Dugo, G.; Di Bella, G. Major, minor and trace element concentrations in spices and aromatic herbs from Sicily (Italy) and Mahdia (Tunisia) by ICP-MS and multivariate analysis. Food Chem. 2020, 313, 126094. [Google Scholar] [CrossRef] [PubMed]
- Potortì, A.G.; Lo Turco, V.; Di Bella, G. Chemometric analysis of elements content in Algerian spices and aromatic herbs. LWT 2021, 138, 110643. [Google Scholar] [CrossRef]
- Xu, L.; Shi, Q.; Yan, S.-M.; Fu, H.-Y.; Xie, S.; Lu, D. Chemometric Analysis of Elemental Fingerprints for GE Authentication of Multiple Geographical Origins. J. Anal. Methods Chem. 2019, 2019, e2796502. [Google Scholar] [CrossRef]
- Galvin-King, P.; Haughey, S.A.; Elliott, C.T. Herb and spice fraud; the drivers, challenges and detection. Food Control 2018, 88, 85–97. [Google Scholar] [CrossRef]
- Ni, Z.; Ren, C.; Cheng, J.; Tang, F. Determination of Rare Earth Elements in Some Flower Herb Teas and their Infusions. J. Braz. Chem. Soc. 2017, 28, 1960–1965. [Google Scholar] [CrossRef]
- Liu, H.; Zeng, Y.; Yan, J.; Huang, R.; Zhao, X.; Zheng, X.; Mo, M.; Tan, S.; Tong, H. C N H O and mineral element stable isotope ratio analysis for authentication in tea. J. Food Compos. Anal. 2020, 91, 103513. [Google Scholar] [CrossRef]
- Liu, H.; Zeng, Y.; Zhao, X.; Tong, H. Chemometric Authentication of Pu’er Teas in Terms of Multielement Stable Isotope Ratios Analysis by EA-IRMS and ICP-MS. J. Food Drug Anal. 2020, 28, 248–260. [Google Scholar] [CrossRef]
- Liu, Z.; Yuan, Y.; Zhang, Y.; Shi, Y.; Hu, G.; Zhu, J.; Rogers, K.M. Geographical traceability of Chinese green tea using stable isotope and multi-element chemometrics. Rapid Commun. Mass Spectrom. 2019, 33, 778–788. [Google Scholar] [CrossRef]
- Liu, H.; Zeng, Y.; Zhao, X.; Tong, H. Improved geographical origin discrimination for tea using ICP-MS and ICP-OES techniques in combination with chemometric approach. J. Sci. Food Agric. 2020, 100, 3507–3516. [Google Scholar] [CrossRef]
- Zhang, J.; Yang, R.; Chen, R.; Li, Y.C.; Peng, Y.; Liu, C. Multielemental Analysis Associated with Chemometric Techniques for Geographical Origin Discrimination of Tea Leaves (Camelia sinensis) in Guizhou Province, SW China. Molecules 2018, 23, 3013. [Google Scholar] [CrossRef] [PubMed]
- Lou, Y.; Fu, X.; Yu, X.; Ye, Z.; Cui, H.; Zhang, Y. Stable Isotope Ratio and Elemental Profile Combined with Support Vector Machine for Provenance Discrimination of Oolong Tea (Wuyi-Rock Tea). J. Anal. Methods Chem. 2017, 2017, e5454231. [Google Scholar] [CrossRef]
- Zhang, J.; Yang, R.; Li, Y.C.; Wen, X.; Peng, Y.; Ni, X. Use of mineral multi-elemental analysis to authenticate geographical origin of different cultivars of tea in Guizhou, China. J. Sci. Food Agric. 2020, 100, 3046–3055. [Google Scholar] [CrossRef] [PubMed]
- Liu, H.-L.; Zeng, Y.-T.; Zhao, X.; Ye, Y.-L.; Wang, B.; Tong, H.-R. Monitoring the authenticity of pu’er tea via chemometric analysis of multielements and stable isotopes. Food Res. Int. 2020, 136, 109483. [Google Scholar] [CrossRef] [PubMed]
- Shuai, M.; Peng, C.; Niu, H.; Shao, D.; Hou, R.; Cai, H. Recent techniques for the authentication of the geographical origin of tea leaves from camellia sinensis: A review. Food Chem. 2022, 374, 131713. [Google Scholar] [CrossRef]


| Isotope | Isobaric Interference |
| 40K | 40Ca |
| 50V | 50Cr |
| 64Ni | 64Zn |
| 94Zr | 94Mo |
| 113In | 113Cd |
| Isotope | Double Charge Ion |
| 44Ca | 88Sr2+ |
| 69Ga | 138Ba2+ |
| 70Ge | 140Ce2+ |
| 85Rb | 170Er2+ |
| 119Sn | 238U2+ |
| Isotope | Polyatomic Ions |
| 28Si | 14N2+, 12C16O+ |
| 31P | 14N16O1H+ |
| 44Ca | 12C16O2+ |
| 36Fe | 40Ar16O+ |
| 75As | 40Ar35Cl+ |
Publisher’s Note: MDPI stays neutral with regard to jurisdictional claims in published maps and institutional affiliations. |
© 2022 by the authors. Licensee MDPI, Basel, Switzerland. This article is an open access article distributed under the terms and conditions of the Creative Commons Attribution (CC BY) license (https://creativecommons.org/licenses/by/4.0/).
Share and Cite
Mazarakioti, E.C.; Zotos, A.; Thomatou, A.-A.; Kontogeorgos, A.; Patakas, A.; Ladavos, A. Inductively Coupled Plasma-Mass Spectrometry (ICP-MS), a Useful Tool in Authenticity of Agricultural Products’ and Foods’ Origin. Foods 2022, 11, 3705. https://doi.org/10.3390/foods11223705
Mazarakioti EC, Zotos A, Thomatou A-A, Kontogeorgos A, Patakas A, Ladavos A. Inductively Coupled Plasma-Mass Spectrometry (ICP-MS), a Useful Tool in Authenticity of Agricultural Products’ and Foods’ Origin. Foods. 2022; 11(22):3705. https://doi.org/10.3390/foods11223705
Chicago/Turabian StyleMazarakioti, Eleni C., Anastasios Zotos, Anna-Akrivi Thomatou, Achilleas Kontogeorgos, Angelos Patakas, and Athanasios Ladavos. 2022. "Inductively Coupled Plasma-Mass Spectrometry (ICP-MS), a Useful Tool in Authenticity of Agricultural Products’ and Foods’ Origin" Foods 11, no. 22: 3705. https://doi.org/10.3390/foods11223705
APA StyleMazarakioti, E. C., Zotos, A., Thomatou, A.-A., Kontogeorgos, A., Patakas, A., & Ladavos, A. (2022). Inductively Coupled Plasma-Mass Spectrometry (ICP-MS), a Useful Tool in Authenticity of Agricultural Products’ and Foods’ Origin. Foods, 11(22), 3705. https://doi.org/10.3390/foods11223705