Abstract
The effect of frying temperature on heat transfer, water loss kinetic, oil uptake kinetic, and quality of French fries was evaluated. With increasing frying temperature, the core temperature of fries increased, and the Biot number and heat transfer coefficient (h) first decreased and then increased significantly (p < 0.05). The water loss rate (kw) and water effective diffusion of fries increased with the increasing frying temperature. The kw of fries fried at 150–190 °C were 0.2391, 0.2414, 0.3205, 0.3998, and 0.3931, respectively. The oil uptake rate (ko) first increased and then decreased with increasing frying temperature, and the ko of samples fried at 150–190 °C were 0.2691, 0.2564, 0.4764, 0.3387, and 0.2522, respectively. There were significant differences in the a*, L*, ΔE, and BI between fries with different temperatures (p < 0.05), while there was no significant difference in the b* (p > 0.05). The hardness and crispness of fries increased with increased frying temperature. The highest overall acceptability scores of fries were fried at 170 °C. Therefore, the changes in color, texture overall acceptability, and oil content were due to the Maillard reaction and the formation of porous structure, which was induced by h and water evaporation of fries when they changed.
1. Introduction
French fries are a casual fried snack with golden color, crispy texture, and attractive flavor, which are popular with consumers. However, the oil content of French fries is in the range of 30–50% [1]. Excessive intake of fried foods with high oil content may increase the risk of high blood pressure, obesity, heart diseases, diabetes, and so on [2]. Low-oil fried foods with excellent quality are expected by consumers and businesses, which drive the latest research trend.
Currently, the research of the fried foods’ oil content and quality focus on monitoring frying temperature and time [3], developing new frying technologies [4], using pretreatment [5], and so on. New frying and pretreatment technologies, such as microwave-assisted vacuum frying [6], electric field frying [7], and hot-air pre-drying [5], are cumbersome to operate, time-consuming, and high-cost. Frying temperature is the basic and critical parameter that influences the oil content and quality during frying. Liu, Tian, Zhang, and Fan [8] found that, as the frying temperature increased from 140 °C to 180 °C, the oil content of chips decreased by 14.7%.
There are three possible mechanisms to explain the oil absorption during frying, including water replacement (oil entered into the channels left by water evaporation), surfactant effect (the oil easily penetrated into food, due to the reduced interfacial tension between oil and food), and cooling effect (oil adhered to food’s surface was sucked into the cracks on the surface of food) [9]. The first two occur in the frying process, and the third occurs in the cooling phase after frying. Yu, Li, Ding, Hang, and Fan [10] studied that frying was a surface phenomenon, and the oil absorption behavior mainly occurred after frying. Li et al. [11] reported that there was a strongly positive correlation between the water and oil content during frying. The main mechanism of oil absorption in fried food is still controversial. In fact, the frying process involves heat transfer and moisture loss [10], which gave rise to starch gelatinization [12], Maillard reaction [13], protein denaturation [14], the formation of surface roughness [5], etc., which can affect the oil content and sensory attributes in fried foodstuffs. Sun et al. [6] reported that the frying temperature influenced the degree of Maillard reaction. Fanue et al. [15] studied the higher the frying temperature, the more energy transferred from frying medium to food. However, the studies for the mechanisms of oil uptake and quality changes by monitoring the dynamic changes of heat transfer and water evaporation were few.
Therefore, this study aimed to: (1) explore the effect of frying temperature on the heat transfer of fries during frying; (2) monitor the dynamic changes in water and oil content of fries; (3) establish the modeling of water loss and oil uptake kinetics of fries with different frying temperatures; (4) study the effect of frying temperature on the color, texture, and sensory evaluation of fries.
2. Materials and Methods
2.1. Samples Preparation
The frozen potato strips were obtained from Langweston Potato Industry Co., Ltd. (Inner Mongolia, China), cut into 5 × 1 × 1 strips, and stored at −18 °C. The oil used in the experiment was soybean oil, which was purchased from the local store (Harbin, China). The potato strips were fried in soybean oil at 150 °C, 160 °C, 170 °C, 180 °C, and 190 °C for 1–13 min using a thermostatically temperature-controlled fryer (DF25A, Guangzhou, China). After frying, the samples were removed and shaken in an aluminum basket to drain off for 30 s.
2.2. Core Temperature and Heat Transfer Coefficient (h)
The thermocouples were inserted into the geometric center of potato strips, and the sample was fixed in the middle of fryer and fried for 3 min. A digital multimeter was used to record the temperature in the center of fries from 0–3 min [15]. The Biot number (Bih) and heat transfer coefficient (h) was obtained from the temperature curves of French fries, which was calculated by Equations (1)–(3):
Here, T(t): temperature at t s (°C); T∞: temperature of frying oil (°C); T0: temperature of fries in the 0 min (°C); μ1: a parameter; α: thermal diffusivity (1.45 × 10⁻⁷ m2/s); x and y: location of temperature measurement in the infinite plates; L: half-thickness of potato strips (m); Bih: transfer heat Biot number; h: heat transfer coefficient (W/m2·K). The μ1 was calculated by the slope of curves of vs. time.
2.3. Water Content
The water content was measured by the method of AOAC (2000) [16]. The water content of fries was measured every 1 min. The water content was expressed in g/100g db.
2.4. Water Loss Kinetics of French Fries
The experiment data was obtained from the curves of water content vs. time. The water loss kinetics of French fries was expressed by Fick’s second law of diffusion (Equation (4)) [17].
Assuming the diffusivity and oil temperature was constant, and the shrinkage and external resistant of fries were negligible, the water loss rate (kw) of fries was calculated according to Equation (5).
For long frying time, Equation (5) could be simplified to Equation (6):
Here, M: water content of fries at t min (g/100g, db); M0: initial water content of potato strips (g/100g, db); Me: equilibrium water content (g/100g, db); Mr: water ratio (dimensionless); L: half-thickness of potato strips (m); Deff: water effective diffusivity (m2/min); kw: water loss rate (min−1).
The water effective diffusivity (Deff) was calculated from Equation (7):
The activation energy of water loss in fries was calculated by Equation (8) [18]:
where k: water loss rate; k0: frequency factor; Ea: activation energy; R: universal gas constant; T: frying temperature in Kelvin.
2.5. Oil Content
The oil contents of fries fried at different temperatures were determined every 1 min using Soxhlet extraction method. The oil content was expressed in g/100g db.
2.6. The Oil Uptake Kinetics
The oil uptake kinetic of fries was described by Equation (8) [18]:
Here, O: oil content of fries at t s (g/100g db); Oe: equilibrium oil content (g/100g db); O0: initial oil content of fries; Or: oil ration; ko: oil uptake rate. When t = 0, the oil content was 8.9 ± 0.5 g/100g db.
The activation energy of water loss in fries was calculated by Equation (10):
where O1: pre exponential factor; Ea: activation energy of oil absorption.
2.7. Color
The lightness (L*), redness (a*), and yellowness (b*) values of French fries were measured using ZE-6000 colorimeter (Juki Corp, Tokyo, Japan) by the method of He et al. [19]. The color difference (ΔE) and browning index (BI) of fries were calculated by Equations (11)–(13):
where L0*, a0*, and b0* are the color parameters of unfried samples, L*, a*, and b* are the color parameters of French fries.
2.8. Texture
The texture of French fries was measured by the puncture test using TA.XT Plus C texture analyzer (Stable Microsystems, UK), according to the method of Zhang et al. [20] and Li et al. [21], with some modifications. After frying, the fries were taken out of the fryer, and as the surface temperature of fries was cooled to 50 °C, the puncture test was conducted.
2.9. Sensory Evaluation
The samples were used for sensory analysis, including the French fries fried at 150 °C, 160 °C, 170 °C, 180 °C, and 190 °C. The samples were served to the assessors in plastic boxes labeled with three random numbers [22]. The groups of 20 trained assessors were divided into 2 groups of 10 members. The color, crispness, aroma, oiliness, and overall acceptability of fries were evaluated using a 9-point hedonic scale for each sensory attribution.
2.10. Statistical Analysis
All experiments were conducted at least three times. The data were provided with mean values ± standard error (SE) adopting a Student’s t-test by Statistic 8.0 software [23] (Analytical Software, St. Paul, MN, USA). The level of significance was set to p ≤ 0.05.
3. Results and Discussion
3.1. Core Temperature
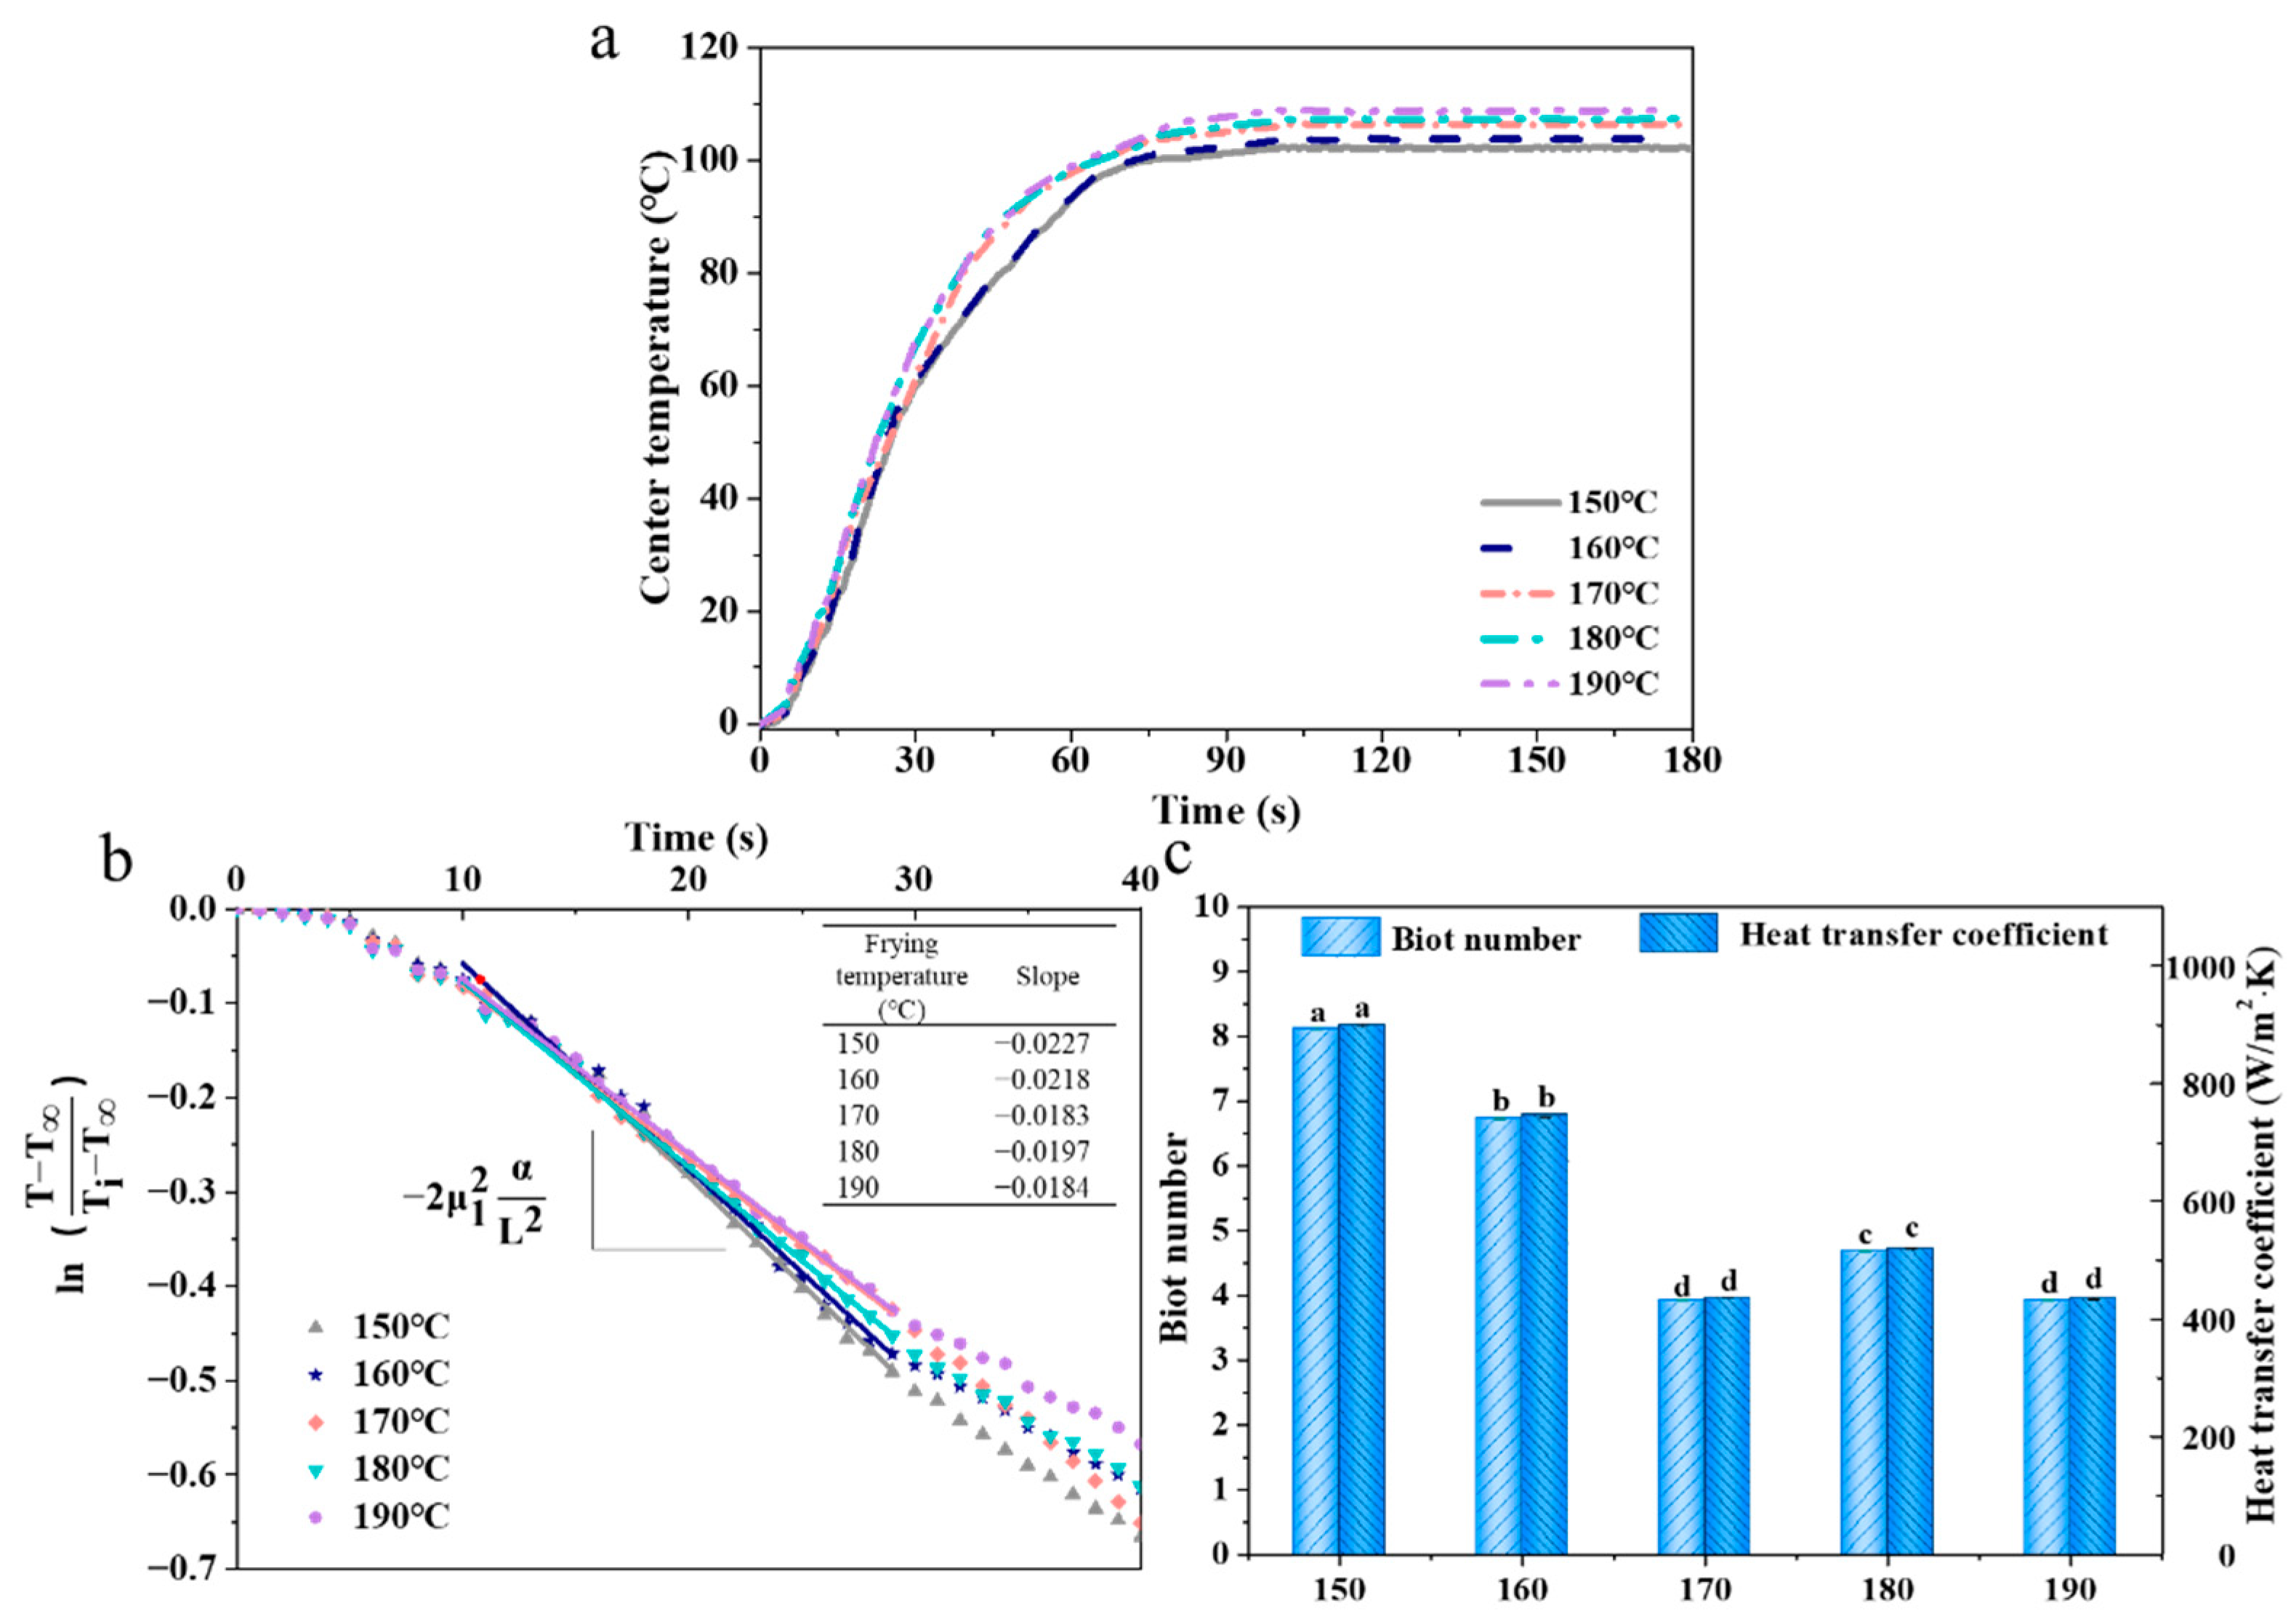
As the frying time prolonged, the core temperatures of all samples rose first (<90 °C) and reached a plateau (>90 °C) and were finally in the range of 100–110 °C (Figure 1a). This result could be explained as follows: as the core temperature of French fries reached the boiling point of water, the energy transferred from the frying medium (frying oil) to the interior of fries was used for water evaporation, which led to less energy being used for the increase of the internal temperature [24]. Meanwhile, the rising rate of the center temperature in the fries increased when the frying temperature increased, which was attributed to the fact that the heat transfer and inward migration of water evaporation increased, allowing more energy to be used to increase the core temperature [25].
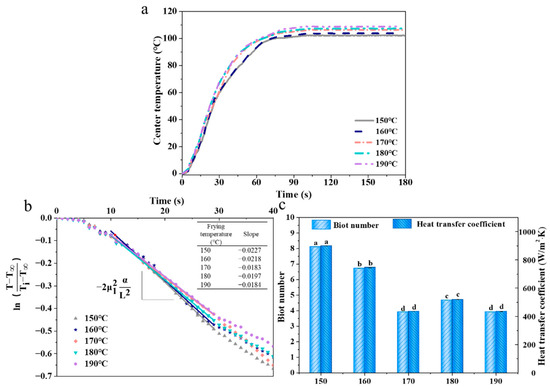
Figure 1.
Effect of frying temperature on the center temperature (a), slope of linear sections of dimensionless temperature ratio vs. time plots (b), Biot number and heat transfer coefficient (c) in French fries. The results are the mean ± SE. Different letters (a–d) indicate significant differences (p ≤ 0.05).
The Bih and h values (Figure 1c), respectively, reflected the ratio of internal thermal resistance to external thermal resistance of the fries and effective heat transfer coefficient, which were calculated by slopes of linear sections of dimensionless temperature vs. time plots (Figure 1b). The slopes, Bih, and h values of the fries increased first and subsequently decreased when the temperature increased, and the minimum value was obtained at 170 °C, and there was no significant difference in Bih and h values at 170 °C and 190 °C (p > 0.05). The reduction of slopes, Bih, and h values indicated that the heat transfer transferred from the frying oil to the interior of the fries was hindered, which was attributed to the reduced oil interfacial tension when water evaporated during frying, resulting in the formation of surface bubbles [26]. As the frying temperature increased above to 170 °C, the outside of fries formed a hard crust, which inhibited the water loss inside the fries [27].
3.2. Water Content and Kinetic Modeling of French Fries
3.2.1. Water Content
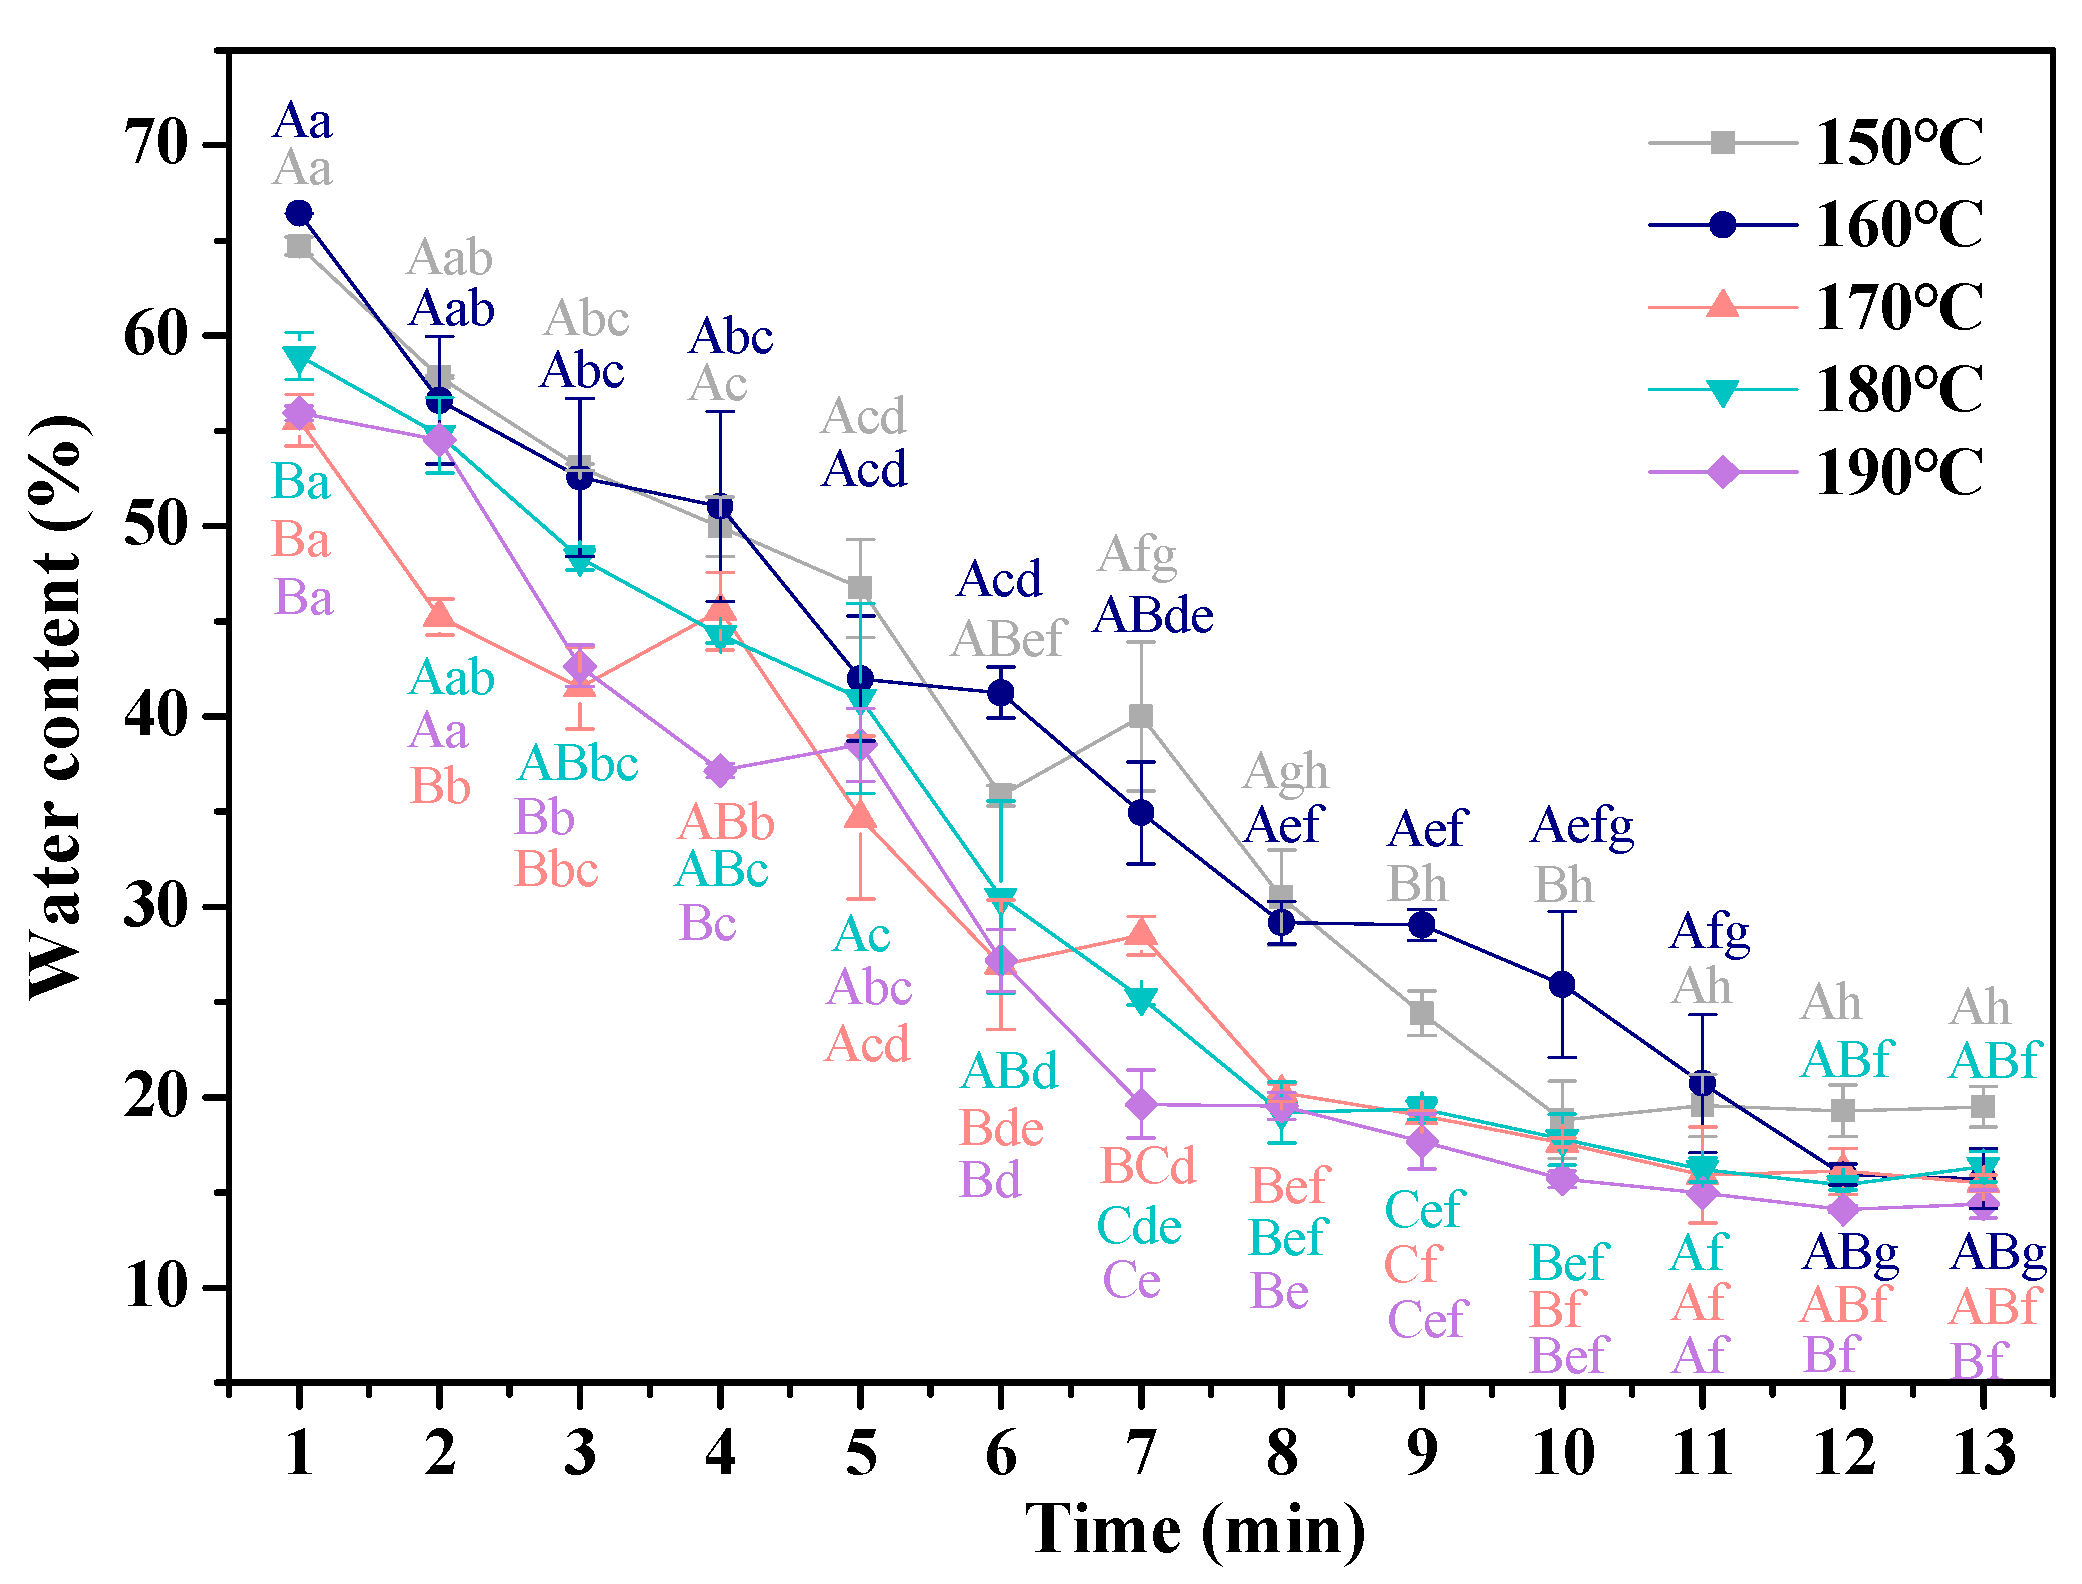
The water migration is closely related to the oil uptake and quality of fried food [28]. The dynamic changes in the water content of French fries with different frying temperature are shown in Figure 2. With increasing frying time, the water content of all samples showed a trend of decreasing dramatically and gradually flattening, and they reached equilibrium water contents (Me) in 9, 10, 10, and 11 min, respectively. Zhang, Zhang, Fan, Li, and Fan [29] reported that the water content of fried chips decreased from 82% to 2% after frying for 6 min, and there was no significant difference between other samples. The changes in water content with frying time indicated that water loss of fries during frying was divided into three stages: (1) at the beginning of frying process, the heat in the frying oil was transferred to the surface of the food in the form of convection, and at this time, there was no water evaporation. When the surface temperature reached the boiling point of water, the water migrated from the fries to frying medium, which led to the formation of vapor bubbles on the surface of the fries [30]. This phenomenon would continue for a period of time; thus, this stage was called the surface boiling stage. (2) As the frying temperature increased, the fries’ surface formed a crust, and the thickness of the crust gradually increased with the inward movement of water evaporation, resulting in that the water evaporation rate slowed down; thus, this stage was the rate reduction stage [9]. (3) When the water evaporation rate slowed down to the point where almost no bubbles were formed on the surface of fries, the bubble ending stage was entered, and the water loss reached equilibrium at this stage.
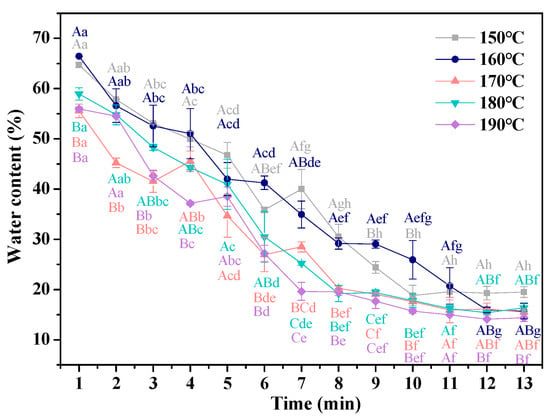
Figure 2.
Effect of frying temperature and time on the water content of French fries. The results are the mean ± SE. Different capital letters (A–C) indicate significant differences within different temperature (p ≤ 0.05), and different lower-case letters (a–f) indicate significant differences within different time (p ≤ 0.05).
The water content of fries decreased with the increasing frying temperature when the time was below 7 min, while the water content of other fries had no significant difference (p > 0.05). The changes in the water content of fries with different frying temperatures could be explained in such a way that, as the frying temperature increased, the surface boiling stage accelerated, which increased the water loss of the fries.
3.2.2. Water Loss Kinetic Modeling
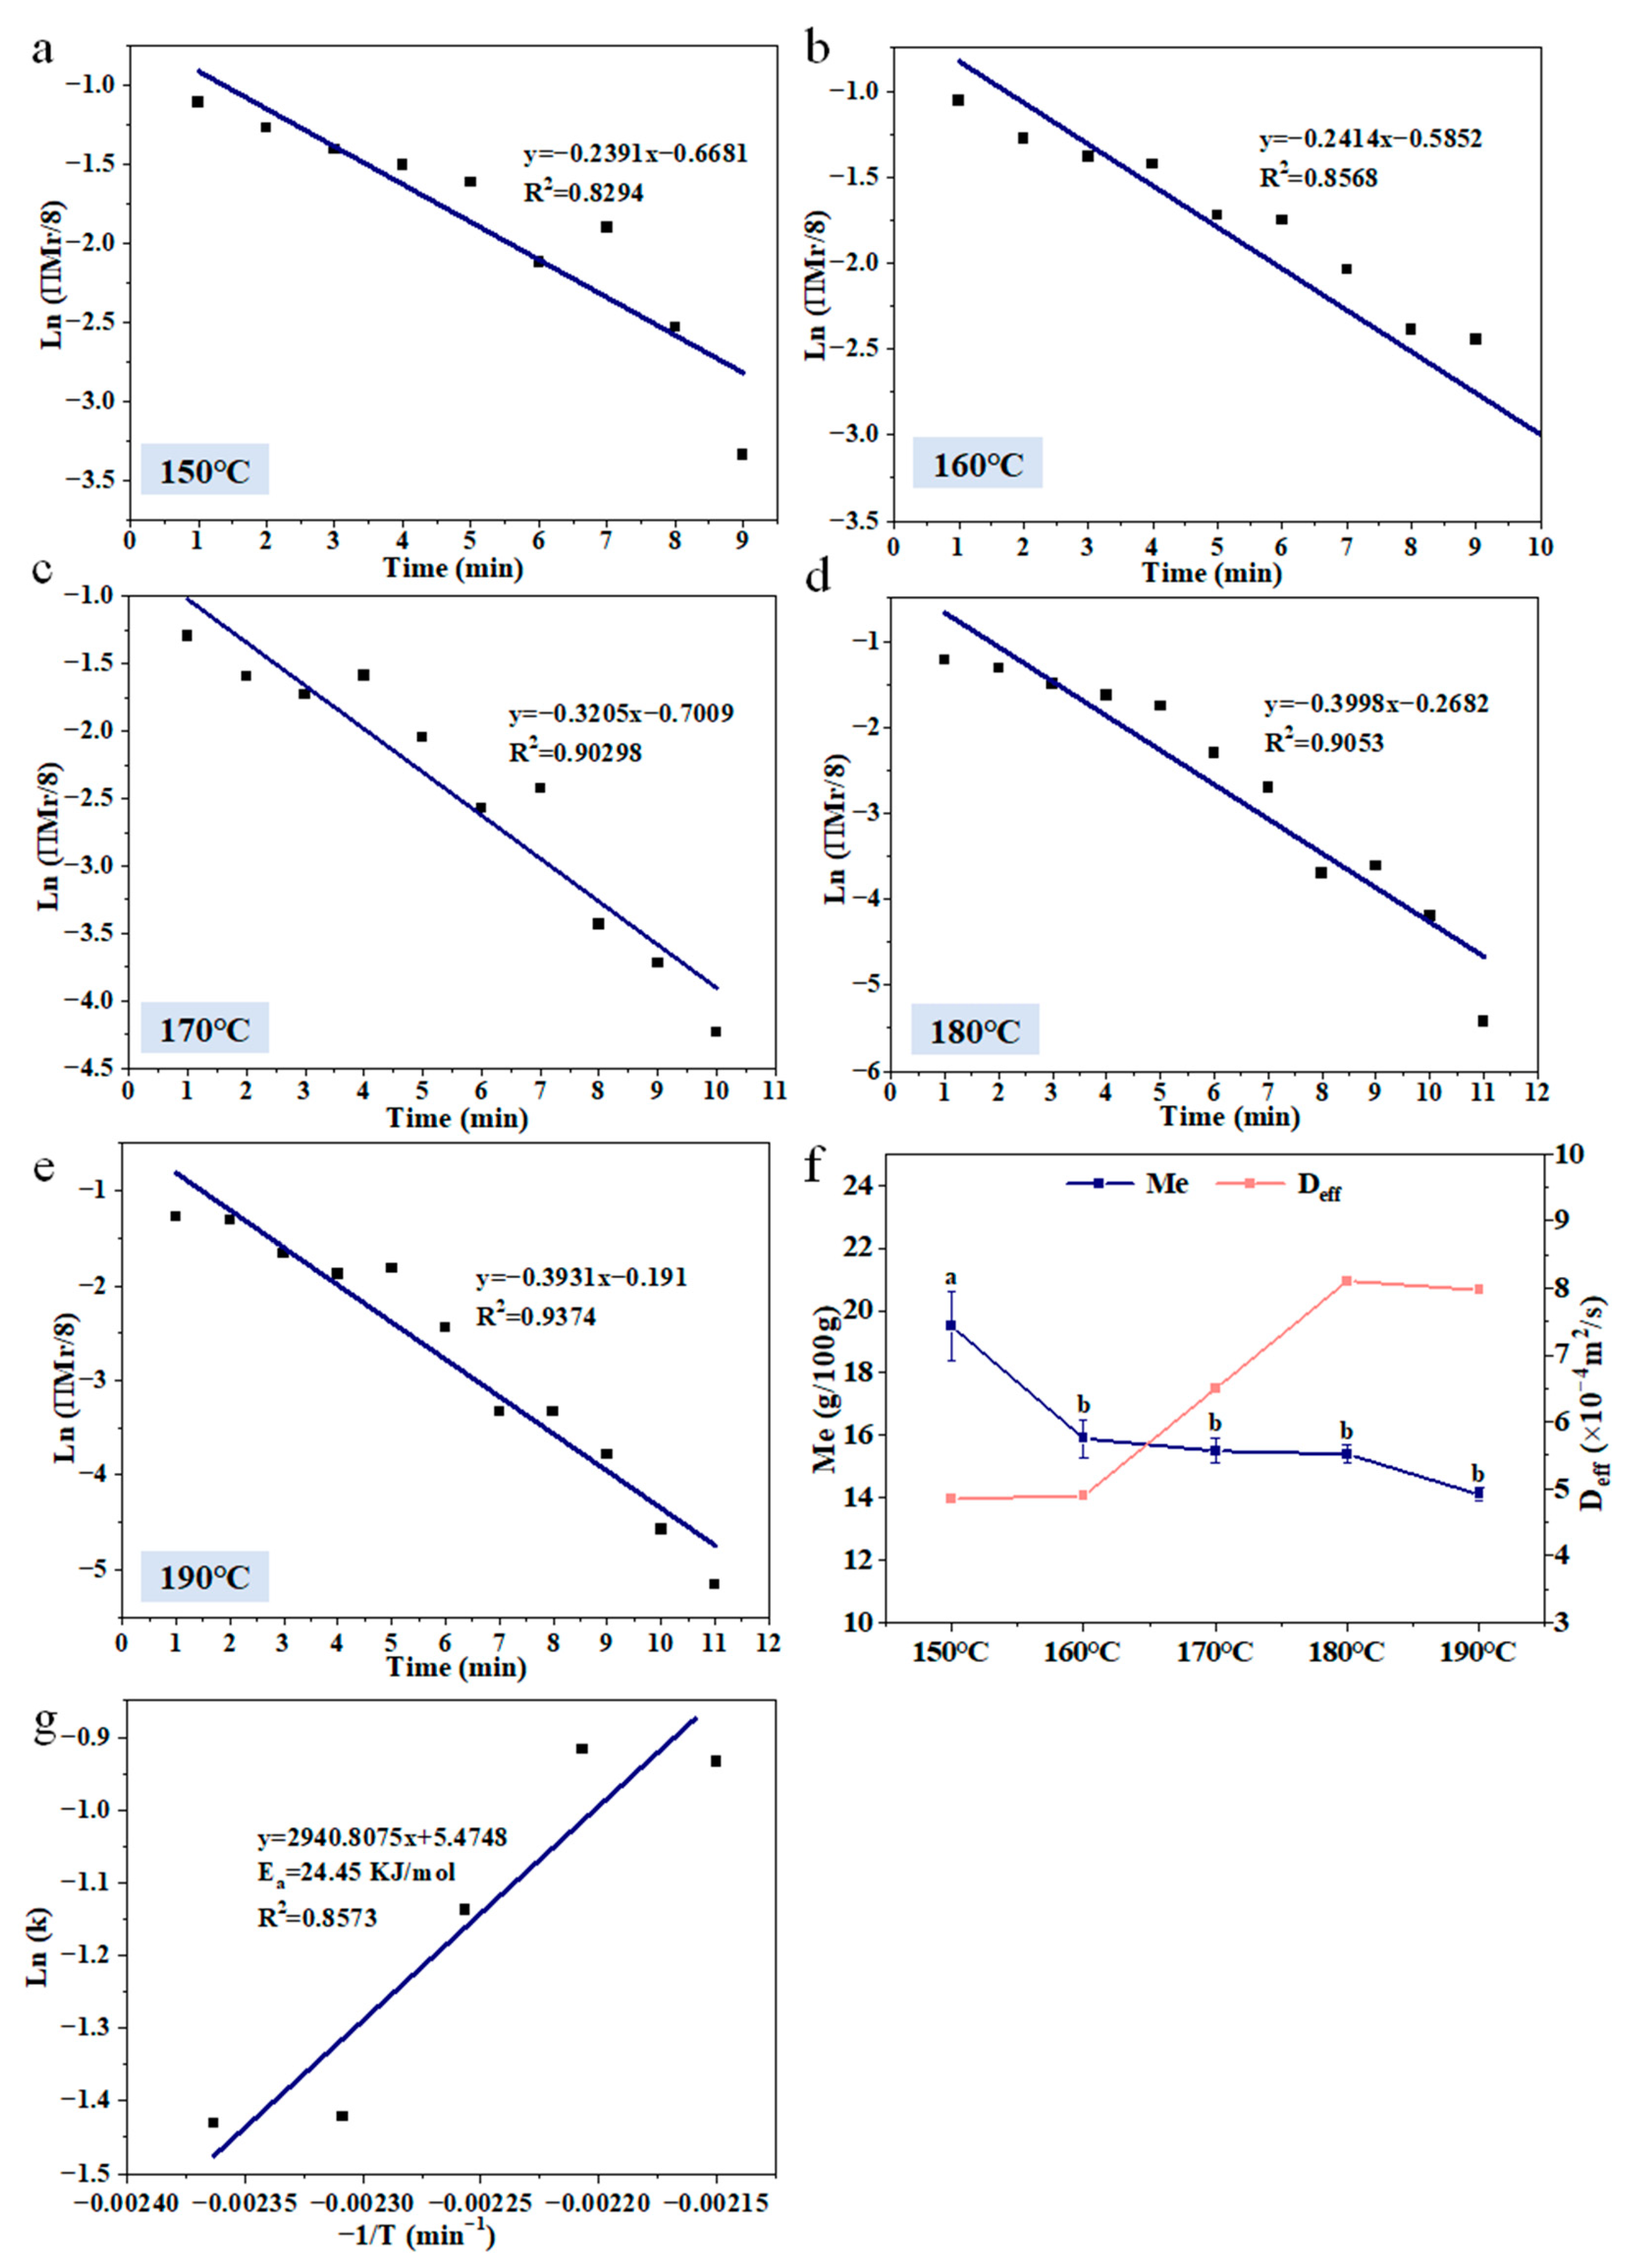
The changes in water loss rate (kw), R2, Deff, and Me of fries with different temperatures and the Ea value of water loss are shown in Figure 3. The kw values were obtained from the slopes of fit curves of Ln (ПMr/8) vs. time (Figure 3). The Deff is the water effective diffusivity, which was calculated by k values. The activation energy was used to define the energy barrier that needed to be overcome for a chemical reaction to occur. With frying temperature increased, the kw, R2, and Deff values of French fries, respectively, increased from 0.2391 to 0.3931; 0.8294 to 0.9371; 4.8505 × 10⁻⁴ to 7.9736 × 10⁻⁴, and the Me decreased. The activation energy of water loss in fries was 24.45 KJ/mol, which indicated that a large amount of energy was used for the water evaporation of fries during frying. Oladejo et al. [18] also reported that the kw and Deff values of fried sweet potatoes increased with increasing frying temperature, which indicated that the water evaporation rate and water diffusion rate of French fries increased with increasing frying temperature.
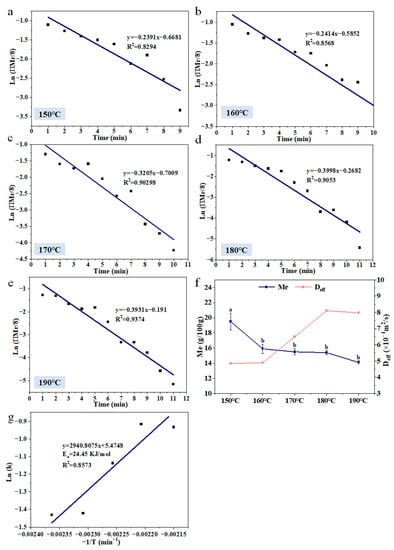
Figure 3.
The modeling of water loss kinetics (a–e), kinetic parameters (f), and activation energy of water loss (g) in French fries. The results are the mean ± SE. Different letters (a,b) indicate significant differences (p ≤ 0.05).
3.3. Oil Uptake and Kinetic Modeling of French Fries
3.3.1. Oil Content
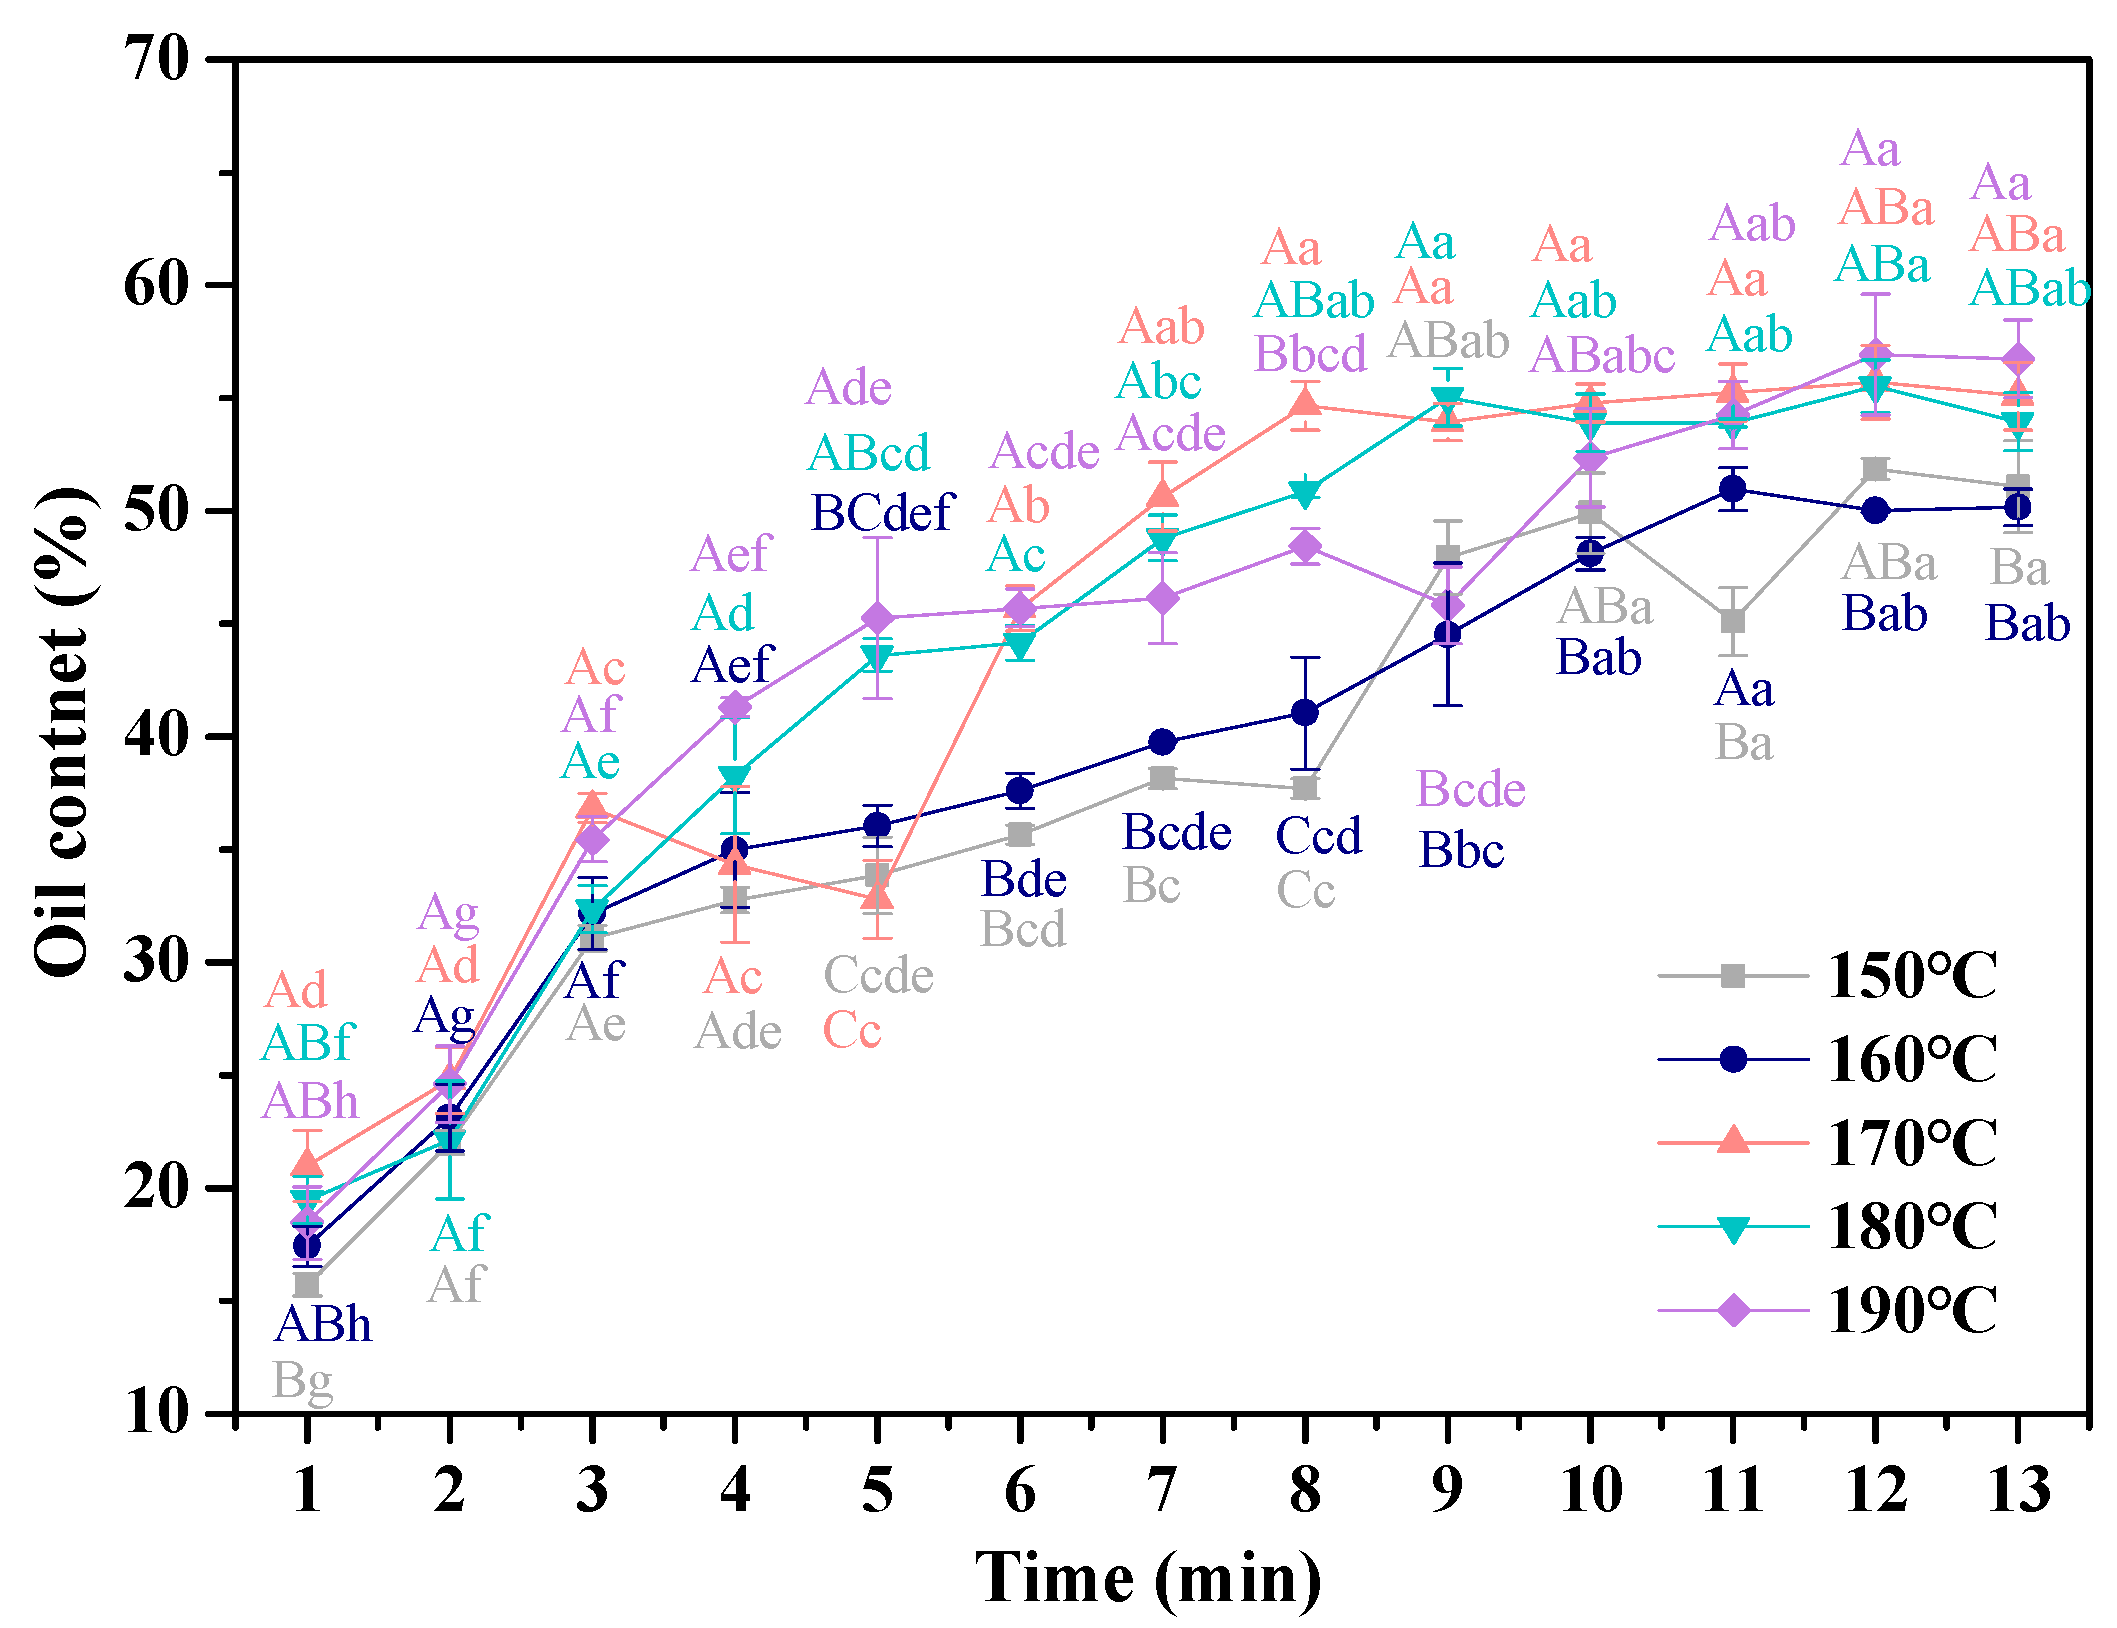
The dynamic changes in the oil content of French fries fried with different frying temperatures are exhibited in Figure 4. As the frying times prolonged, the oil content of the fries increased from 7.8% to 45–55% and showed a trend of first increasing and then reaching a plateau. Oil absorption of fried foods during frying is a complex process, and there are three possible mechanisms to explain the oil absorption of fried foods, namely water replacement mechanism, condensation effect, and surface-active agents [31]. The water replacement mechanism explained that the escape of water created water vapor channels, holes, and cracks in the fries, which oil could penetrate [8]. After frying, the fries were taken out of fryer, and the pressure of the holes on the fries’ surface reduced, leading to the oil that adhered to the surface being sucked into the pores, which was described by the condensation effect [32]. The third mechanism existed in foods that fried for a long time: as the frying time prolonged, the interfacial tension between the fries’ surface and oil decreased, due to the hydrolysis of oil, resulting in oil that easily penetrated into the fries [33]. The changes of the oil content with the increase of frying time could be explained by the fact that the pores of fries left by the water evaporation increased, which provided enough spaces for oil penetration [34], leading to the oil content increase. As no water evaporated from the fries, the oil uptake behavior of the oil gradually stopped.
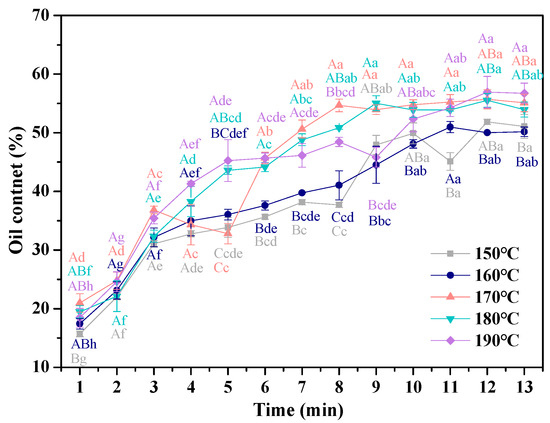
Figure 4.
Effect of frying temperatures and times on the oil content in French fries. The results are the mean ± SE. Different capital letters (A–C) indicate significant differences within different temperature (p ≤ 0.05), and different lower-case letters (a–f) indicate significant differences within different times (p ≤ 0.05).
With the increasing frying temperature, the oil content of French fries first increased and then decreased, which could be explained by the fact that the pressure in the water channels increased, which was caused by water evaporation increase [35], which prevented the oil from penetrating.
3.3.2. Oil Uptake Kinetic Modeling
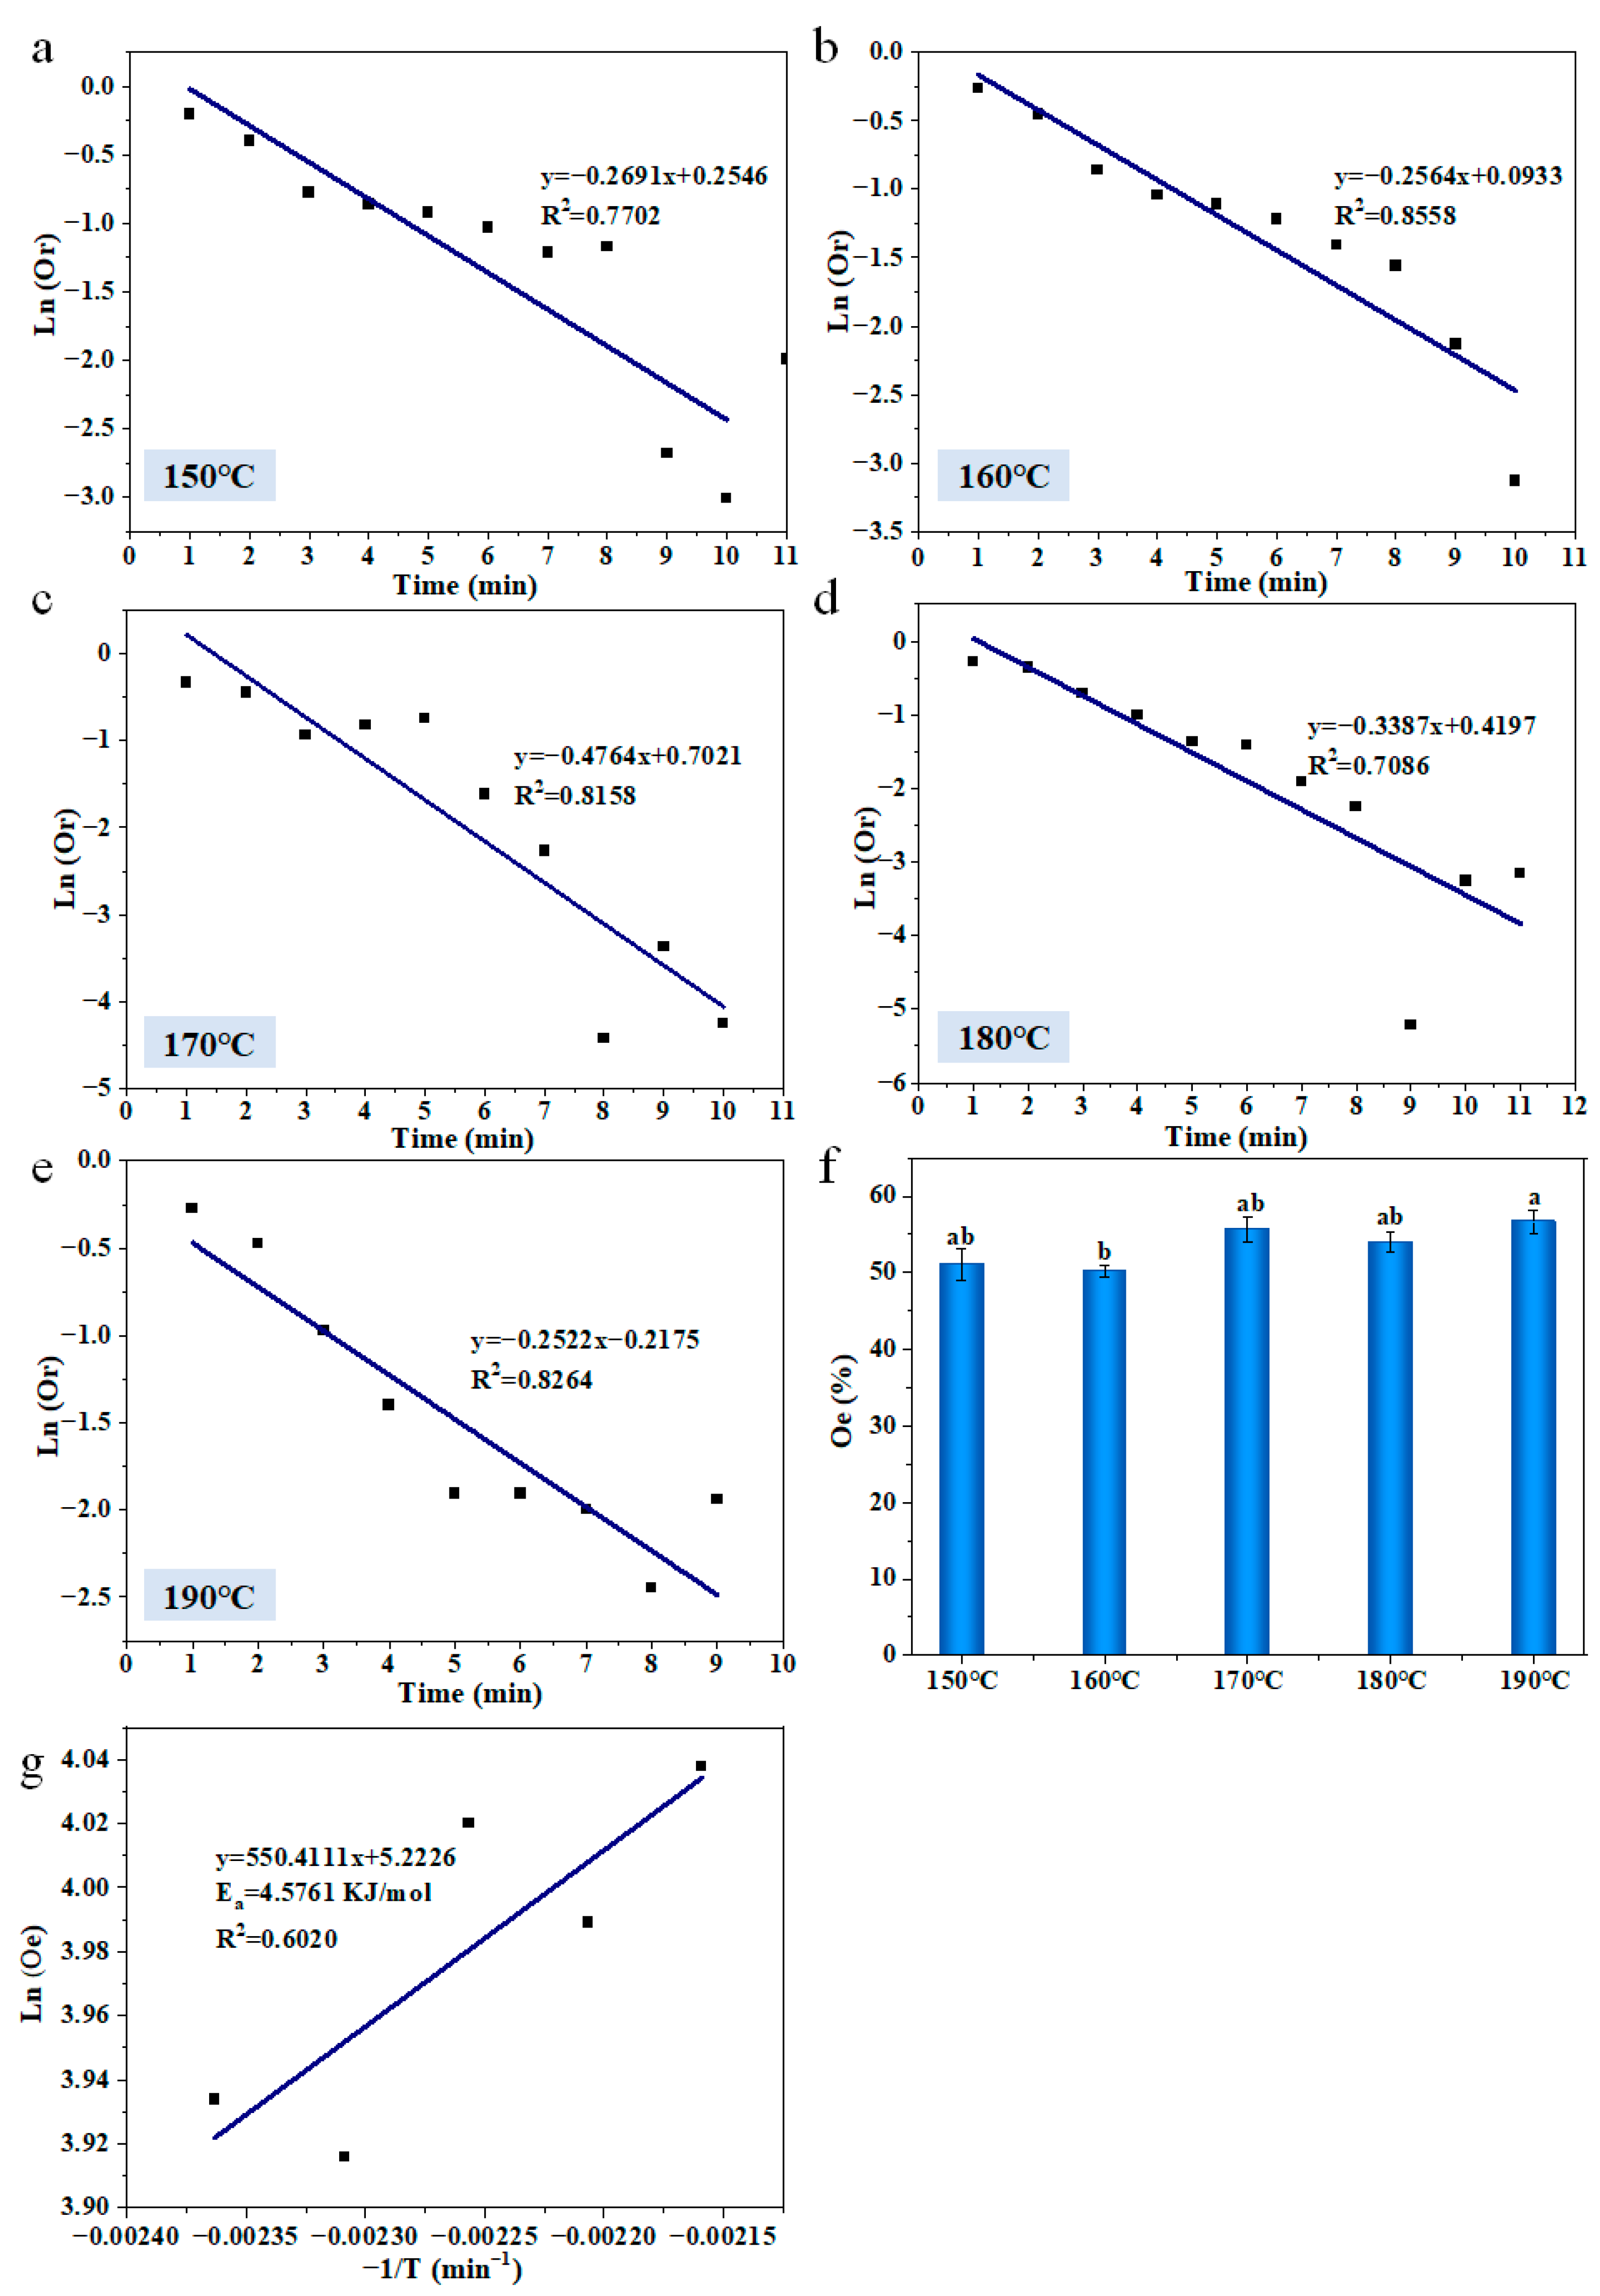
The fit curves of the Ln (Or) vs. time, oil uptake rate (ko), and equilibrium oil content (Oe) values of French fries with different frying temperatures and Ea values of oil uptake are displayed in Figure 5. The ko values of fries were obtained from the slopes of fit curves. With the increasing temperature, the oil uptake rate (ko) and Oe showed a trend of first increasing and then decreasing, and the maximum value was obtained at 170 °C. The ko values of fries fried at 150, 160, and 170 °C were higher than the kw, while the ko values of samples fried at 180 and 190 °C were lower than the kw. The changes of ko and Oe values in samples with different frying temperature were attributed to the fact that, as the frying temperature increased, the bubbles covering the surface of fries formed a barrier [36], preventing the oil from contacting the surface of fries. Additionally, the higher the frying temperature, the denser the bubbles covering the surface of fries, and the more difficult it is for the oil to contact the fries’ surface. The activation energy of the oil absorption in fries was 4.58 KJ/mol, which was lower than the Ea of water loss, implying that the fries required less energy to absorb oil than water evaporation.
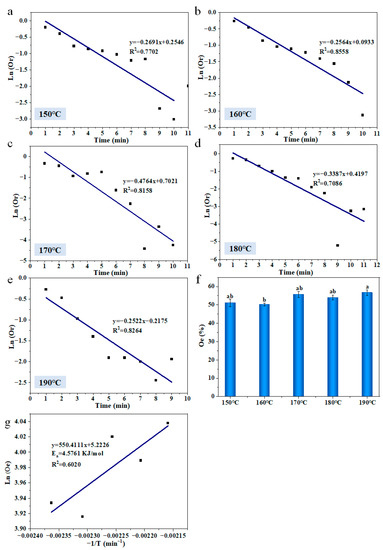
Figure 5.
The modeling of oil uptake kinetics (a–e), kinetic parameters (f), and activation energy of oil absorption (g) in French fries. The results are the mean ± SE. Different letters (a,b) indicate significant differences (p ≤ 0.05).
3.4. Color
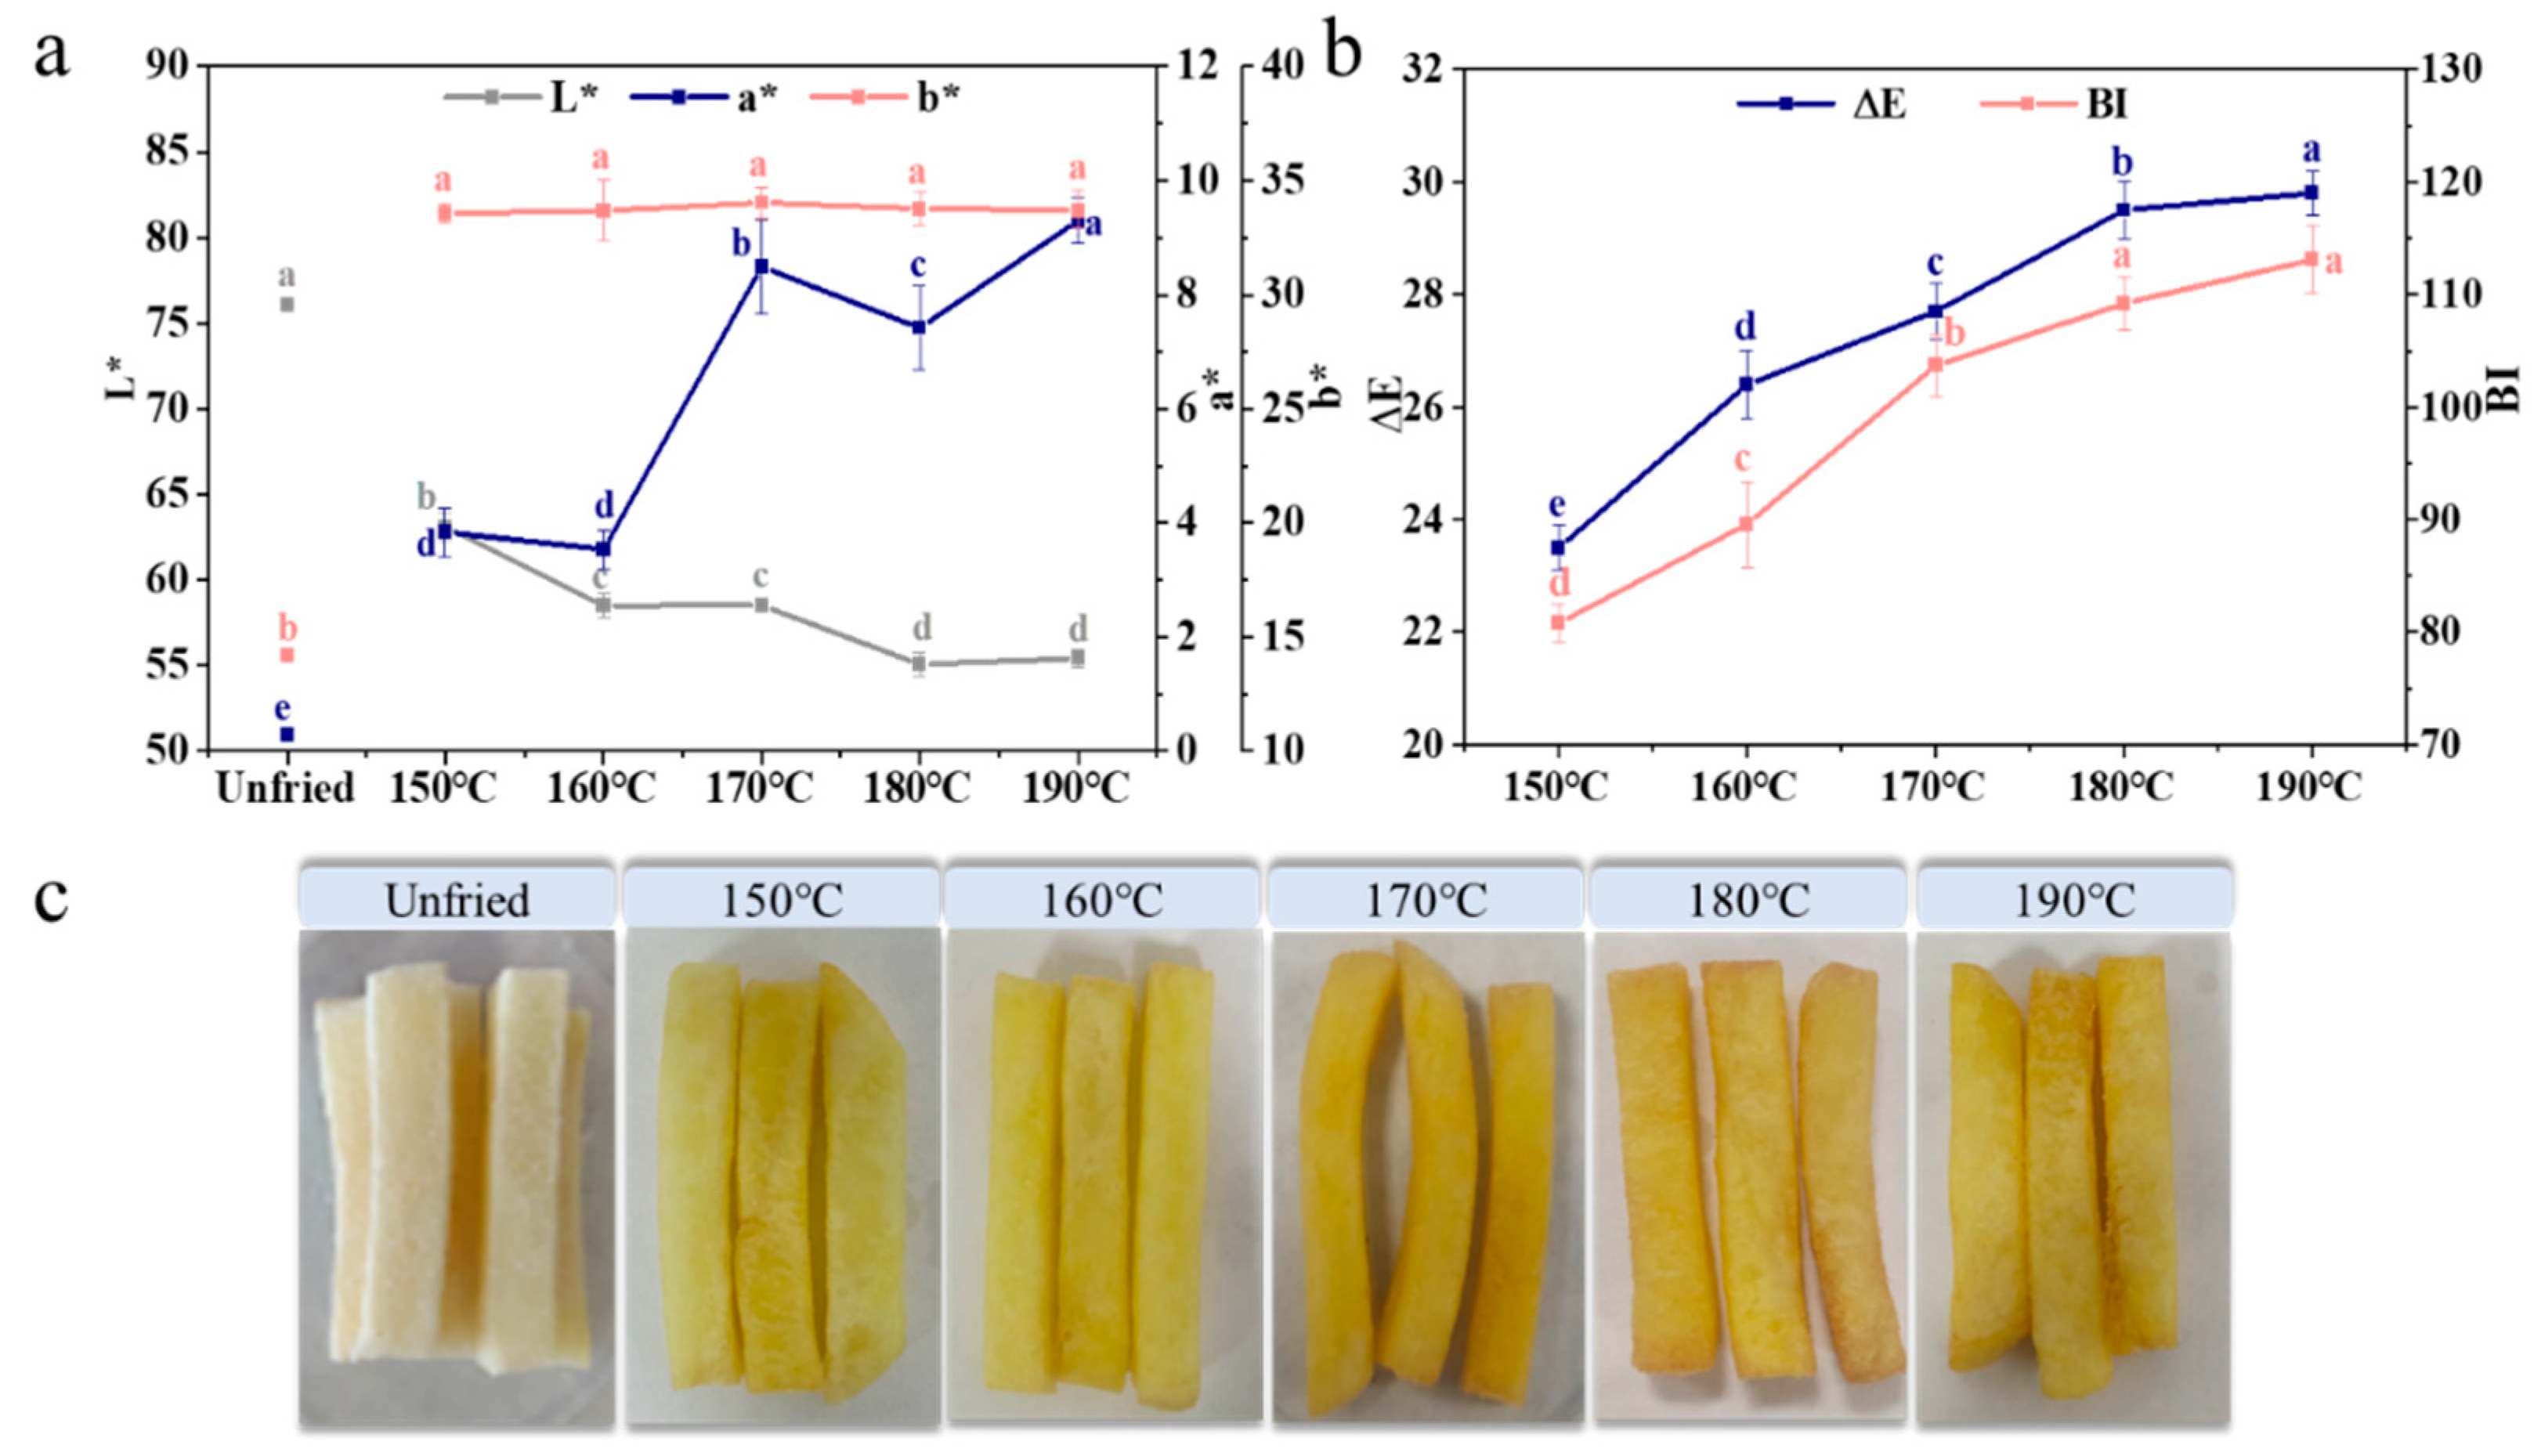
The golden color corresponds to higher L* and b* values and lower a* values, which is an important quality parameter influencing consumers’ choice of French fries [37]. The ΔE values were calculated by Equation (11), which reflected the color difference between unfried potato strips and French fries [7]. The BI values that characterized the degree of browning were calculated by Equation (12) [38].
The changes in the colors of the French fries were reflected by L *, a*, b*, ΔE, BI values, and appearance (Figure 6). With the increasing frying temperature, the L* values of fries showed a trend of decreasing, and the a* values first increased and then decreased. There was no significant difference in the b* values of fries treated with different frying temperatures (p > 0.05). The ΔE and BI values of fries showed an opposite trend with L*. As the ΔE values > 5, the color difference between the fries was visible to the naked eye [39]. The ΔE >5 was observed between the samples at 150 °C and samples fried at 180 and 190 °C, which indicated that the color difference was visible to the naked eye. The color changing from light yellow, golden yellow to deep yellow was observed by the visual appearance of the fries. The decreasing L* and increasing a*, ΔE, and BI values could be explained by the fact that, with the rising frying temperature, the starch gelatinization degree increased [40], which exposed the reducing terminals in the starch, resulting in the increasing Maillard reaction of fries. In addition, the water content of fries played a key role in the changes of the L* values. As the frying temperature increased, the water content of fries decreased (Figure 2), which reduced the light reflection on the fries’ surface [41].
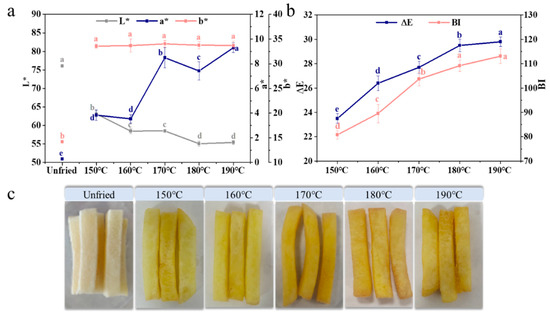
Figure 6.
Effect of frying temperature on the color (a,b) and appearance (c) of French fries. Different letters (a–e) indicate significant differences (p ≤ 0.05).
3.5. Texture
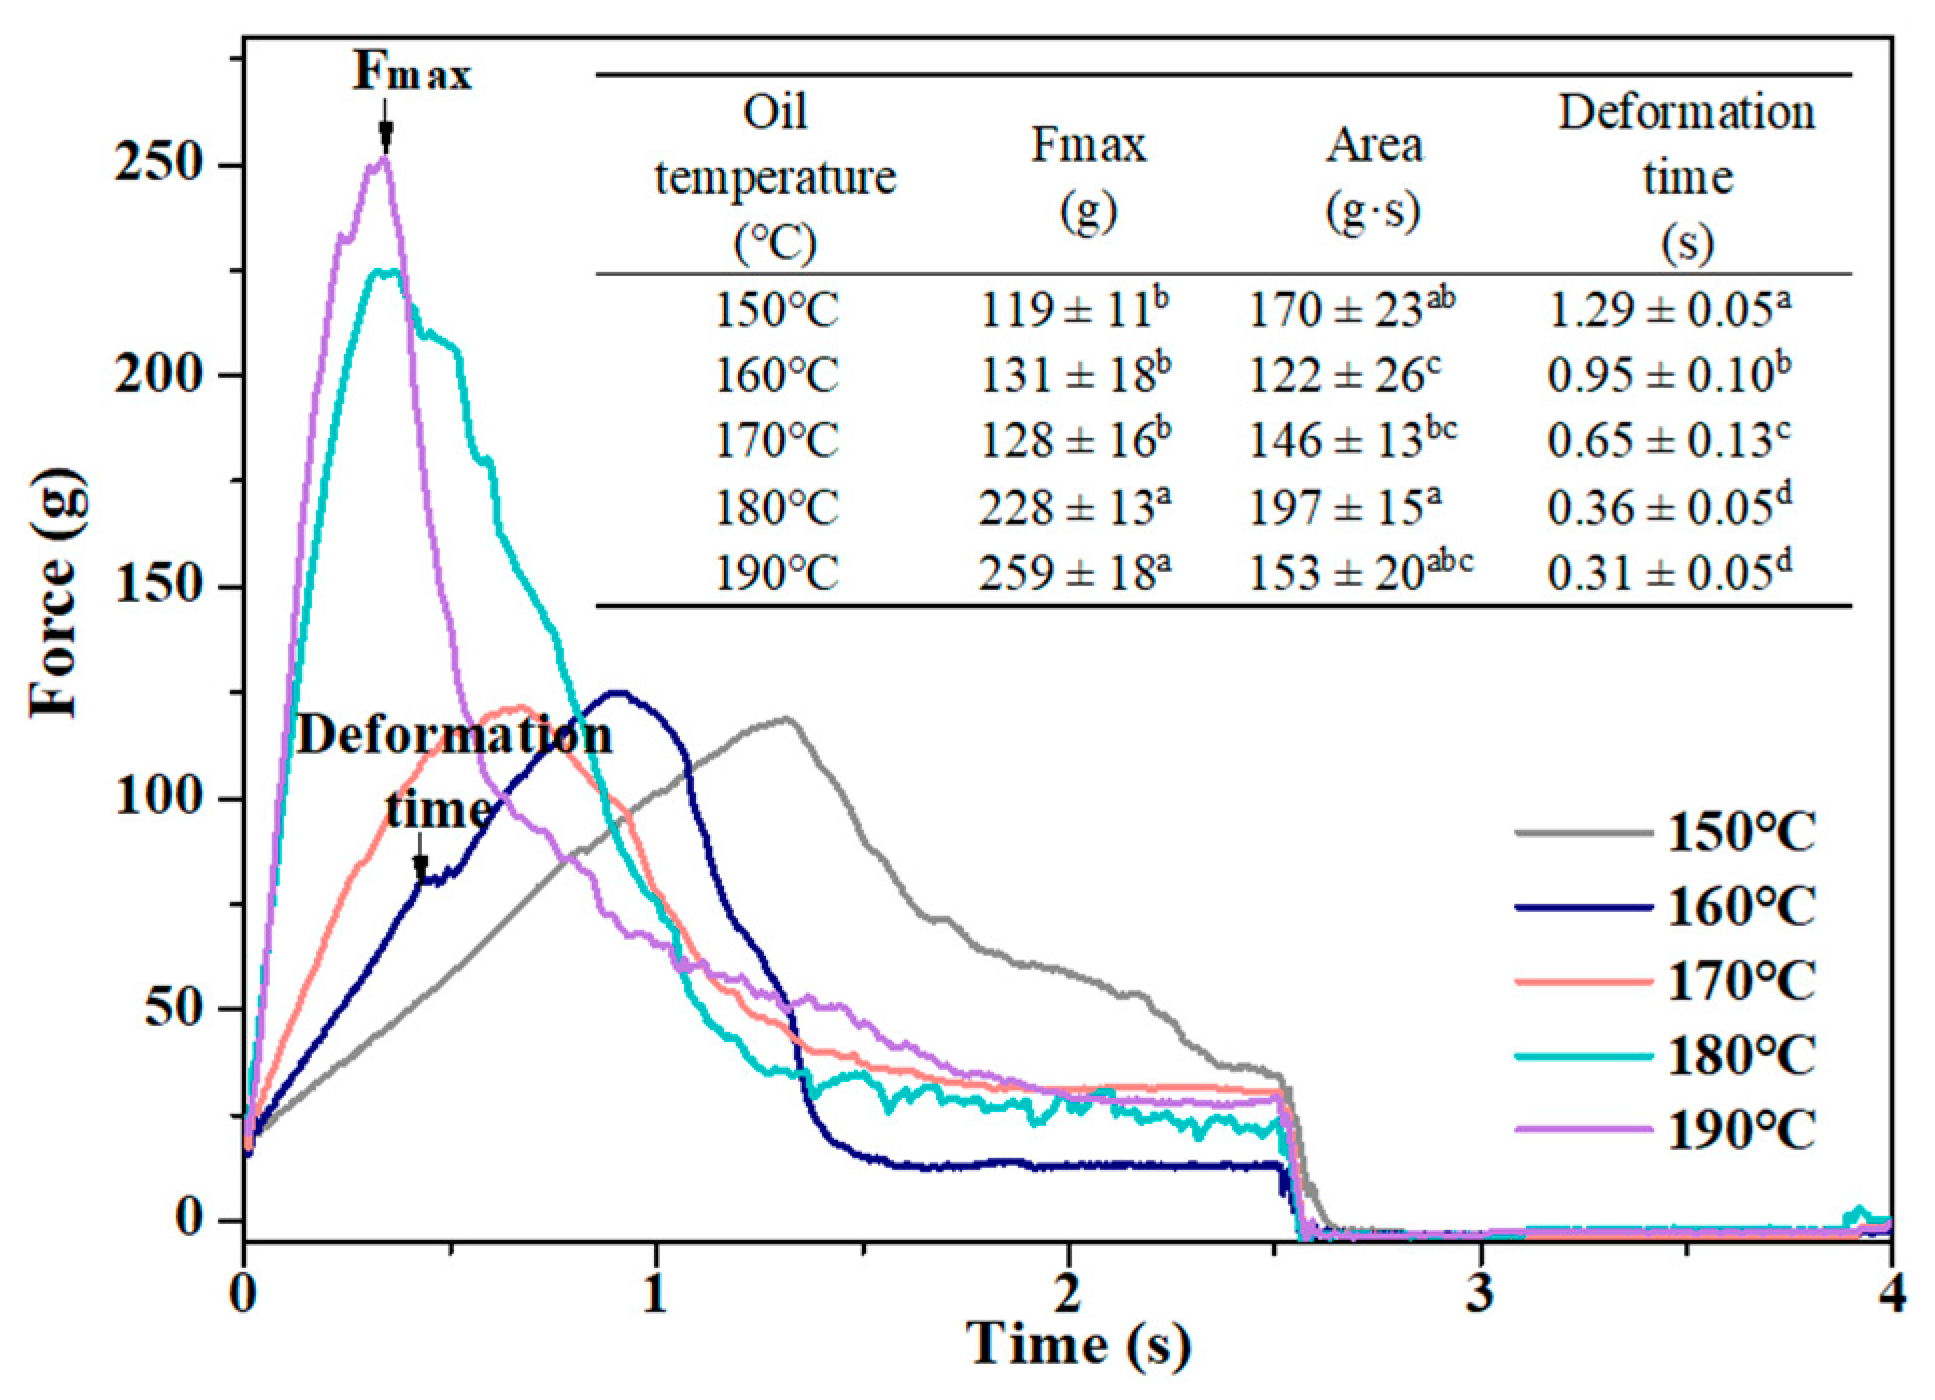
The crispy texture is one of the features of French fries that attracts consumers. The crust hardness, overall hardness, and crispness of fries could be reflected by the Fmax, area, and deformation time values, which were obtained from the force–time curves (Figure 7) [8]. The curves of all samples showed a trend of rising first and then falling, which indicated that the fries had a hard crust and moisture core. With the rising frying temperature, the Fmax of fries increased, and the area values first decreased and then increased. The deformation time exhibited an opposite trend with the Fmax values. The increase in the crust and overall hardness of fries were attributed to the increasing water loss [42] and crust thickness [43]. The water evaporated intensively at high frying temperatures, which promoted the evaporation of the water inward, leading to an increase of crust thickness [43]. Liu, Tian, Hu, Yu, and Fan [44] also reported that, the thicker the crust, the greater Fmax required to puncture. The changes in crispness were closely related to the porous structure of fries [11]. The empty holes and cracks in the fries caused by water vapor escape increased with the increasing frying time, which gave the fries a crispier texture.
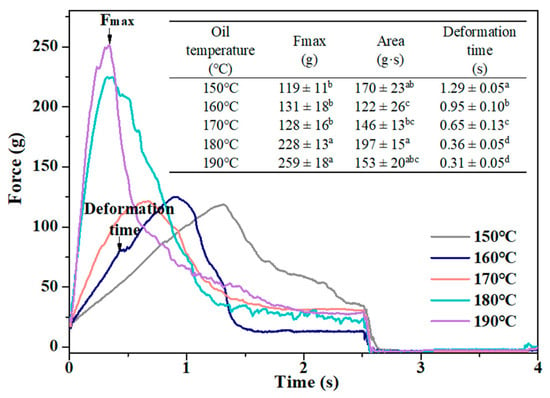
Figure 7.
Effect of frying temperature on the texture of French fries. Different letters (a–d) indicate significant differences (p ≤ 0.05).
3.6. Sensory Evaluation
The sensory evaluation of fries with different frying temperature is shown in Table 1. With increasing temperature, the color and overall acceptability of the fries first significantly increased and then decreased (p ≤ 0.05), and the best scores were obtained at 170 °C. The crispness of the fries increased as the frying temperature increased, and there were significant differences between samples fried at 150 °C and other samples (p ≤ 0.05). There were no significant differences in the aroma and oiliness of all fries (p > 0.05). During frying, a series of complex reactions occurred in the fries, such as water evaporation [45], changes in microstructure [46], starch gelatinization [47], and Maillard reaction [48], which endowed the fries with a golden color and crispy texture. With the increasing temperature, these complex reactions accelerated, resulting in the improvement of color, texture, and overall acceptability scores.

Table 1.
Effect of frying temperature on the sensory evaluation of French fries.
4. Conclusions
With the increase of frying temperature, the heat transferred from the frying medium to fries’ center was hindered. The dynamic changes in water and oil content showed that the water evaporation and oil uptake increased and then reached a plateau, with the frying time prolonged. The modeling of water loss kinetics and oil uptake kinetics of fries during frying was established by the fitting curves. With increasing frying temperatures, the Kw of fries increased, meanwhile the k0 of fries first increased, then decreased, and showed the maximum values at 170 °C. The a*, ΔE, browning degree, and texture improved with increasing frying temperature. The golden color could be observed by the appearance of the samples fried at 170 °C. The sensory evaluation showed that the color, texture, and overall acceptability of samples fried at 170 °C was highest. Therefore, the changes in the quality and oil uptake of fries were owed to the non-enzymic browning and the formation of crust and pores, which was closely correlated with heat transfer and water evaporation. This study provided new insights for the mechanism of oil absorption in fried food and made it possible for the industrial production of low-oil fried foods with excellent quality.
Author Contributions
Methodology, software, validation, formal analysis, investigation, and writing—original draft, Y.L.; methodology, Q.G.; formal analysis, K.W. (Kaili Wang); conceptualization, M.N.; investigation, K.W. (Kairong Wu); investigation, X.W.; supervision, and funding acquisition, X.X. All authors have read and agreed to the published version of the manuscript.
Funding
University Nursing Program for Young Scholars with Creative Talents in Heilongjiang Province (UNPYSCT-2020106).
Institutional Review Board Statement
Not applicable.
Informed Consent Statement
Not applicable.
Data Availability Statement
The data presented in this study are available in the article.
Conflicts of Interest
The authors declare no conflict of interest.
References
- García, M.A.; Ferrero, C.; Bértola, N.; Martino, M.; Zaritzky, N. Edible coatings from cellulose derivatives to reduce oil uptake in fried products. Innov. Food Sci. Emerg. 2002, 3, 391–397. [Google Scholar] [CrossRef]
- Lin, H.T.V.; Hou, P.H.; Sung, W.C. Kinetics of Oil Absorption and Moisture Loss during Deep-Frying of Pork Skin with Different Thickness. Foods 2021, 10, 3029. [Google Scholar] [CrossRef]
- Li, P.; Wu, G.; Yang, D.; Zhang, H.; Qi, X.; Jin, Q.; Wang, X. Analysis of quality and microstructure of freshly potato strips fried with different oils. LWT Food Sci. Technol. 2020, 133, 110038. [Google Scholar] [CrossRef]
- Su, Y.; Zhang, M.; Chitrakar, B.; Zhang, W. Reduction of oil uptake with osmotic dehydration and coating pre-treatment in microwave-assisted vacuum fried potato chips. Food Biosci. 2021, 39, 100825. [Google Scholar] [CrossRef]
- Gouyo, T.; Rondet, É.; Mestres, C.; Hofleitner, C.; Bohuon, P. Microstructure analysis of crust during deep-fat or hot-air frying to understand French fry texture. J. Food Eng. 2021, 298, 110484. [Google Scholar] [CrossRef]
- Sun, Y.; Zhang, M.; Zhang, W.; Adhikari, B.; Yang, Z. Application of novel microwave-assisted vacuum frying to reduce the oil uptake and improve the quality of potato chips. LWT Food Sci. Technol. 2016, 73, 490–497. [Google Scholar] [CrossRef]
- Huang, X.; Zhang, Y.; Karrar, E.; Zhang, H.; Jin, Q.; Wu, G.; Wang, X. Effect of moderate electric field on the quality, microstructure and oil absorption behavior of potato strips during deep-fat frying. J. Food Eng. 2022, 313, 110751. [Google Scholar] [CrossRef]
- Liu, Y.; Tian, J.; Zhang, T.; Fan, L. Effects of frying temperature and pore profile on the oil absorption behavior of fried potato chips. Food Chem. 2021, 345, 128832. [Google Scholar] [CrossRef]
- Dana, D.; Saguy, I.S. Review: Mechanism of oil uptake during deep-fat frying and the surfactant effect-theory and myth. Adv. Colloid Interfac. Sci 2006, 128, 267–272. [Google Scholar] [CrossRef]
- Yu, L.; Li, J.W.; Ding, S.D.; Hang, F.; Fan, L. Effect of guar gum with glycerol coating on the properties and oil absorption of fried potato chips. Food Hydrocoll. 2016, 54, 211–219. [Google Scholar] [CrossRef]
- Li, Y.; Li, Z.; Guo, Q.; Kong, B.; Liu, Q.; Xia, X. Inhibitory effect of chitosan coating on oil absorption in French fries based on starch structure and morphology stability. Int. J. Biol. Macromol. 2022, 219, 1297–1307. [Google Scholar] [CrossRef]
- Contardo, I.; Parada, J.; Leiva, A.; Bouchon, P. The effect of vacuum frying on starch gelatinization and its in vitro digestibility in starch–gluten matrices. Food Chem. 2016, 197, 353–358. [Google Scholar] [CrossRef]
- Song, Y.; Ding, Z.; Peng, Y.; Wang, J.; Zhang, T.; Yu, Y.; Wang, Y. Acrylamide formation and aroma evaluation of fried pepper sauce under different exogenous Maillard reaction conditions. Food Chem. X 2022, 15, 100413. [Google Scholar] [CrossRef]
- Li, H.; Kong, B.; Liu, Q.; Chen, Q.; Sun, F.; Liu, H.; Xia, X. Ultrasound pretreatment for improving the quality and protein digestibility of stir-frying chicken gizzards. Food Res. Int. 2022, 161, 111782. [Google Scholar] [CrossRef]
- Farinu, A.; Baik, O.D. Heat transfer coefficients during deep fat frying of sweet potato: Effects of product size and oil temperature. Food Res. Int. 2007, 40, 989–994. [Google Scholar] [CrossRef]
- AOAC. Official Methods of Analysis, 17th ed.; Association of Official Analytical Chemists: Arlington, TX, USA, 2000. [Google Scholar]
- Su, Y.; Zhang, M.; Chitrakar, B.; Zhang, W. Effects of low-frequency ultrasonic pre-treatment in water/oil medium simulated system on the improved processing efficiency and quality of microwave-assisted vacuum fried potato chips. Ultrason. Sonochem. 2020, 63, 104958. [Google Scholar] [CrossRef]
- Oladejo, A.O.; Ma, H.; Qu, W.; Zhou, C.; Wu, B.; Yang, X.; Onwude, D. Effects of ultrasound pretreatments on the kinetics of moisture loss and oil uptake during deep fat frying of sweet potato (Ipomea batatas). Innov. Food Sci. Emerg. Technol. 2017, 43, 7–17. Available online: https://www.sciencedirect.com/science/article/pii/S1466856417304599 (accessed on 3 September 2022). [CrossRef]
- He, Y.; Xie, Z.; Xu, Y.; Zhao, X.; Zhao, L.; Yang, H. Preservative effect of slightly acid electrolysed water ice generated by the developed sanitising unit on shrimp (Penaeus vannamei). Food Control. 2022, 136, 108876. [Google Scholar] [CrossRef]
- Zhang, Y.; Zhang, D.; Huang, Y.; Chen, L.; Bao, P.; Fang, H.; Zhou, C. L-arginine and L-lysine degrade troponin-T, and L-arginine dissociates actomyosin: Their roles in improving the tenderness of chicken breast. Food Chem. 2020, 318, 126516. [Google Scholar] [CrossRef]
- Li, P.; Sun, L.; Wang, J.; Wang, Y.; Zou, Y.; Yan, Z.; Zhang, M.; Wang, D.; Xu, W. Effects of combined ultrasound and low-temperature short-time heating pretreatment on proteases inactivation and textural quality of meat of yellow-feathered chickens. Food Chem. 2021, 355, 129645. [Google Scholar] [CrossRef]
- Pan, N.; Dong, C.; Du, X.; Kong, B.; Sun, J.; Xia, X. Effect of freeze-thaw cycles on the quality of quick-frozen pork patty with different fat content by consumer assessment and instrument-based detection. Meat Sci. 2021, 172, 108313. [Google Scholar] [CrossRef]
- EI-Samad, L.; Hassan, M.; Bakr, N.; EI-Ashram, S.; Radwan, E.; Aziz, K.; Hussein, K.H.; Wakil, A. Insights into Ag-NPs-mediated pathophysiology and ultrastructural aberrations in ovarian tissues of darkling beetles. Sci. Rep. 2022, 12, 13899. [Google Scholar] [CrossRef]
- Yıldız, A.; Palazoğlu, T.K.; Erdoğdu, F. Determination of heat and mass transfer parameters during frying of potato slices. J. Food Eng. 2006, 79, 11–17. [Google Scholar] [CrossRef]
- Liberty, J.T.; Dehghannya, J.; Ngadi, M.O. Effective strategies for reduction of oil content in deep-fat fried foods: A review. Trends Food Sci. Technol. 2019, 92, 172–183. [Google Scholar] [CrossRef]
- Sahasrabudhe, S.N.; Chaudhari, S.S.; Farkas, B.E. Experimental measurement of factors affecting dynamics of bubble growth from a submerged orifice: Applications to the frying process. J. Food Eng. 2019, 251, 36–44. [Google Scholar] [CrossRef]
- Viné, T.; Flick, D.; Bernuau, E.; Broyart, B. Experimental and numerical study of heat and mass transfer during contact heating of sliced potatoes. J. Food Eng. 2020, 275, 109868. [Google Scholar] [CrossRef]
- Su, Y.; Zhang, M.; Bhandari, B.; Zhang, W. Enhancement of water removing and the quality of fried purple-fleshed sweet potato in the vacuum frying by combined power ultrasound and microwave technology. Ultrason. Sonochem. 2018, 44, 368–379. [Google Scholar] [CrossRef]
- Zhang, Y.; Zhang, T.; Fan, D.; Li, J.; Fan, L. The description of oil absorption behavior of potato chips during the frying. LWT Food Sci. Technol. 2018, 96, 119–126. [Google Scholar] [CrossRef]
- Sahin, S.; Sastry, S.K.; Bayindirli, L. Heat Transfer During Frying of Potato Slices. LWT Food Sci. Technol. 1999, 32, 19–24. [Google Scholar] [CrossRef]
- Li, P.; Wu, G.; Yang, D.; Zhang, H.; Qi, X.; Jin, Q.; Wang, X. Effect of multistage process on the quality, water and oil distribution and microstructure of French fries. Food Res. Int. 2020, 137, 109229. [Google Scholar] [CrossRef]
- Yang, D.; Wu, G.; Li, P.; Zhang, H.; Qi, X. Comparative analysis of the oil absorption behavior and microstructural changes of fresh and pre-frozen potato strips during frying via MRl, SEM, and XRD. Food Res. Int. 2019, 122, 295–302. [Google Scholar] [CrossRef] [PubMed]
- Dehghannya, J.; Ngadi, M. Recent advances in microstructure characterization of fried foods: Different frying techniques and process modeling. Trends Food Sci. Technol. 2021, 116, 786–801. [Google Scholar] [CrossRef]
- Yang, D.; Zhu, L.; Wu, G.; Li, X.; Li, P.; Zhang, H.; Liu, T. Whether the degradation of frying oil affects oil absorption: Tracking fresh and degraded oil in fried potato strips during frying and cooling and microstructure characterization. Food Bioprod. Process. 2022, 133, 87–99. [Google Scholar] [CrossRef]
- Devi, S.; Zhang, M.; Ju, R.; Bhandari, B. Water loss and partitioning of the oil fraction of mushroom chips using ultrasound-assisted vacuum frying. Food Biosci. 2020, 38, 100753. [Google Scholar] [CrossRef]
- Van, K.K.N.; Somsen, D.; Boom, R.M.; Schutyser, M.A.I. Modelling water evaporation during frying with an evaporation dependent heat transfer coefficient. J. Food Eng. 2017, 197, 60–67. [Google Scholar] [CrossRef]
- Pathare, P.B.; Opara, U.L.; Al-Said, F.A. Colour measurement and analysis in fresh and processed foods: A review. Food Bioprocess. Technol. 2013, 6, 36–60. [Google Scholar] [CrossRef]
- Bouaziz, F.; Koubaa, M.; Neifar, M.; Zouari, S.; Besbes, S.; Chaari, F.; Kamoun, A.; Chaabouni, M.; Chaabouni, S.E.; Ghorbel, R.E. Feasibility of using almond gum as coating agent to improve the quality of fried potato chips: Evaluation of sensorial properties. LWT Food Sci. Technol. 2016, 65, 800–807. [Google Scholar] [CrossRef]
- Zhao, M.; Nuerjiang, M.; Bai, X.; Feng, J.; Kong, B.; Sun, F.; Li, Y.; Xia, X. Monitoring dynamic changes in chicken freshness at 4 °C and 25 °C using pH-sensitive intelligent films based on sodium alginate and purple sweet potato peel extracts. Int. J. Biol. Macromol. 2022, 216, 361–373. [Google Scholar] [CrossRef]
- Liu, X.; Huang, S.; Chao, C.; Yu, J.; Copeland, L.; Wang, S. Changes of starch during thermal processing of foods: Current status and future directions. Trends Food Sci. Technol. 2022, 119, 320–337. [Google Scholar] [CrossRef]
- Wang, B.; Li, H.; Huang, Z.; Kong, B.; Liu, Q.; Wang, H.; Xu, M.; Xia, X. Dynamic changes in the qualities and heterocyclic aromatic amines of roasted pork induced by frying temperature and time. Meat Sci. 2021, 176, 108457. [Google Scholar] [CrossRef]
- Bai, X.; Shi, S.; Kong, B.; Chen, Q.; Liu, Q.; Li, Z.; Wu, K.; Xia, X. Analysis of the influencing mechanism of the freeze–thawing cycles on in vitro chicken meat digestion based on protein structural changes. Food Chem 2023, 399, 134020. [Google Scholar] [CrossRef] [PubMed]
- Altamirano-Fortoul, R.; Hernando, I.; Rosell, C.M. Texture of bread crust: Puncturing settings effect and its relationship to microstructure. J. Texture Stud. 2013, 44, 85–94. [Google Scholar] [CrossRef]
- Liu, Y.; Tian, J.; Hu, B.; Yu, P.; Fan, L. Relationship between crust characteristics and oil uptake of potato strips with hot-air pre-drying during frying process. Food Chem. 2021, 360, 130045. [Google Scholar] [CrossRef]
- Liu, Y.; Tian, J.; Duan, Z.; Li, J.; Fan, L. Effect of oil surface activity on oil absorption behavior of potato strips during frying process. Food Chem. 2021, 365, 130427. [Google Scholar] [CrossRef]
- Zhang, J.; Xie, T.; Fan, L. Improving the quality and reducing oil absorption of fried potato chips by ultrasound pretreatment. LWT Food Sci. Technol. 2021, 148, 111763. [Google Scholar] [CrossRef]
- Chen, L.; Ma, R.; Zhang, Z.; McClements, D.J.; Qiu, L.; Jin, Z.; Tian, Y. Impact of frying conditions on hierarchical structures and oil absorption of normal maize starch. Food Hydrocoll. 2019, 97, 105231. [Google Scholar] [CrossRef]
- Mousa, R.M.A. Simultaneous inhibition of acrylamide and oil uptake in deep fat fried potato strips using gum Arabic-based coating incorporated with antioxidants extracted from spices. Food Hydrocoll. 2018, 83, 265–274. [Google Scholar] [CrossRef]
Publisher’s Note: MDPI stays neutral with regard to jurisdictional claims in published maps and institutional affiliations. |
© 2022 by the authors. Licensee MDPI, Basel, Switzerland. This article is an open access article distributed under the terms and conditions of the Creative Commons Attribution (CC BY) license (https://creativecommons.org/licenses/by/4.0/).

