Olive Fruit Selection through AI Algorithms and RGB Imaging

 , , ,
, , ,  , , ,
, , ,  ,
,  and
and 
Abstract

1. Introduction
2. Materials and Methods
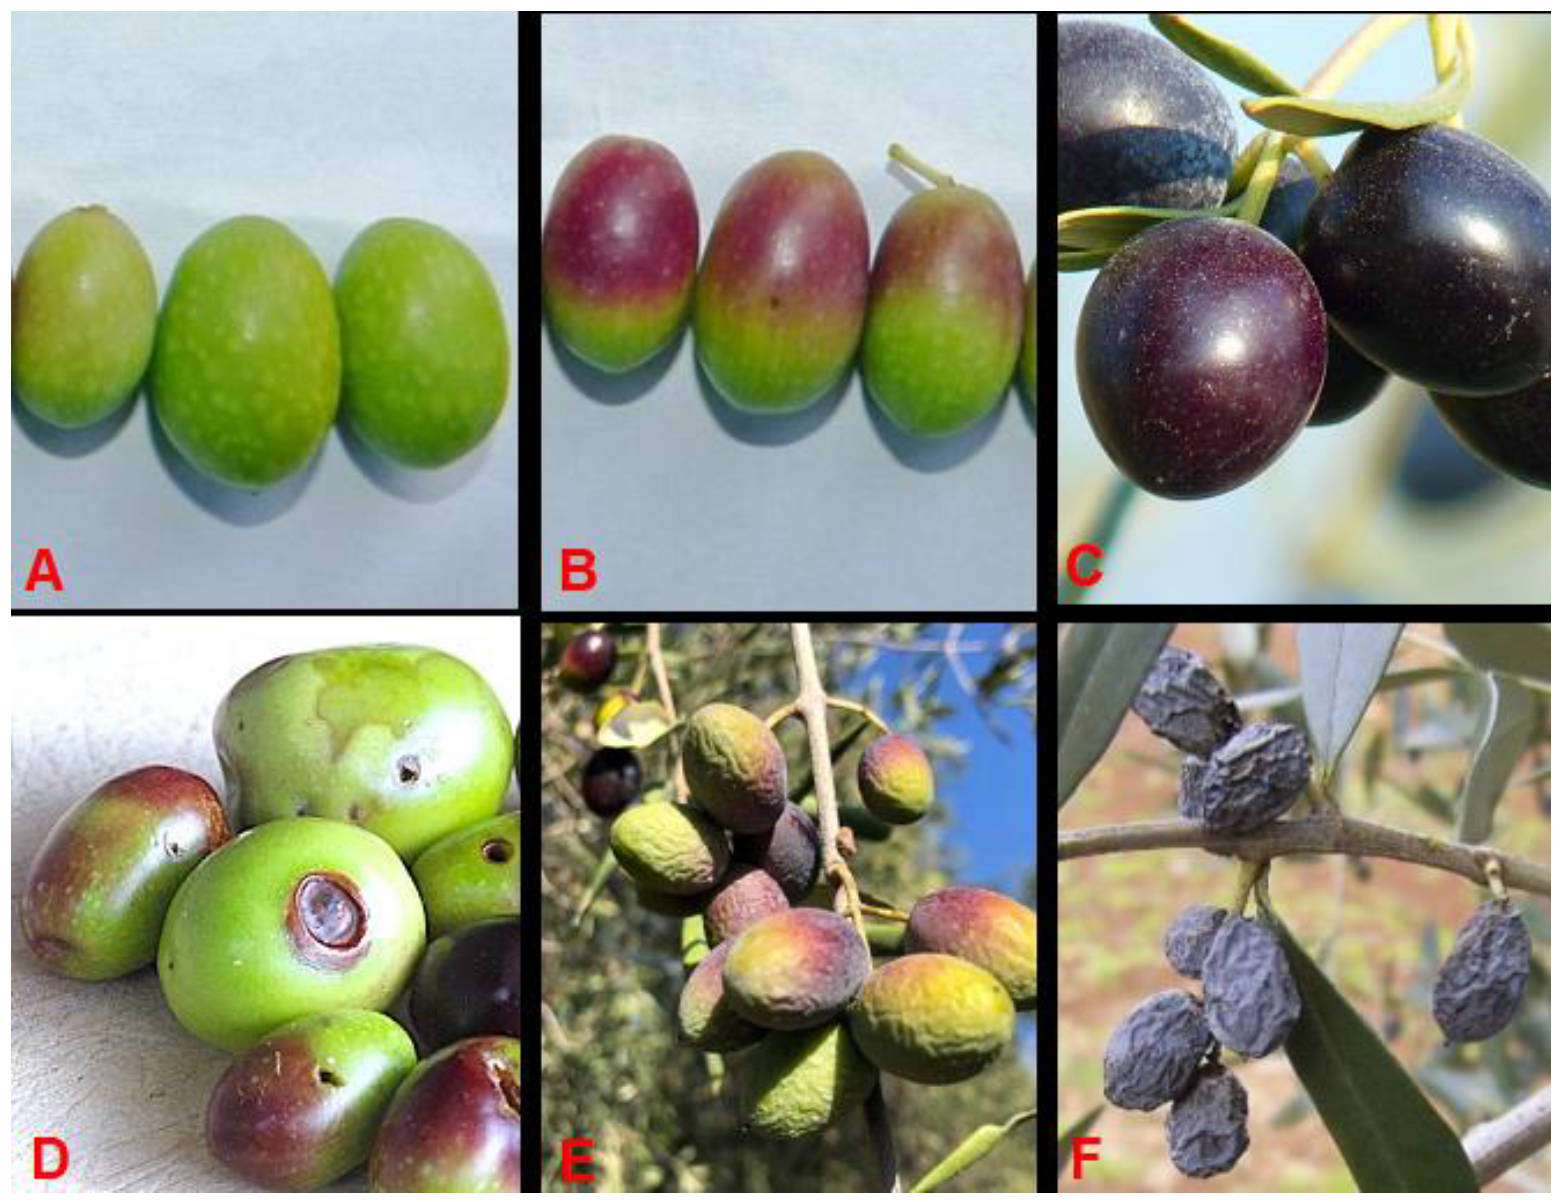
2.1. Olive Data
2.2. Expert Olive Evaluation
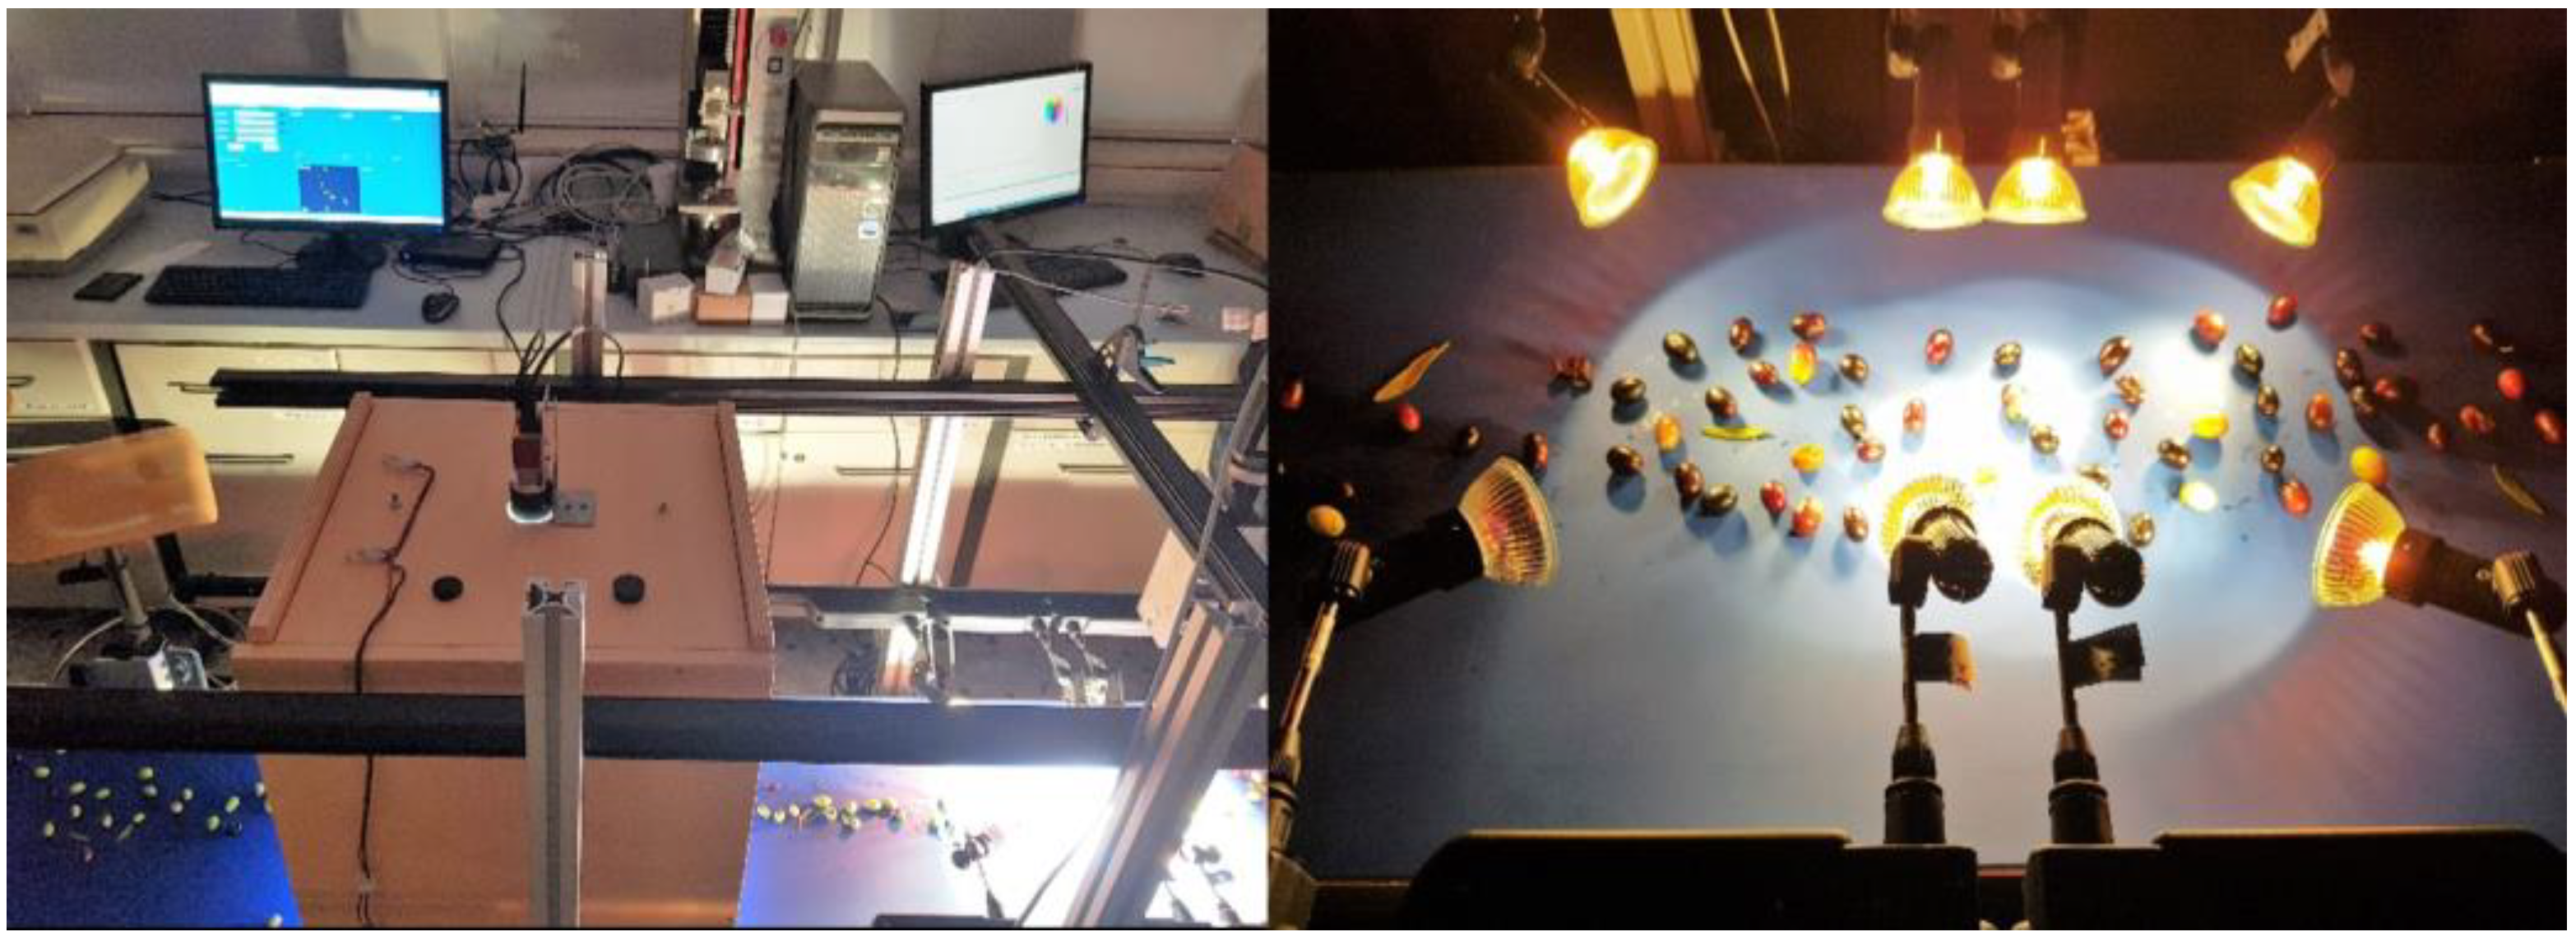
2.3. Conveyor Belt Prototype
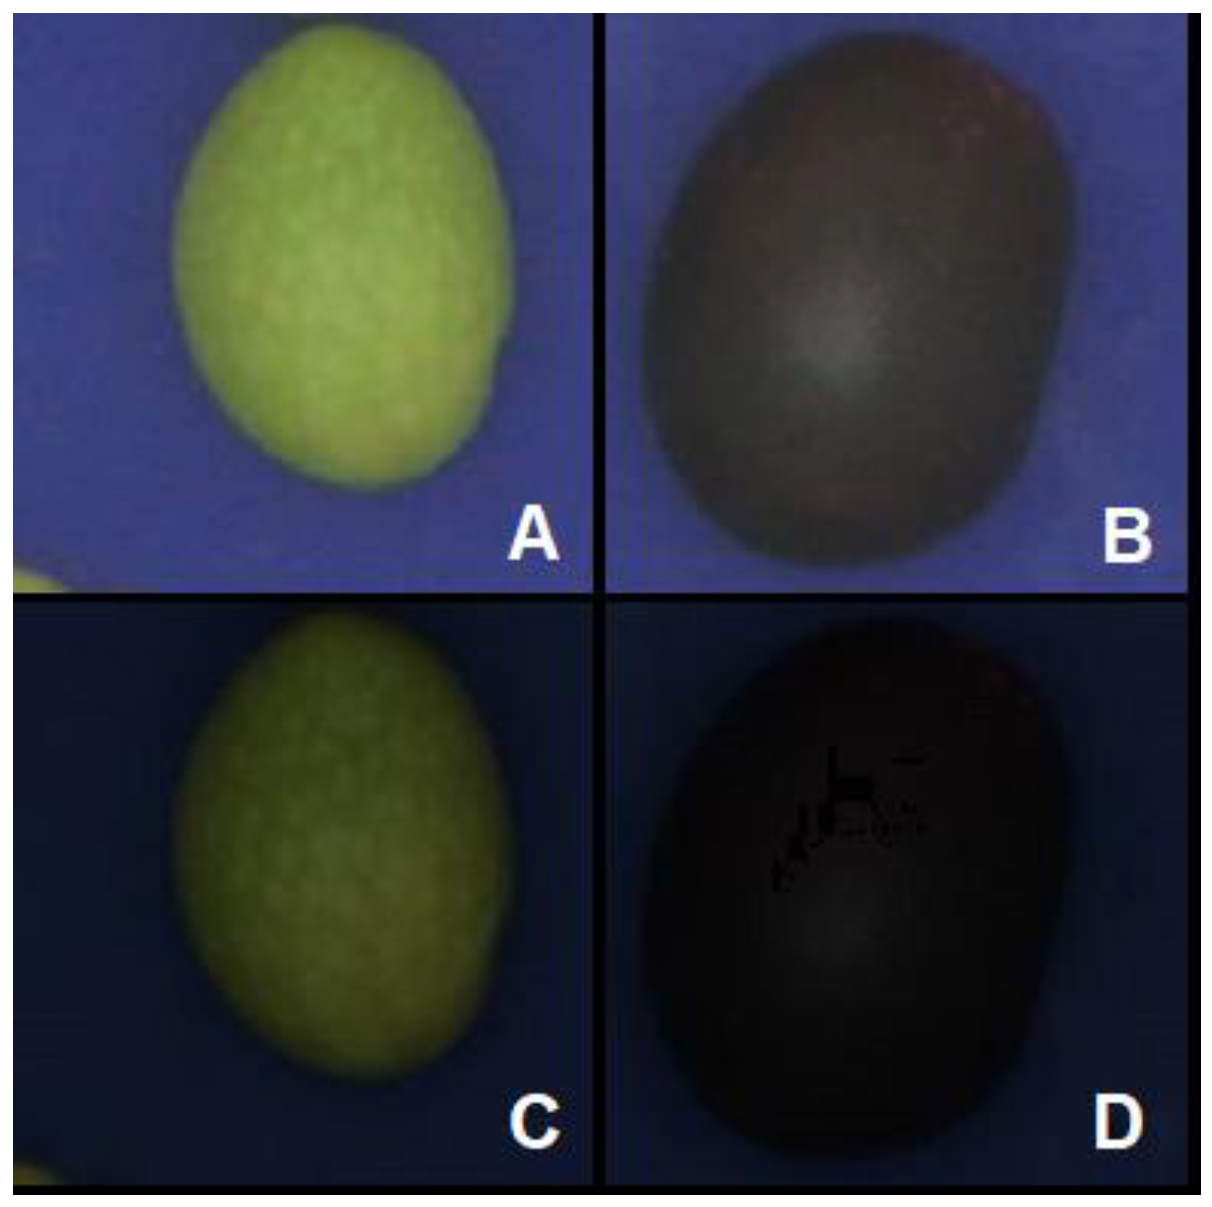
2.4. Artificial Intelligence (AI) and Conventional Neural Network (CNN)
2.5. Algorithm Implementation and Industrial Sorting
3. Results
4. Discussion
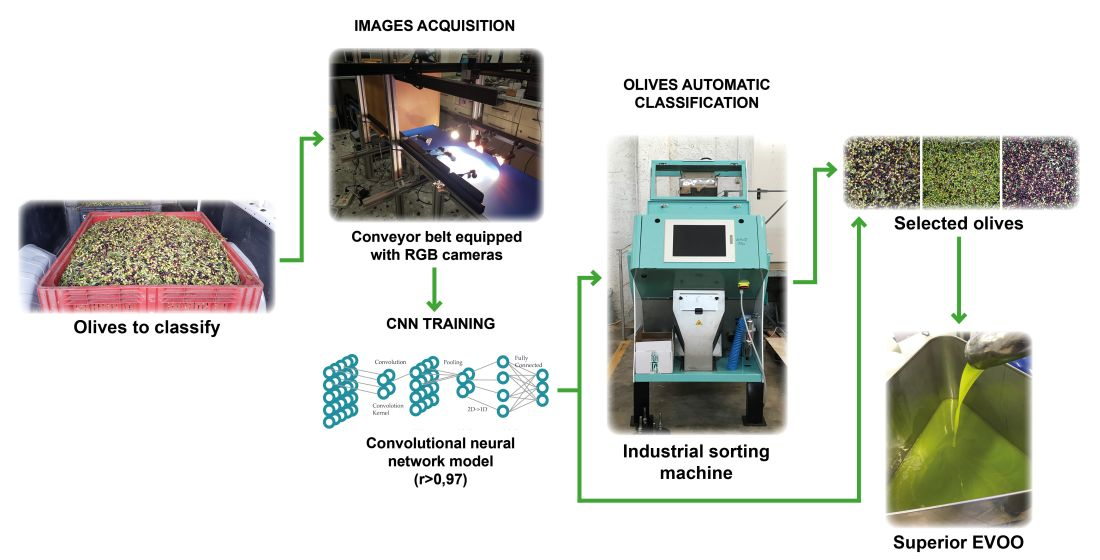
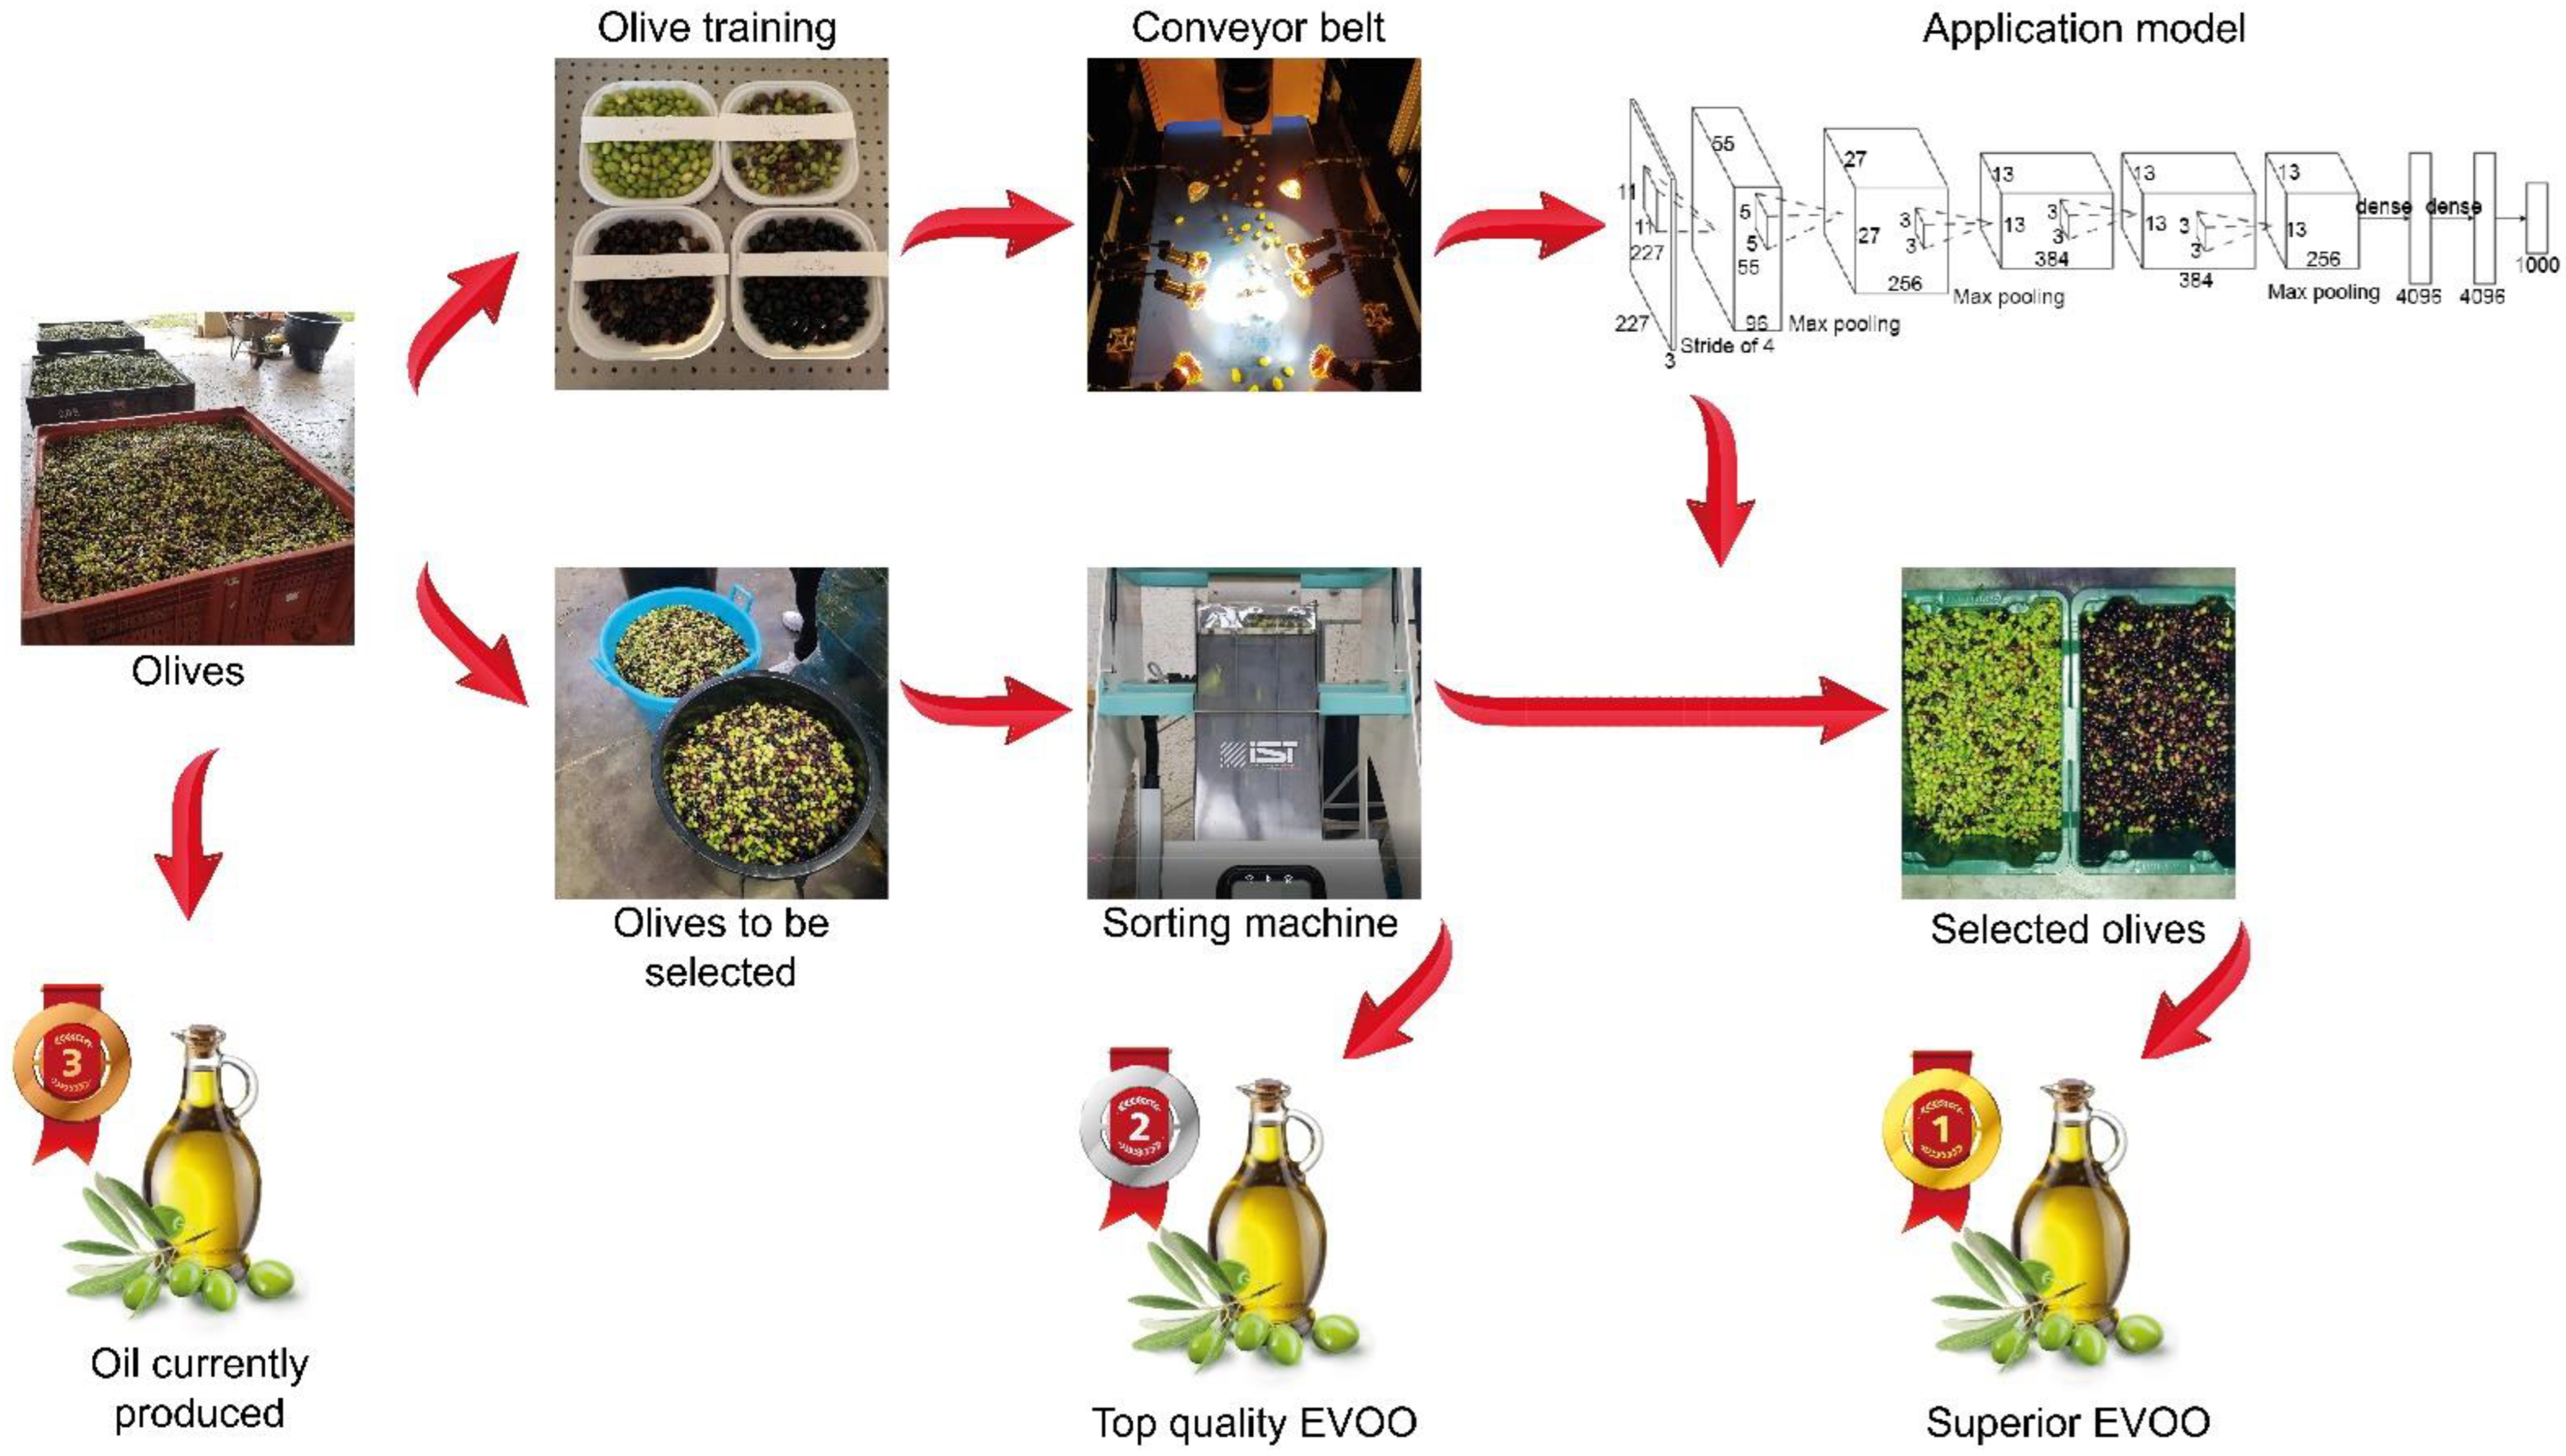
- Superior EVOO (“Top green” olives only) using 17% of total olives;
- High quality oil obtained by green olives (only “Top green” and “Good green” olives) using 40% of the total olives;
- High quality oil (produced by only “Top green,” “good green” and “good black” olives) using 72% of the total olives.
5. Conclusions
Author Contributions
Funding
Institutional Review Board Statement
Informed Consent Statement
Data Availability Statement
Conflicts of Interest
References
- Violino, S.; Ortenzi, L.; Antonucci, F.; Pallottino, F.; Benincasa, C.; Figorilli, S.; Costa, C. An artificial intelligence approach for Italian EVOO origin traceability through an open source IoT spectrometer. Foods 2020, 9, 834. [Google Scholar] [CrossRef] [PubMed]
- Ferronato, M. Il Mercato Dell’olio di Oliva made in Italy tra Vulnerabilità ed Eccellenza; Università Ca’ Foscari Venezia: Venice, Italy, 2016. [Google Scholar]
- Dag, A.; Kerem, Z.; Yogev, N.; Zipori, I.; Lavee, S.; Ben-David, E. Influence of time of harvest and maturity index on olive oil yield and quality. Sci. Hortic. 2011, 127, 358–366. [Google Scholar] [CrossRef]
- Rotondi, A.; Morrone, L.; Bertazza, G.; Neri, L. Effect of Duration of Olive Storage on Chemical and Sensory Quality of Extra Virgin Olive Oils. Foods 2021, 10, 2296. [Google Scholar] [CrossRef] [PubMed]
- Abbas, H.M.T.; Shakoor, U.; Khan, M.J.; Ahmed, M.; Khurshid, K. Automated sorting and grading of agricultural products based on image processing. In Proceedings of the 2019 8th International Conference on Information and Communication Technologies (ICICT), Karachi, Pakistan, 16–17 November 2019; pp. 78–81. [Google Scholar] [CrossRef]
- García, M.; Candelo-Becerra, J.E.; Hoyos, F.E. Quality and defect inspection of green coffee beans using a computer vision system. Appl. Sci. 2019, 9, 4195. [Google Scholar] [CrossRef]
- Haff, R.P.; Pearson, T. Spectral band selection for optical sorting of pistachio nut defects. Trans ASABE 2006, 49, 1105–1113. [Google Scholar] [CrossRef][Green Version]
- Babanatis-Merce, R.M.; Babanatsas, T.; Glavan, D.O.; Mircea, R.; Glavan, A.I.; Bucevschi, A.; Gaspar, M.C. Programming optical sensors to increase performance of olive sorting system. Acta Tech. Napocensis. Ser. Appl. Math. Mech. Eng. 2021, 64, 103–106. [Google Scholar]
- Ortenzi, L.; Figorilli, S.; Costa, C.; Pallottino, F.; Violino, S.; Pagano, M.; Imperi, G.; Manganiello, R.; Lanza, B.; Antonucci, F. A Machine Vision Rapid Method to Determine the Ripeness Degree of Olive Lots. Sensors 2021, 21, 2940. [Google Scholar] [CrossRef]
- Ghazanfari, A.; Irudayaraj, J.; Kusalik, A.; Romaniuk, M. Machine vision grading of pistachio nuts using Fourier descriptors. J. Agric. Eng. Res. 1997, 68, 247–252. [Google Scholar] [CrossRef]
- Ben Ayed, R.; Hanana, M. Artificial intelligence to improve the food and agriculture sector. J. Food Qual. 2021, 2021, 5584754. [Google Scholar] [CrossRef]
- Chen, C.; Chen, Q.; Do, M.N.; Koltun, V. Seeing motion in the dark. In Proceedings of the IEEE/CVF International Conference on Computer Vision (ICCV), Seoul, Korea, 27 October–2 November 2019; pp. 3185–3194. [Google Scholar] [CrossRef]
- Aquino, A.; Ponce, J.M.; Andújar, J.M. Identification of olive fruit, in intensive olive orchards, by means of its morphological structure using convolutional neural networks. Comput. Electron. Agric. 2020, 176, 105616. [Google Scholar] [CrossRef]
- Khosravi, H.; Saedi, S.I.; Rezaei, M. Real-time recognition of on-branch olive ripening stages by a deep convolutional neural network. Sci. Hortic. 2021, 287, 110252. [Google Scholar] [CrossRef]
- Furferi, R.; Governi, L.; Volpe, Y. ANN-based method for olive Ripening Index automatic prediction. J. Food Eng. 2010, 101, 318–328. [Google Scholar] [CrossRef]
- Puerto, D.A.; Martínez Gila, D.M.; Gámez García, J.; Gómez Ortega, J. Sorting Olive Batches for the Milling Process Using Image Processing. Sensors 2015, 15, 15738–15754. [Google Scholar] [CrossRef] [PubMed]
- Benos, L.; Tagarakis, A.C.; Dolias, G.; Berruto, R.; Kateris, D.; Bochtis, D. Machine learning in agriculture: A comprehensive updated review. Sensors 2021, 21, 3758. [Google Scholar] [CrossRef] [PubMed]
- Wang, X.; Bouzembrak, Y.; Lansink, A.O.; van der Fels-Klerx, H.J. Application of machine learning to the monitoring andprediction of food safety: A review. Compr. Rev. Food Sci. Food Saf. 2022, 21, 416–434. [Google Scholar] [CrossRef]
- Helfer, G.A.; Barbosa, J.L.V.; Hermes, E.; Fagundes, B.J.; Santos, R.O.; da Costa, A.B. The application of parallel processing in the selection of spectral variables in beer quality control. Food Chem. 2022, 367, 130681. [Google Scholar] [CrossRef]
- Aguilera, M.P.; Beltrán, G.; Ortega, D.; Fernández, A.; Jiménez, A.; Uceda, M. Characterisation of virgin olive oil of Italian olive cultivars:Frantoio’andLeccino’, grown in Andalusia. Food Chem. 2005, 89, 387–391. [Google Scholar] [CrossRef]
- Oleificio Zucchi. Oli da Olive Italiane: EVO Sabina DOP, L’aromaticita e La Dolcezza. Available online: https://www.zucchi.com/magazine/dal-campo-al-piatto/oli-olive-italiane-evo-sabina-dop-laromaticita-la-dolcezza/ (accessed on 18 October 2022).
- Jabeur, H.; Zribi, A.; Abdelhedi, R.; Bouaziz, M. Effect of olive storage conditions on Chemlali olive oil quality and the effective role of fatty acids alkyl esters in checking olive oils authenticity. Food Chem. 2015, 169, 289–296. [Google Scholar] [CrossRef]
- Antonucci, F.; Figorilli, S.; Costa, C.; Pallottino, F.; Spanu, A.; Menesatti, P. An Open Source Conveyor Belt Prototype for Image Analysis-Based Rice Yield Determination. Food Bioprocess. Technol. 2017, 10, 1257–1264. [Google Scholar] [CrossRef]
- Pallottino, F.; Menesatti, P.; Antonucci, F.; Figorilli, S.; Proto, A.R.; Costa, C. Image analysis based open source conveyor belt prototype for wood pellet and chip quality assessment. Contemp. Eng. Sci. 2016, 9, 1105–1112. [Google Scholar] [CrossRef]
- Salvucci, G.; Pallottino, F.; De Laurentiis, L.; Del Frate, F.; Manganiello, R.; Tocci, F.; Vasta, S.; Figorilli, S.; Bassotti, B.; Violino, S.; et al. Fast olive quality assessment through RGB images and advanced convolutional neural network modeling. Eur. Food Res. Technol. 2022, 248, 1395–1405. [Google Scholar] [CrossRef]
- Bookstein, F.L. Principal warps: Thin-plate splines and the decomposition of deformations. IEEE Trans. Pattern Anal. Mach. Intell. 1989, 11, 567–585. [Google Scholar] [CrossRef]
- Menesatti, P.; Angelini, C.; Pallottino, F.; Antonucci, F.; Aguzzi, J.; Costa, C. RGB color calibration for quantitative image analysis: The “3D Thin-Plate Spline” warping approach. Sensors 2012, 12, 7063–7079. [Google Scholar] [CrossRef] [PubMed]
- Ossadtchi, G. Simple Warping Routine. Available online: http://www.mathworks.com/matlabcentral/fileexchange/1203-simple-warping-routine (accessed on 18 October 2022).
- Violino, S.; Moscovini, L.; Costa, C.; Del Re, P.; Giansante, L.; Toscano, P.; Tocci, F.; Vasta, S.; Manganiello, R.; Ortenzi, L.; et al. Superior EVOO quality production: An RGB sorting machine for olive classification. Foods 2022, 11, 2917. [Google Scholar] [CrossRef]
- Guzmán, E.; Baeten, V.; Pierna, J.A.F.; García-Mesa, J.A. Determination of the olive maturity index of intact fruits using image analysis. J. Food Sci. Technol. 2015, 52, 1462–1470. [Google Scholar] [CrossRef]
- Hussain Hassan, N.M.; Nashat, A.A. New effective techniques for automatic detection and classification of external olive fruits defects based on image processing techniques. Multidim. Syst. Sign. Process 2019, 30, 571–589. [Google Scholar] [CrossRef]
- Ponce, J.M.; Aquino, A.; Milan, B.; Andújar, J.M. Automatic Counting and Individual Size and Mass Estimation of Olive-Fruits Through Computer Vision Techniques. IEEE Access 2019, 7, 59451–59465. [Google Scholar] [CrossRef]
- Aguilera Puerto, D.; Cáceres Moreno, Ó.; Martínez Gila, D.M.; Gómez Ortega, J.; Gámez García, J. Online system for the identification and classification of olive fruits for the olive oil production process. J. Food Meas. Charact. 2019, 13, 716–727. [Google Scholar] [CrossRef]
- Ponce, J.M.; Aquino, A.; Milan, B.; Andújar, J.M. Olive-Fruit Variety Classification by Means of Image Processing and Convolutional Neural Networks. IEEE Access 2019, 7, 147629–147641. [Google Scholar] [CrossRef]


| Olive Classes | Bad Black | Good Black | Bad Green | Good Green | Top Green |
|---|---|---|---|---|---|
| N. Samples | 114 | 113 | 80 | 112 | 138 |
| Optimizer | (SGDM) |
|---|---|
| Mini batch size | 10 |
| Maximum epochs | 10 |
| Initial learning | 10−4 |
| Validation frequency | 6 |
| Olive Classes | Weight (Slow Speed) | Weight (Fast Speed) |
|---|---|---|
| Green | 946 kg | 433 kg |
| Black | 854 kg | 723 kg |
| Total | 1800 kg | 1156 kg |
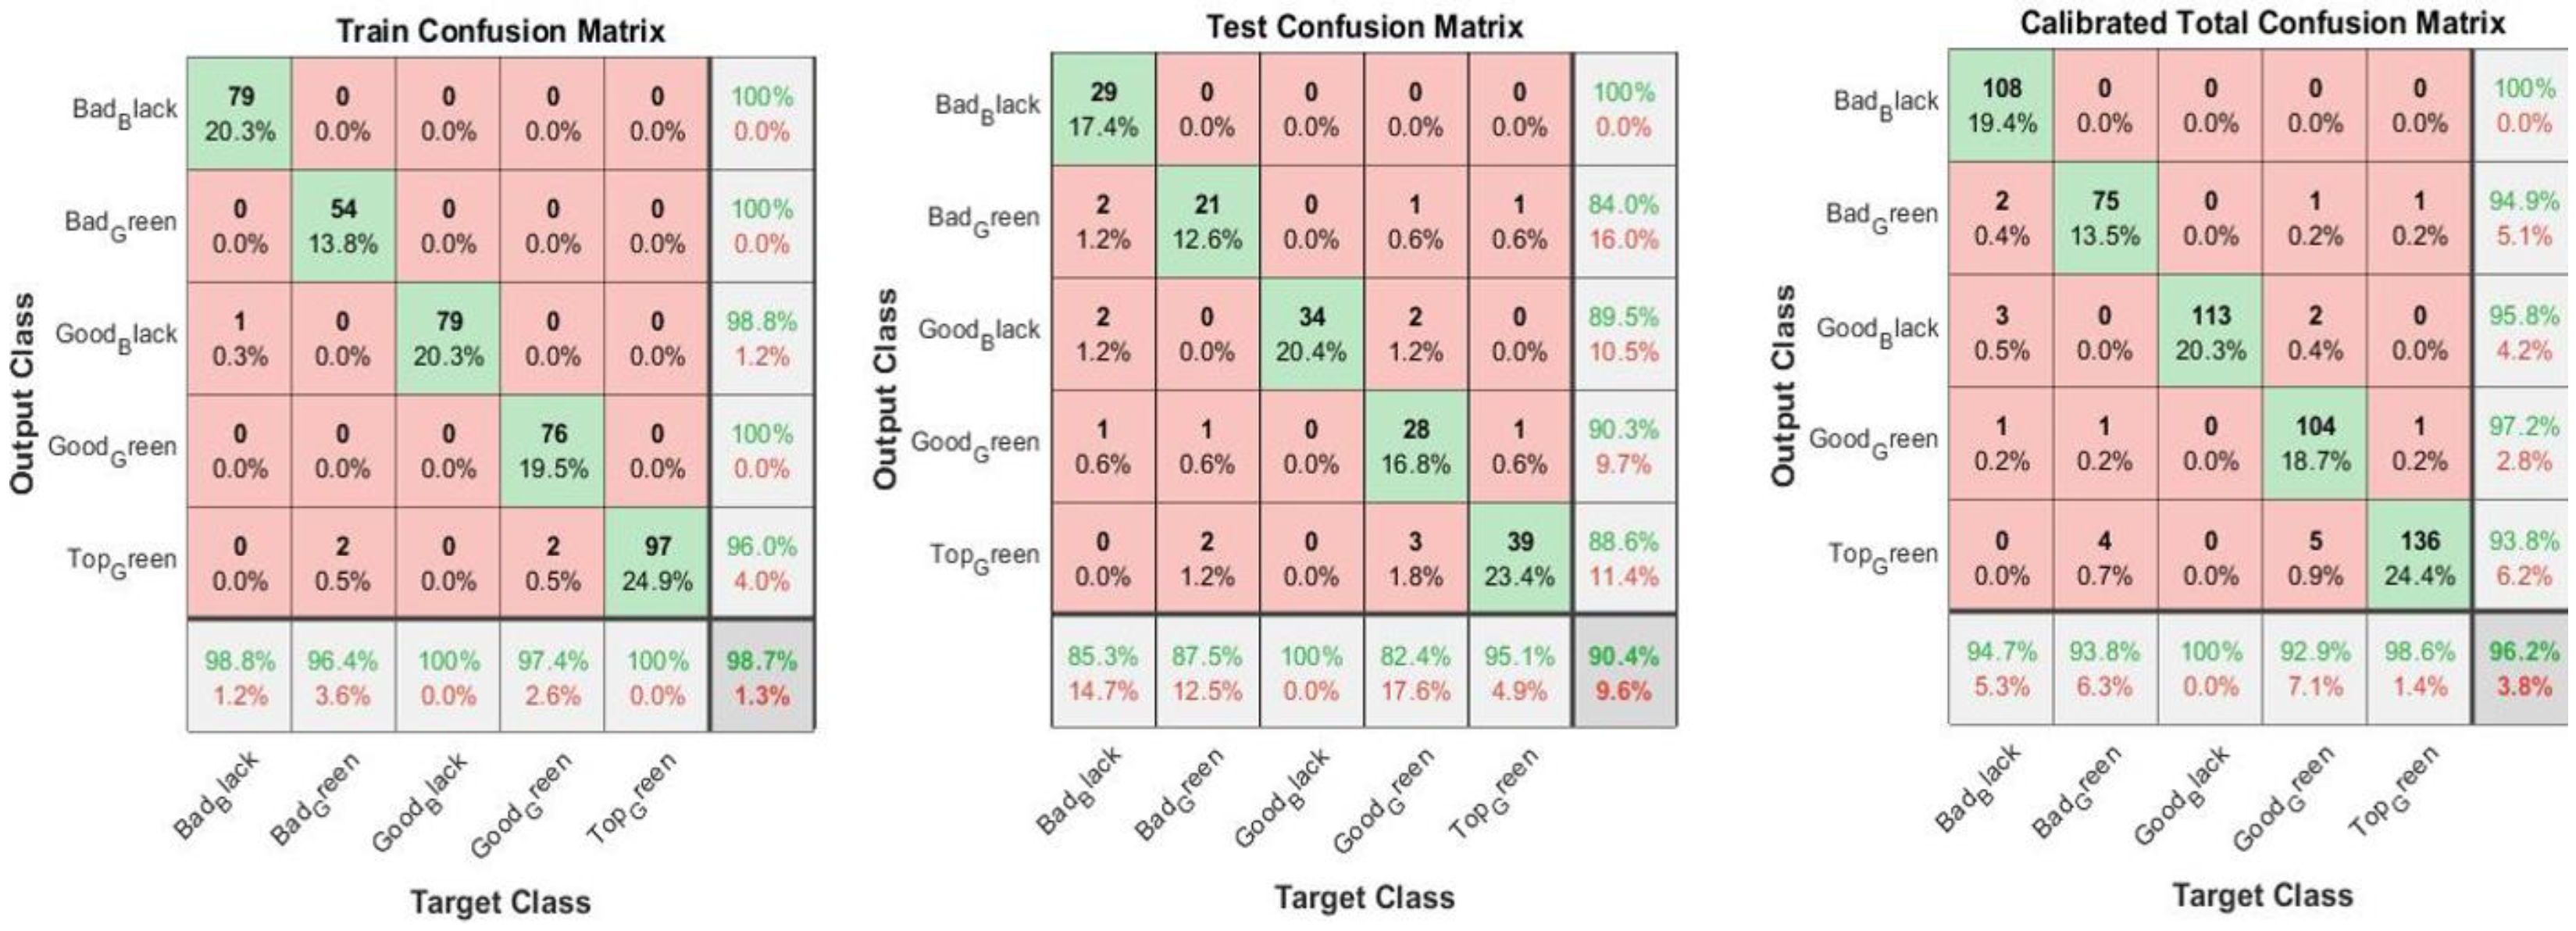
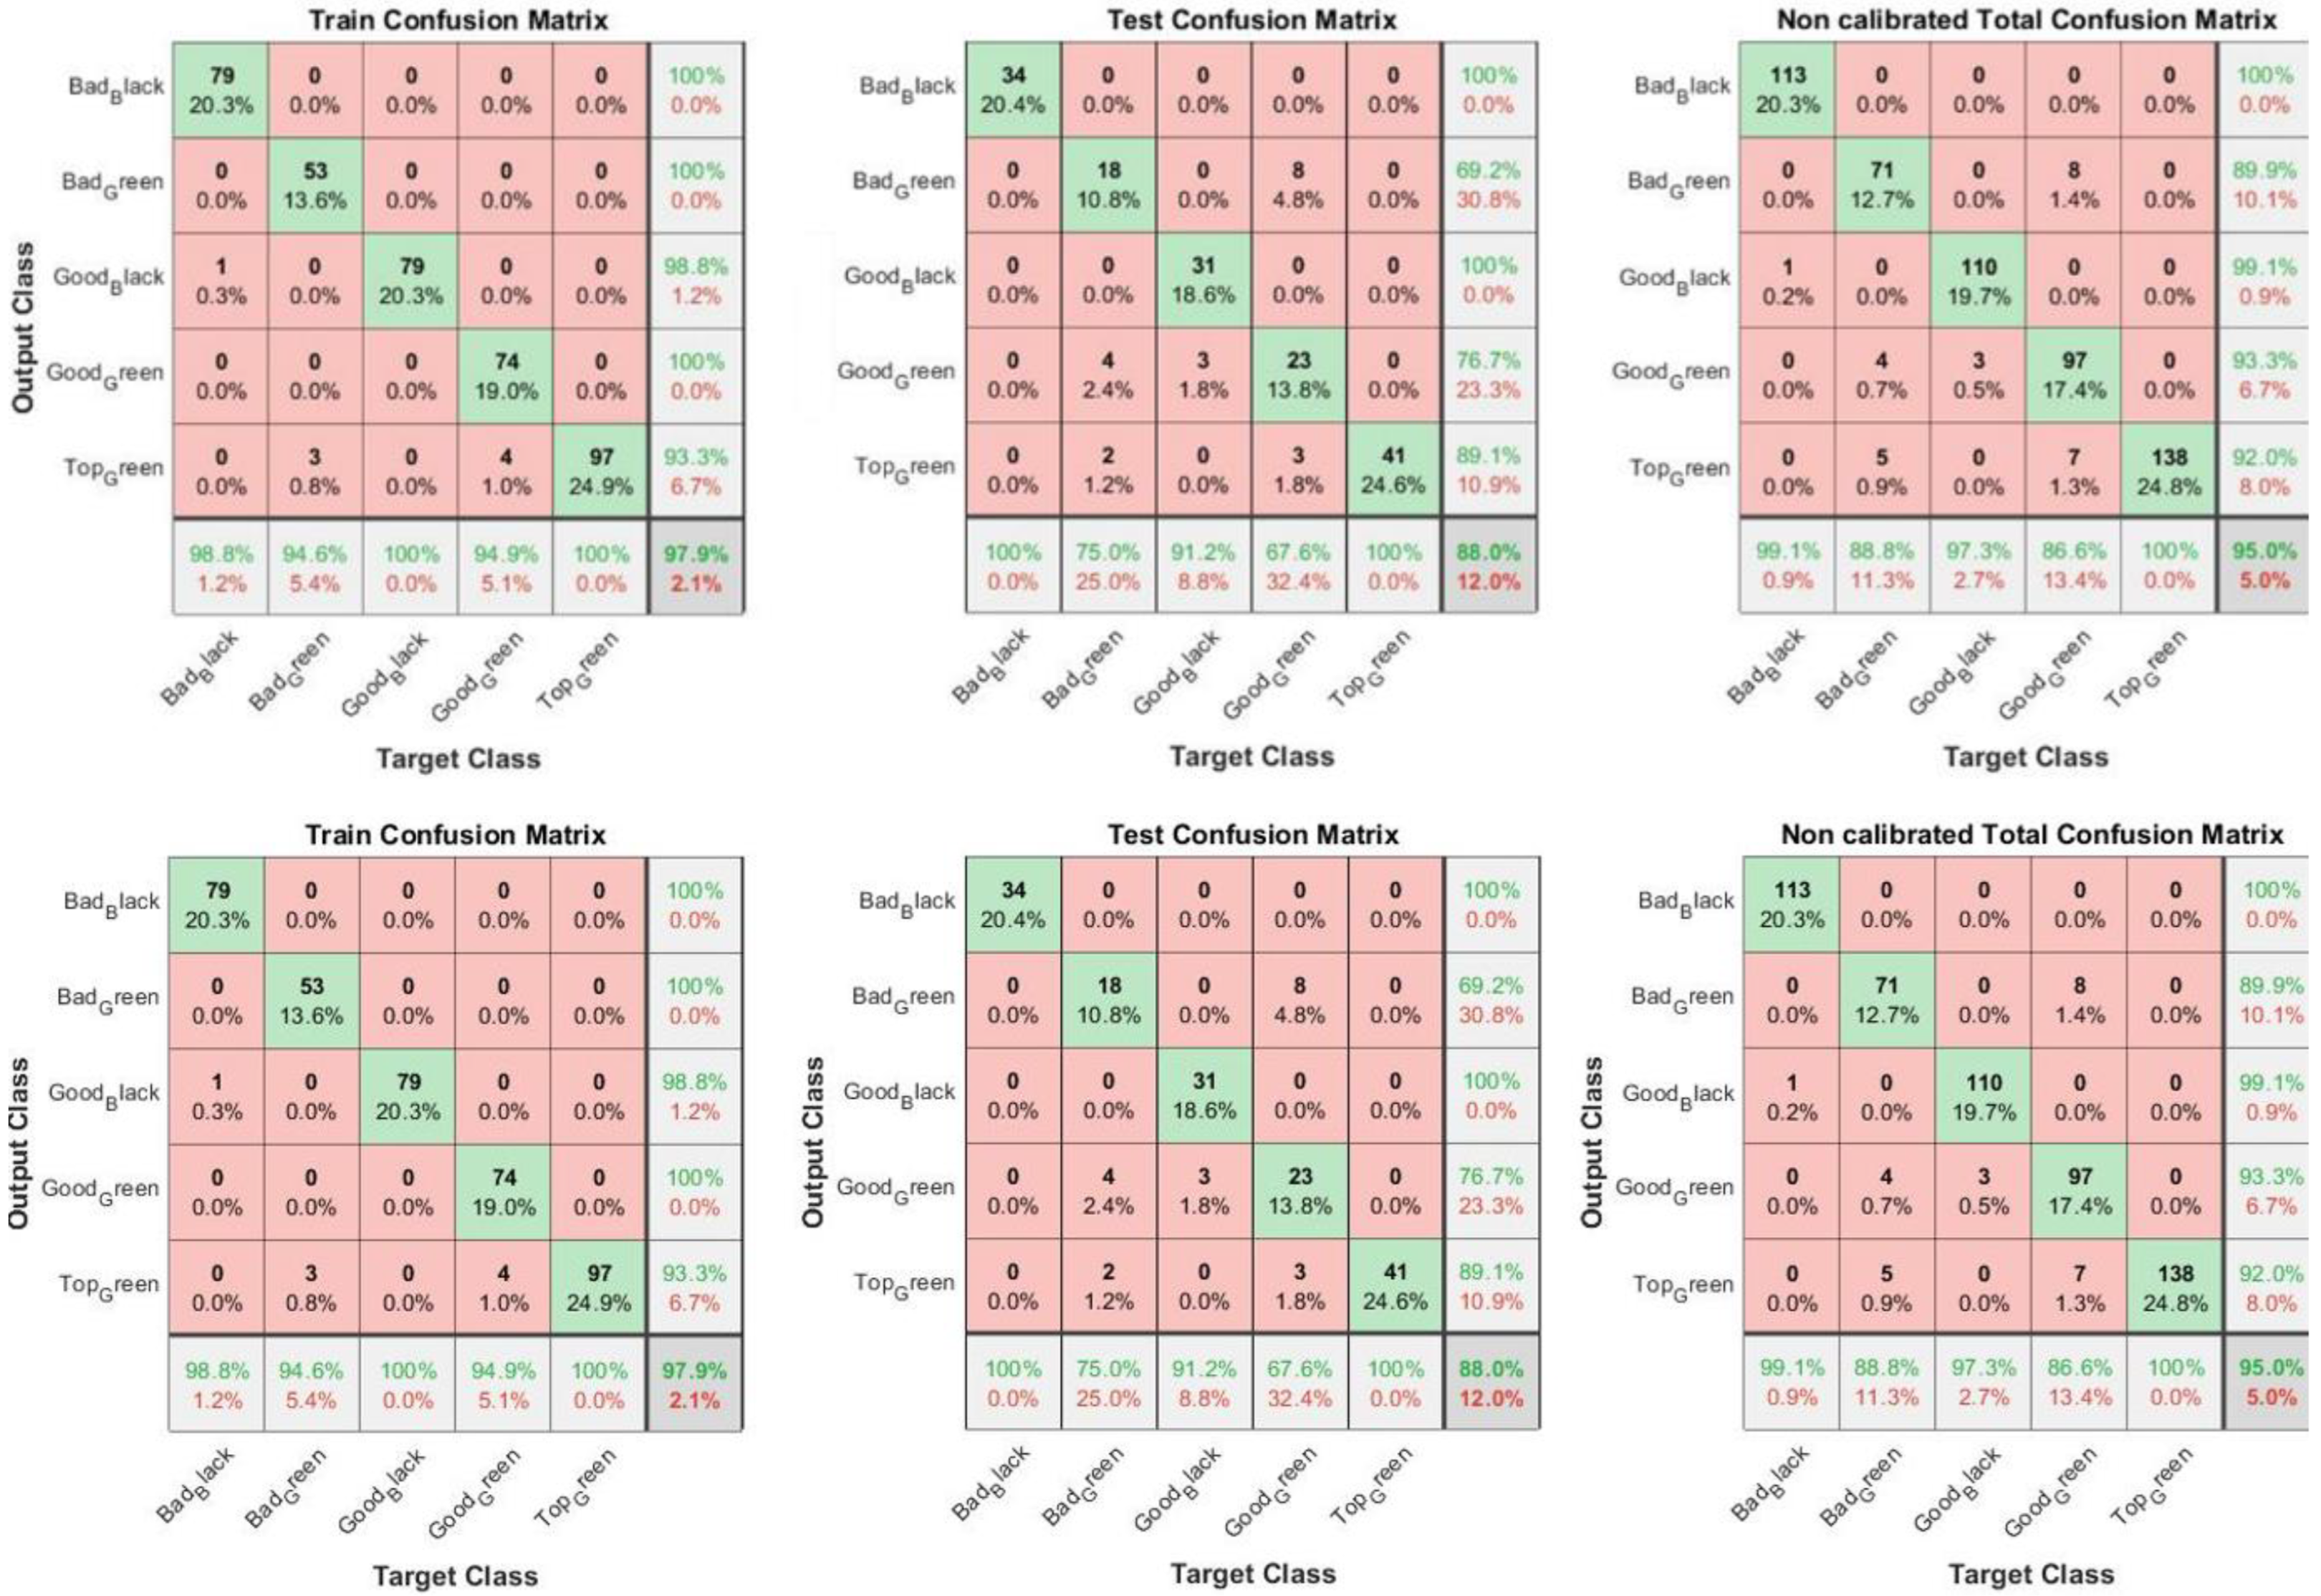
| CNN Descriptors | Calibrated Values | Non-Calibrated Values |
|---|---|---|
| Number of samples | 557 | 557 |
| Number of convolutional layers | 8 | 8 |
| Training time | 26″40′ | 23″35′ |
| % Training set | 70 | 70 |
| r Training | 98.7 | 97.9 |
| r Test | 90.4 | 88.0 |
| Calibrated Olive Images | Bad Black | Bad Green | Good Black | Good Green | Top Green | Total |
|---|---|---|---|---|---|---|
| Black slow | 187 | 81 | 531 | 281 | 21 | 1101 |
| Green slow | 28 | 266 | 63 | 132 | 283 | 772 |
| Black fast | 60 | 36 | 262 | 127 | 10 | 495 |
| Green fast | 10 | 89 | 25 | 67 | 153 | 344 |
| Percentages | 10.5 | 17.4 | 32.5 | 22.4 | 17.2 | 100.0 |
| Non-Calibrated Olive Images | Bad Black | Bad Green | Good Black | Good Green | Top Green | Total |
|---|---|---|---|---|---|---|
| Black slow | 392 | 80 | 333 | 269 | 27 | 1101 |
| Green slow | 44 | 221 | 48 | 130 | 329 | 772 |
| Black fast | 88 | 54 | 228 | 115 | 9 | 495 |
| Green fast | 12 | 83 | 25 | 51 | 173 | 344 |
| Percentages | 19.7 | 16.1 | 23.4 | 20.9 | 19.9 | 100.0 |
Publisher’s Note: MDPI stays neutral with regard to jurisdictional claims in published maps and institutional affiliations. |
© 2022 by the authors. Licensee MDPI, Basel, Switzerland. This article is an open access article distributed under the terms and conditions of the Creative Commons Attribution (CC BY) license (https://creativecommons.org/licenses/by/4.0/).
Share and Cite
Figorilli, S.; Violino, S.; Moscovini, L.; Ortenzi, L.; Salvucci, G.; Vasta, S.; Tocci, F.; Costa, C.; Toscano, P.; Pallottino, F. Olive Fruit Selection through AI Algorithms and RGB Imaging. Foods 2022, 11, 3391. https://doi.org/10.3390/foods11213391
Figorilli S, Violino S, Moscovini L, Ortenzi L, Salvucci G, Vasta S, Tocci F, Costa C, Toscano P, Pallottino F. Olive Fruit Selection through AI Algorithms and RGB Imaging. Foods. 2022; 11(21):3391. https://doi.org/10.3390/foods11213391
Chicago/Turabian StyleFigorilli, Simone, Simona Violino, Lavinia Moscovini, Luciano Ortenzi, Giorgia Salvucci, Simone Vasta, Francesco Tocci, Corrado Costa, Pietro Toscano, and Federico Pallottino. 2022. "Olive Fruit Selection through AI Algorithms and RGB Imaging" Foods 11, no. 21: 3391. https://doi.org/10.3390/foods11213391
APA StyleFigorilli, S., Violino, S., Moscovini, L., Ortenzi, L., Salvucci, G., Vasta, S., Tocci, F., Costa, C., Toscano, P., & Pallottino, F. (2022). Olive Fruit Selection through AI Algorithms and RGB Imaging. Foods, 11(21), 3391. https://doi.org/10.3390/foods11213391