Abstract
The inhabitants of the world are expected to grow by two billion in the next two decades; as population increases, food demand rises too, leading to more intensive resource exploitation and greater negative externalities related to food production. In this paper the environmental impact of meals provided in school canteens are analysed through the Life Cycle Assessment methodology, in order to evaluate the GHGs emissions released by food production. Meals, and not just individual foods, have been considered so as to include in the analysis the nutritional aspects on which meals are based. Results shows that meat, fish and dairy products are the most impacting in terms of greenhouse gas emissions, with values that shift from 31.7 and 24.1 kg CO2 eq for butter and veal, to 2.37 kg CO2 eq for the octopus, while vegetables, legumes, fruit and cereals are less carbon intensive (average of 3.71 kg CO2 eq for the considered vegetables). When the environmental impact is related to the food energy, the best option are first courses because they combine a low carbon footprint with a high energy content. The results of the work can be used both by the consumer, who can base the meal choice on environmental impact information, and by food services, who can adjust menus to achieve a more sustainable production.
1. Introduction
According to the United Nations projections, the world population is expected to grow by 2 billion people by 2050, reaching 9.7 billion individuals worldwide [1]. More people on this planet means higher food demand and, consequently, greater competition for natural resources. Food production relies on the exploitation of natural capital inputs such as water, land, energy and biodiversity, and is responsible for negative externalities as land degradation, water stress and air pollution, contributing to 60% to the terrestrial biodiversity loss [2,3]. Moreover, agriculture both contributes to climate change and is affected by climate change: on one hand it is accounted to release the 24% of greenhouse gases (GHG) in the atmosphere, while on the other hand extreme weather events affect crop yields and food prices [2,3,4]. According to that, current food consumption patterns must be revised in order to improve their sustainability and to reduce the environmental impact of our food system, stimulating the preservation of natural resources, reducing the food waste generation that amounts, approximately, to one-third of the total global food production [5], but ensuring a production consistent with the growing demand [6]. The nutritional, environmental, and economic consequences of these dietary patterns must be taken into consideration when diet guidelines are proposed [2], and food policy, as well as production process innovation and consumers awareness, are necessary to tackle these issues. On this purpose, United Nations in the “2030 Agenda for Sustainable Development”, call for action by all countries, encouraging them to end hunger through the sustainable management of natural resources, promoting responsible consumption patterns and climate actions [7].
The demand and consumption of food within the agri-food sector are determined by many different economic, social and environmental factors. Income, population size, prices of both food and other commodities along with cultural tradition, consumers’ preferences, expectations and personal beliefs are the principal drivers of food demand responsible for shaping the consumption patterns [8]. Consumers’ preferences and choices of products and services can be explained and predicted by analysing the individual values, which constitute the background of behaviour at both conscious and non-conscious level [9]. In a context where data informative to decision makers are commonly accessible only in disparate sources, limiting their effectiveness [10], it is important to recognize the role of consumers in the evaluation of product attributes, who express their preferences considering their personal values [11]. Consumers care about the different aspects of the products they buy and many studies have identified several values that guide individual purchasing decisions: price, health, tradition, natural content, convenience and sensory appeal [9,12,13,14,15,16,17,18]. Some food values even refer to the production process and not to the product itself, such as ethical concern about environmental sustainability, animal welfare and children labour. From the literature it also emerged that food values in different countries and cultures are similar; however, they differ on the relative importance which individuals attach to them. Understanding how people choose among various products with many different characteristics is crucial in order to determine the most important features of a product. This is relevant not only for companies but also for scientists and governments when it comes to work on product innovation and packaging, to develop new technologies and advertising campaigns, or even to adopt new food policies [9].
Nowadays, the topic of the environmental burden of food production and dietary choice is becoming more widespread both within the scientific community [19,20,21,22,23] and the general public. The life cycle impact assessment results, covering multiple impacts in quantitative terms, facilitate the identification of hotspots (i.e., the main life cycle stage and activities causing significant impacts) to derive strategies for life cycle management to improve the environmental performances of product and promote the shift towards sustainable agriculture and food production systems including more sustainable food consumption patterns via environmental certification and labelling schemes [24]. Studies aimed to analyse the environmental impact of food have been conducted by many authors [23,25], but they generally focused on a single product or at least few items [5,26,27,28,29,30]. On the other hand, additional studies aimed to compare a wide variety of fresh food items, carrying out a systematic literature review of GHG emissions [2,31], but without considering the nutritional aspects. Finally, Poore & Namecek (2019), proposed a comprehensive analysis of more items, grouping them basing on their primary dietary role and benefit.
The purpose of this study is to analyse, from a life-cycle perspective, the environmental impact of meals provided in school canteens. Differently from individual foods, prepared considering the indications of nutritionists, meals served in canteens have proportionate nutritional values and are designed to guarantee a planned and balanced diet. These aspects are particularly important in school-age nutrition and represent an additional step in the analysis of the environmental impact of food.
Nowadays, the food sector is becoming increasingly global, the links among different actors of the value chain create international networks [32,33] and the production systems are more and more standardised [34]. In this context, economic, social and environmental externalities arising from the food sector spread among different countries [35]. It is highlighted that although the study was conducted at regional level in Italy, it can be seen from a general point of view since the guidelines for the composition of dishes in Italy are common at national level [36] and the considered ingredients (120) are produced in different countries. For this reason, the methodology and the results of our work could be generalizable.
2. Materials and Methods
Life Cycle Assessment (LCA) is an objective and standardized methodology capable of investigating the environmental behaviour of products, processes, or systems throughout their entire life cycle. As is well known, the general LCA framework is internationally defined by ISO 14040-14044 [37,38] and consists of four conceptual phases, namely, the following: (1) goal and scope definition, (2) Life Cycle Inventory (LCI), (3) Life Cycle Impact Assessment (LCIA) and (4) interpretation.
In this study, LCA methodology is applied to determine the Carbon Footprint (CF) of each canteen meal and the resulting value is then related to the food energy content. The CF (kg CO2 eq.), in particular, estimates the total amount of GHGs directly and indirectly emitted during the production of canteen meals, while, the food energy, expressed in kJ, is the energy released within the body when food nutrients (carbohydrates, fats and proteins) are burned [39]. The identification of these two parameters allowed us to calculate the Carbon-Footprint/Food energy (CFE) index, defined as the ratio between the CF (g CO2 eq./dish) and the food energy (kJ/dish). Such index provided a ranking of the most impacting meals when normalised to food energy, enabling the comparison between a large variety of foods without limiting the analysis only to their carbon intensity, but basing the evaluation of the environmental burdens in a context of balanced diet. This approach may be also employed by companies that, using the CFE index, have the possibility to communicate to the consumer an increasingly sought-after information, demonstrating their attention towards a sustainable development.
2.1. Goal and Scope Definition
The environmental impacts of meal production are evaluated with a from-cradle-to-gate approach i.e., considering from raw material production up to the transport of the ingredients to the meal producer (Figure 1). Therefore, the processes within the system boundaries are the following: (i) production and harvesting of crops and feed (including the use of fertilisers, energy and fuel), (ii) animal husbandry, (iii) processing and slaughtering, (iv) packaging and (v) transport to the farm that processes food and produces school meals. According to ISO 14040-14044 [37,38] guidelines, following the principle of excluding equivalent activities for LCA comparison, a cut-off criterion was applied to production of infrastructure and machinery, transport of the meals to the school, packaging end of life and waste food disposal, which are assumed to be similar for all the items. In addition, due to a lack of data and to the relatively low influence on the final value [28], system boundaries do not include the cooking of the meals and the refrigeration/heating of the meals before consumption.
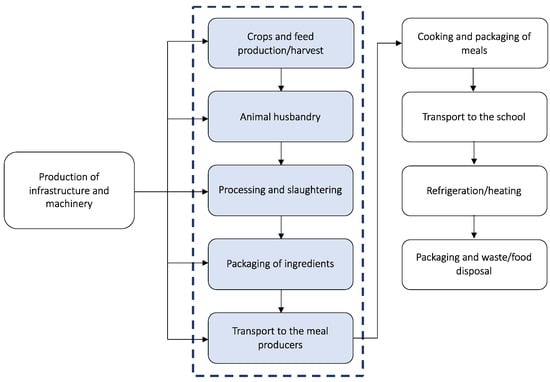
Figure 1.
System boundaries of the study: from-cradle-to-gate approach.
The functional unit, to which the inputs and outputs of the system are related, is one dish provided to school canteens. The dishes are clustered in three sub-categories that are as follows: ‘first course’, whose principal component is normally carbohydrates; ‘second course’, mainly based on protein-rich foods, such as meat or fish; and ‘side dish’, represented by vegetables or foods high in fibres, which all together represent the complete meal for each student. The canteens have two slightly different menus, one for winter and one for summer, because, as suggested by the health care system, the seasonality of fruit and vegetables should be considered as much as possible when it comes to preparing meals for children at school [40].
No allocation criteria have been applied.
2.2. Inventory Phase
The list of meals and the ingredients quantities for the recipes considered in this study (Table 1) were published by the health care system of the city of Bologna (Italy) [40] according to the national guidelines, which indicates the Levels of Nutrient and Energy Reference Assumption for the Italian population [36]. Both menus contain a list of dishes for 20 days, clustered in 4 weeks (from Monday to Friday), which are repeated every month. The ingredients quantities considered in the study are those for children attending the first-grade secondary school and were taken from the same health care system of Bologna.

Table 1.
List of dishes of the winter (W) and summer (S) menu of schools in the municipality of Bologna menu, reproduced from AUSL Bologna Azienda Sanitaria Locale. Indicazioni Nutrizionali per il Pasto a Scuola—Nido, Infanzia, Primaria, Secondaria; 2009 [39].
CFs associated to each specific ingredient are mainly collected from the international EPD system [41] and Ecoinvent 3.5 database. For nutritional value, CREA website [42] has been taken as reference. More information and data sources are reported in Table S1 of the Supplementary Materials.
Where only partial data on the agricultural stage are available, the packaging stage and the transport of the ingredients to the meal producer are added. Concerning GHG emissions, the packaging phase has been assumed to emit 0.04 g CO2 eq./g product, while the transport phase 0.09 g CO2 eq./g of product [31].
The simulation was carried out associating the specific CO2 eq. emissions and the energetic value of the single ingredient to their exact amount in each proposed dish. For instance, knowing the specific emissions (g CO2 eq./g) and the specific energetic value (kJ/g) of tomatoes (0.45; 0.80) mozzarella (8.70; 10.58) and olive oil (4.14; 37.62) and following the “Caprese salad” recipe: 100g of tomatoes, 90g of mozzarella and 6g of olive oil (Table S3 of Supplementary Materials), the total CF and energetic value referred to the single dish is computed. Then, the two obtained parameters are plotted and the CFE index is accordingly calculated.
3. Results and Discussion
The LCI of the study consists of 120 different foods and includes all the ingredients of the considered school menu. For each ingredient it has been calculated the CEF, which corresponds to the ratio between CF and food energy (Table S1).
In order to properly investigate the environmental impact of meals, it is necessary to first take a look at the characteristics of all the ingredients. The analysis shows that the most carbon-intensive categories are “meat and fish” and “dairy products”, whose CFs range from a minimum of 3 g CO2 eq./g to a maximum of 24 g CO2 eq./g. In particular, the highest values are attributable to veal, beef, yellowfin tuna, Parmigiano and Pecorino cheese, all of which have more than 16 g CO2 eq. per g of product. “Oils, spices and sauces” category has CFs between 2 and 5 g CO2 eq./g, while the other categories (fruit, cereals, legumes and vegetables) have a CF smaller than 2 g CO2 eq./g. The analysis of their CFE index (g CO2 eq./kJ), scatter plot shown in Figure S1 in the Supplementary Materials, indicates that almost all foods tend to align or group with the ones of the category to which they belong. In particular, “Dairy products”, “legumes” and “oils, spices and sauces” show a linear trend between CF and food energy. “Dairy products” have parameters that increase proportionally with each other, while “legumes” and “oils, spices and sauces” show a constant low CF although the energy content varies. Fruit, vegetables and cereals are grouped in areas with low environmental impact, distinguished by their food energy. “Fresh fruits” and “vegetables” have both the lowest CF and the lowest energy content (between 0 and 5 kJ/g), “cereals and pasta” are around 10–15 kJ/g, while “dry fruits” is the best category because it combines a low CF with a high food energy (25–30 kJ/g). “Meat and fish” is the only category in which it is not possible to identify a unique trend since it contains both products with low CF and high food energy (such as bacon) and products with inverse characteristics (the already mentioned veal, beef and yellowfin tuna).
Moving from the GHG emissions of ingredients to those of canteen meals, the results, shown in Figure 2, indicate that the CF of the winter menu is slightly higher than that of the summer menu (26.1 kg CO2 eq. vs. 24.5 kg CO2 eq.).
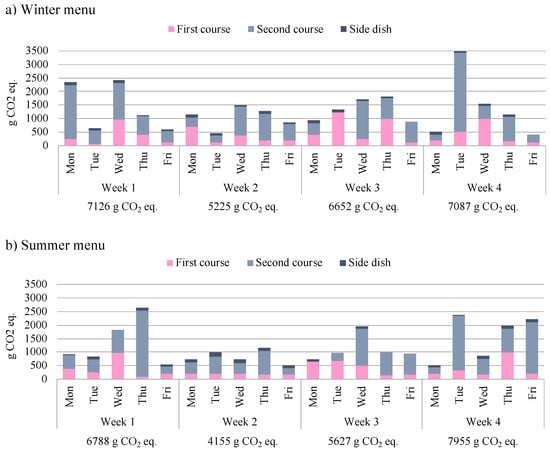
Figure 2.
Carbon Footprint of the winter (a) and the summer (b) menu analysed.
Analysing the differences between the two menus (full data presented in Table S2 of the Supplementary Materials), it emerges that, in winter, the consumption of meat and dairy products is higher than in summer menu, which, in turn, provides for higher amounts of vegetables, fruit, cereals and pasta. This is consistent with the guidelines of the health care system and, based on the above findings, justifies the higher CF. For the same reason, first courses are usually less impacting on the environment than second courses, as they contain less meat and dairy products but more cereal and pasta. On the other hand, being side dishes composed almost exclusively of vegetables, they resulted in the lowest environmental impact.
Among the school canteen dishes, the CF of first courses ranges from 67 g CO2 eq. of barley soup to 1.240 g CO2 eq. of lasagne, the CF of second courses between tuna (not yellowfin, 215 g CO2 eq.) and veal escalope (2.919 g CO2 eq.), while side dishes GHG emissions are lower and range from 49 g CO2 eq. of carrots to 174 g CO2 eq. of peas with butter and Parmigiano cheese. The full list of all meal recipes is available in Table S3 in the Supplementary Materials. In Figure 3 all the 79 analysed dishes (28 first courses, 40 s courses and 11 side dishes) are listed by their CF and labelled according to four categories of food: with meat, with fish, vegetarian and vegan.
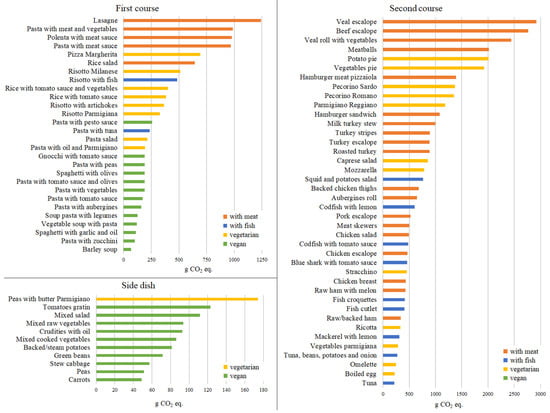
Figure 3.
Carbon footprint (CF) of the analysed meals: first courses, second courses and side dishes.
The results reflect the findings of the individual ingredient impacts, so dishes containing meat or fish are those that are assigned a higher CF. For instance, pasta with tomato sauce and pasta with meat sauce, which differ only by 35 g of beef meat, present a CF of 171 g CO2 eq. and 968 g CO2 eq. respectively. Within the menus, the biggest impacts (Tuesday fourth week in the winter menu and Thursday first week in the summer menu, Figure 2) come from second courses that include veal: escalope and roll with vegetables. Moreover, meat dishes tend to have a higher GHG emission than fish dishes, and dairy products (such as ripened cheeses or mozzarella) significantly increase the CF of the dishes, while vegan foods are confirmed to have the lowest impact.
When the CF of meals is related to their food energy, they tend to cluster as in the case of ingredients. Figure 4 allows for an easy comparison of the CF of various meals containing the same food energy, making the CFE index (g CO2 eq./kJ) deductible. If a meal has a low index value means that it provokes low GHG emission related to its food energy.
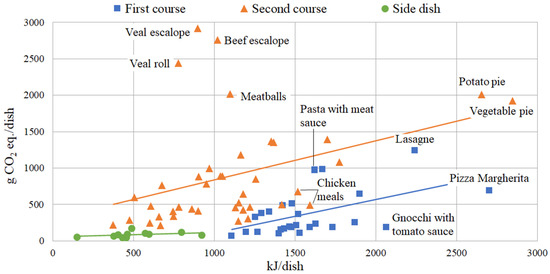
Figure 4.
Carbon footprint (CF) of the analysed meals: first courses, second courses and side dishes.
The graph shows that first and second courses have a direct proportionality between CF and food energy (with a few exceptions especially among second courses) with a similar trend line slope, confirming the theory described in Vieux et al., where, even if in a French context, it is found that diets with higher nutritional quality had significantly higher GHG emissions [43]. However, first courses are generally characterized by higher food energy, which, combined with the lower CF already emerged, makes the average CFE index of this category (0.23) closer to that of side dishes (0.20) than to the CFE of second courses (0.85).
Semolina pasta is the main source of food energy for first courses and the reduced use of meat ensures a low level of environmental impact. The large CF of lasagne is partially justified by the high food energy of the dish, while pasta with meat sauce (or with meat sauce and vegetables) does not compensate so well for its environmental impact. Pizza Margherita and gnocchi with tomato sauce are, among the first courses, those that best combine CF and food energy.
On the other hand, veal and beef meals (such as meatballs) are confirmed to be the worst choices since high CF is not associated with high food energy. Indeed, there are many second courses that can guarantee the same (or greater) nutrient supply to the individual and that are associated with a lower GHG emission. Concerning these, it is preferable to consume more white meat (such as chicken or turkey) than red (beef, veal, pork, lamb), both considering the environmental results of this study and for health reasons already widely documented [44]. Vegetable and potato pie values, both for food energy and CF, are consequence of the Pecorino Romano cheese with which they are made, while chicken meals are the second courses that marry the two characteristics in the best way.
The side dish category is composed for ten elevenths by vegan dishes and it shows the lowest CFE values. It is an advantage for CF, as mentioned before, but results a negative point for food energy. Among these meals there is more variability in terms of energy than impact, with baked potatoes and tomatoes gratin at the maximum and stew cabbage at the minimum.
Since part of the sourced data, for the instance the ones deriving from EPD documents, are not provided with the uncertainty, it has been chosen to not perform the uncertainty analysis.
4. Conclusions
In this work, GHG emissions of meals provided in school canteens have been analysed and results can be used to provide an additional supporting aspect to the costumer.
From the analysis of the ingredients, it was found that meals containing meat, fish and dairy products are the most impacting in terms of GHG emissions. Between the dairy products, cheese and butter presented the higher CF, while in the case of milk and eggs it demonstrated to be lower. In general, fresh fruit, vegetables, cereals and legumes are the foods with the lowest CO2 eq. contribution, although dry fruit should be considered the best option, because it combines a low CF with a high food energy (low CFE index). The first courses resulted in the best combination of the two parameters, because many of them have a high energy content that justify the environmental impact. Side dishes have an even smaller CF, but their caloric contribution to the person is also lower, resulting in a CFE index similar to that of first courses. On the contrary, second courses generally have high CF value but intermediate food energy, which makes them the most discouraged choice from an environmental/nutritional point of view.
In conclusion, results on the CF of meals and ingredients used in school canteens could be useful for further changes in school food policy in light of environmental sustainability, nutritional aspects and educational purposes and, thanks to the large ingredient inventory, the proposed one can be taken as a reference methodology for those who want to enlarge the study to the environmental impacts of different food diets or, more in general, to the food service.
A further development of this study will be aimed at extending both impact categories (such as land use and water consumption) and life cycle boundaries (such as cooking and waste disposal), providing a better knowledge about the environmental sustainability of food and meal.
Supplementary Materials
The following supporting information can be downloaded at: https://www.mdpi.com/article/10.3390/foods11020193/s1, Table S1: Carbon footprint (CF), energy content and Carbon-Footprint/Energy index (CFE index) of the food items, Table S2: Total amount of ingredients (divided by course and category) used in the menus, Table S3: Recipes from the school canteen meals, Figure S1: Carbon-Footprint/Food Energy (CFE) index graph for the analysed ingredients.
Author Contributions
Conceptualization, M.V., E.N., A.S., G.C.; methodology, M.V., A.S., E.N.; software, M.V.; validation, F.P., I.V., G.C.; formal analysis, F.A.; investigation, M.V.; resources, A.S., E.N., G.C.; data curation, M.V.; writing—original draft preparation, M.V., F.A.; supervision, F.P., I.V.; project administration, F.P. All authors have read and agreed to the published version of the manuscript.
Funding
This research received no external funding.
Acknowledgments
Authors want to acknowledge Simone Gozzi, Francesca Orlando and Francesco Bari of CAMST for their support in the data collection and analysis.
Conflicts of Interest
The authors declare no conflict of interest.
References
- UN United Nations. World Population Prospects—Population Division. Available online: https://population.un.org/wpp/ (accessed on 28 September 2021).
- Abejón, R.; Batlle-Bayer, L.; Laso, J.; Bala, A.; Vazquez-Rowe, I.; Larrea-Gallegos, G.; Margallo, M.; Cristobal, J.; Puig, R.; Fullana-I-palmer, P.; et al. Multi-objective optimization of nutritional, environmental and economic aspects of diets applied to the Spanish context. Foods 2020, 9, 1677. [Google Scholar] [CrossRef]
- EEA. Food in a Green Light; EEA: København, Denmark, 2017; ISBN 9789292138790. [Google Scholar]
- EPA (Environmental Protection Agency). Global Greenhouse Gas Emissions Data. Available online: https://www.epa.gov/ghgemissions/global-greenhouse-gas-emissions-data (accessed on 28 September 2021).
- Nikkhah, A.; Firouzi, S.; Dadaei, K.; Van Haute, S. Measuring circularity in food supply chain using life cycle assessment; refining oil from Olive Kernel. Foods 2021, 10, 590. [Google Scholar] [CrossRef]
- Avadí, A.; Acosta-Alba, I. Eco-efficiency of the fisheries value chains in the gambia and mali. Foods 2021, 10, 1620. [Google Scholar] [CrossRef] [PubMed]
- UN General Assembly. Transforming Our World: The 2030 Agenda for Sustainable Development; UNGA: New York, NY, USA, 2015; Volume 16301. [Google Scholar]
- WHO. Diet, Nutrition and the Prevention of Chronic Diseases; WHO: Geneva, Switzerland, 2003. [Google Scholar]
- Hauser, M.; Jonas, K.; Riemann, R. Measuring salient food attitudes and food-related values. An elaborated, conflicting and interdependent system. Appetite 2011, 57, 329–338. [Google Scholar] [CrossRef]
- Heller, M.C.; Selke, S.E.M.; Keoleian, G.A. Mapping the Influence of Food Waste in Food Packaging Environmental Performance Assessments. J. Ind. Ecol. 2019, 23, 480–495. [Google Scholar] [CrossRef] [Green Version]
- Reynolds, T.J.; Gutman, J. Laddering, theory, method, analysis and interpretation. J. Advert. Res. 1988, 28, 11–31. [Google Scholar]
- Steptoe, A.; Pollard, T.M.; Wardle, J. Development of a measure of the motives underlying the selection of food: The food choice questionnaire. Appetite 1995, 25, 267–284. [Google Scholar] [CrossRef] [Green Version]
- Lindeman, M.; Sirelius, M. Food choice ideologies: The modern manifestations of normative and humanist views of the world. Appetite 2001, 37, 175–184. [Google Scholar] [CrossRef] [Green Version]
- Lusk, J.L.; Briggeman, B.C. Food Values. Am. J. Agric. Econ. 2009, 91, 184–196. [Google Scholar] [CrossRef]
- Lyerly, J.E.; Reeve, C.L. Development and validation of a measure of food choice values. Appetite 2015, 89, 47–55. [Google Scholar] [CrossRef]
- Pula, K.; Parks, C.D.; Ross, C.F. Regulatory focus and food choice motives. Prevention orientation associated with mood, convenience, and familiarity. Appetite 2014, 78, 15–22. [Google Scholar] [CrossRef]
- Hasselbach, J.L.; Roosen, J. Motivations behind Preferences for Local or Organic Food. J. Int. Consum. Mark. 2015, 27, 295–306. [Google Scholar] [CrossRef]
- Sautron, V.; Péneau, S.; Camilleri, G.M.; Muller, L.; Ruffieux, B.; Hercberg, S.; Méjean, C. Validity of a questionnaire measuring motives for choosing foods including sustainable concerns. Appetite 2015, 87, 90–97. [Google Scholar] [CrossRef]
- Van Dooren, C.; Marinussen, M.; Blonk, H.; Aiking, H.; Vellinga, P. Exploring dietary guidelines based on ecological and nutritional values: A comparison of six dietary patterns. Food Policy 2014, 44, 36–46. [Google Scholar] [CrossRef]
- González, A.D.; Frostell, B.; Carlsson-Kanyama, A. Protein efficiency per unit energy and per unit greenhouse gas emissions: Potential contribution of diet choices to climate change mitigation. Food Policy 2011, 36, 562–570. [Google Scholar] [CrossRef]
- Sieti, N.; Rivera, X.C.S.; Stamford, L.; Azapagic, A. Environmental impacts of baby food: Ready-made porridge products. J. Clean. Prod. 2019, 212, 1554–1567. [Google Scholar] [CrossRef] [Green Version]
- Gallego-Schmid, A.; Mendoza, J.M.F.; Azapagic, A. Environmental impacts of takeaway food containers. J. Clean. Prod. 2019, 211, 417–427. [Google Scholar] [CrossRef]
- Djekic, I.; Pojić, M.; Tonda, A.; Putnik, P.; Kovačević, D.B.; Režek-Jambrak, A.; Tomasevic, I. Scientific challenges in performing life-cycle assessment in the food supply chain. Foods 2019, 8, 301. [Google Scholar] [CrossRef] [PubMed] [Green Version]
- Gheewala, S.H.; Jungbluth, N.; Notarnicola, B.; Ridoutt, B.; van der Werf, H. No simple menu for sustainable food production and consumption. Int. J. Life Cycle Assess. 2020, 25, 1175–1182. [Google Scholar] [CrossRef]
- Teixeira, R.F.M. Critical Appraisal of Life Cycle Impact Assessment Databases for Agri-food Materials. J. Ind. Ecol. 2015, 19, 38–50. [Google Scholar] [CrossRef]
- Konstantas, A.; Stamford, L.; Azapagic, A. Environmental impacts of ice cream. J. Clean. Prod. 2019, 209, 259–272. [Google Scholar] [CrossRef]
- Vagnoni, E.; Franca, A.; Porqueddu, C.; Duce, P. Environmental profile of Sardinian sheep milk cheese supply chain: A comparison between two contrasting dairy systems. J. Clean. Prod. 2017, 165, 1078–1089. [Google Scholar] [CrossRef]
- Mogensen, L.; Hermansen, J.E.; Trolle, E. The climate and nutritional impact of beef in different dietary patterns in Denmark. Foods 2020, 9, 1176. [Google Scholar] [CrossRef]
- Stillitano, T.; Falcone, G.; De Luca, A.I.; Piga, A.; Conte, P.; Strano, A.; Gulisano, G. A life cycle perspective to assess the environmental and economic impacts of innovative technologies in extra virgin olive oil extraction. Foods 2019, 8, 209. [Google Scholar] [CrossRef] [Green Version]
- Ziegler, F.; Nilsson, K.; Levermann, N.; Dorph, M.; Lyberth, B.; Jessen, A.A.; Desportes, G. Local seal or imported meat? Sustainability evaluation of food choices in greenland, based on life cycle assessment. Foods 2021, 10, 1194. [Google Scholar] [CrossRef] [PubMed]
- Clune, S.; Crossin, E.; Verghese, K. Systematic review of greenhouse gas emissions for different fresh food categories. J. Clean. Prod. 2017, 140, 766–783. [Google Scholar] [CrossRef] [Green Version]
- Poore, J.; Nemecek, T. Reducing food’s environmental impacts through producers and consumers. Science 2018, 360, 987–992. [Google Scholar] [CrossRef] [Green Version]
- Giovannetti, G.; Marvasi, E. Food exporters in global value chains: Evidence from Italy. Food Policy 2016, 59, 110–125. [Google Scholar] [CrossRef]
- Morgan, K.; Murdoch, J. Organic vs. conventional agriculture: Knowledge, power and innovation in the food chain. Geoforum 2000, 31, 159–173. [Google Scholar] [CrossRef]
- Tsekeris, T. Global value chains: Building blocks and network dynamics. Phys. A Stat. Mech. Its Appl. 2017, 488, 187–204. [Google Scholar] [CrossRef]
- SINU—Società Italiana di Nutrizione Umana (Italian Society for Human Nutrition). LARN. Livelli di Assunzione di Riferimento di Nutrienti ed Energia per la Popolazione Italiana. Available online: https://sinu.it/ (accessed on 28 September 2021).
- ISO 140402018; ISO Environmental Management—Life Cycle Assessment—Principles and Framework. ISO: Geneva, Switzerland, 2018.
- ISO 140442006; ISO Environmental Management—Life Cycle Assessment—Requirements and Guidelines. ISO: Geneva, Switzerland, 2020.
- Jiang, B.; Tsao, R.; Li, Y.; Miao, M. Food Safety: Food Analysis Technologies/Techniques. In Encyclopedia of Agriculture and Food Systems; Elsevier: Amsterdam, The Netherlands, 2014; pp. 273–288. ISBN 9780080931395. [Google Scholar]
- AUSL Bologna. Indicazioni Nutrizionali per il Pasto a Scuola—Nido, Infanzia, Primaria, Secondaria; AUSL Bologna: Bologna, Italy, 2009. [Google Scholar]
- EPD. The International EPD® System. Available online: https://www.environdec.com/home (accessed on 28 September 2021).
- CREA. Consiglio per la Ricerca in Agricoltura e l’Analisi Economica Agraria. Available online: https://www.alimentinutrizione.it/sezioni/tabelle-nutrizionali (accessed on 28 September 2021).
- Vieux, F.; Soler, L.G.; Touazi, D.; Darmon, N. High nutritional quality is not associated with low greenhouse gas emissions in self-selected diets of French adults1-3. Am. J. Clin. Nutr. 2013, 97, 569–583. [Google Scholar] [CrossRef] [PubMed] [Green Version]
- IARC Red Meat and Processed Meat; International Agency for Research on Cancer: Lyon, France, 2018; ISBN 9789283201526.
Publisher’s Note: MDPI stays neutral with regard to jurisdictional claims in published maps and institutional affiliations. |
© 2022 by the authors. Licensee MDPI, Basel, Switzerland. This article is an open access article distributed under the terms and conditions of the Creative Commons Attribution (CC BY) license (https://creativecommons.org/licenses/by/4.0/).