
Analysis of Food Delivery Using Big Data: Comparative Study before and after COVID-19


Abstract
:1. Introduction
2. Related Studies
2.1. Changes in Dining out Patterns after the COVID-19 Pandemic
2.2. Food Delivery Service in the COVID-19 Pandemic
2.3. Big Data Analysis in the Food Service Industry
3. Research Methodology
3.1. Data and Summary Statistics
3.2. Methodology
4. Results
4.1. Content Analysis
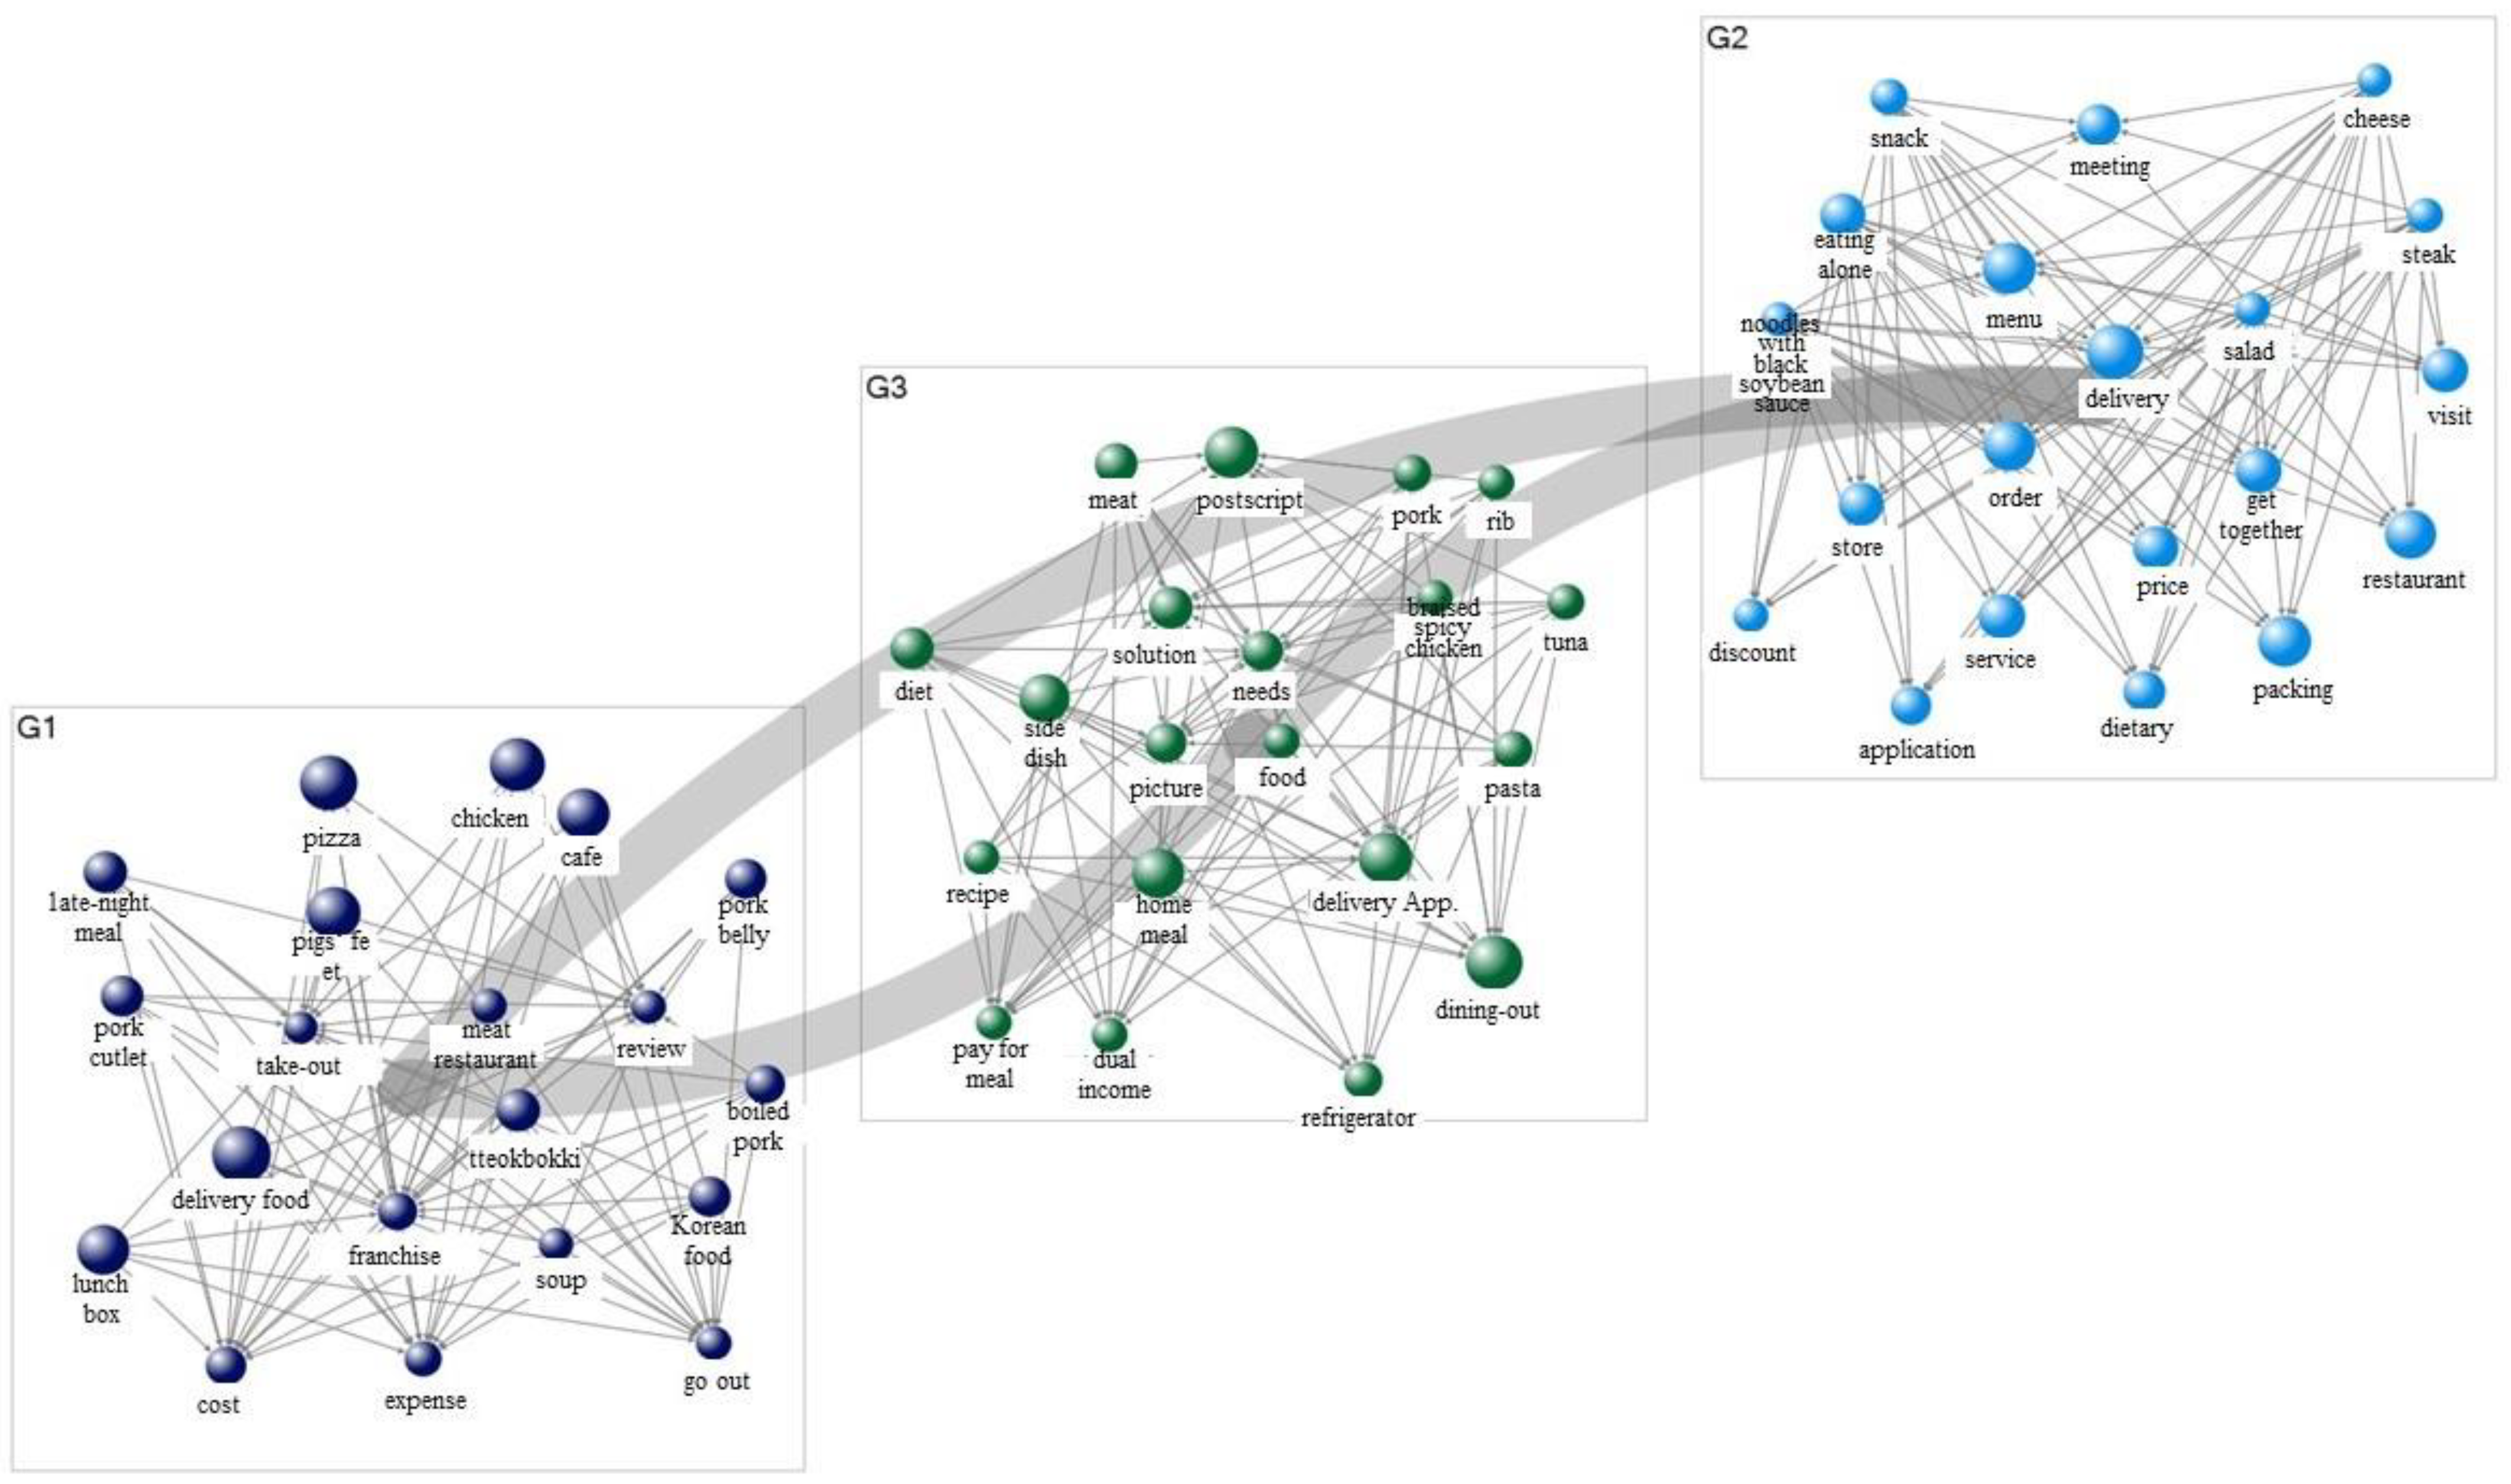
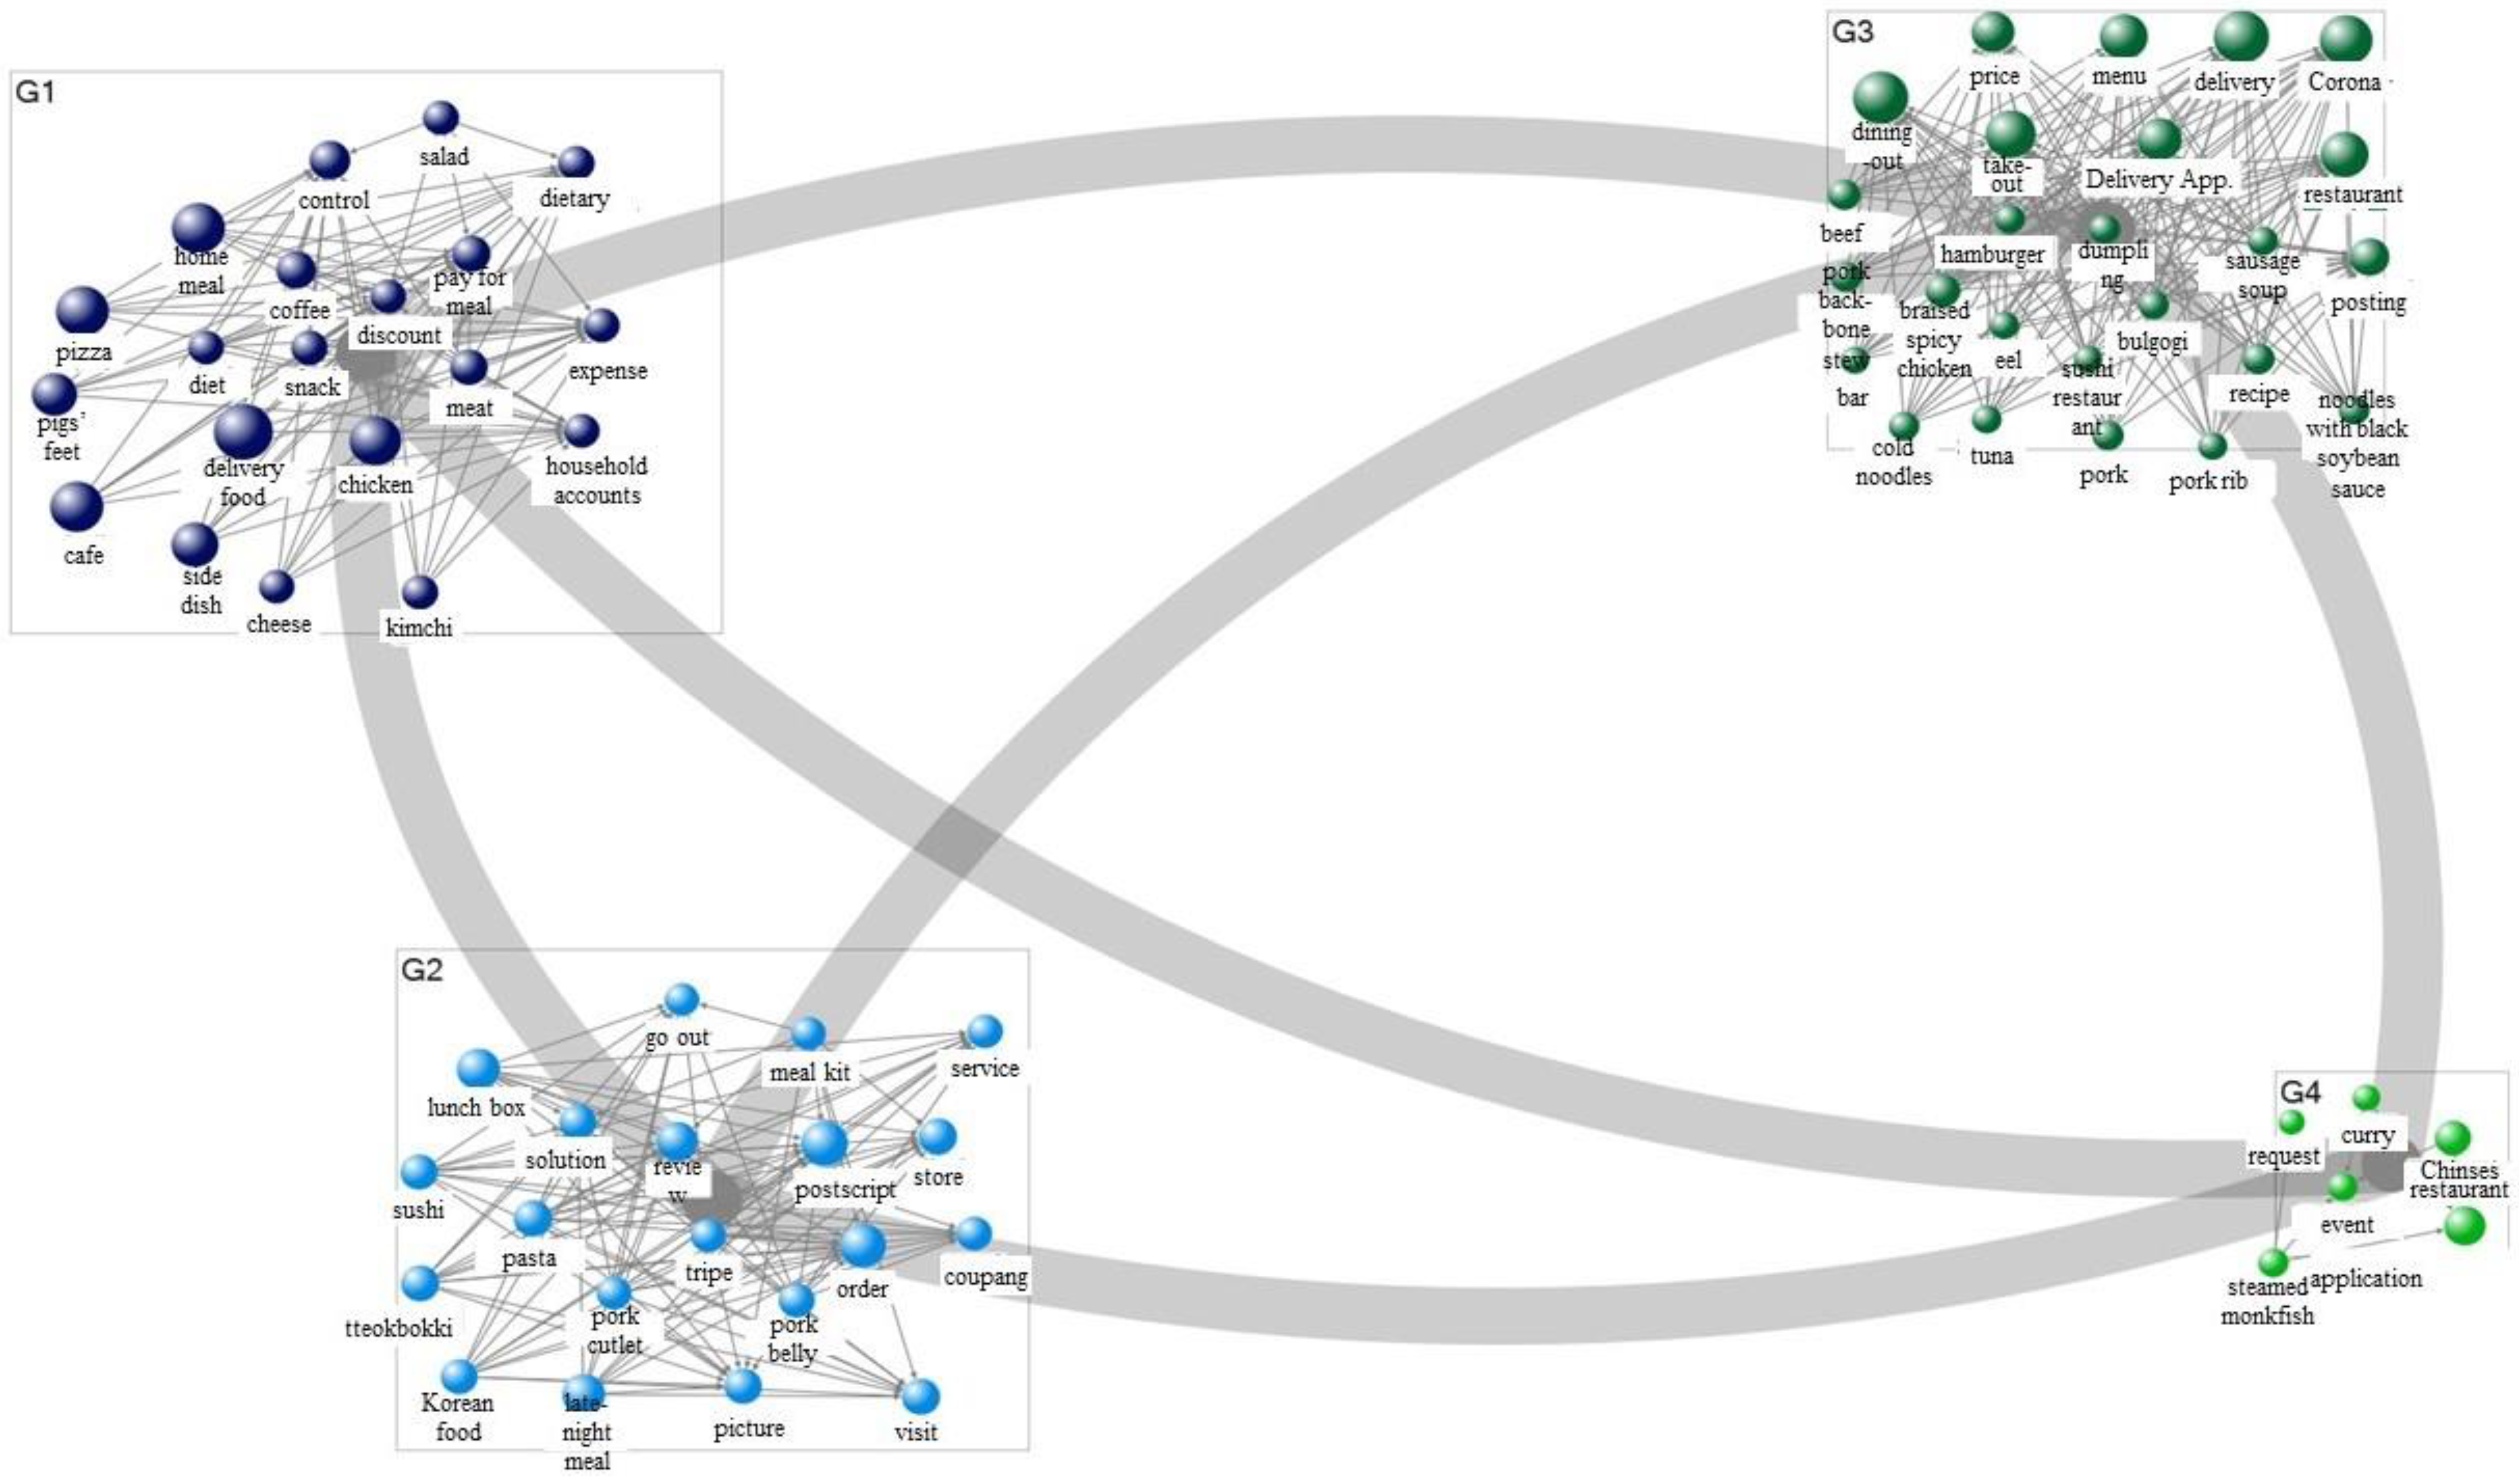
4.2. Text-Mining Analysis
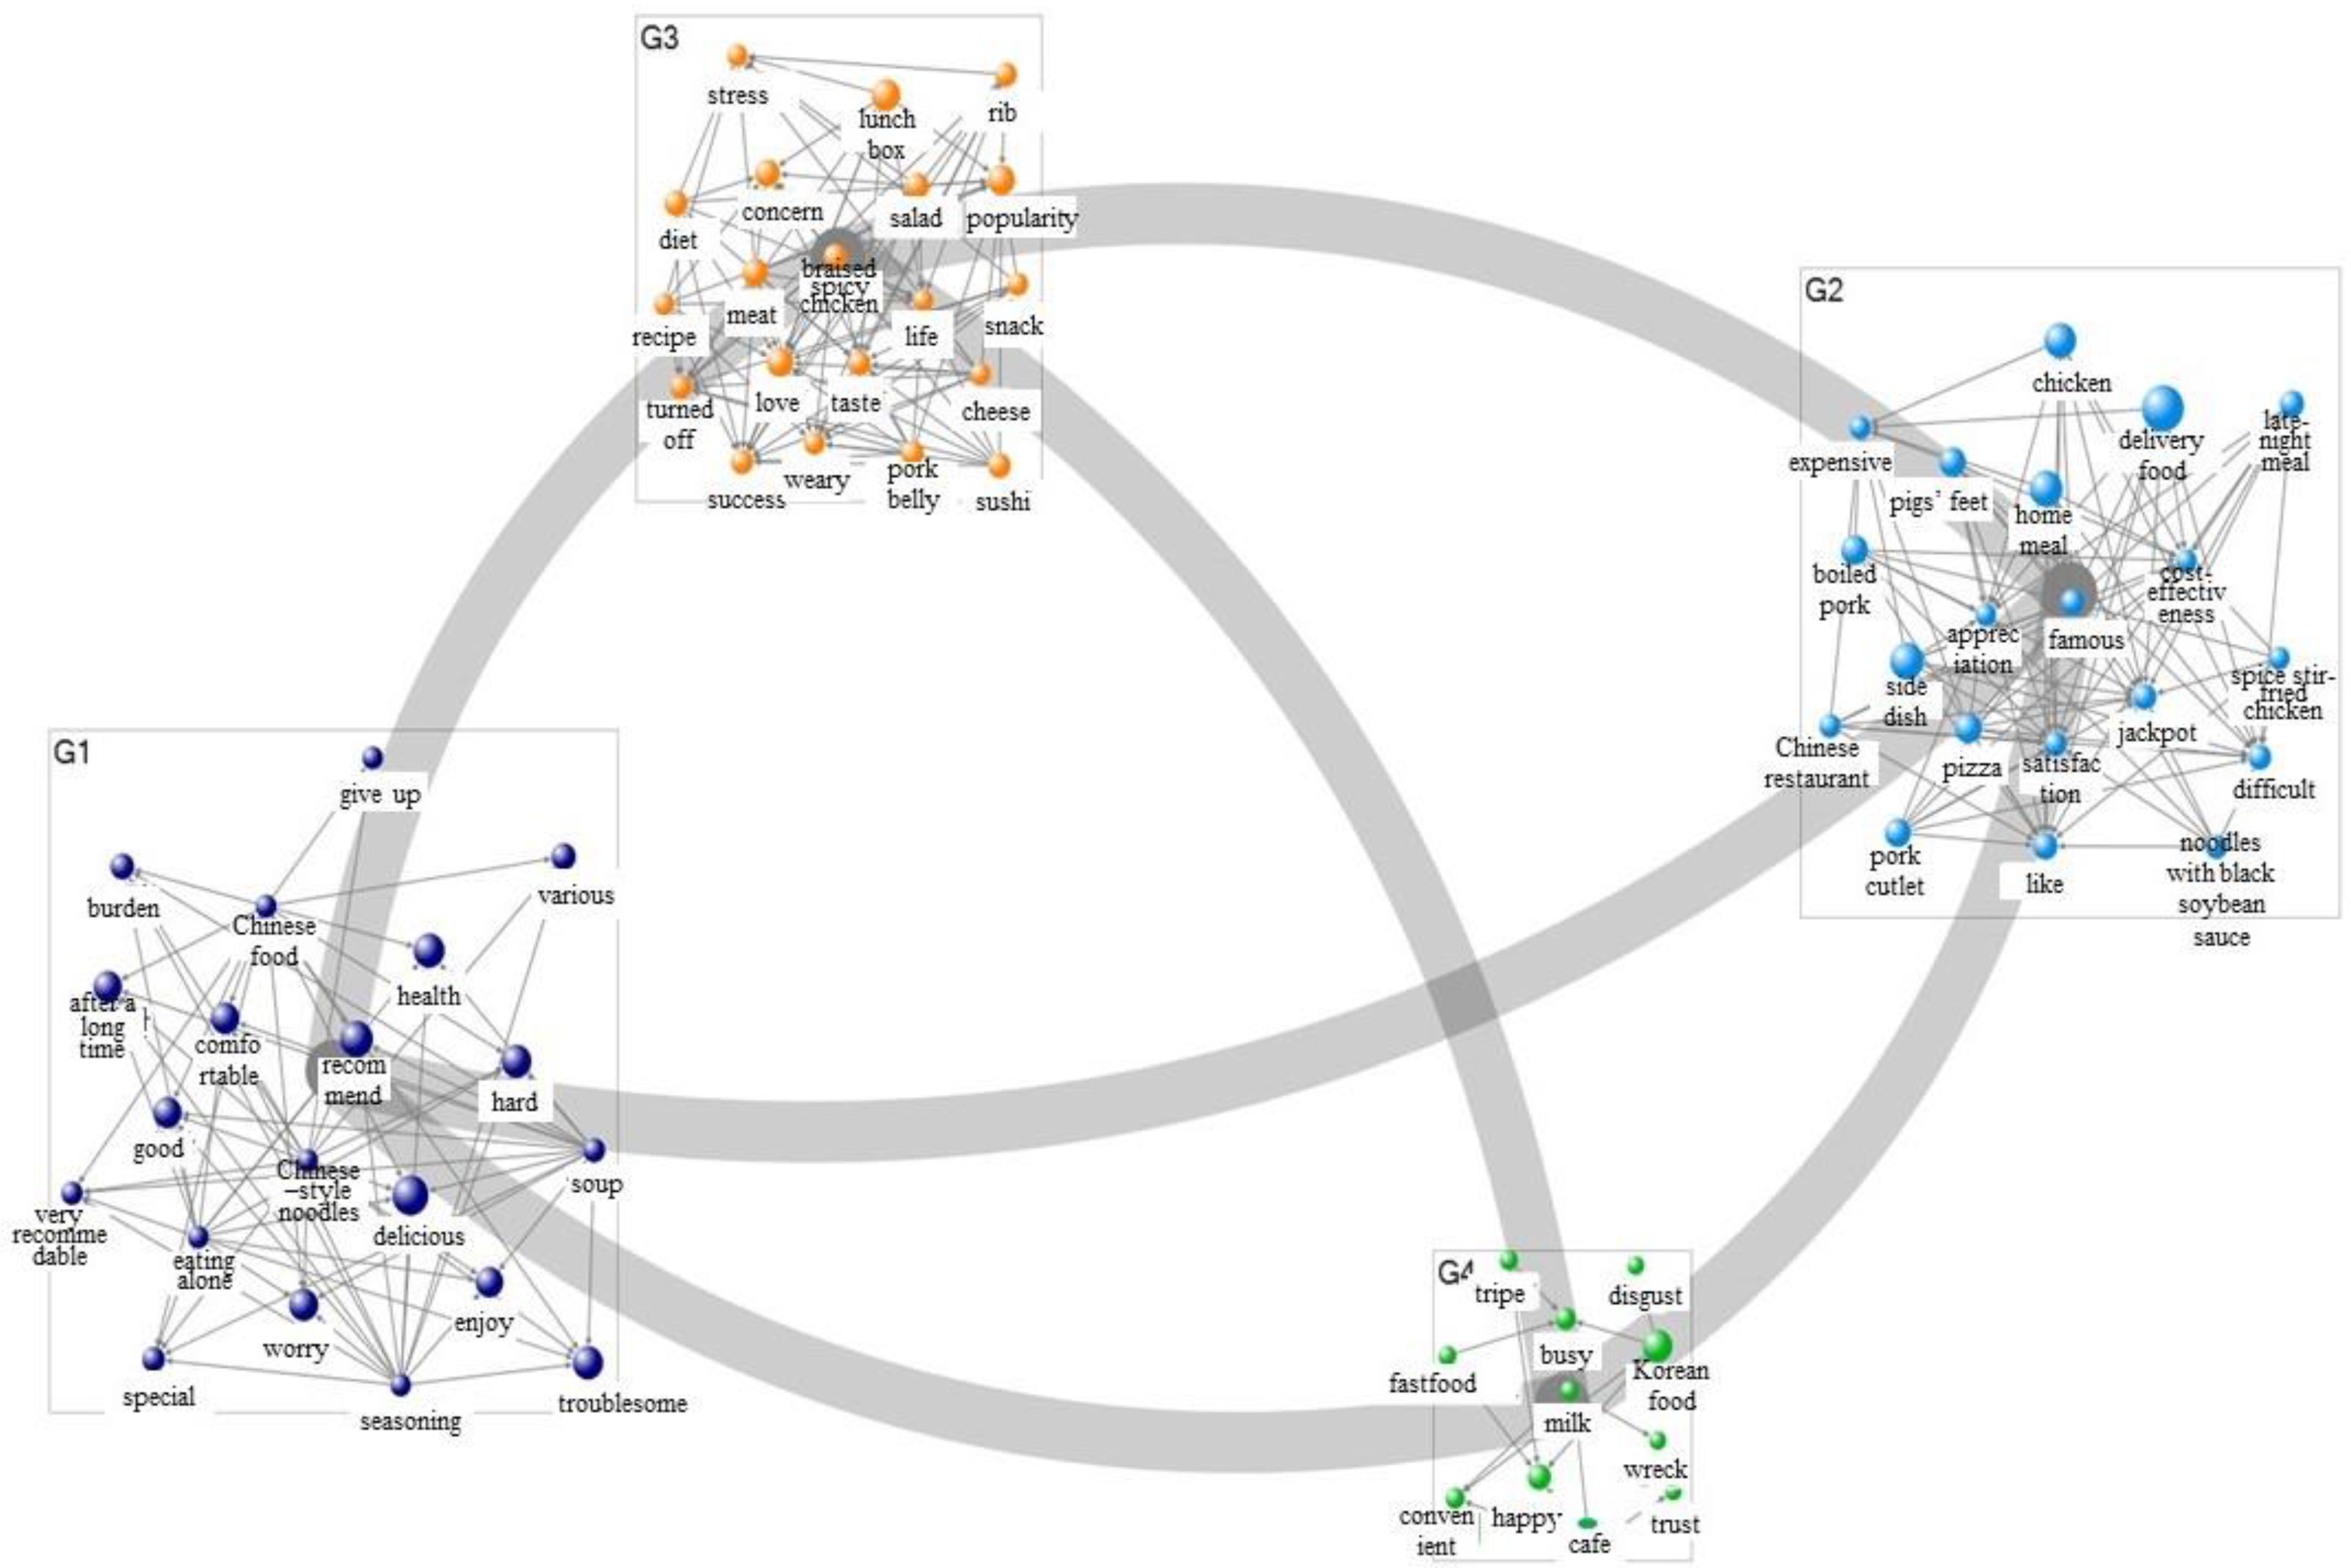
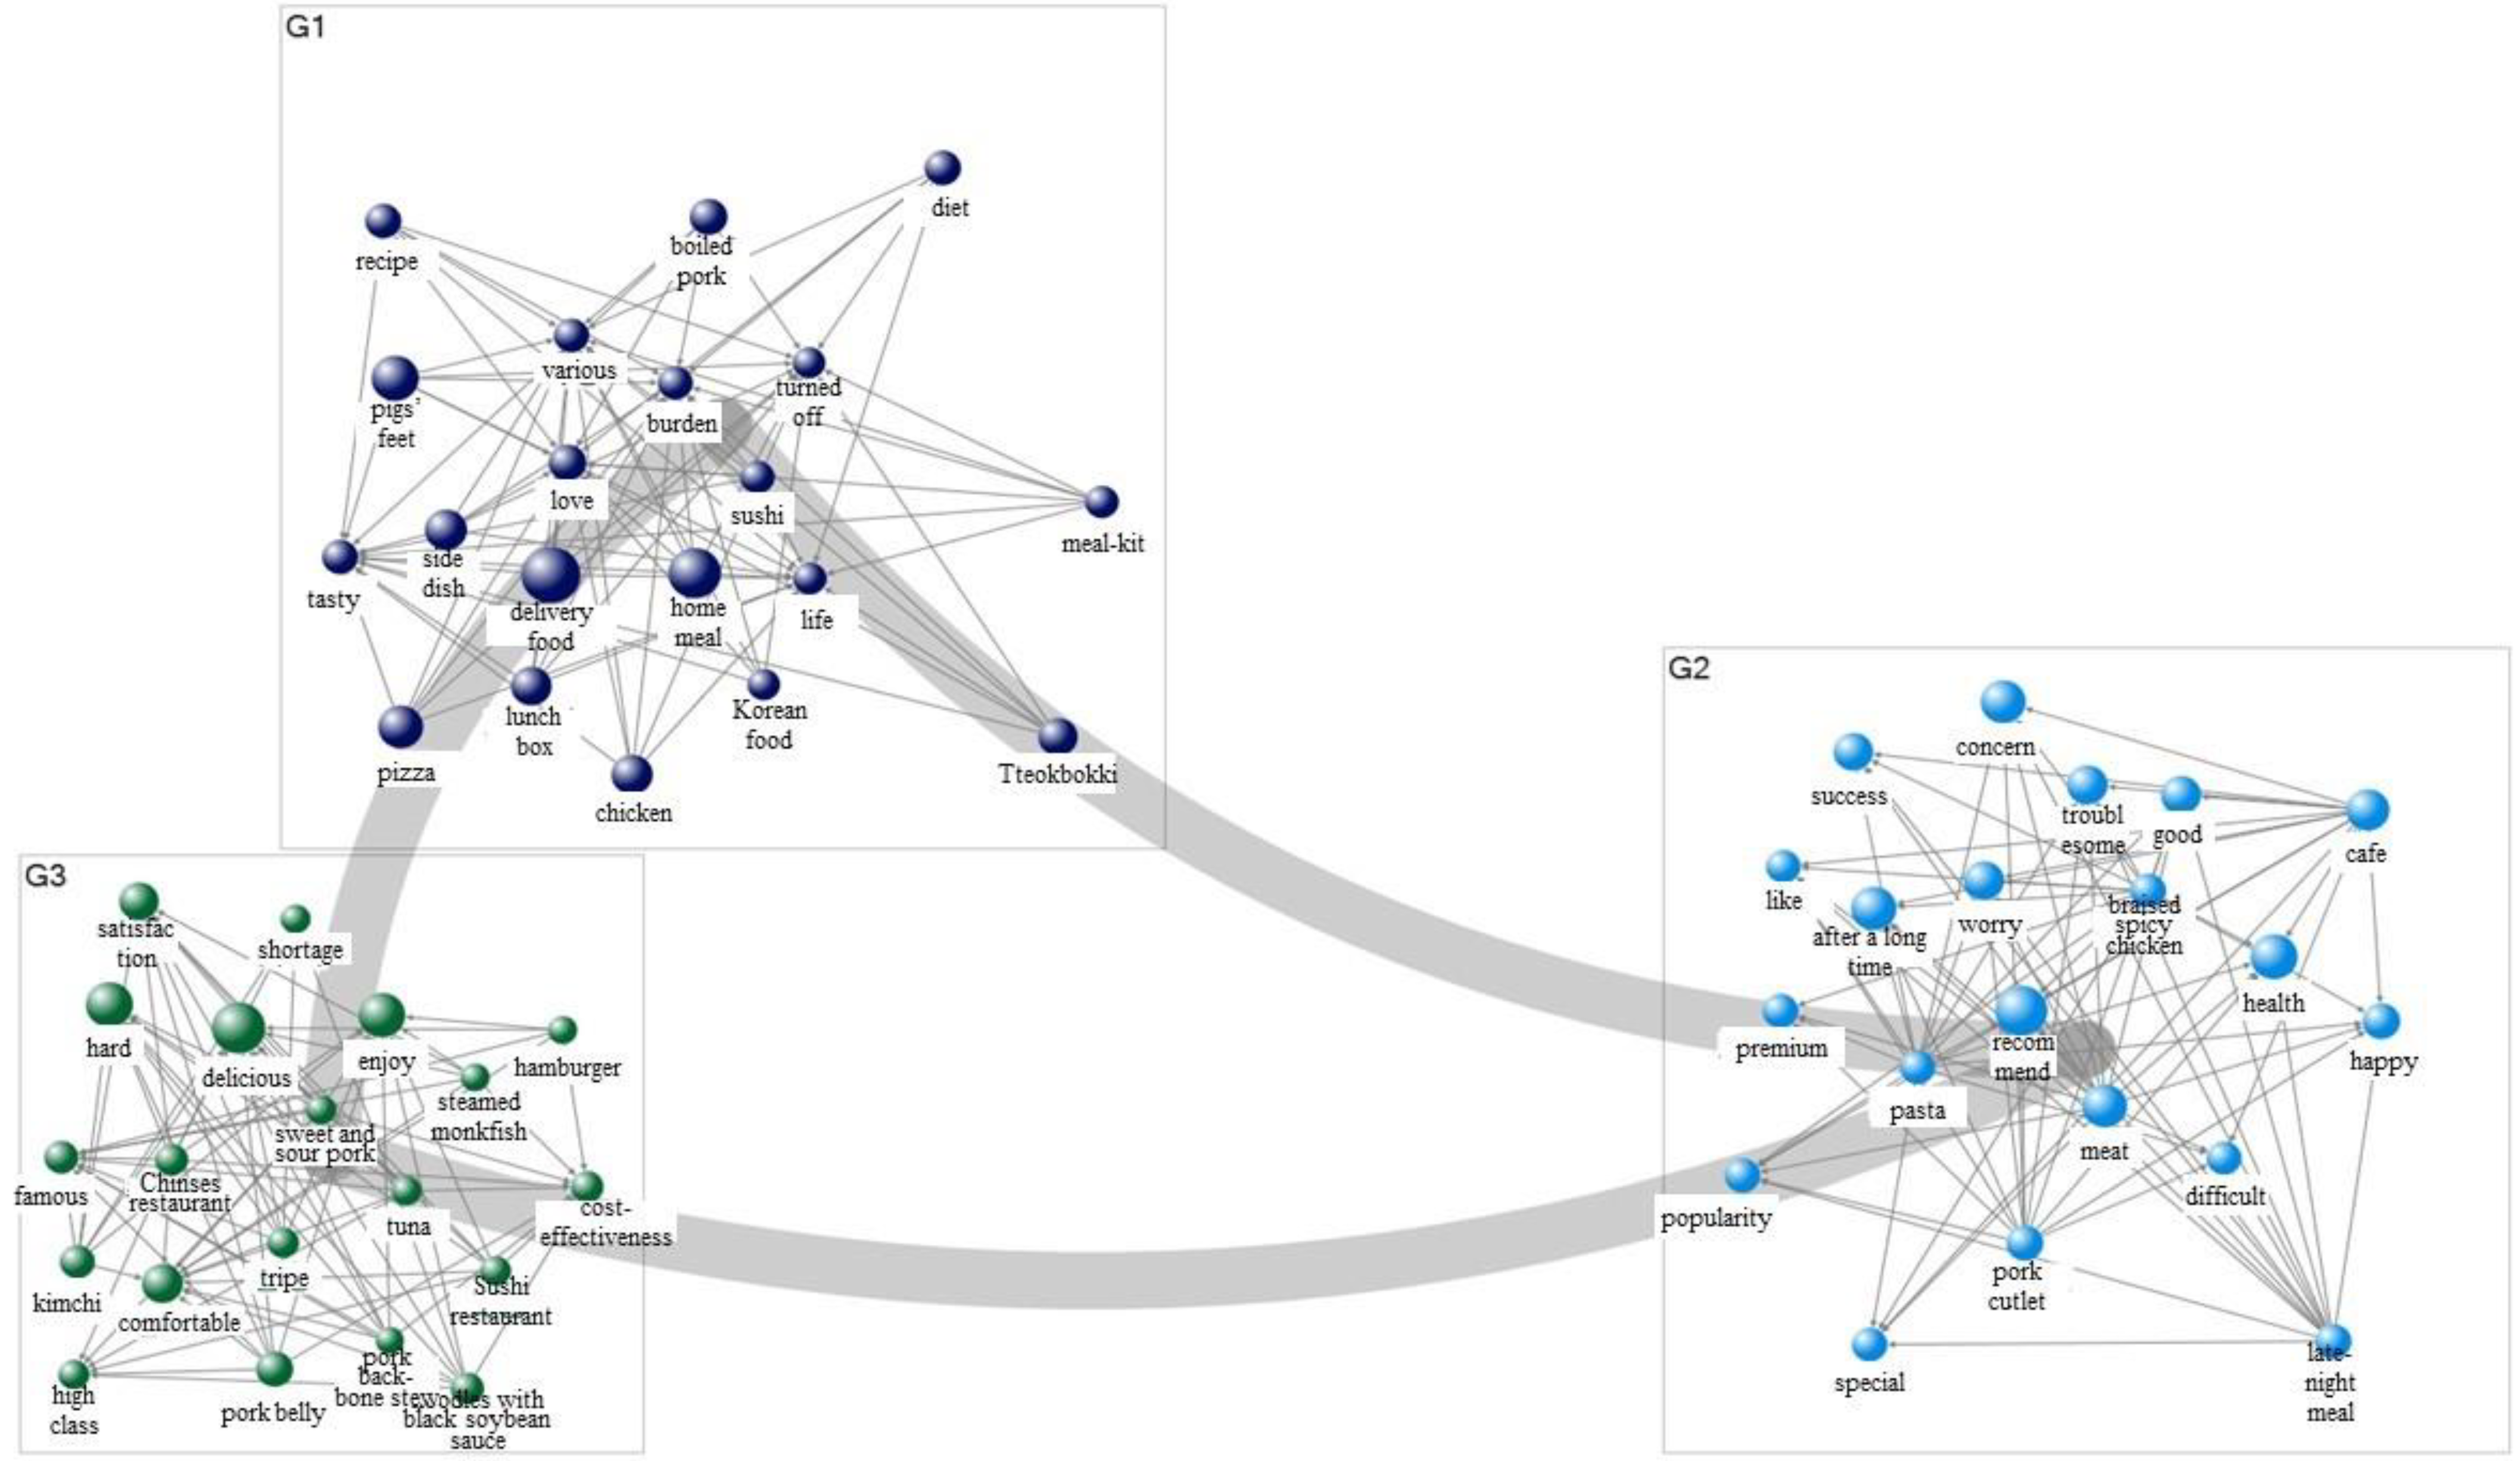
4.3. Sentimental Network Analysis
4.4. Sentiment Analysis
5. Discussion and Implications
6. Limitation and Future Studies
Author Contributions
Funding
Data Availability Statement
Conflicts of Interest
References
- Sadiku, M.N.O.; Ashaolu, T.J.; Ajayi, M.A.; Musa, S.M. Big Data in Food Industry. Int. J. Sci. Adv. 2020, 1, 148–152. [Google Scholar] [CrossRef]
- Kim, E. Network analysis on the recognition of ‘low cost carrier’ using social big data. Int. J. Tour. Manag. Sci. 2019, 34, 263–279. [Google Scholar]
- Wang, Y.; Wang, H.; Xu, H. Understanding the experience and meaning of app-based food delivery from a mobility perspective. Int. J. Hosp. Manag. 2021, 99, 103070. [Google Scholar] [CrossRef]
- Meek, S.; Wilk, V.; Lambert, C. A big data exploration of the informational and normative influences on the helpfulness of online restaurant review. J. Bus. Res. 2021, 125, 354–367. [Google Scholar] [CrossRef]
- Shin, S.; Lee, B. A study on the changes in dine-out consumer behavior to the Spread of COVID-19: An application of topic modeling and semantic network analysis. Korean J. Hosp. Tour. 2021, 30, 71–90. [Google Scholar] [CrossRef]
- Mayasari, N.R.; Ho, D.K.N.; Lundy, D.J.; Skalny, A.V.; Tinkov, A.A.; Teng, I.C.; Wu, M.C.; Faradina, A.; Mohammed, A.Z.M.; Park, J.M.; et al. Impacts of the COVID-19 pandemic on food security and diet-related lifestyle behaviors: An analytical study of Google trends-based query volumes. Nutrients 2020, 12, 3103. [Google Scholar] [CrossRef] [PubMed]
- Yang, Y.; Liu, H.B.; Chen, X. COVID-19 and restaurant demand: Early effects of the pandemic and stay-at-home orders. Int. J. Contemp. Hosp. Manag. 2020, 13, 3809–3834. [Google Scholar] [CrossRef]
- Kim, J.; Kim, J.; Wang, Y. Uncertainty risks and strategic reaction of restaurant firms amid COVID-19: Evidence from China. Int. J. Hosp. Manag. 2021, 92, 102752. [Google Scholar] [CrossRef]
- Sigala, M. Tourism and COVID-19: Impacts and implications for advancing and resetting industry and research. J. Bus. Res. 2020, 117, 312–321. [Google Scholar] [CrossRef]
- Brewer, P.; Sebby, A.G. The effect of online restaurant menus on consumers’ purchase intentions during the COVID-19 pandemic. Int. J. Hosp. Manag. 2021, 94, 102777. [Google Scholar] [CrossRef]
- Bracale, R.; Vaccaro, C.M. Changes in food choice following restrictive measures due to COVID-19. Nutr. Metab. Cardiovasc. 2020, 30, 1423–1426. [Google Scholar] [CrossRef]
- Byrd, K.; Her, E.S.H.; Fan, A.; Almanza, B.; Liu, Y.; Leitch, S. Restaurants and COVID-19: What are consumers’ risk perceptions about restaurant food and its packaging during the pandemic? Int. J. Hosp. Manag. 2021, 94, 102821. [Google Scholar] [CrossRef]
- Yost, E.; Cheng, Y. Customers’ risk perception and dine-out motivation during a pandemic: Insight for the restaurant industry. Int. J. Hosp. Manag. 2021, 95, 102889. [Google Scholar] [CrossRef]
- Dedeoglu, B.B.; Bogan, E. The motivations of visiting upscale restaurants during the COVID-19 pandemic: The role of risk perception and trust in government. Int. J. Hosp. Manag. 2021, 95, 102905. [Google Scholar] [CrossRef]
- Manivannan, P.; Kesavan, D.; Anuradha, M.R.; Vetrivel, V. Impact of COVID-19 on online food delivery industry with reference to operational and revenue parameters. Ugc Care J. 2020, 31, 142–152. [Google Scholar]
- Ministry of Agriculture, Food and Rural Affairs; Korean Agro-Fisheries & Food Trade Corporation. Domestic and International dine-out trends. 2021. Available online: https://www.atfis.or.kr/fip/front/M000000216/board/list.do (accessed on 26 August 2022).
- Shroff, A.; Shah, B.J.; Gajjar, H. Online food delivery research: A systematic literature review. Int. J. Contemp. Hosp. Manag. 2022, 34, 2852–2883. [Google Scholar] [CrossRef]
- Ghose, A.; Han, S.P. Estimating demand for mobile applications in the new economy. Manag. Sci. 2014, 60, 1470–1488. [Google Scholar] [CrossRef]
- Dsouza, D.; Sharma, D. Online food delivery portals during COVID-19 times: An analysis of changing consumer behavior and expectations. Int. J. Innov. Sci. 2021, 13, 218–232. [Google Scholar] [CrossRef]
- Kim, S.R.; Kang, M.M. Big data analysis technology today and the future. Commun. Korean Inst. Inf. Sci. Eng. 2014, 32, 8–17. [Google Scholar]
- Lee, G.T. A study on the consumer perceptions of meal-kits using big data. Int. J. Tour. Hosp. Res. 2021, 35, 227–239. [Google Scholar]
- Lee, K.T.; Lee, K.O. A study on the estimation of consumption expenditure of foodservice customers by machine learning algorithm. Int. J. Tour. Hosp. Res. 2021, 35, 161–173. [Google Scholar]
- Gartner. What is Data and Analytics? Gartner group. 2011. Available online: https://www.gartner.com/en/topics/data-and-analytics (accessed on 26 August 2022).
- Kang, J.W.; Namkung, Y. Understanding consumers’ perceptions of the fresh-food delivery platform service based on big data: Using text mining and semantic network analysis. Korean J. Hosp. Tour. 2021, 30, 37–52. [Google Scholar] [CrossRef]
- Hotho, A.; Nürnberger, A.; Paaβ, G. A brief survey of text mining. LDV Forum 2005, 20, 19–62. [Google Scholar]
- Eklund, P.; Haemmerlé, O. Conceptual structures: Knowledge visualization and reasoning. Proceedings of 16th International Conference on Conceptual Structures, ICCS 2008, Toulouse, France, 7–11 July 2008; Springer: Berlin, Germany, 2008. [Google Scholar]
- Gloor, P.; Diesner, J. Encyclopedia of Social Network Analysis and Mining, 2nd ed.; Springer: Berlin, Germany, 2014; pp. 2350–2355. [Google Scholar]
- Lee, S.S. A content analysis of journal articles using the language network analysis methods. J. Korean Soc. Info. Manag. 2014, 31, 49–68. [Google Scholar]
- Drieger, P. Semantic network analysis as a method for visual text analytics. Proced. Soc. Behav. Sci. 2013, 79, 4–17. [Google Scholar] [CrossRef]
- Han, J.; Ji, Y. An exploratory study to derive a strategy to revitalize tourism metaverse: Focusing on text mining and semantic network analysis. Tour. Leis. Res. 2022, 34, 87–103. [Google Scholar] [CrossRef]
- Park, T.S. A Study on the perception of Ulsan tourism and the promotion plans for the future through the analysis of social big data: Focused on CONCOR analysis methodology. N. Asian Tour. Res. 2020, 16, 109–126. [Google Scholar]
- Van de Kauter, M.; Breesch, D.; Hoste, V. Fine-grained analysis of explicit and implicit sentiment in financial news articles. Expert Syst. Appl. 2015, 42, 4999–5010. [Google Scholar] [CrossRef]
- Jang, K.; Park, S.; Kim, W. Automatic construction of a negative/positive corpus and emotional classification using the internet emotional sign. J. KIISE 2015, 42, 512–521. [Google Scholar] [CrossRef]
- Yun, H.M.; Choi, K.W. A study on restaurant selection attribute & satisfaction using sentiment analysis: Focused on on-line reviews of foreign tourist. Korean J. Hosp. Tour. 2021, 30, 99–117. [Google Scholar]
- Jeong, M.Y.; Choi, K.W. Analysis of major topics for platform services for delivery orders before and after COVID 19 with the use of text mining techniques. Reg. Ind. Rev. 2021, 44, 283–305. [Google Scholar]
- Groves, R.M. Survey Errors and Survey Costs; John Wiley & Sons: Hoboken, NJ, USA, 2004; pp. 1–34. [Google Scholar]
- Lyberg, L.; Weisberg, H. Total Survey Error, a Paradigm for Survey Methodology; Sage Publications: London, UK, 2016; pp. 27–40. [Google Scholar]
- Lim, Y.; Kim, H. A study on the sentiment analysis using big data of hotels online review. Korean J. Hosp. Tour. 2019, 28, 105–123. [Google Scholar] [CrossRef]
- Jeong, C.; Moon, Y.; Hwang, Y.H. Analysis for daily food delivery and consumption trends in the post-covid-19 era through big data. J. Korea Soc. Comp. Inform. 2021, 26, 231–238. [Google Scholar]
- Jung, H.S.; Yoon, H.H.; Song, M.K. A study on dining-out trends using big data: Focusing on changes since COVID-19. Sustainability 2021, 13, 11480. [Google Scholar] [CrossRef]
- Chang, S.J.; Park, J.M.; Kang, J.Y. A study on the effect the infected number of COVID-19 on the number of food deliveries: Focusing on the mediating effect of the national disaster fund and social distancing. J. Int. Trade Commer. 2022, 18, 131–147. [Google Scholar] [CrossRef]
- Statista. eServices Report 2022–Online Food Delivery. Available online: https://www.statista.com/study/40457/food-delivery (accessed on 3 August 2022).
- Sisa Journal. Delivery App ‘Second Territory War’ Started. Available online: http://www.sisajournal.com/news/articleView.html?idxno=237120 (accessed on 18 August 2022).
- Korean Rural Economic Institute. Food Consumption Behavior Research. 2021. Available online: https://www.krei.re.kr/krei/researchReportView.do?key=67&pageType=010101&biblioId=530219 (accessed on 18 August 2022).
- Adak, A.; Pradhan, B.; Shukla, N. Sentiment analysis of customer reviews of food delivery services using deep learning and explainable artificial intelligence: Systematic review. Foods 2022, 11, 1500. [Google Scholar] [CrossRef]
- Ahn, J.Y.; Cho, M.H. Exploring restaurant selection attributes using IPA during the COVID-19 pandemic-focusing on customer age and companion type. J. Hotel Resort 2020, 19, 201–218. [Google Scholar]
- Kim, Y.M.; Lee, S.H.; Ahn, J.H. A brief review on global plastic regulation trends. J. Energy Eng. 2021, 30, 21–25. [Google Scholar]
- Kwak, Y.K.; Jeon, D.H. A study on the effect of environmental consciousness and eco-guilt on pro-environmental behavior of food delivery consumer—A moderating role of eco-guilt. J. Foodserv. Manag. Soc. Korea 2021, 24, 133–157. [Google Scholar] [CrossRef]
- Ko, J.K.; Kong, K.T. Post-Corona, post-plastics. BT NEWS 2021, 28, 16–21. [Google Scholar]
- Mallett, R.K. Eco-guilt motivates eco-friendly behavior. Ecopsychology 2021, 4, 223–231. [Google Scholar] [CrossRef]
- Health Chosun. Is the Delivery Garbage Okay? 2022. Available online: https://health.chosun.com/site/data/html_dir/2022/08/02/2022080201942.html (accessed on 26 August 2022).
- E-daily. Delivery Report-with the Increase in Home Alcohol, Popular Delivery Menu for Late-Night Meals and Snacks. 2022. Available online: https://www.edaily.co.kr/news/read?newsId=01397286628915752&mediaCodeNo=257&OutLnkChk=Y (accessed on 26 August 2022).
- Seoul Economy. Attack of Coupang Mart vs. Expansion of Baemin One Delivery. 2021. Available online: https://www.sedaily.com/NewsView/22OT3QZC8H (accessed on 26 August 2022).
- MBC News. ‘Premium’ Lunch Box Sales Increase Due to COVID-19. 2021. Available online: https://imnews.imbc.com/replay/2021/nwtoday/article/6050414_34943.html (accessed on 26 August 2022).
- Baker, S.R.; Farrokhnia, R.A.; Meyer, S.; Pagel, M.; Yannelis, C. How does household spending respond to an epidemic? Consumption during the 2020 COVID-19 pandemic. Rev. Asset Pricing Stud. 2020, 10, 834–862. [Google Scholar] [CrossRef]

| Data | Channel | Section | 2019 | 2020 |
|---|---|---|---|---|
| Dining out delivery | Naver | Blog | 10,899 | 11,147 |
| Cafe | 11,789 | 11,799 | ||
| Daum | Blog | 9896 | 10,464 | |
| Cafe | 6560 | 5830 |
| Categories | 2019 | 2021 | Total |
|---|---|---|---|
| Food | 320 | 302 | 622 |
| Sentimental | 113 | 107 | 220 |
| Demand | 227 | 255 | 482 |
| Total | 660 | 664 | 1324 |
| Rank | Word | Frequency | TF-IDF | Rank | Word | Frequency | TF-IDF |
|---|---|---|---|---|---|---|---|
| 1 | dining-out | 17,728 | 2460.8147 | 26 | cooking | 1049 | 3177.4030 |
| 2 | delivery | 15,650 | 7038.7212 | 27 | recommend | 1045 | 3117.8618 |
| 3 | famous restaurant | 5742 | 8919.3268 | 28 | lunch box | 897 | 3077.5019 |
| 4 | delivery food | 4869 | 6617.1284 | 29 | application | 877 | 2801.4071 |
| 5 | foundation | 2897 | 9425.7243 | 30 | nowadays | 858 | 2601.9370 |
| 6 | dish | 2632 | 5530.6962 | 31 | make | 828 | 2578.9686 |
| 7 | family | 2501 | 5336.8016 | 32 | franchise | 807 | 2581.2131 |
| 8 | order | 2170 | 4937.2079 | 33 | health | 758 | 2455.0274 |
| 9 | delicious | 2012 | 4666.4444 | 34 | meal | 756 | 2501.4223 |
| 10 | pigs’ feet | 1948 | 6052.3276 | 35 | people | 744 | 2379.7057 |
| 11 | Delivery App. | 1906 | 4881.6736 | 36 | thought | 720 | 2329.8407 |
| 12 | chicken | 1747 | 4782.8242 | 37 | pork cutlet | 717 | 2828.7611 |
| 13 | menu | 1700 | 4300.4077 | 38 | about | 716 | 2340.3397 |
| 14 | side dish | 1660 | 5183.3647 | 39 | today | 712 | 2346.9229 |
| 15 | dinner | 1513 | 3972.9890 | 40 | place | 707 | 2431.9524 |
| 16 | take-out | 1451 | 3878.7284 | 41 | because | 703 | 2270.7254 |
| 17 | food | 1373 | 3911.1928 | 42 | mother | 702 | 2403.5010 |
| 18 | pizza | 1315 | 4213.5058 | 43 | lunch | 681 | 2317.3142 |
| 19 | children | 1288 | 3736.0673 | 44 | time | 677 | 2231.5545 |
| 20 | available | 1260 | 3531.7626 | 45 | tteokbokki | 669 | 2435.0877 |
| 21 | home meal | 1257 | 3488.0423 | 46 | industry | 638 | 2278.9802 |
| 22 | weekend | 1238 | 3477.1712 | 47 | sushi | 637 | 2602.5469 |
| 23 | restaurant | 1216 | 3504.5128 | 48 | everyday | 634 | 2141.1387 |
| 24 | market | 1186 | 3462.7659 | 49 | store | 598 | 2047.4268 |
| 25 | service | 1103 | 3288.4038 | 50 | pay for meal | 580 | 2167.1809 |
| Rank | Word | Frequency | TF-IDF | Rank | Word | Frequency | TF-IDF |
|---|---|---|---|---|---|---|---|
| 1 | dining-out | 22,000 | 3715.7095 | 26 | newspaper | 1262 | 4277.7728 |
| 2 | delivery | 20,540 | 9001.6591 | 27 | virus | 1234 | 3516.0106 |
| 3 | delivery food | 6315 | 8625.8535 | 28 | mask | 1221 | 3482.9667 |
| 4 | famous restaurant | 5258 | 9725.3708 | 29 | all day | 1204 | 3455.3784 |
| 5 | Corona | 4311 | 7673.4030 | 30 | wife | 1198 | 3440.1589 |
| 6 | dish | 2875 | 6049.0050 | 31 | shopping mall | 1192 | 3429.9206 |
| 7 | order | 2623 | 6089.1432 | 32 | simple | 1188 | 3420.4091 |
| 8 | application | 2301 | 5952.7807 | 33 | theater | 1187 | 3423.5401 |
| 9 | family | 2279 | 5552.1404 | 34 | time | 1178 | 3518.1588 |
| 10 | cooking | 2139 | 5739.5662 | 35 | weekend | 1093 | 3494.9615 |
| 11 | home meal | 2053 | 5038.5068 | 36 | pay for meal | 1034 | 3522.4770 |
| 12 | take-out | 2015 | 5191.4708 | 37 | method | 1030 | 3190.3708 |
| 13 | restaurant | 1989 | 4958.4401 | 38 | card | 1020 | 3420.9380 |
| 14 | menu | 1848 | 4811.3006 | 39 | government | 1007 | 3465.5779 |
| 15 | delicious | 1757 | 4663.0262 | 40 | chicken | 1004 | 3403.2360 |
| 16 | nowadays | 1484 | 3978.9307 | 41 | pizza | 966 | 3579.3487 |
| 17 | day | 1473 | 3940.3103 | 42 | pigs’ feet | 935 | 3719.1911 |
| 18 | meal | 1419 | 3907.2500 | 43 | people | 935 | 3047.7806 |
| 19 | because | 1418 | 3854.8458 | 44 | about | 887 | 2908.9693 |
| 20 | dinner | 1412 | 3980.0125 | 45 | support | 881 | 3105.1834 |
| 21 | discount | 1405 | 4576.3637 | 46 | review | 871 | 2851.0424 |
| 22 | foundation | 1342 | 4528.4010 | 47 | side meal | 858 | 3209.3993 |
| 23 | available | 1339 | 3863.0711 | 48 | kitchen | 844 | 3588.7289 |
| 24 | recommend | 1331 | 3926.1170 | 49 | lunch box | 844 | 3279.8804 |
| 25 | Delivery App. | 1318 | 4019.1164 | 50 | children | 839 | 2827.6249 |
| Rank | Word | Degree Centrality | Betweenness Centrality | Closeness Centrality | Page Rank | Group | Category |
|---|---|---|---|---|---|---|---|
| 1 | delicious | 69 | 779.6910 | 0.6635 | 0.0091 | 1 | sentimental |
| 2 | recommend | 65 | 599.7878 | 0.6389 | 0.0087 | 1 | sentimental |
| 3 | health | 53 | 525.5802 | 0.5750 | 0.0086 | 1 | sentimental |
| 4 | troublesome | 62 | 487.4306 | 0.6216 | 0.0085 | 1 | sentimental |
| 5 | hard | 59 | 454.9562 | 0.6053 | 0.0084 | 1 | sentimental |
| 6 | worry | 58 | 433.4342 | 0.6000 | 0.0084 | 1 | sentimental |
| 7 | comfortable | 57 | 408.1512 | 0.5897 | 0.0083 | 1 | sentimental |
| 8 | after a long time | 58 | 399.8882 | 0.6000 | 0.0082 | 1 | sentimental |
| 9 | good | 55 | 397.6608 | 0.5847 | 0.0082 | 1 | sentimental |
| 10 | enjoy | 55 | 367.5925 | 0.5798 | 0.0082 | 1 | sentimental |
| 11 | various | 45 | 243.2623 | 0.5391 | 0.0077 | 1 | sentimental |
| 12 | burden | 44 | 212.2904 | 0.5349 | 0.0076 | 1 | sentimental |
| 13 | special | 40 | 178.1011 | 0.5149 | 0.0075 | 1 | sentimental |
| 14 | soup | 27 | 144.9442 | 0.4742 | 0.0074 | 1 | food |
| 15 | very recommendable | 36 | 132.0809 | 0.5000 | 0.0073 | 1 | sentimental |
| 16 | Chinese food | 33 | 117.9320 | 0.4946 | 0.0072 | 1 | food |
| 17 | Chinese-style noodles | 35 | 116.4590 | 0.5018 | 0.0072 | 1 | food |
| 18 | eating alone | 31 | 114.6448 | 0.4876 | 0.0072 | 1 | food |
| 19 | give up | 32 | 109.8148 | 0.4859 | 0.0072 | 1 | sentimental |
| 20 | seasoning | 33 | 106.4018 | 0.4946 | 0.0071 | 1 | food |
| 21 | delivery food | 66 | 1130.4400 | 0.6479 | 0.0100 | 2 | food |
| 22 | side dish | 61 | 647.2332 | 0.6188 | 0.0088 | 2 | food |
| 23 | home meal | 59 | 612.8303 | 0.6079 | 0.0087 | 2 | food |
| 24 | chicken | 56 | 557.2379 | 0.5923 | 0.0087 | 2 | food |
| 25 | pizza | 52 | 348.0457 | 0.5726 | 0.0080 | 2 | food |
| 26 | boiled pork | 46 | 347.7718 | 0.5455 | 0.0080 | 2 | food |
| 27 | pigs’ feet | 51 | 322.2355 | 0.5679 | 0.0079 | 2 | food |
| 28 | pork cutlet | 40 | 304.2325 | 0.5208 | 0.0079 | 2 | food |
| 29 | like | 45 | 242.3503 | 0.5391 | 0.0077 | 2 | sentimental |
| 30 | late-night meal | 45 | 239.8520 | 0.5412 | 0.0077 | 2 | food |
| 31 | famous | 43 | 211.6894 | 0.5267 | 0.0077 | 2 | sentimental |
| 32 | jackpot | 40 | 200.1806 | 0.5188 | 0.0076 | 2 | sentimental |
| 33 | difficult | 40 | 181.7780 | 0.5149 | 0.0075 | 2 | sentimental |
| 34 | satisfaction | 37 | 154.8277 | 0.5074 | 0.0074 | 2 | sentimental |
| 35 | noodles with black soybean sauce | 33 | 151.5366 | 0.4946 | 0.0073 | 2 | food |
| 36 | Chinese restaurant | 37 | 139.4312 | 0.5092 | 0.0073 | 2 | food |
| 37 | spice stir-fried chicken | 33 | 121.1428 | 0.4946 | 0.0072 | 2 | food |
| 38 | cost-effectiveness | 34 | 115.8721 | 0.4929 | 0.0072 | 2 | sentimental |
| 39 | appreciation | 31 | 114.2020 | 0.4825 | 0.0072 | 2 | sentimental |
| 40 | expensive | 29 | 112.6933 | 0.4792 | 0.0072 | 2 | sentimental |
| 41 | lunch box | 52 | 421.8453 | 0.5726 | 0.0082 | 3 | food |
| 42 | popularity | 46 | 359.4550 | 0.5433 | 0.0082 | 3 | sentimental |
| 43 | love | 50 | 328.6673 | 0.5565 | 0.0081 | 3 | sentimental |
| 44 | meat | 47 | 271.6067 | 0.5498 | 0.0078 | 3 | food |
| 45 | concern | 45 | 264.6603 | 0.5391 | 0.0078 | 3 | sentimental |
| 46 | salad | 38 | 225.6139 | 0.5130 | 0.0076 | 3 | food |
| 47 | diet | 42 | 203.7948 | 0.5287 | 0.0076 | 3 | food |
| 48 | braised spicy chicken with vegetable | 42 | 199.8493 | 0.5287 | 0.0075 | 3 | food |
| 49 | sushi | 40 | 180.7834 | 0.5208 | 0.0075 | 3 | food |
| 50 | pork belly | 41 | 178.7188 | 0.5247 | 0.0074 | 3 | food |
| 51 | success | 38 | 168.5462 | 0.5111 | 0.0074 | 3 | sentimental |
| 52 | tasty | 39 | 163.3918 | 0.5149 | 0.0074 | 3 | sentimental |
| 53 | rib | 35 | 152.2859 | 0.5018 | 0.0073 | 3 | food |
| 54 | turned off | 34 | 133.5861 | 0.4929 | 0.0073 | 3 | sentimental |
| 55 | snack | 26 | 116.2942 | 0.4710 | 0.0072 | 3 | food |
| 56 | weary | 32 | 112.8708 | 0.4894 | 0.0072 | 3 | sentimental |
| 57 | stress | 29 | 95.4819 | 0.4759 | 0.0071 | 3 | sentimental |
| 58 | recipe | 30 | 90.0593 | 0.4842 | 0.0070 | 3 | food |
| 59 | cheese | 31 | 89.1592 | 0.4876 | 0.0070 | 3 | food |
| 60 | life | 28 | 82.1945 | 0.4726 | 0.0070 | 3 | sentimental |
| 61 | Korean food | 35 | 462.6095 | 0.5018 | 0.0085 | 4 | food |
| 62 | happy | 41 | 205.7489 | 0.5227 | 0.0076 | 4 | sentimental |
| 63 | cafe | 31 | 179.1014 | 0.4876 | 0.0075 | 4 | food |
| 64 | busy | 27 | 94.2732 | 0.4726 | 0.0071 | 4 | sentimental |
| 65 | convenient | 23 | 66.6541 | 0.4600 | 0.0069 | 4 | sentimental |
| 66 | tripe | 20 | 36.7552 | 0.4495 | 0.0067 | 4 | food |
| 67 | fastfood | 14 | 28.9633 | 0.4353 | 0.0066 | 4 | food |
| 68 | milk | 8 | 19.5987 | 0.4195 | 0.0066 | 4 | food |
| 69 | wreck | 3 | 2.4792 | 0.3988 | 0.0063 | 4 | sentimental |
| 70 | trust | 3 | 0.5122 | 0.3770 | 0.0062 | 4 | sentimental |
| 71 | disgust | 1 | 0.0000 | 0.3350 | 0.0062 | 4 | sentimental |
| Rank | Word | Degree Centrality | Betweenness Centrality | Closeness Centrality | Page Rank | Group | Category |
|---|---|---|---|---|---|---|---|
| 1 | delivery food | 69 | 966.0612 | 0.6619 | 0.0094 | 1 | food |
| 2 | home meal | 64 | 723.2452 | 0.6318 | 0.0089 | 1 | food |
| 3 | pig’s feet | 56 | 541.5306 | 0.5890 | 0.0085 | 1 | food |
| 4 | pizza | 53 | 459.0090 | 0.5744 | 0.0083 | 1 | food |
| 5 | side dish | 49 | 382.4936 | 0.5560 | 0.0081 | 1 | food |
| 6 | chicken | 49 | 357.2233 | 0.5560 | 0.0080 | 1 | food |
| 7 | lunch box | 48 | 332.2937 | 0.5516 | 0.0079 | 1 | food |
| 8 | tteokbokki | 45 | 298.8448 | 0.5346 | 0.0078 | 1 | food |
| 9 | love | 44 | 256.6650 | 0.5346 | 0.0077 | 1 | sentimental |
| 10 | boiled pork | 42 | 256.4987 | 0.5265 | 0.0077 | 1 | food |
| 11 | diet | 41 | 223.5931 | 0.5226 | 0.0075 | 1 | food |
| 12 | recipe | 38 | 216.0452 | 0.5110 | 0.0076 | 1 | food |
| 13 | tasty | 42 | 214.0068 | 0.5226 | 0.0076 | 1 | sentimental |
| 14 | various | 40 | 195.8671 | 0.5187 | 0.0075 | 1 | sentimental |
| 15 | burden | 41 | 183.9379 | 0.5187 | 0.0074 | 1 | sentimental |
| 16 | sushi | 38 | 173.1633 | 0.5110 | 0.0074 | 1 | food |
| 17 | meal-kit | 39 | 161.6067 | 0.5148 | 0.0073 | 1 | food |
| 18 | life | 36 | 153.8467 | 0.5000 | 0.0073 | 1 | sentimental |
| 19 | Korean food | 33 | 134.7269 | 0.4929 | 0.0072 | 1 | food |
| 20 | turned off | 33 | 132.4612 | 0.4929 | 0.0072 | 1 | sentimental |
| 21 | recommend | 67 | 714.6530 | 0.6495 | 0.0090 | 2 | sentimental |
| 22 | health | 57 | 532.2749 | 0.5940 | 0.0086 | 2 | sentimental |
| 23 | after a long time | 58 | 477.2733 | 0.5991 | 0.0084 | 2 | sentimental |
| 24 | concern | 48 | 466.1040 | 0.5516 | 0.0083 | 2 | sentimental |
| 25 | meat | 53 | 460.5187 | 0.5744 | 0.0083 | 2 | food |
| 26 | cafe | 32 | 410.4856 | 0.4894 | 0.0081 | 2 | food |
| 27 | troublesome | 52 | 339.6440 | 0.5697 | 0.0079 | 2 | sentimental |
| 28 | worry | 52 | 329.4420 | 0.5697 | 0.0079 | 2 | sentimental |
| 29 | good | 51 | 320.8825 | 0.5650 | 0.0079 | 2 | sentimental |
| 30 | success | 43 | 306.5615 | 0.5305 | 0.0080 | 2 | sentimental |
| 31 | happy | 44 | 249.8971 | 0.5346 | 0.0077 | 2 | sentimental |
| 32 | pork cutlet | 41 | 236.5294 | 0.5226 | 0.0076 | 2 | food |
| 33 | late-night meal | 40 | 220.9788 | 0.5187 | 0.0075 | 2 | food |
| 34 | braised spicy chicken with vegetable | 40 | 210.8230 | 0.5187 | 0.0075 | 2 | food |
| 35 | premium | 31 | 209.8911 | 0.4826 | 0.0076 | 2 | sentimental |
| 36 | special | 38 | 200.9281 | 0.5110 | 0.0075 | 2 | sentimental |
| 37 | popularity | 42 | 197.6513 | 0.5265 | 0.0075 | 2 | sentimental |
| 38 | pasta | 39 | 189.1878 | 0.5148 | 0.0074 | 2 | food |
| 39 | difficult | 38 | 185.5199 | 0.5110 | 0.0074 | 2 | sentimental |
| 40 | like | 39 | 178.5465 | 0.5148 | 0.0074 | 2 | sentimental |
| 41 | delicious | 68 | 750.4686 | 0.6557 | 0.0090 | 3 | sentimental |
| 42 | hard | 60 | 533.0064 | 0.6096 | 0.0085 | 3 | sentimental |
| 43 | enjoy | 61 | 516.8716 | 0.6150 | 0.0085 | 3 | sentimental |
| 44 | comfortable | 53 | 344.5655 | 0.5744 | 0.0080 | 3 | sentimental |
| 45 | satisfaction | 49 | 303.8432 | 0.5516 | 0.0079 | 3 | sentimental |
| 46 | pork belly | 41 | 237.3934 | 0.5226 | 0.0076 | 3 | food |
| 47 | Kim-chi | 37 | 187.5835 | 0.5073 | 0.0074 | 3 | food |
| 48 | famous | 38 | 167.2956 | 0.5073 | 0.0074 | 3 | sentimental |
| 49 | Chinese restaurant | 35 | 147.6238 | 0.4964 | 0.0073 | 3 | food |
| 50 | noodles with black soybean sauce | 32 | 146.3486 | 0.4894 | 0.0073 | 3 | food |
| 51 | cost-effectiveness | 34 | 131.0722 | 0.4964 | 0.0072 | 3 | sentimental |
| 52 | tripe | 30 | 113.4425 | 0.4826 | 0.0071 | 3 | food |
| 53 | high class | 29 | 97.0923 | 0.4760 | 0.0071 | 3 | sentimental |
| 54 | sushi restaurant | 28 | 94.6259 | 0.4728 | 0.0070 | 3 | food |
| 55 | sweet and sour pork | 26 | 84.7977 | 0.4696 | 0.0070 | 3 | food |
| 53 | shortage | 25 | 76.9736 | 0.4633 | 0.0070 | 3 | sentimental |
| 57 | tuna | 27 | 75.5461 | 0.4728 | 0.0069 | 3 | food |
| 58 | hamburger | 21 | 64.4993 | 0.4542 | 0.0069 | 3 | food |
| 59 | steamed monkfish | 24 | 58.5209 | 0.4603 | 0.0068 | 3 | food |
| 60 | pork back-bone stew | 20 | 42.9154 | 0.4484 | 0.0067 | 3 | food |
| Rank | Word | Degree Centrality | Betweenness Centrality | Closeness Centrality | Page Rank | Group | Category |
|---|---|---|---|---|---|---|---|
| 1 | delivery food | 67 | 572.8088 | 0.6495 | 0.0086 | 1 | food |
| 2 | pizza | 66 | 540.1352 | 0.6435 | 0.0085 | 1 | food |
| 3 | chicken | 63 | 492.0846 | 0.6261 | 0.0084 | 1 | food |
| 4 | pigs’ feet | 60 | 453.8836 | 0.6096 | 0.0083 | 1 | food |
| 5 | café | 60 | 424.7494 | 0.6096 | 0.0082 | 1 | food |
| 6 | lunch box | 60 | 422.3267 | 0.6096 | 0.0082 | 1 | food |
| 7 | tteokbokki | 49 | 259.5794 | 0.5560 | 0.0077 | 1 | food |
| 8 | late-night meal | 50 | 256.0452 | 0.5605 | 0.0077 | 1 | food |
| 9 | pork cutlet | 49 | 237.7509 | 0.5560 | 0.0076 | 1 | food |
| 10 | Korean food | 45 | 226.8937 | 0.5388 | 0.0076 | 1 | food |
| 11 | pork belly | 46 | 217.5030 | 0.5430 | 0.0076 | 1 | food |
| 12 | cost | 46 | 202.7864 | 0.5430 | 0.0075 | 1 | demand |
| 13 | boiled pork | 46 | 193.5608 | 0.5430 | 0.0075 | 1 | food |
| 14 | franchise | 45 | 183.0568 | 0.5388 | 0.0075 | 1 | demand |
| 15 | expense | 40 | 146.7131 | 0.5187 | 0.0073 | 1 | demand |
| 16 | meat restaurant | 36 | 131.8916 | 0.5036 | 0.0072 | 1 | food |
| 17 | go out | 39 | 124.9139 | 0.5148 | 0.0072 | 1 | demand |
| 18 | review | 38 | 114.0789 | 0.5110 | 0.0072 | 1 | demand |
| 19 | soup | 34 | 108.8485 | 0.4964 | 0.0071 | 1 | food |
| 20 | take out | 35 | 99.9595 | 0.5000 | 0.0071 | 1 | demand |
| 21 | delivery | 70 | 534.3241 | 0.6683 | 0.0086 | 2 | demand |
| 22 | menu | 67 | 450.0020 | 0.6495 | 0.0083 | 2 | demand |
| 23 | packing | 66 | 441.7215 | 0.6435 | 0.0083 | 2 | demand |
| 24 | order | 65 | 419.4226 | 0.6376 | 0.0083 | 2 | demand |
| 25 | restaurant | 64 | 401.8859 | 0.6318 | 0.0082 | 2 | demand |
| 26 | service | 57 | 315.4035 | 0.5940 | 0.0080 | 2 | demand |
| 27 | get together | 58 | 307.2211 | 0.5991 | 0.0079 | 2 | demand |
| 28 | visit | 57 | 302.9679 | 0.5940 | 0.0079 | 2 | demand |
| 29 | price | 55 | 287.5788 | 0.5840 | 0.0078 | 2 | demand |
| 30 | eating alone | 51 | 284.4426 | 0.5650 | 0.0078 | 2 | food |
| 31 | store | 56 | 277.8611 | 0.5890 | 0.0078 | 2 | demand |
| 32 | meeting | 54 | 255.1113 | 0.5792 | 0.0078 | 2 | demand |
| 33 | dietary | 48 | 230.8308 | 0.5516 | 0.0077 | 2 | demand |
| 34 | application | 49 | 203.3346 | 0.5560 | 0.0075 | 2 | demand |
| 35 | snack | 40 | 151.8706 | 0.5187 | 0.0073 | 2 | food |
| 36 | steak | 36 | 130.3094 | 0.5036 | 0.0072 | 2 | food |
| 37 | noodles with black soybean sauce | 36 | 123.2655 | 0.5036 | 0.0072 | 2 | food |
| 38 | discount | 38 | 118.4187 | 0.5110 | 0.0072 | 2 | demand |
| 39 | salad | 36 | 110.4815 | 0.5036 | 0.0071 | 2 | food |
| 40 | cheese | 37 | 103.9468 | 0.5073 | 0.0071 | 2 | food |
| 41 | dining-out | 70 | 534.3241 | 0.6683 | 0.0086 | 3 | demand |
| 42 | review | 67 | 456.3244 | 0.6495 | 0.0084 | 3 | demand |
| 43 | Delivery App. | 67 | 456.0833 | 0.6495 | 0.0084 | 3 | demand |
| 44 | home meal | 60 | 421.0417 | 0.6096 | 0.0082 | 3 | food |
| 45 | side dish | 57 | 385.6745 | 0.5940 | 0.0081 | 3 | food |
| 46 | solution | 54 | 264.1623 | 0.5792 | 0.0078 | 3 | demand |
| 47 | diet | 49 | 251.8059 | 0.5560 | 0.0077 | 3 | food |
| 48 | meat | 48 | 241.8891 | 0.5516 | 0.0076 | 3 | food |
| 49 | picture | 49 | 218.3996 | 0.5560 | 0.0076 | 3 | demand |
| 50 | needs | 48 | 214.8628 | 0.5516 | 0.0076 | 3 | demand |
| 51 | pasta | 42 | 181.6945 | 0.5265 | 0.0074 | 3 | food |
| 52 | refrigerator | 42 | 171.5882 | 0.5265 | 0.0074 | 3 | demand |
| 53 | pork | 39 | 161.2623 | 0.5148 | 0.0073 | 3 | food |
| 54 | tuna | 39 | 147.5488 | 0.5148 | 0.0073 | 3 | food |
| 55 | rib | 38 | 139.0739 | 0.5110 | 0.0073 | 3 | food |
| 56 | food | 35 | 135.3335 | 0.5000 | 0.0073 | 3 | food |
| 57 | dual income | 38 | 131.5006 | 0.5110 | 0.0072 | 3 | demand |
| 58 | recipe | 35 | 128.5534 | 0.5000 | 0.0072 | 3 | food |
| 59 | braised spicy chicken with vegetable | 38 | 127.8181 | 0.5110 | 0.0072 | 3 | food |
| 60 | pay for meal | 36 | 127.6059 | 0.5036 | 0.0072 | 3 | demand |
| Rank | Word | Degree Centrality | Betweenness Centrality | Closeness Centrality | Page Rank | Group | Category |
|---|---|---|---|---|---|---|---|
| 1 | delivery food | 70 | 707.5897 | 0.6683 | 0.0090 | 1 | food |
| 2 | café | 63 | 543.0791 | 0.6261 | 0.0086 | 1 | food |
| 3 | home meal | 67 | 541.9647 | 0.6495 | 0.0085 | 1 | food |
| 4 | pizza | 66 | 531.5487 | 0.6435 | 0.0085 | 1 | food |
| 5 | chicken | 64 | 501.3976 | 0.6318 | 0.0085 | 1 | food |
| 6 | side dish | 58 | 386.0474 | 0.5991 | 0.0081 | 1 | food |
| 7 | pigs’ feet | 56 | 342.5173 | 0.5890 | 0.0080 | 1 | food |
| 8 | control | 53 | 245.2746 | 0.5744 | 0.0077 | 1 | demand |
| 9 | coffee | 46 | 221.7373 | 0.5430 | 0.0076 | 1 | food |
| 10 | pay for meal | 50 | 202.2793 | 0.5605 | 0.0076 | 1 | demand |
| 11 | meat | 46 | 185.0275 | 0.5430 | 0.0074 | 1 | food |
| 12 | dietary | 42 | 168.3363 | 0.5265 | 0.0074 | 1 | demand |
| 13 | snack | 43 | 165.7079 | 0.5305 | 0.0074 | 1 | food |
| 14 | kimchi | 44 | 162.0725 | 0.5346 | 0.0074 | 1 | food |
| 15 | salad | 45 | 156.7380 | 0.5388 | 0.0073 | 1 | food |
| 16 | expense | 43 | 155.4117 | 0.5305 | 0.0074 | 1 | demand |
| 17 | household accounts | 42 | 153.8515 | 0.5265 | 0.0074 | 1 | demand |
| 18 | discount | 44 | 149.6842 | 0.5346 | 0.0073 | 1 | demand |
| 19 | diet | 44 | 145.3571 | 0.5346 | 0.0073 | 1 | food |
| 20 | cheese | 40 | 143.5491 | 0.5187 | 0.0073 | 1 | food |
| 21 | review | 65 | 384.8104 | 0.6376 | 0.0082 | 2 | demand |
| 22 | order | 65 | 364.3533 | 0.6376 | 0.0081 | 2 | demand |
| 23 | lunch box | 55 | 297.3764 | 0.5840 | 0.0079 | 2 | food |
| 24 | late-night meal | 52 | 295.7392 | 0.5697 | 0.0079 | 2 | food |
| 25 | review | 55 | 248.6211 | 0.5840 | 0.0077 | 2 | demand |
| 26 | pasta | 47 | 199.0195 | 0.5472 | 0.0075 | 2 | food |
| 27 | visit | 50 | 197.2686 | 0.5605 | 0.0075 | 2 | demand |
| 28 | store | 50 | 195.4957 | 0.5605 | 0.0075 | 2 | demand |
| 29 | tteokbokki | 46 | 195.2880 | 0.5430 | 0.0075 | 2 | food |
| 30 | picture | 48 | 181.6599 | 0.5516 | 0.0075 | 2 | demand |
| 31 | sushi | 47 | 178.4888 | 0.5472 | 0.0074 | 2 | food |
| 32 | solution | 46 | 174.0137 | 0.5430 | 0.0074 | 2 | demand |
| 33 | Korean food | 44 | 171.8316 | 0.5346 | 0.0074 | 2 | food |
| 34 | pork belly | 44 | 159.9473 | 0.5346 | 0.0073 | 2 | food |
| 35 | Coupang | 44 | 151.4921 | 0.5346 | 0.0074 | 2 | demand |
| 36 | service | 44 | 146.5707 | 0.5346 | 0.0073 | 2 | demand |
| 37 | tripe | 39 | 139.7588 | 0.5148 | 0.0073 | 2 | food |
| 38 | pork cutlet | 40 | 133.7829 | 0.5187 | 0.0072 | 2 | food |
| 39 | meal kit | 36 | 131.5995 | 0.5036 | 0.0072 | 2 | food |
| 40 | go out | 42 | 130.4347 | 0.5265 | 0.0073 | 2 | demand |
| 41 | delivery | 70 | 601.6503 | 0.6683 | 0.0089 | 3 | demand |
| 42 | dining-out | 70 | 601.6503 | 0.6683 | 0.0089 | 3 | demand |
| 43 | Corona | 69 | 531.9884 | 0.6619 | 0.0086 | 3 | demand |
| 44 | take-out | 67 | 463.9959 | 0.6495 | 0.0084 | 3 | demand |
| 45 | restaurant | 65 | 413.1690 | 0.6376 | 0.0083 | 3 | demand |
| 46 | menu | 67 | 408.8245 | 0.6495 | 0.0082 | 3 | demand |
| 47 | Delivery App. | 63 | 332.5025 | 0.6261 | 0.0080 | 3 | demand |
| 48 | price | 59 | 292.2321 | 0.6043 | 0.0079 | 3 | demand |
| 49 | posting | 52 | 220.9994 | 0.5697 | 0.0076 | 3 | demand |
| 50 | braised spicy chicken with vegetable | 38 | 132.9270 | 0.5110 | 0.0073 | 3 | food |
| 51 | recipe | 34 | 91.1516 | 0.4964 | 0.0070 | 3 | food |
| 52 | beef | 34 | 89.9571 | 0.4964 | 0.0070 | 3 | food |
| 53 | pork back-bone stew | 31 | 83.7920 | 0.4860 | 0.0070 | 3 | food |
| 54 | pork | 33 | 78.7854 | 0.4929 | 0.0070 | 3 | food |
| 55 | dumpling | 30 | 70.0121 | 0.4826 | 0.0069 | 3 | food |
| 56 | cold noodles | 29 | 64.8984 | 0.4793 | 0.0069 | 3 | food |
| 57 | noodles with black soybean sauce | 27 | 64.3713 | 0.4728 | 0.0069 | 3 | food |
| 58 | sausage soup | 27 | 62.4482 | 0.4728 | 0.0068 | 3 | food |
| 59 | hamburger | 28 | 58.6885 | 0.4760 | 0.0068 | 3 | food |
| 60 | bulgogi | 28 | 55.1264 | 0.4760 | 0.0068 | 3 | food |
| 61 | tuna | 28 | 52.5336 | 0.4760 | 0.0068 | 3 | food |
| 62 | eel | 24 | 46.1091 | 0.4633 | 0.0067 | 3 | food |
| 63 | pork rib | 26 | 45.4708 | 0.4696 | 0.0067 | 3 | food |
| 64 | bar | 23 | 39.1435 | 0.4603 | 0.0067 | 3 | food |
| 65 | sushi restaurant | 25 | 38.7752 | 0.4664 | 0.0067 | 3 | food |
| 66 | application | 56 | 260.6288 | 0.5890 | 0.0078 | 4 | demand |
| 67 | Chinese restaurant | 42 | 164.4834 | 0.5265 | 0.0074 | 4 | food |
| 68 | steamed monkfish | 29 | 62.3813 | 0.4793 | 0.0069 | 4 | food |
| 69 | event | 26 | 48.7479 | 0.4696 | 0.0068 | 4 | demand |
| 70 | curry | 21 | 24.8492 | 0.4542 | 0.0066 | 4 | food |
| 71 | request | 10 | 4.6884 | 0.4238 | 0.0063 | 4 | demand |
| 2019 | 2021 | Increase or Decrease | |
|---|---|---|---|
| Positive word | 75.64 | 72.79 | −2.85% |
| Negative word | 24.36 | 27.21 | +2.85% |
| Frequency | Sentiment Intensity (%) | Frequency Percentage | |
|---|---|---|---|
| good feeling | 12030 | 62.41 | 61.37 |
| joy | 1208 | 5.69 | 6.16 |
| interest | 1589 | 8.02 | 8.11 |
| Positive total | 14,827 | 76.12 | 75.64 |
| sadness | 1319 | 5.84 | 6.73 |
| disgust | 2780 | 15.19 | 14.18 |
| fear | 287 | 1.09 | 1.46 |
| pain | 252 | 1.04 | 1.29 |
| anger | 98 | 0.49 | 0.50 |
| fright | 39 | 0.24 | 0.20 |
| Negative total | 4775 | 23.89 | 24.36 |
| Total | 19,602 | 19,602 | 100.00 |
| Frequency | Sentiment Intensity (%) | Frequency Percentage | |
|---|---|---|---|
| good feeling | 12877 | 63.82 | 60.50 |
| joy | 1653 | 7.93 | 7.77 |
| interest | 963 | 4.27 | 4.52 |
| Positive total | 15,493 | 76.02 | 72.79 |
| sadness | 1661 | 6.05 | 7.80 |
| disgust | 2640 | 12.19 | 12.40 |
| fear | 625 | 1.7 | 2.94 |
| pain | 569 | 2.57 | 2.67 |
| anger | 176 | 0.76 | 0.83 |
| fright | 121 | 0.71 | 0.57 |
| Negative total | 5792 | 23.98 | 27.21 |
| Total | 21,285 | 21,285 | 100.00 |
Publisher’s Note: MDPI stays neutral with regard to jurisdictional claims in published maps and institutional affiliations. |
© 2022 by the authors. Licensee MDPI, Basel, Switzerland. This article is an open access article distributed under the terms and conditions of the Creative Commons Attribution (CC BY) license (https://creativecommons.org/licenses/by/4.0/).
Share and Cite
Jang, J.; Lee, E.; Jung, H. Analysis of Food Delivery Using Big Data: Comparative Study before and after COVID-19. Foods 2022, 11, 3029. https://doi.org/10.3390/foods11193029
Jang J, Lee E, Jung H. Analysis of Food Delivery Using Big Data: Comparative Study before and after COVID-19. Foods. 2022; 11(19):3029. https://doi.org/10.3390/foods11193029
Chicago/Turabian StyleJang, Jina, Eunjung Lee, and Hyosun Jung. 2022. "Analysis of Food Delivery Using Big Data: Comparative Study before and after COVID-19" Foods 11, no. 19: 3029. https://doi.org/10.3390/foods11193029
APA StyleJang, J., Lee, E., & Jung, H. (2022). Analysis of Food Delivery Using Big Data: Comparative Study before and after COVID-19. Foods, 11(19), 3029. https://doi.org/10.3390/foods11193029