
Prediction of Tea Polyphenols, Free Amino Acids and Caffeine Content in Tea Leaves during Wilting and Fermentation Using Hyperspectral Imaging

Abstract
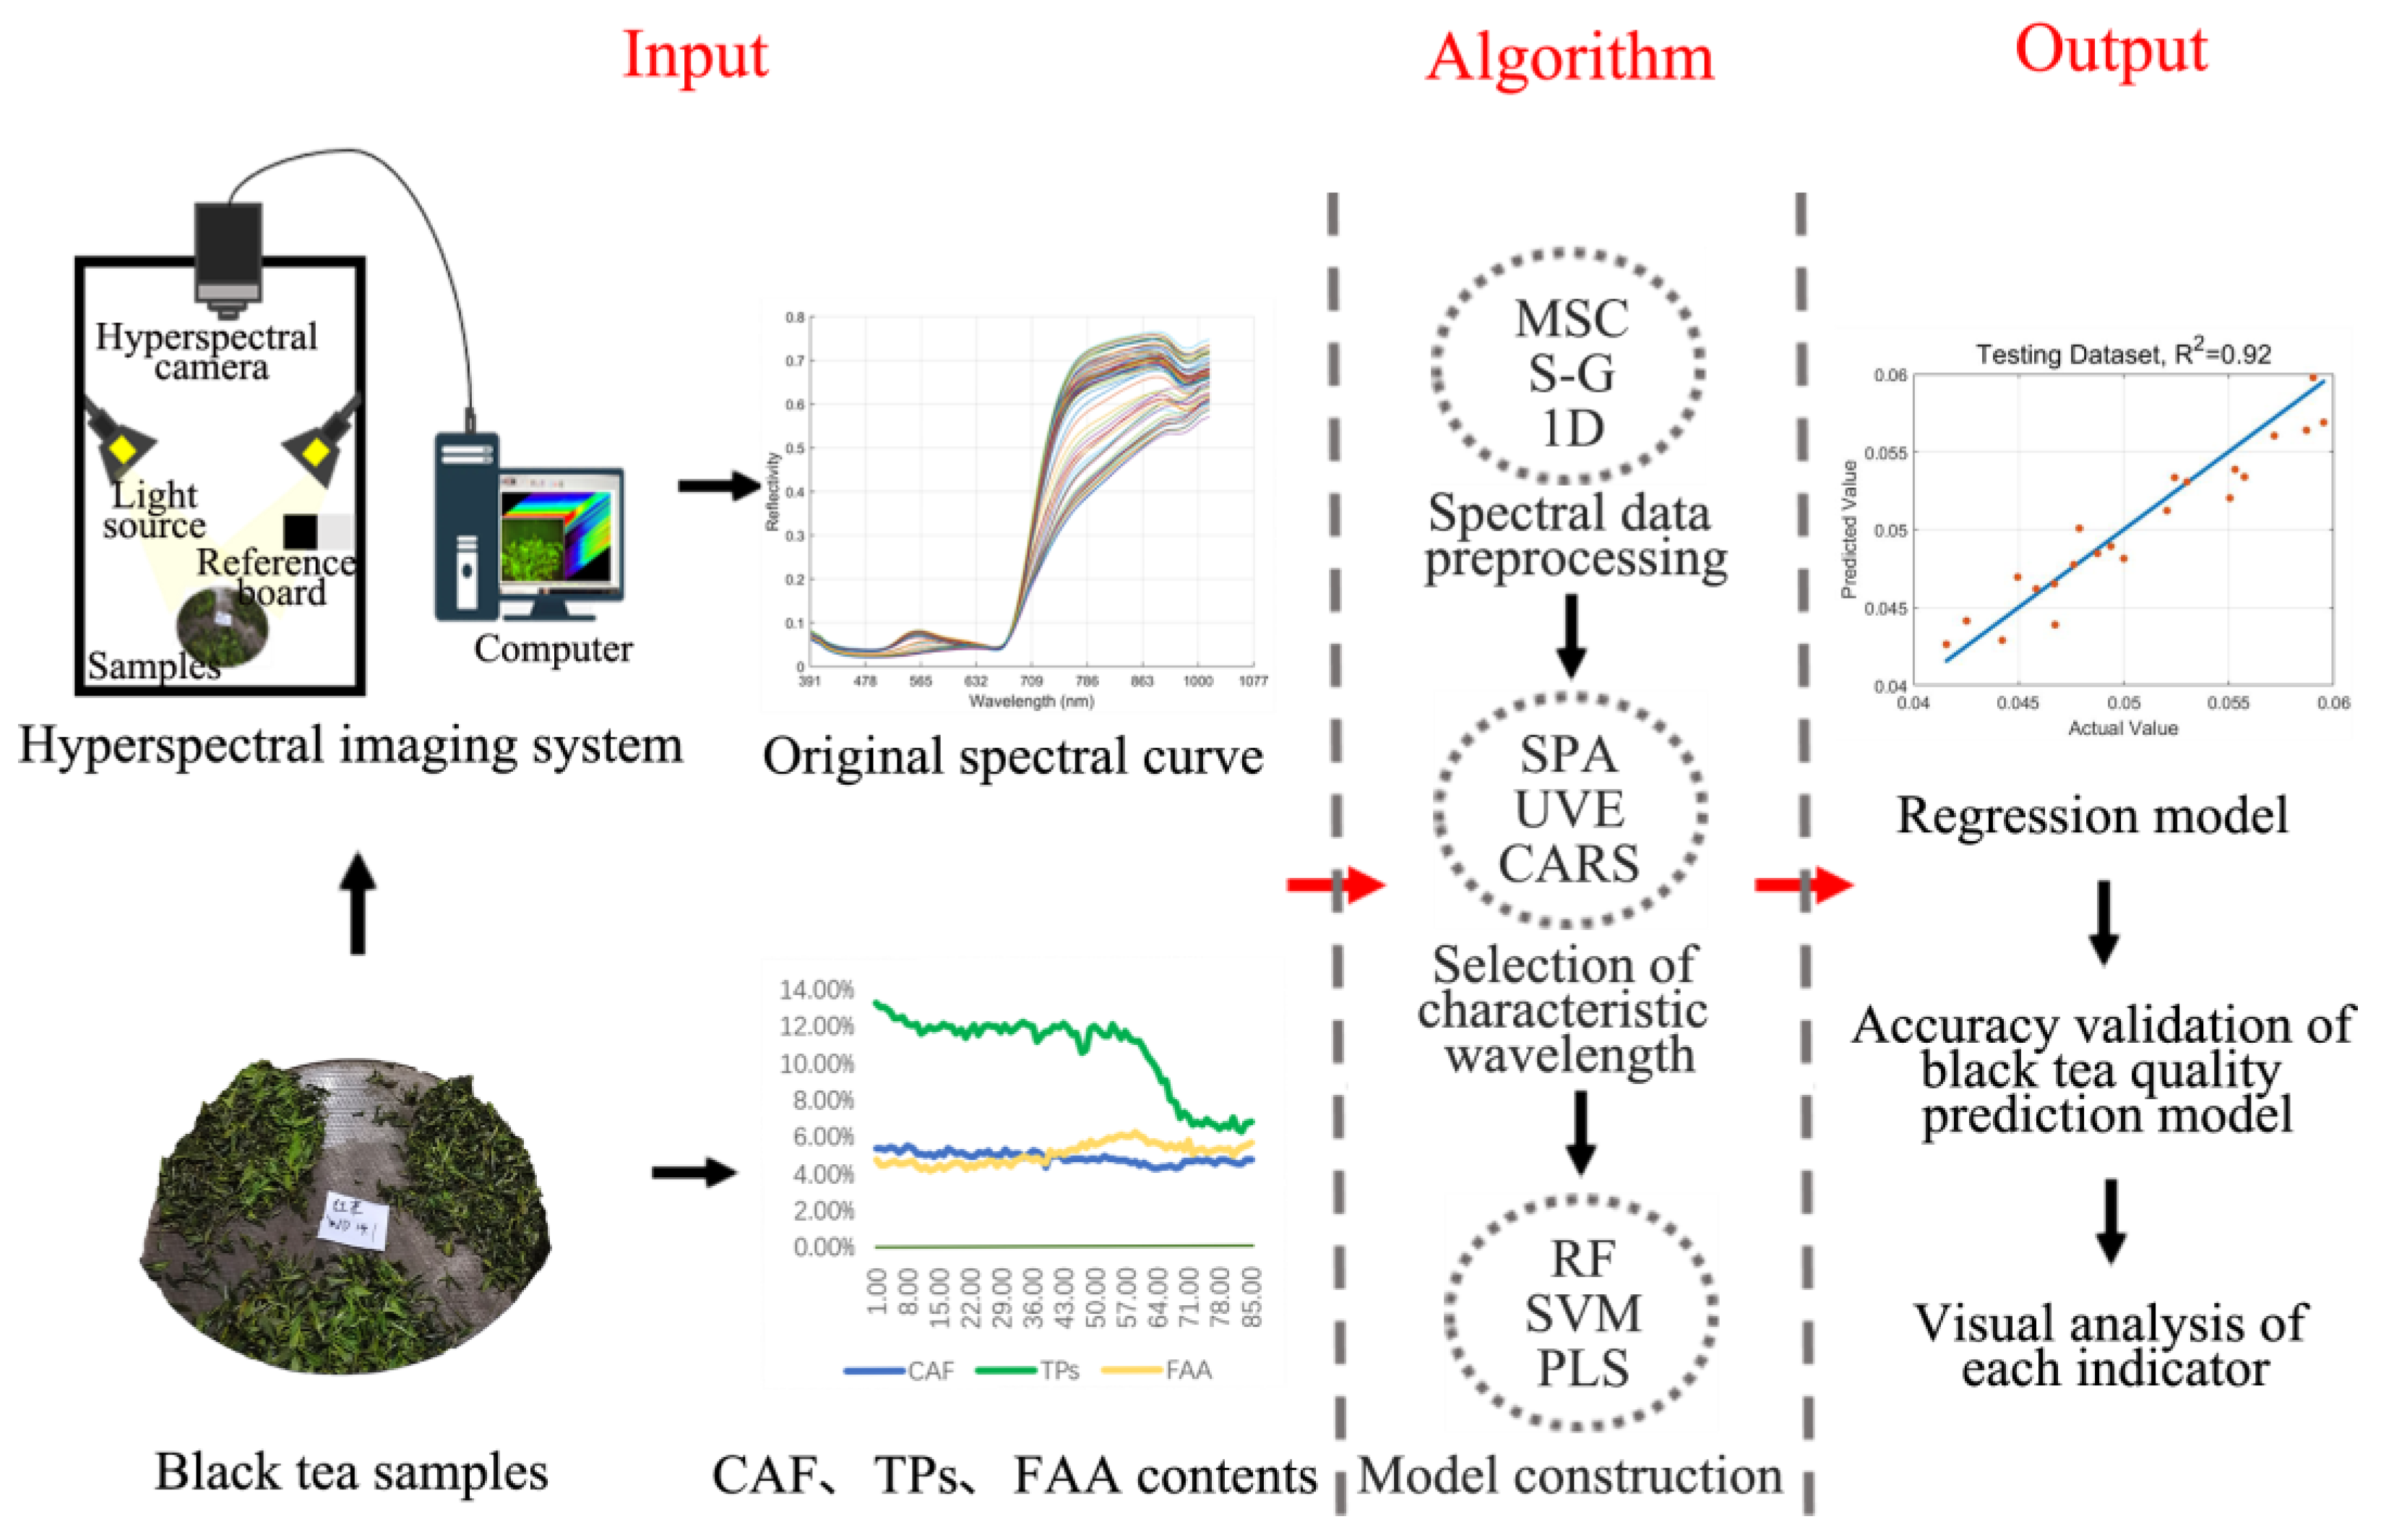
:1. Introduction
2. Materials and Methods
2.1. Experimental Design
2.2. Data Acquisition
2.2.1. Determination of the Contents of TPs, FAA, and CAF
2.2.2. Acquisition and Correction of Hyperspectral Data
2.3. Data Acquisition
2.4. Preprocessing Methods of Spectral Data
2.5. Feature Band Extraction
2.6. Model Construction and Accuracy Verification
3. Results and Discussion
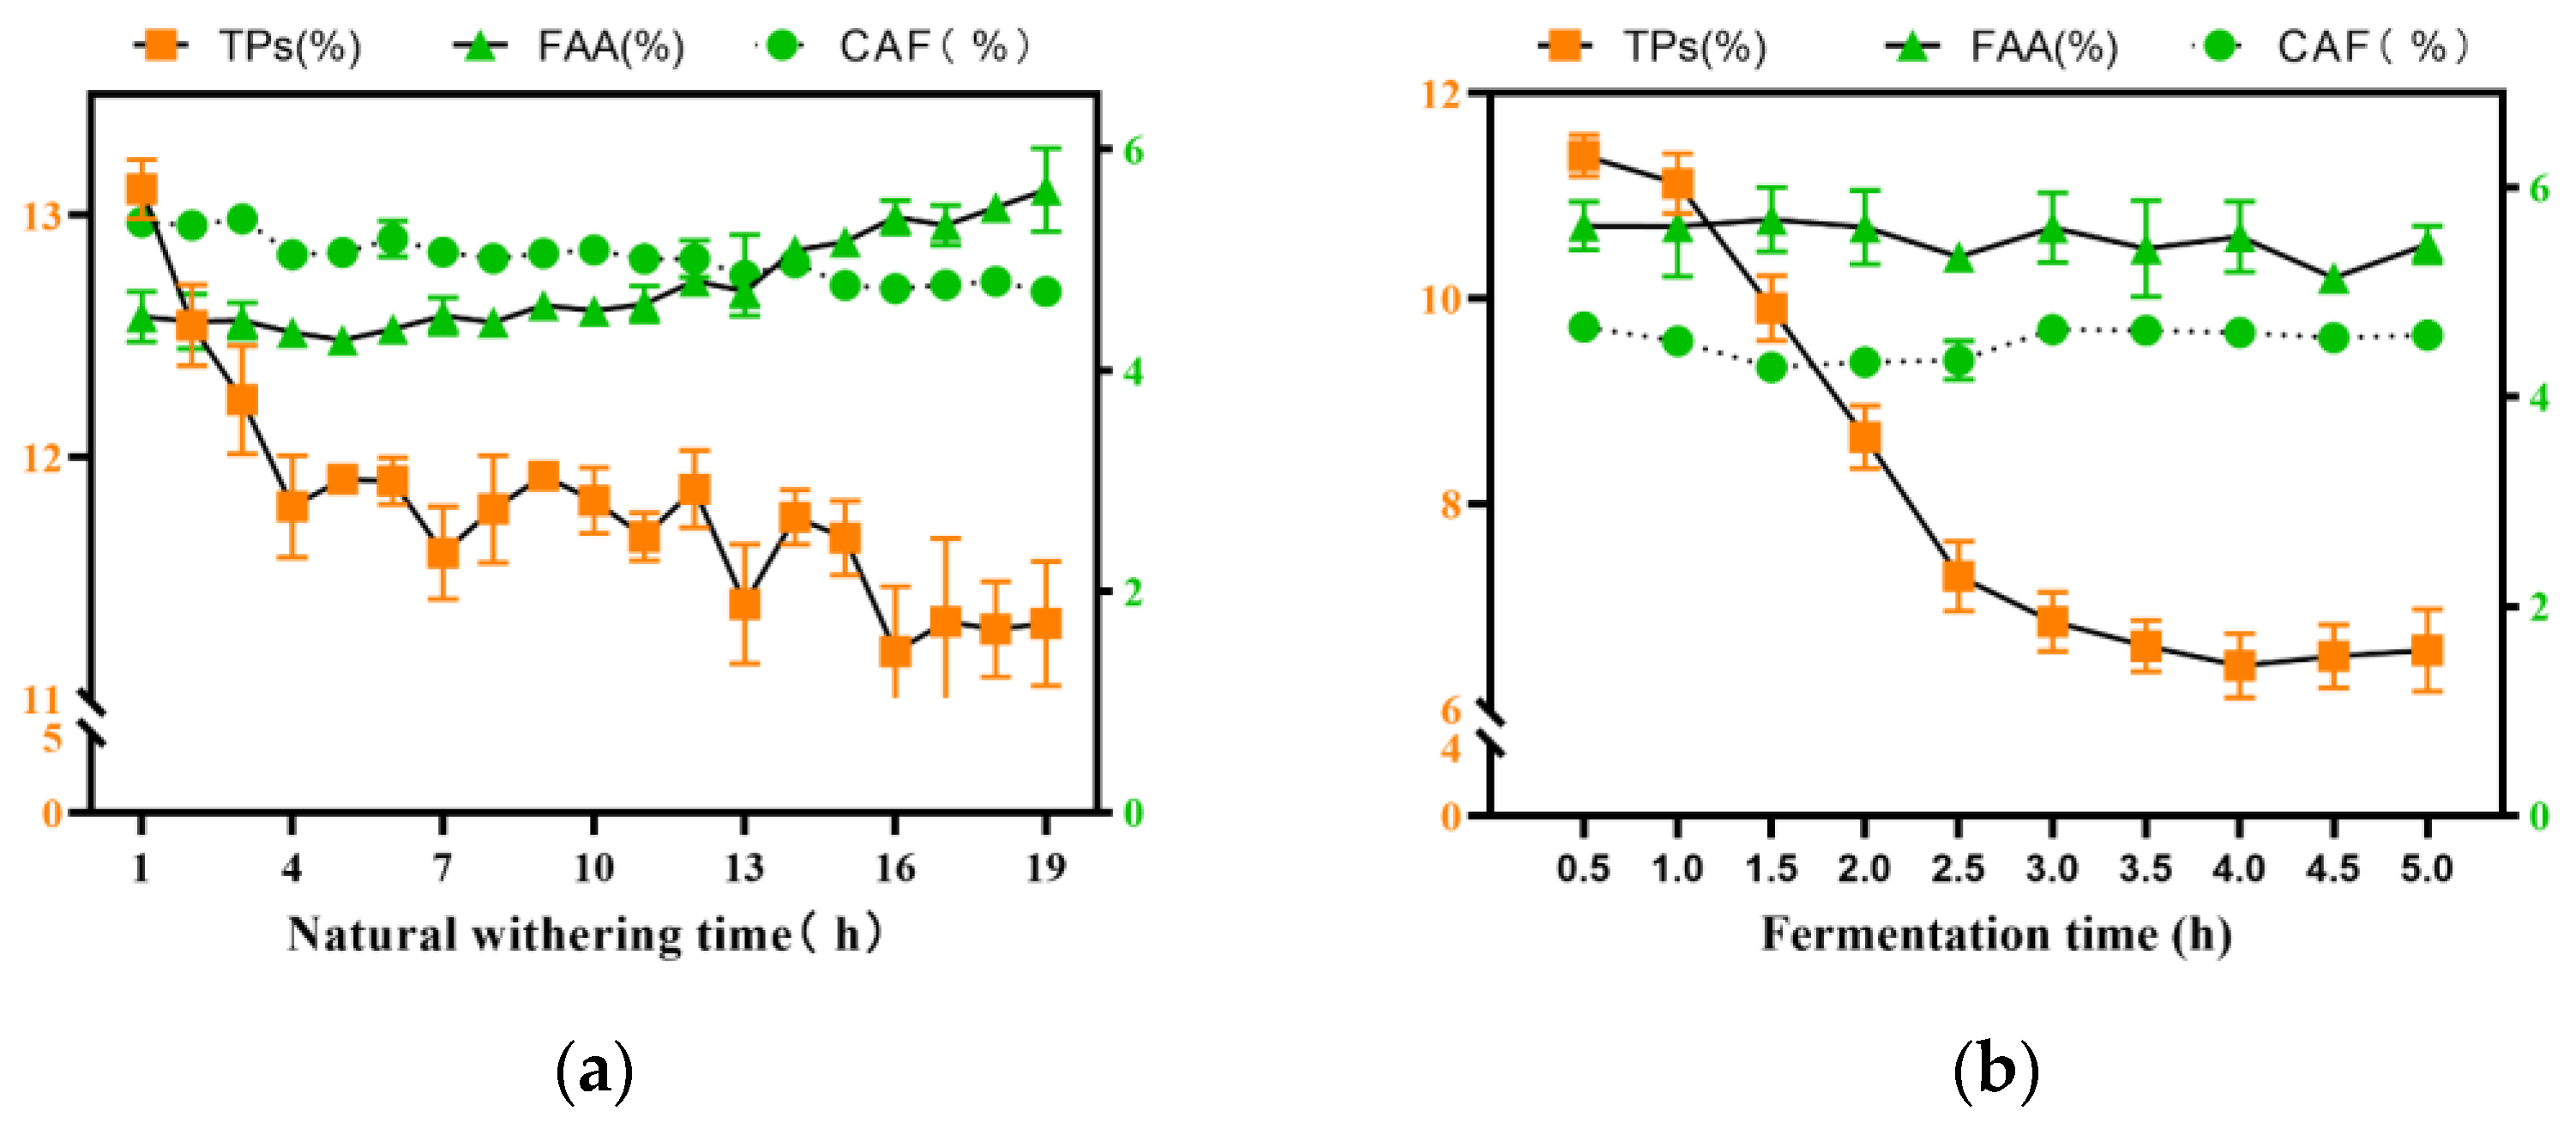
3.1. Analysis of Quality Components
3.2. Division of Modeling Sample Set
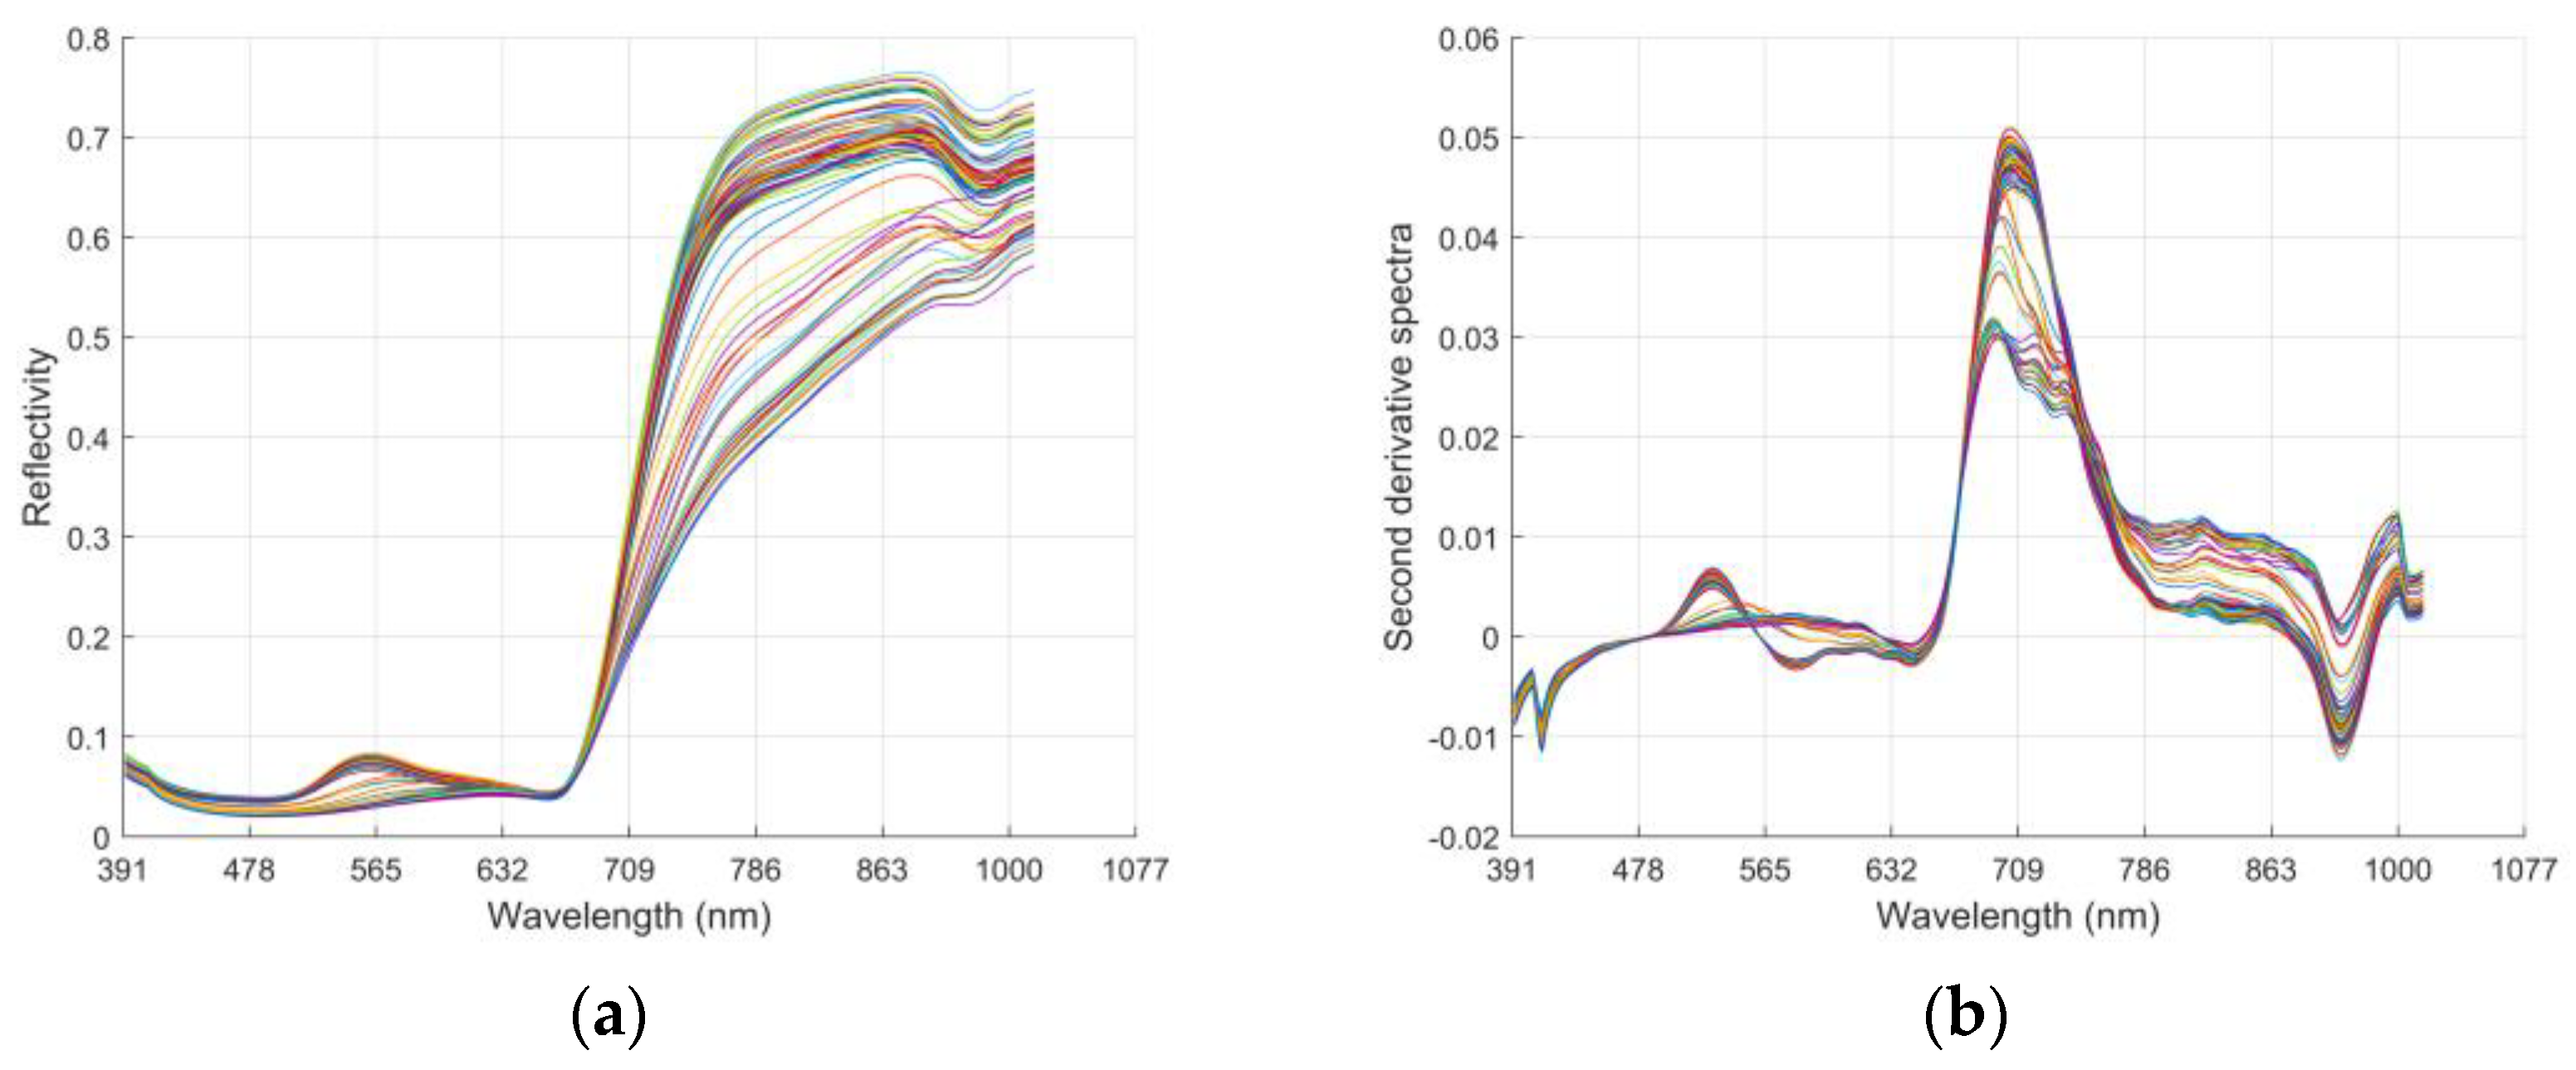
3.3. Preprocessing of Hyperspectral Data
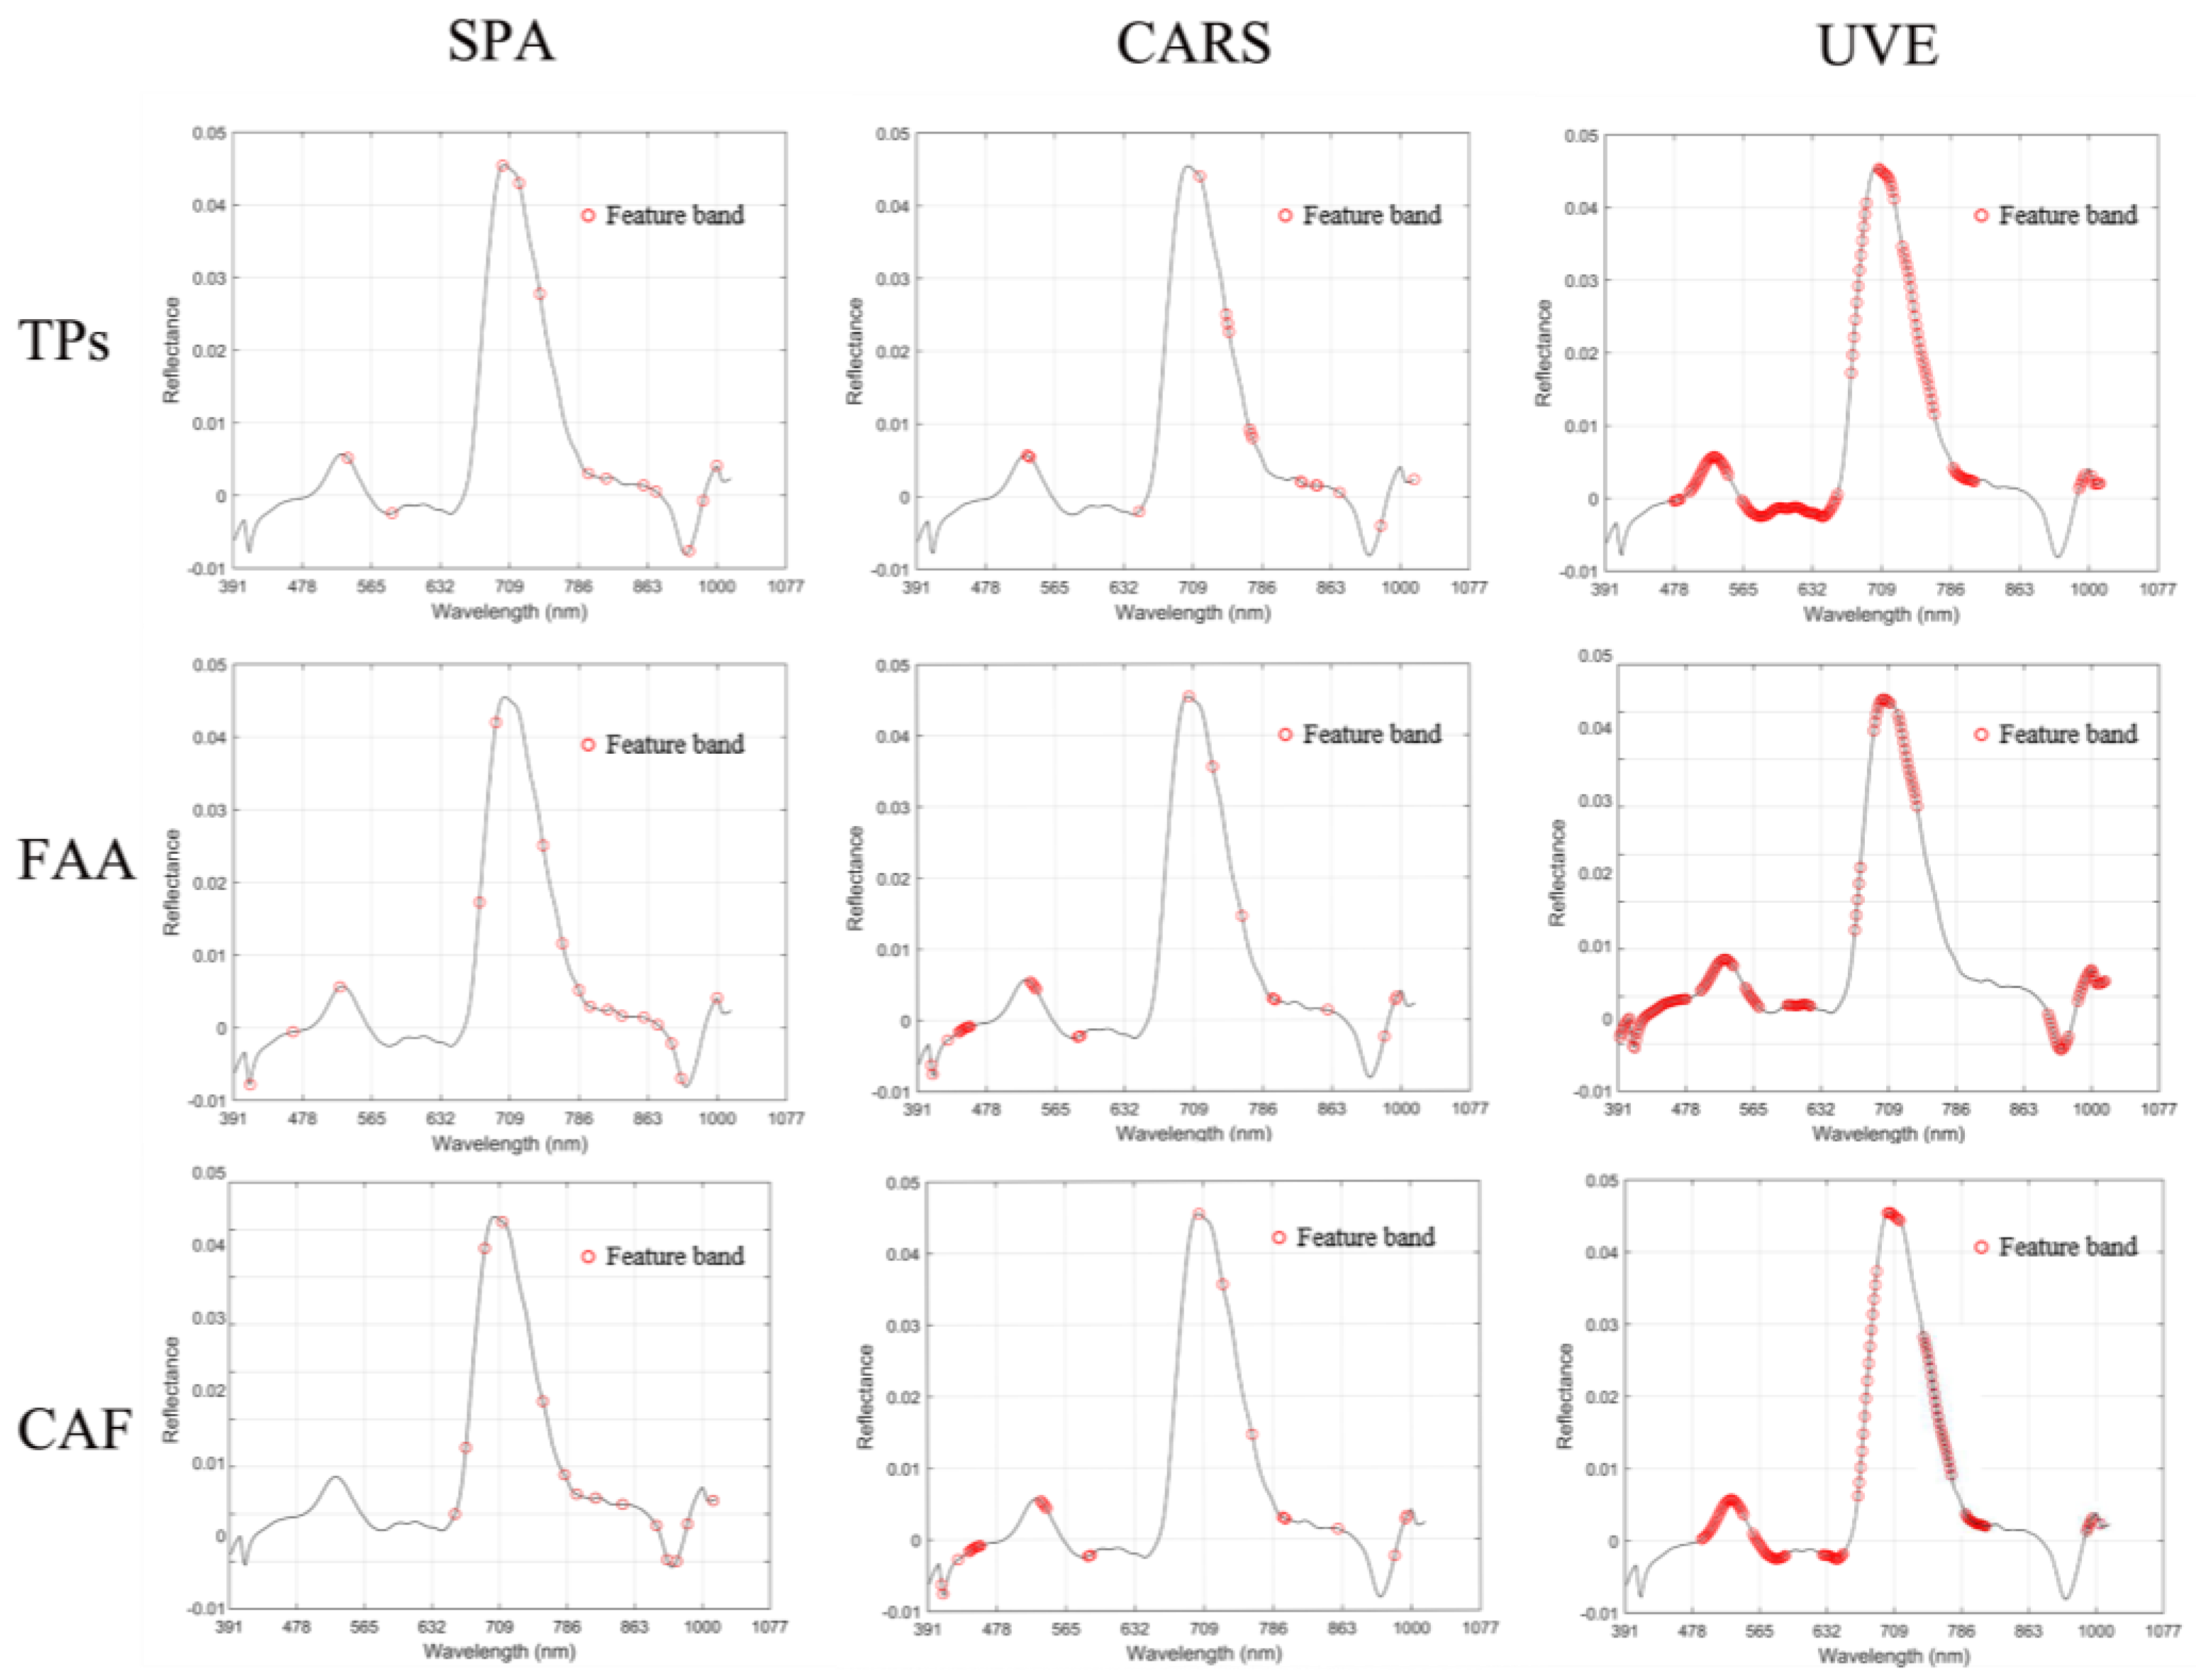
3.4. Selection of Characteristic Bands
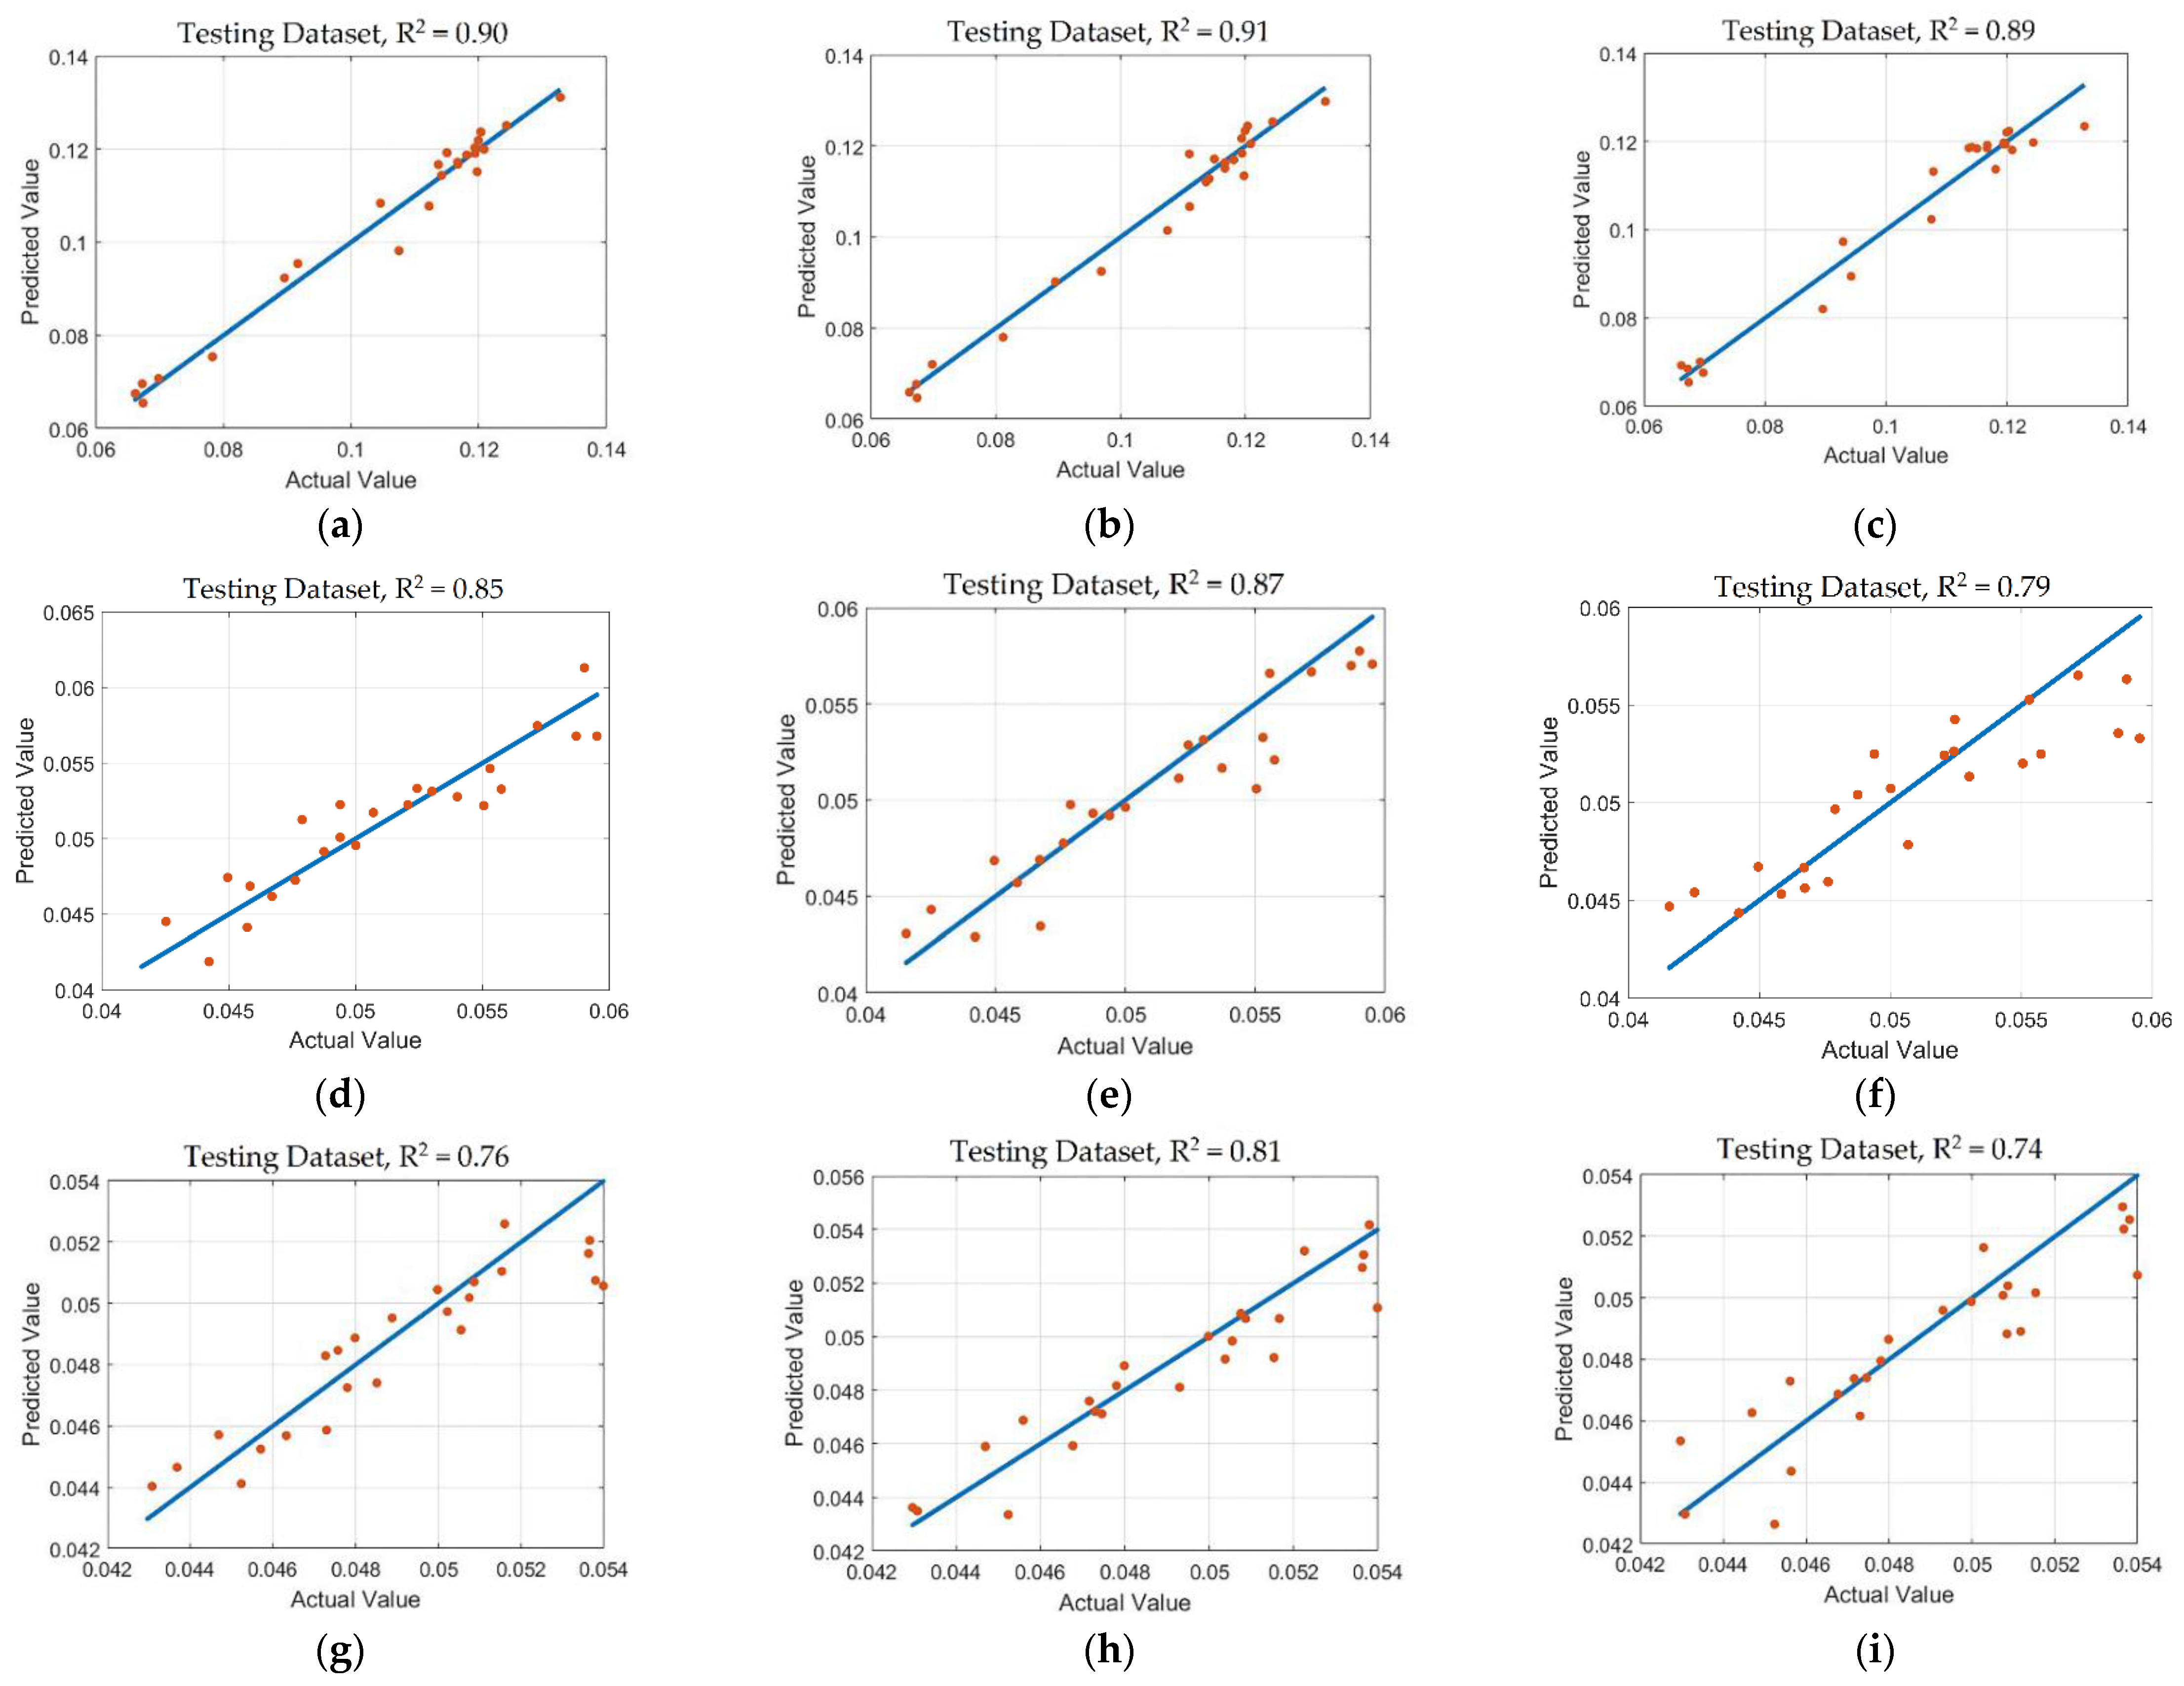
3.5. Establishment and Analysis of Model
4. Conclusions
- (1)
- Three methods for selecting characteristic bands, SPA, CARS, and UVE, are compared comprehensively. Among them, CARS (TPs-CARS-PLS, RP2 = 0.91) and SPA (TPs-SPA-PLS, RP2 = 0.90) achieved higher results, which not only ensures the accuracy of the model but also greatly reduces the complexity of the model.
- (2)
- Three modeling methods, SVM, PLS, and RF, are compared. The SVM (TPs-UVE-SVM, RP2 = 0.90) and PLS (TPs-CARS-PLS, RP2 = 0.91) models have strong robustness and high model accuracy. They are more suitable for the on-line monitoring of black tea quality and the intelligent judgment of the withering and fermentation degrees.
- (3)
- The inversion results of the TPs, FAA, and CAF content and hyperspectral data are compared. The prediction results of the TPs and FAA content are better. Among them, FAA-SPA-PLS (RP2 = 0.88) is the optimal model for judging the degree of withering, and TPs-CARS-PLS (RP2 = 0.91) is the optimal model for judging the degree of fermentation.
Author Contributions
Funding
Institutional Review Board Statement
Informed Consent Statement
Data Availability Statement
Conflicts of Interest
References
- Li, S.; Lo, C.-Y.; Pan, M.-H.; Lai, C.-S.; Ho, C.-T. Black tea: Chemical analysis and stability. Food Funct. 2013, 4, 10–18. [Google Scholar] [CrossRef]
- Wang, Y.; Liu, Y.; Cui, Q.; Li, L.; Ning, J.; Zhang, Z. Monitoring the withering condition of leaves during black tea processing via the fusion of electronic eye (E-eye), colorimetric sensing array (CSA), and micro-near-infrared spectroscopy (NIRS). Food Eng. 2021, 300, 110534. [Google Scholar] [CrossRef]
- Deb, S.; Jolvis Pou, K. A review of withering in the processing of black tea. Biosyst. Eng. 2016, 41, 365–372. [Google Scholar] [CrossRef] [Green Version]
- Jolvis Pou, K. Fermentation: The key step in the processing of black tea. Biosyst. Eng. 2016, 41, 85–92. [Google Scholar] [CrossRef] [Green Version]
- Zhan, H.Y. Determination of Caffeine in Beverages by Ultraviolet Spectrophotometry. Gansu Lianhe Univ. 2013, 27, 51–53. [Google Scholar]
- Beelders, T.; Sigge, G.O.; Joubert, E.; Beer, D.D.; Villiers, A.D. Kinetic optimisation of the reversed phase liquid chromatographic separation of rooibos tea (Aspalathus linearis) phenolics on conventional high performance liquid chromatographic instrumentation. J. Chromatogr. A 2012, 1219, 128–139. [Google Scholar] [CrossRef]
- Wang, L.; Xu, R.; Hu, B.; Li, W.; Sun, Y.; Tu, Y.; Zeng, X. Analysis of free amino acids in Chinese teas and flower of tea plant by high performance liquid chromatography combined with solid-phase extraction. Food Chem. 2011, 123, 1259–1266. [Google Scholar] [CrossRef]
- Xu, M.; Wang, J.; Zhu, L. The qualitative and quantitative assessment of tea quality based on E-nose, E-tongue and E-eye combined with chemometrics. Food Chem. 2019, 289, 482–489. [Google Scholar] [CrossRef]
- Bhattacharyya, N.; Seth, S.; Tudu, B.; Tamuly, P.; Jana, A.; Ghosh, D.; Bandyopadhyay, R.; Bhuyan, M. Monitoring of black tea fermentation process using electronic nose. Food Eng. 2007, 80, 1146–1156. [Google Scholar] [CrossRef]
- Ghosh, A.; Bag, A.K.; Sharma, P.; Tudu, B.; Sabhapondit, S.; Baruah, B.D.; Tamuly, P.; Bhattacharyya, N.; Bandyopadhyay, R. Monitoring the Fermentation Process and Detection of Optimum Fermentation Time of Black Tea Using an Electronic Tongue. IEEE Sens. J. 2015, 15, 6255–6262. [Google Scholar] [CrossRef]
- Li, H.; Wang, Y.; Fan, K.; Mao, Y.; Shen, Y.; Ding, Z. Evaluation of important phenotypic parameters of tea plantations using multi-source remote sensing data. Front. Plant Sci. 2022, 13, 898962. [Google Scholar] [CrossRef]
- Ren, G.; Wang, S.; Ning, J.; Xu, R.; Wang, Y.; Xing, Z.; Wan, X.; Zhang, Z. Quantitative analysis and geographical traceability of black tea using Fourier transform near-infrared spectroscopy (FT-NIRS). Food Chem. 2013, 53, 822–826. [Google Scholar] [CrossRef]
- Li, X.; Sun, C.; Luo, L.; He, Y. Determination of tea polyphenols content by infrared spectroscopy coupled with iPLS and random frog techniques. Comput. Electron. Agric. 2015, 112, 28–35. [Google Scholar] [CrossRef]
- Diniz, P.; Pistonesi, M.F.; Araújo, M. Using iSPA-PLS and NIR spectroscopy for the determination of total polyphenols and moisture in commercial tea samples. Anal. Methods 2015, 7, 3379–3384. [Google Scholar] [CrossRef]
- Li, L.; Li, M.; Cui, Q.; Liu, Y.; Chen, Y.; Wang, Y.; Zhang, Z.; Chen, Q.; Ning, J. Rapid monitoring of black tea fermentation quality based on a solution-phase sensor array combined with UV-visible spectroscopy. Food Chem. 2022, 377, 131974. [Google Scholar] [CrossRef]
- Huang, D.; Bian, Z.; Qiu, Q.; Wang, Y.; Fan, D.; Wang, X. Identification of Similar Chinese Congou Black Teas Using an Electronic Tongue Combined with Pattern Recognition. Molecules 2019, 24, 4549. [Google Scholar] [CrossRef] [Green Version]
- Liang, G.; Dong, C.; Hu, B.; Zhu, H.; Yuan, H.; Jiang, Y.; Hao, G. Prediction of Moisture Content for Congou Black Tea Withering Leaves Using Image Features and Nonlinear Method. Sci. Rep. 2018, 8, 7854. [Google Scholar] [CrossRef]
- Yuan, H.; Chen, X.; Shao, Y.; Cheng, Y.; Yang, Y.; Zhang, M.; Hua, J.; Li, J.; Deng, Y.; Wang, J. Quality Evaluation of Green and Dark Tea Grade Using Electronic Nose and Multivariate Statistical Analysis. Food Qual. 2016, 84, 3411–3417. [Google Scholar] [CrossRef]
- Li, Y.; Ma, B.; Li, C.; Yu, G. Accurate prediction of soluble solid content in dried Hami jujube using SWIR hyperspectral imaging with comparative analysis of models. Comput. Electron. Agric. 2022, 193, 106655. [Google Scholar] [CrossRef]
- Wu, T.; Yu, J.; Lu, J.; Zou, X.; Zhang, W. Research on Inversion Model of Cultivated Soil Moisture Content Based on Hyperspectral Imaging Analysis. Agriculture 2020, 10, 292. [Google Scholar] [CrossRef]
- Wu, D.; Sun, D. Advanced applications of hyperspectral imaging technology for food quality and safety analysis and assessment: A review—Part II: Applications. Innov. Food Sci. Emerg. Technol. 2013, 19, 15–28. [Google Scholar] [CrossRef]
- Bai, S.H.; Tahmasbian, I.; Zhou, J.; Nevenimo, T.; Hannet, G.; Walton, D.; Randall, B.; Gama, T.; Wallace, H.M. A non-destructive determination of peroxide values, total nitrogen and mineral nutrients in an edible tree nut using hyperspectral imaging. Comput. Electron. Agric. 2018, 151, 492–500. [Google Scholar] [CrossRef]
- Shorten, P.R.; Leath, S.R.; Schmidt, J.; Ghamkhar, K. Predicting the quality of ryegrass using hyperspectral imaging. Plant Methods 2019, 15, 63. [Google Scholar] [CrossRef] [PubMed] [Green Version]
- Kang, Y.S.; Ryu, C.; Suguri, M.; Park, S.B.; Kishino, S.; Onoyama, H. Estimating the catechin concentrations of new shoots in green tea fields using ground-based hyperspectral imagery. Food Chem. 2021, 370, 130987. [Google Scholar] [CrossRef] [PubMed]
- Yang, C.; Zhao, Y.; An, T.; Liu, Z.; Jiang, Y.; Li, Y.; Dong, C. Quantitative prediction and visualization of key physical and chemical components in black tea fermentation using hyperspectral imaging. LWT 2021, 141, 110975. [Google Scholar] [CrossRef]
- Dong, C.; Yang, C.; Liu, Z.; Zhang, R.; Yan, P.; An, T.; Zhao, Y.; Li, Y. Nondestructive Testing and Visualization of Catechin Content in Black Tea Fermentation Using Hyperspectral Imaging. Sensors 2021, 21, 8051. [Google Scholar] [CrossRef]
- Xie, C.; Li, X.; He, Y. Application of time series hyperspectral imaging (TS-HSI) for determining water content within tea leaves during drying. ResearchGate 2013, 56, 1431–1440. [Google Scholar]
- Xie, C.; Li, X.; Shao, Y.; He, Y. Color measurement of tea leaves at different drying periods using hyperspectral imaging technique. PLoS ONE 2014, 9, e113422. [Google Scholar] [CrossRef] [Green Version]
- Chen, S.; Gao, Y.; Fan, K.; Shi, Y.; Luo, D.; Shen, J.; Ding, Z.; Wang, Y. Prediction of Drought-Induced Components and Evaluation of Drought Damage of Tea Plants Based on Hyperspectral Imaging. Front. Plant Sci. 2021, 12, 695102. [Google Scholar] [CrossRef]
- Talens, P.; Mora, L.; Morsy, N.; Barbin, D.F.; Elmasry, G.; Sun, D.W. Prediction of water and protein contents and quality classification of Spanish cooked ham using NIR hyperspectral imaging. Food Eng. 2013, 117, 272–280. [Google Scholar] [CrossRef]
- Li, Q.; Hu, Y. Kinetic models of peroxidase activity in potato leaves infected with late blight based on hyperspectral data. Int. J. Agric. Biol. Eng. 2019, 12, 160–165. [Google Scholar] [CrossRef] [Green Version]
- Shu, M.; Shen, M.; Zuo, J.; Yin, P.; Wang, M.; Xie, Z.; Tang, J.; Wang, R.; Li, B.; Yang, X. The application of UAV-based hyperspectral imaging to estimate crop traits in maize inbred lines. Plant Phenomics 2021, 2021, 890745. [Google Scholar] [CrossRef] [PubMed]
- Wu, D.; Chen, X.; Zhu, X.; Guan, X.; Wu, G. Uninformative variable elimination for improvement of successive projections algorithm on spectral multivariable selection with different calibration algorithms for the rapid and non-destructive determination of protein content in dried laver. Anal. Methods 2011, 3, 1790–1796. [Google Scholar] [CrossRef]
- Cui, X.; Song, Q.J.; Zhang, Y.Y.; Xu, G.; Gao, J.L. Estimation of soil organic carbon content in alpine grassland using hyperspectral data. Acta Prataculturae Sin. 2017, 26, 20–29. [Google Scholar]
- Lohumi, S.; Lee, H.; Kim, M.S.; Qin, J.; Cho, B.K. Raman hyperspectral imaging and spectral similarity analysis for quantitative detection of multiple adulterants in wheat flour. Biosyst. Eng. 2019, 181, 103–113. [Google Scholar] [CrossRef]
- Wu, D.; Nie, P.; He, Y.; Bao, Y. Determination of Calcium Content in Powdered Milk Using Near and Mid-Infrared Spectroscopy with Variable Selection and Chemometrics. Food Bioprocess Technol. 2012, 5, 1402–1410. [Google Scholar] [CrossRef]
- Sarathjith, M.C.; Das, B.S.; Wani, S.P.; Sahrawat, K.L. Variable indicators for optimum wavelength selection in diffuse reflectance spectroscopy of soils. Geoderma 2016, 267, 1–9. [Google Scholar] [CrossRef]
- Xu, S.; Zhao, Y.; Wang, M.; Shi, X. Determination of rice root density from Vis–NIR spectroscopy by support vector machine regression and spectral variable selection techniques. Catena 2017, 157, 12–23. [Google Scholar] [CrossRef]
- Di, W.; Chen, X.; Shi, P.; Wang, S.; Feng, F.; Yong, H. Determination of α-linolenic acid and linoleic acid in edible oils using near-infrared spectroscopy improved by wavelet transform and uninformative variable elimination. Anal. Chim. Acta 2009, 634, 166–171. [Google Scholar]
- Elmasry, G.; Iqbal, A.; Sun, D.W.; Allen, P.; Ward, P. Quality classification of cooked, sliced turkey hams using NIR hyperspectral imaging system. Food Eng. 2011, 103, 333–344. [Google Scholar] [CrossRef]
- Wang, Y.Y.; Li, J.Q.; Liu, H.G.; Wang, Y.Z. Attenuated Total Reflection-Fourier Transform Infrared Spectroscopy (ATR-FTIR) Combined with Chemometrics Methods for the Classification of Lingzhi Species. Molecules 2019, 24, 2210. [Google Scholar] [CrossRef] [PubMed] [Green Version]
- Gorski, L.; Sordon, W.; Ciepiela, F.; Kubiak, W.W.; Jakubowska, M. Voltammetric classification of ciders with PLS-DA. Talanta 2016, 146, 231–236. [Google Scholar] [CrossRef] [PubMed]
- Jin, G.; Wang, Y.J.; Li, M.; Li, T.; Huang, W.J.; Li, L.; Deng, W.W.; Ning, J. Rapid and real-time detection of black tea fermentation quality by using an inexpensive data fusion system. Food Chem. 2021, 358, 129815. [Google Scholar] [CrossRef] [PubMed]
- Wang, Y.; Hu, X.; Hou, Z.; Ning, J.; Zhang, Z. Discrimination of nitrogen fertilizer levels of tea plant (Camellia sinensis) based on hyperspectral imaging. Sci. Food Agric. 2018, 98, 4659–4664. [Google Scholar] [CrossRef] [PubMed]


| Standard Sample | Linear Equation | R2 |
|---|---|---|
| FAA | A2 = 34.625 C1 − 0.0895 | 0.9983 |
| CAF | A3 = 26.411 C2 + 0.0141 | 0.9903 |
| Maximum/% | Minimum/% | Average/% | Standard Deviation/% | |||||
|---|---|---|---|---|---|---|---|---|
| Training Set | Testing Set | Training Set | Testing Set | Training Set | Testing Set | Training Set | Testing Set | |
| TPs | 12.79 | 13.28 | 6.00 | 6.31 | 10.43 | 10.93 | 2.11 | 2.05 |
| FAA | 6.13 | 6.10 | 4.11 | 4.23 | 5.05 | 4.98 | 0.54 | 0.57 |
| CAF | 5.52 | 5.40 | 4.21 | 4.35 | 4.83 | 4.91 | 0.31 | 0.31 |
| Index | Screening Method | Number of Bands | Characteristic Bands (nm) |
|---|---|---|---|
| TPs | SPA | 13 | 512, 569, 609, 672, 714, 764, 848, 864, 898, 913, 955, 971, 992 |
| CARS | 16 | 519–522, 653, 733, 764–768, 794–796, 862, 880–882, 911, 966, 1010 | |
| UVE | 159 | 473–475, 488–532, 554–594, 606–667, 686–703, 719–738, 750–785, 814–840, 979–986, 997 | |
| FAA | SPA | 16 | 409, 450, 512, 701, 724, 738, 778, 807, 823, 844, 869, 896, 911, 931, 946, 992 |
| CARS | 30 | 405–407, 425, 437–450, 522–529, 580–584, 715, 748, 784, 823–826, 896, 970, 984–986 | |
| UVE | 174 | 391–470, 488–527, 542–559, 594–623, 679–724, 734–759, 933–960, 973–1010 | |
| CAF | SPA | 14 | 665, 679, 703, 726, 778, 807, 823, 851, 884, 929, 944, 957, 971, 1007 |
| CARS | 13 | 494–498, 542, 545, 695, 710, 748, 812, 909, 922, 1007–1008 | |
| UVE | 90 | 483–531, 544–582, 535–655, 676–700, 715–727 |
| Index | Model Valuation Index | SPA | CARS | UVE | ||||||
|---|---|---|---|---|---|---|---|---|---|---|
| SVM | PLS | RF | SVM | PLS | RF | SVM | PLS | RF | ||
| TPs | RC2 | 0.911 | 0.923 | 0.924 | 0.926 | 0.926 | 0.920 | 0.919 | 0.931 | 0.924 |
| RMSEC | 0.006 | 0.005 | 0.005 | 0.005 | 0.00 | 0.005 | 0.005 | 0.004 | 0.005 | |
| RMSECV | 0.005 | 0.004 | 0.004 | 0.004 | 0.004 | 0.005 | 0.005 | 0.003 | 0.004 | |
| RP2 | 0.886 | 0.900 | 0.890 | 0.898 | 0.911 | 0.887 | 0.899 | 0.895 | 0.895 | |
| RMSEP | 0.004 | 0.003 | 0.004 | 0.003 | 0.003 | 0.004 | 0.003 | 0.003 | 0.003 | |
| RPD | 3.497 | 5.178 | 2.718 | 4.797 | 5.223 | 3.587 | 4.886 | 4.285 | 4.438 | |
| FAA | RC2 | 0.857 | 0.850 | 0.880 | 0.870 | 0.854 | 0.852 | 0.860 | 0.847 | 0.877 |
| RMSEC | 0.004 | 0.004 | 0.004 | 0.003 | 0.004 | 0.004 | 0.004 | 0.004 | 0.003 | |
| RMSECV | 0.003 | 0.003 | 0.003 | 0.003 | 0.003 | 0.003 | 0.003 | 0.003 | 0.003 | |
| RP2 | 0.802 | 0.882 | 0.830 | 0.846 | 0.866 | 0.788 | 0.800 | 0.778 | 0.743 | |
| RMSEP | 0.002 | 0.001 | 0.002 | 0.002 | 0.002 | 0.003 | 0.002 | 0.002 | 0.003 | |
| RPD | 2.547 | 2.974 | 1.857 | 2.864 | 2.522 | 1.609 | 2.368 | 1.798 | 1.579 | |
| CAF | RC2 | 0.769 | 0.765 | 0.790 | 0.771 | 0.787 | 0.752 | 0.786 | 0.767 | 0.783 |
| RMSEC | 0.004 | 0.004 | 0.003 | 0.003 | 0.003 | 0.003 | 0.003 | 0.003 | 0.004 | |
| RMSECV | 0.004 | 0.004 | 0.004 | 0.004 | 0.004 | 0.004 | 0.004 | 0.004 | 0.004 | |
| RP2 | 0.756 | 0.757 | 0.748 | 0.763 | 0.814 | 0.742 | 0.721 | 0.741 | 0.752 | |
| RMSEP | 0.003 | 0.003 | 0.003 | 0.003 | 0.003 | 0.004 | 0.004 | 0.003 | 0.003 | |
| RPD | 2.052 | 2.045 | 1.540 | 1.754 | 2.426 | 1.488 | 1.403 | 2.015 | 1.700 | |
Publisher’s Note: MDPI stays neutral with regard to jurisdictional claims in published maps and institutional affiliations. |
© 2022 by the authors. Licensee MDPI, Basel, Switzerland. This article is an open access article distributed under the terms and conditions of the Creative Commons Attribution (CC BY) license (https://creativecommons.org/licenses/by/4.0/).
Share and Cite
Mao, Y.; Li, H.; Wang, Y.; Fan, K.; Song, Y.; Han, X.; Zhang, J.; Ding, S.; Song, D.; Wang, H.; et al. Prediction of Tea Polyphenols, Free Amino Acids and Caffeine Content in Tea Leaves during Wilting and Fermentation Using Hyperspectral Imaging. Foods 2022, 11, 2537. https://doi.org/10.3390/foods11162537
Mao Y, Li H, Wang Y, Fan K, Song Y, Han X, Zhang J, Ding S, Song D, Wang H, et al. Prediction of Tea Polyphenols, Free Amino Acids and Caffeine Content in Tea Leaves during Wilting and Fermentation Using Hyperspectral Imaging. Foods. 2022; 11(16):2537. https://doi.org/10.3390/foods11162537
Chicago/Turabian StyleMao, Yilin, He Li, Yu Wang, Kai Fan, Yujie Song, Xiao Han, Jie Zhang, Shibo Ding, Dapeng Song, Hui Wang, and et al. 2022. "Prediction of Tea Polyphenols, Free Amino Acids and Caffeine Content in Tea Leaves during Wilting and Fermentation Using Hyperspectral Imaging" Foods 11, no. 16: 2537. https://doi.org/10.3390/foods11162537
APA StyleMao, Y., Li, H., Wang, Y., Fan, K., Song, Y., Han, X., Zhang, J., Ding, S., Song, D., Wang, H., & Ding, Z. (2022). Prediction of Tea Polyphenols, Free Amino Acids and Caffeine Content in Tea Leaves during Wilting and Fermentation Using Hyperspectral Imaging. Foods, 11(16), 2537. https://doi.org/10.3390/foods11162537