Article

Establishment and Validation of Reference Genes of Brassica napus L. for Digital PCR Detection of Genetically Modified Canola

Institute of Agricultural Quality Standard and Testing Technology, Jilin Academy of Agricultural Sciences, Changchun 130033, China
*
Author to whom correspondence should be addressed.
These authors contributed equally to this work.
Foods 2022, 11(16), 2535; https://doi.org/10.3390/foods11162535
Submission received: 18 July 2022 / Revised: 12 August 2022 / Accepted: 19 August 2022 / Published: 22 August 2022
(This article belongs to the Special Issue PCR in Food Science: Current Technology and Applications)

Abstract

:
As an effective tool for genetically modified organism (GMO) quantification in complex matrices, digital PCR (dPCR) has been widely used for the quantification of genetically modified (GM) canola events; however, little is known about the quantification of GM canola events using endogenous reference gene (ERG) characteristics by dPCR. To calculate and quantify the content of GM canola using endogenous reference gene (ERG) characteristics, the suitability of several ERGs of canola, such as cruciferin A (CruA), acetyl-CoA carboxylase (BnAcc), phosphoenolpyruvate carboxylase (PEP), cruciferin storage (BnC1), oleoyl hydrolase (Fat(A)), and high-mobility-group protein I/Y (HMG-I/Y), was investigated by droplet dPCR. BnAcc and BnC1 were more specific and stable in copy number in the genome of Brassica napus L. than the other genes. By performing intra-laboratory validation of the suitability of ERG characteristics for the quantification of GM canola events, the ddPCR methods for BnAcc and BnC1 were comprehensively demonstrated in dPCR assays. The methods could provide technical support for GM labeling regulations.

1. Introduction

Canola is widely cultivated in Canada, Europe, and Asia. It is one of the main sources of food and feed, providing edible vegetable oil and protein, and it is the second largest oil crop, accounting for more than 20% of the total edible vegetable oil worldwide, only exceeded by soybean. Genetically modified (GM) canola is one of the four major transgenic crops and is a vital part of genetically modified organism (GMO) safety supervision. As of 2019, more than 40 GM canola events had been authorized as food worldwide [1]. Prior to commercial release, all GM cultivars are required to be assessed for their biosafety to evaluate their potential impacts [2]. The development of transgenic canola quantitative methods provides technical support for the enforcement of regulatory requirements [3,4]. Identification and quantification methods are of great significance not only to ensure legality and traceability but also to comply with GM labeling regulations [5,6]. Generally, the quantitative method for measuring GM content detects the copy number of endogenous and exogenous genes and converts their ratio to actual GM content. Hence, the identification of the appropriate endogenous reference gene (ERG) is the first and most crucial step in the quantification method for each crop. At present, endogenous genes have been developed in many crops, of which maize, soybean, and rice are richest in endogenous genes [3,7,8]. However, the lack of more comprehensive comparative studies on transgenic canola endogenous genes applicable to the digital PCR (dPCR) method renders selection and application for safety supervision difficult [9].
In general, specific and low ERG copies are preferred for the absolute quantification of GM events using PCR [10]. Therefore, only genes with stable low-copy inheritance, the target sequence of which can be efficiently amplified within the minimum partition, are suitable for digital PCR methods. At present, the endogenous genes developed for use in GM canola detection include phosphoenolpyruvate carboxylase (PEP) [11], acetyl-CoA carboxylase 8 (BnAccg8) [12], cruciferin A (CruA) [13], oleoyl hydrolase (Fat(A)) [14], cruciferin storage (BnC1) [9], and high-mobility-group protein I/Y (HMG-I/Y) [15]. Some of these genes have been validated for qualitative detection in transgenic rapeseed, but the quantitative application, especially by digital PCR, requires a clear internal copy number to estimate the content of transgenic components. For example, the uncertainty in the copy number of the commonly used HMG I/Y gene as an ERG has become a problem in the quantitative detection of GM in Brassica napus L. The PEP gene was used for the quantitative and qualitative detection of transgenic B. napus, but different amplified target sequences were found [16]. The CruA gene was cycled and adopted by the EU transgenic testing laboratory, although Hernandez et al. [12] found that this gene was amplified in other species, and the specificity of CruA was low. Therefore, CruA is yet to be verified as an ERG using dPCR. Some studies used the Fat(A) gene for the identification of GM canola RT73 [17,18,19], but BLASTN results showed that the primer and amplified fragment of Fat(A) are homologous to those of that in Brassica juncea. Therefore, we evaluated the feasibility of using digital PCR of endogenous genes to satisfy the ERG requirement for GM canola detection [13]. Digital PCR is widely used for the detection or quantification of GM components [20,21]. It can perform absolute quantification and overcome the gaps in real-time PCR, such as PCR amplification efficiency influenced by inhibitors and the bias introduced by the background matrix [22]. In addition, owing to the different amplification principles between dPCR and real-time PCR, the ERGs of real-time PCR may not necessarily be applicable to dPCR [23,24]. Therefore, it is necessary to conduct a comprehensive screening and copy number identification of ERGs in rapeseed and verify the feasibility of dPCR as a method for this purpose [23]. We investigated the equivalence of six validated methods for ERGs and identified the B. napus-specific dPCR methods coupled with several event-specific modules for the quantification of specific transgenic canola events.
In this study, the intraspecies conservation and copy numbers of ERGs (CruA, Fat(A), PEP, HMG I/Y, BnAcc, and BnC1) in common B. napus cultivars were assessed using droplet digital PCR (ddPCR). The application of the genes was systematically evaluated. Furthermore, we tested whether BnAcc and BnC1 endogenous genes could be used in quantitative detection of GM content by ddPCR. The methods were assessed by validating the dynamic range, limit of detection (LOD), limit of quantification (LOQ), precision, and applicability. The proposed methods can be applied to the quantitative detection of GM canola content without standard materials. It would provide technical support for labeling regulations of GM canola events and their derived products.

2. Materials and Methods

2.1. Materials

Seeds of 16 canola cultivars (13 conventional, 3 GM lines) and 8 other crops were acquired for this study. The three GM lines (Ms1, Oxy-235, and Topas 19/2) and one conventional B. napus variety were kindly provided by the GM Standard Material Preservation Center (Changchun, China). Twelve other non-transgenic Brassica cultivars were provided by Dr. Yuhua Wu of Oil Crops Research Institute of the Chinese Academy of Agricultural Sciences, including three cultivars of B. juncea (‘Simianhanzha’, ‘AB1’, and ‘Lu’), three cultivars of B. rapa L. (‘Shanghaiqing’, ‘10wH008’, and ‘Huangxinwu’), four cultivars of B. napus (‘AV-jade’, ‘Zhongshuang-11’, ‘Zhongshuang-b’, and ‘Nh No.345’), and one cultivar each for B. oleracea L. (‘Niuxin’), B. nigra (L.) W.D.J.Koch (‘black mustard’), and B. carinata A. Braun (‘Ethiopian mustard’). The seeds of the eight other crops (Solanum tuberosum L., Lycopericon esculentum Mill., Nicotiana tabacum L., Raphanus sativus L., Oryza sativa L., Glycine max (L.) Merr., Zea mays L., and Gossypium hirsutum L.) were purchased from a local market. Samples were collected and stored in the laboratory at −20 °C.

2.2. Preparation of Samples with Different GMO Contents

All acquired seeds were crushed by a mixer (Retsch MM430, Shanghai Vedder Instrument Equipment Co., Ltd. Shanghai, China). The grinding process involved ten cycles of 20 s agitation, followed by cooling to room temperature (20–25 °C) for 1 min to protect the DNA from heat damage. After grinding, 10%, 1%, 0.5%, and 0.1% MS1, Oxy-235, and Topas 19/2 transgenic samples (by mass ratio) were prepared according to the material preparation process (Announcement No. 1782 of the Ministry of Agriculture of China, Technical Specification for Preparation of Transgenic Standard Materials). The powder was further mixed in a Dynamic CM-200 mixer (Retsch, Germany) and shaken overnight to obtain homogenous samples for DNA extraction.

2.3. DNA Extraction

DNA was extracted from 50 mg of seed powder using a DNeasy Plant Mini Kit (Qiagen, Hilden, Germany) following the manufacturer’s guidelines. DNA concentration and purity were determined using a NanoDrop N2000 instrument (Thermo Fisher Scientific, Wilmington, DE, USA). Samples were diluted to a final concentration of 12.5 ng/μL.

2.4. Primers and Probes

The primers and probes of six sets of endogenous and three sets of transgenic event-specific genes were used in our methods (Table 1). The oligos were synthesized by Sangon Biotech (Shanghai, China).

2.5. Real-Time PCR

Real-time PCR was used to analyze the copy numbers of endogenous genes and transformant-specific genes by the standard curve method [28].
The 1× HiTaq probe Mastermix (Apexbio Biotechnology, Beijing, China), 500 nM of each primer, and 250 nM of target and reference gene probes were included in 25-μL qPCR reactions. PCR amplification was performed on a CFX96 real-time thermal analyzer (Bio-Rad, Hercules, CA, USA). Unless specified otherwise, the template was 12.5 ng of genomic DNA. FAM (6-carboxyfluorescein) channels for ERGs and GM-specific fragments were amplified following the thermal cycle protocol: 95 °C for 5 min, 35 cycles at 95 °C for 15 s, and 60 °C for 1 min. Fluorescence signals were read out during the extension steps. All reaction data were analyzed using Opticon Monitor_2 software version 2.02 (MJ Research, Waltham, MA, USA). PCR reactions were conducted in three parallel assays.

2.6. Droplet Digital PCR

A droplet digital PCR system (QX200, Bio-Rad) was used for the ddPCR method [23]. Each 20-μL reaction mixture consisted of 500 nM of the forward and reverse primers, 250 nM of the target and reference gene probes, 10 μL of ddPCR Supermix (L002054A, Bio-Rad), and 12.5 ng of DNA template. According to the manufacturer’s instructions, 20 μL of ddPCR reaction mixture and 70 μL of droplet formation oil (EvaGreen 186-3005, Bio-Rad) were placed in the cartridges, and droplets were generated on the AutoDG instrument (Bio-Rad). Then, the nanoliter droplets were dispensed into a 96-well dPCR plate (1200–1925, Bio-Rad) to perform the amplification in an AC1000 PCR Thermocycler (Bio-Rad). The PCR reactions were carried out under the following conditions: 10 min at 95 °C for denaturation, 40 cycles at 95 °C for 30 s, 58.5 °C for 60 s, and 98 °C for 10 min. The plate in which PCR was completed was put into a QX200 instrument for signal readout and data analysis. For each experiment, three duplicate samples were analyzed, unless otherwise noted.
Thresholds were manually set based on fluorescence amplitudes and numbers of events (1D amplitudes) on the FAM channel, and histograms of event and amplitude data streams were used to distinguish the positive droplets from negative droplets without amplification products. If clog was detected by the software (Bio-Rad QuantaSoft version 1.6.6) or the number of droplets detected per 20 μL of reaction was low (<8000), the data were rejected for subsequent analysis [22].

2.7. LOD and LOQ of Digital PCR Methods

gDNA was extracted from the seeds of GM canola Ms1, Oxy-235, and Topas 19/2. A diluted series copy number sample for the target copy was prepared, and the theoretical absolute copy number was converted from each concentration of diluted DNA samples according to the haploid genome of 1.3 pg [29]. The absolute limit of quantification (aLOQ) in copy number and absolute limit of detection (aLOD) in copy number were determined from the results of 15 replicates by ddPCR. aLOD is the lowest copy sample consistently producing a positive signal in all replicates, whereas aLOQ is the lowest copy tested with a relative standard deviation (RSD) of <25% [11].

2.8. Determination of the Dynamic Range

The logarithm of experimental (ddPCR) and theoretical (gDNA) copies of B. napus was used to generate a linear regression curve. The regression coefficient (R2) was used to evaluate the dynamic range of the ERGs quantitative method [30]. In this experiment, repeatability was evaluated through a series of diluted DNA samples (two separate runs; two replicates were performed, on day 1 and day 2).

2.9. Method Verification

Methods were validated according to a document [31]. The criteria of the dynamic range, trueness, and precision were verified by the mixed gDNA samples with different mass ratios (10%, 5%, 1%, and 0.1% of MS1, Oxy-235, and Topas 19/2) by real-time PCR and ddPCR. The assays of two endogenous genes (BnAcc and BnC1) and the GM-specific genes of MS1, Oxy-235, and Topas 19/2 events were used to quantify the practical content of the GM. Furthermore, the absolute copy numbers of the specific and endogenous genes were calculated using the Opticon Monitor_2 software version 2.02 for real-time PCR and QuantaSoft software version 1.6.6 (Bio-Rad) for ddPCR. The GMO content was calculated as the ratio of copy numbers of the specific gene to the endogenous gene. The data measured were compared with the mass ratio of the sample standard prepared.

2.10. Data Analysis

Real-time PCR data were processed using Bio-Rad Opticon Monitor_2 software version 2.02. All biological and technical replicates were used to calculate the average Ct value. The copy number of the targets (exogenous or endogenous gene) was calculated using the standard curve according to the equation x = 10^[(Ct − b)/a]. ddPCR data were analyzed using QuantaSoft software version 1.6.6 (Bio-Rad Laboratories). The GM content was calculated as (target DNA copy number)/(reference DNA copy number) × 100 [32].

3. Results and Discussion

3.1. Evaluating Intraspecies Inclusiveness and Species Specificity of Canola

Intraspecific inclusion and species specificity are two basic requirements for reference gene selection. Six primers/probe sets (Table 1) were used for the real-time fluorescence quantitative PCR detection of six ERGs. The samples were all from different crop species and cultivated varieties of Brassica L. to verify whether there was a cross-reaction of endogenous genes or non-targeted specific genes of other genera.
The samples used in the study included cultivars of six Brassica species: B. rapa, B. nigra, B. oleracea, B. juncea, B. napus, and B. carinata. All six endogenous genes had no homologous sequences in maize, soybean, rice, and other crops but had positive amplified fragments in all B. rapa, B. juncea, and B. napus varieties (Table 2), suggesting that these six genes do not distinguish B. napus from other cultivars. As most GM canola events were in B. napus, our goal was to screen out the specific ERG of B. napus. However, none of these six PCR systems exhibited B. napus specificity. This result was consistent with a previous report [13].
PEP, CruA, and Fat(A) showed similar amplification specificity in the test crops. Their fragments could be identified not only from the genomes of all six Brassica species but also from R. sativus. In the HMG-I/Y PCR reaction, the fragments could be amplified in B. rapa, B. juncea, B. napus, B. oleracea, and B. carinata. The BnAcc system exhibited a performance similar to that of BnC1 in the tested cultivars of B. rapa, B. juncea, and B. napus. Aside from the positive result of BnAcc in R. sativus, ERGs of BnAcc and BnC1 fragments were restricted to the B. rapa, B. juncea, and B. napus cultivars (Table 2).
All amplified fragments from different cultivars of these six genes were sequenced and used for sequence comparison. Apart from some single nucleotide polymorphisms, no large interspecific variation was detected in the amplified fragments.
In summary, the six endogenous genes could be used to distinguish canola from other crops, but none was specific to canola varieties. Although the specificity was different, PCR confirmed the presence and consistency of the genes in B. napus. BnAcc and BnC1 genes exhibited a higher specificity than the others. Their amplification was specific in B. rapa, B. juncea, and B. napus, but not in B. nigra, B. carinata, B. oleracea, and other crop varieties, unlike the other ERGs. As the current transgenic rapeseed varieties mainly belong to B. napus, these endogenous genes are probably applicable to quantitative detection as reference genes for B. napus. Therefore, the stability of the copy number of these six genes in B. napus was the main basis for further selection.

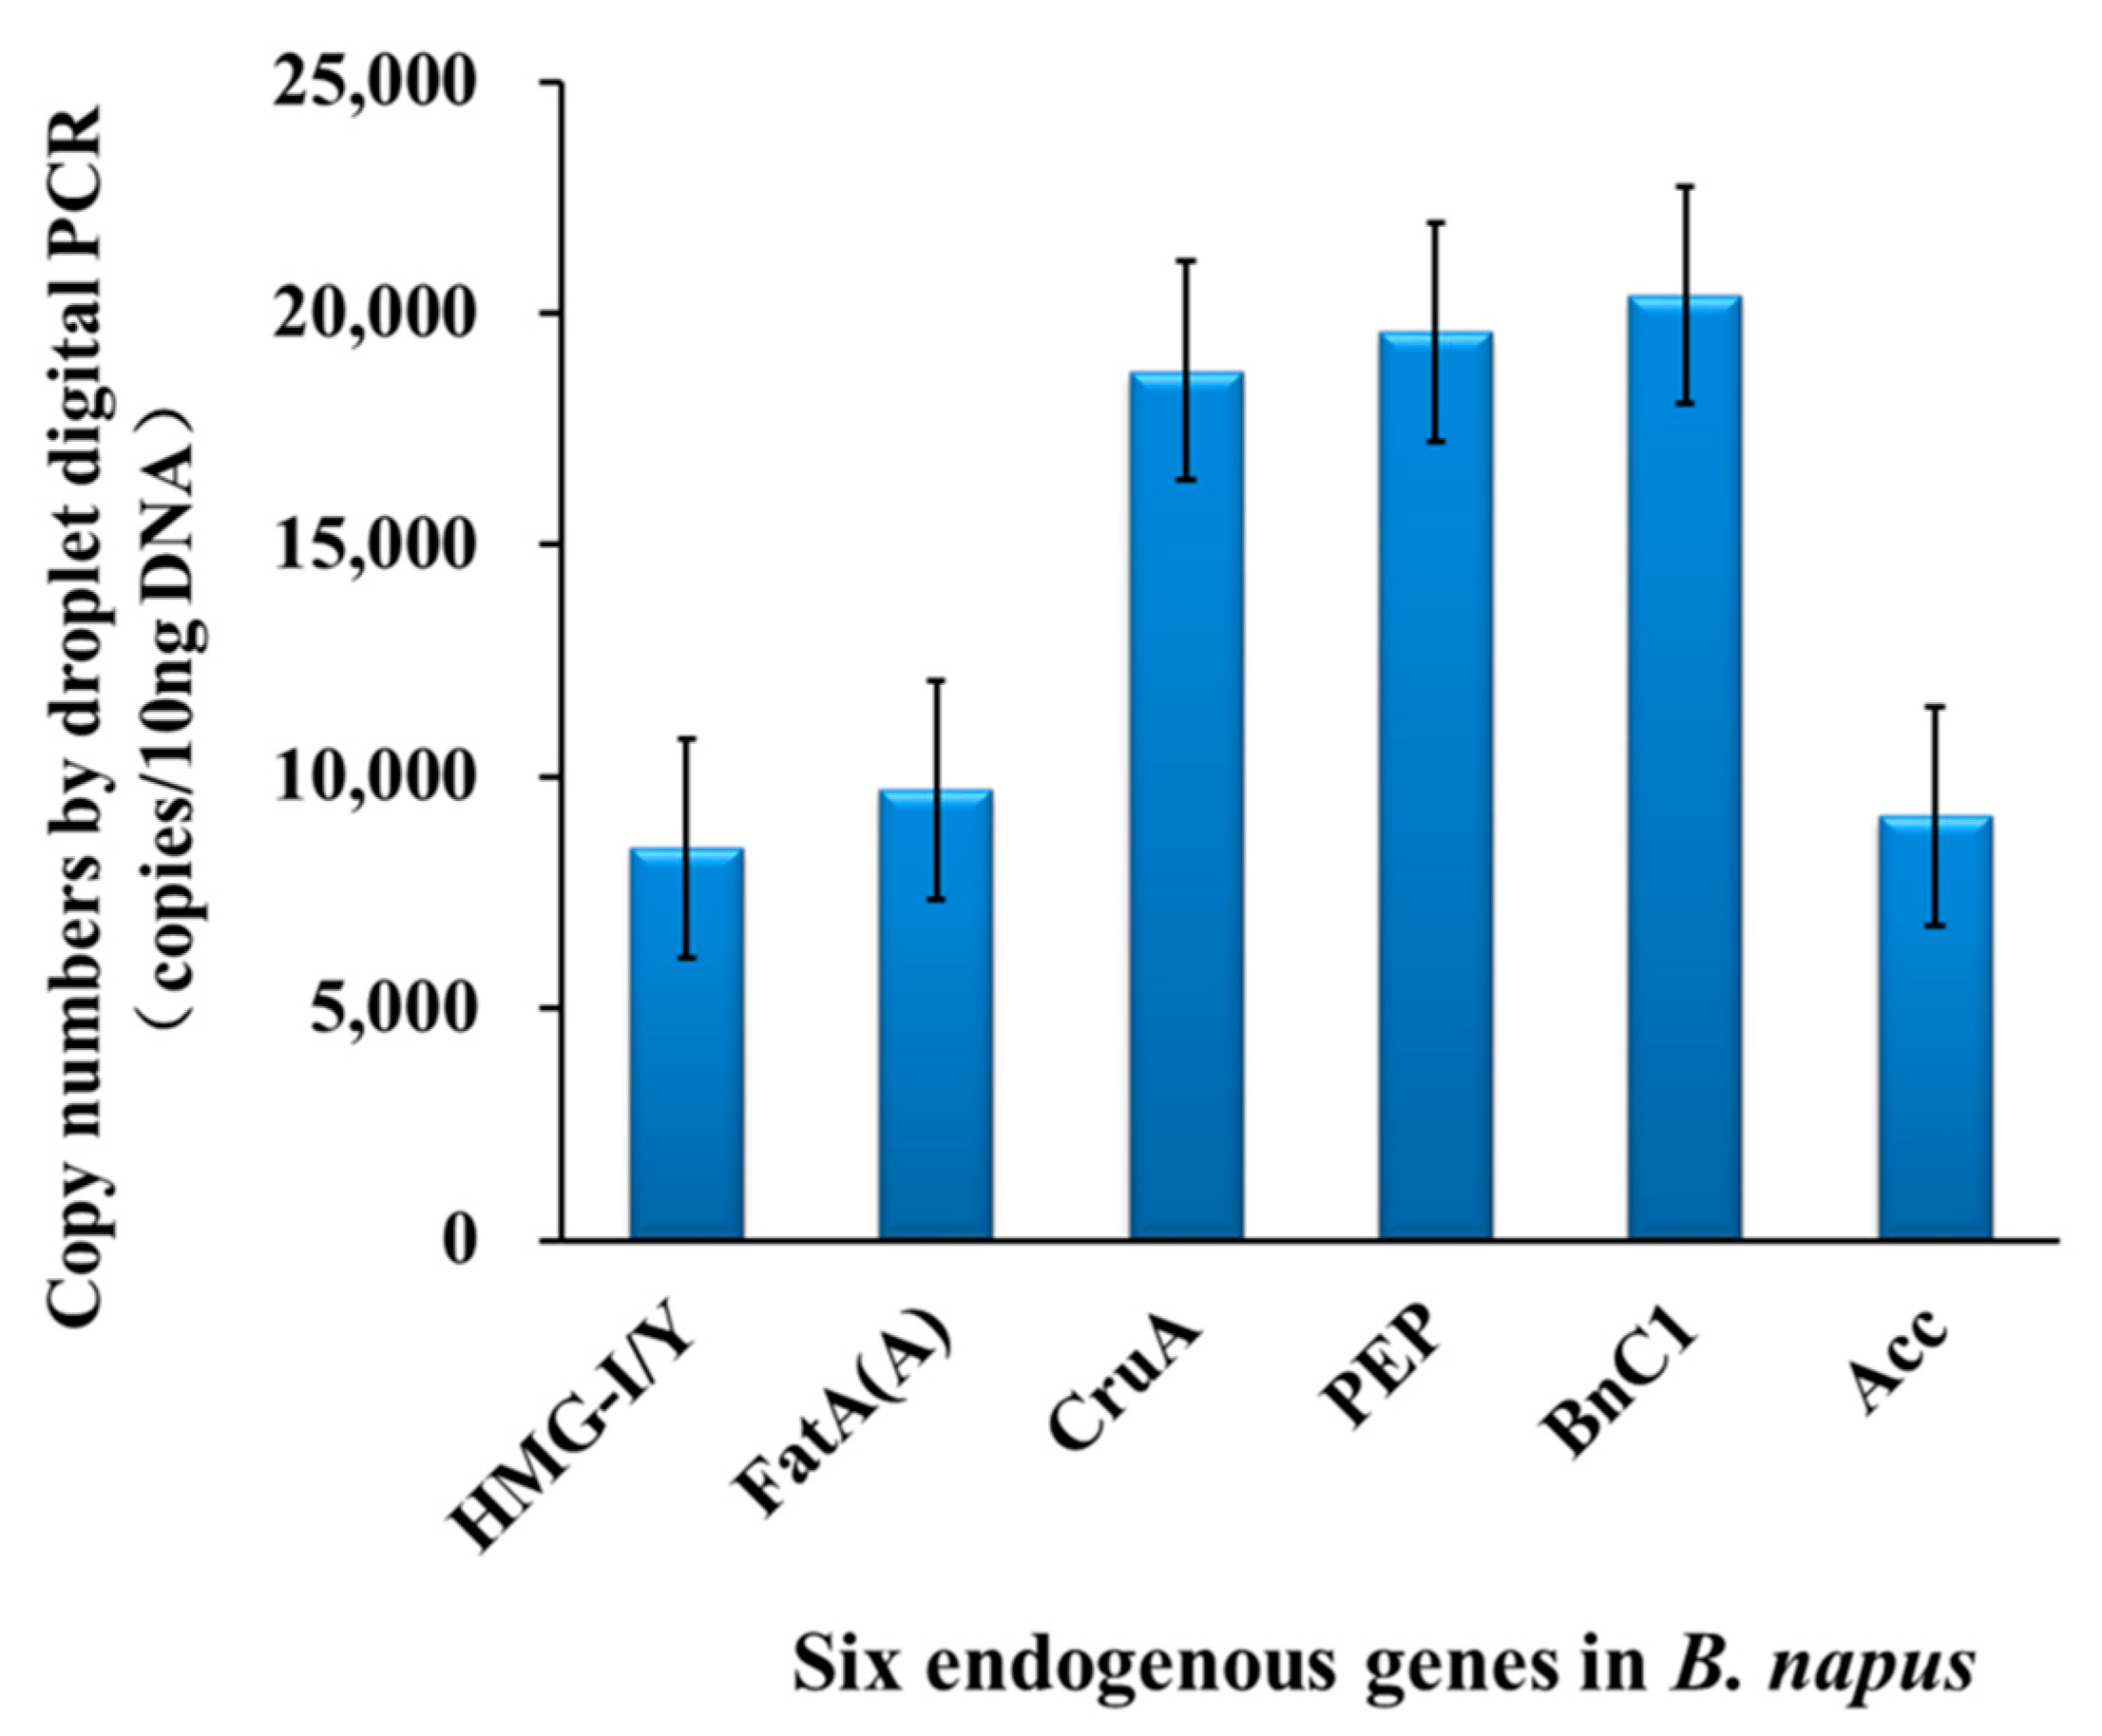
3.2. Verifying the Stability of Copy Numbers of ERGs among B. napus Cultivars by Droplet dPCR

The copy number stability among diverse cultivars is a vital factor in developing ERG assays for GM detection. To identify the stability of the ERGs within B. napus cultivars, the homogeneity of the genes in different genomes needs to be considered. In accordance with EU requirements, ERGs and corresponding quantitative methods must be stable in different B. napus varieties. To evaluate the potential variation of these genes, gDNA of seven B. napus cultivars, including three GM and four non-GM canola, was analyzed by quantitative ddPCR systems for six ERGs: CruA, Fat(A), PEP, HMG I/Y, BnAcc, and BnC1 (Table 3).
Each sample was used as a PCR template for six endogenous reference systems, and the amplification was repeated twice for two runs. After the reactions, the copy number of the ERGs in cultivars was detected. The mean copy number of each gene was calculated as shown in Table 3. Thus, the stability of these six endogenous reference systems was compared and analyzed by standard deviation (SD) and relative standard deviation (RSD). The number of HMG-I/Y, Fat(A), and CruA exhibited greater variability than that of the other genes in B. napus cultivars, with an RSD of 7.90%, 7.21%, and 9.18%, respectively (Table 3).
The copy number of CruA, PEP, and BnC1 was double that of HMG-I/Y, Fat(A), and BnAcc using the same samples and ddPCR reactions (Figure 1). The copy number of hmg-I/Y, Fat(A), and BnAcc measured by dPCR was close to the theoretical copy number of a single copy in the B. napus genome, which was consistent with the results of previous studies [11,12,17]. The quantitative results of six dPCR methods were close to the theoretical values of single or double ERG copies in the B. napus genome, with deviations of less than 5%.

3.3. Assessment of ddPCR for ERGs

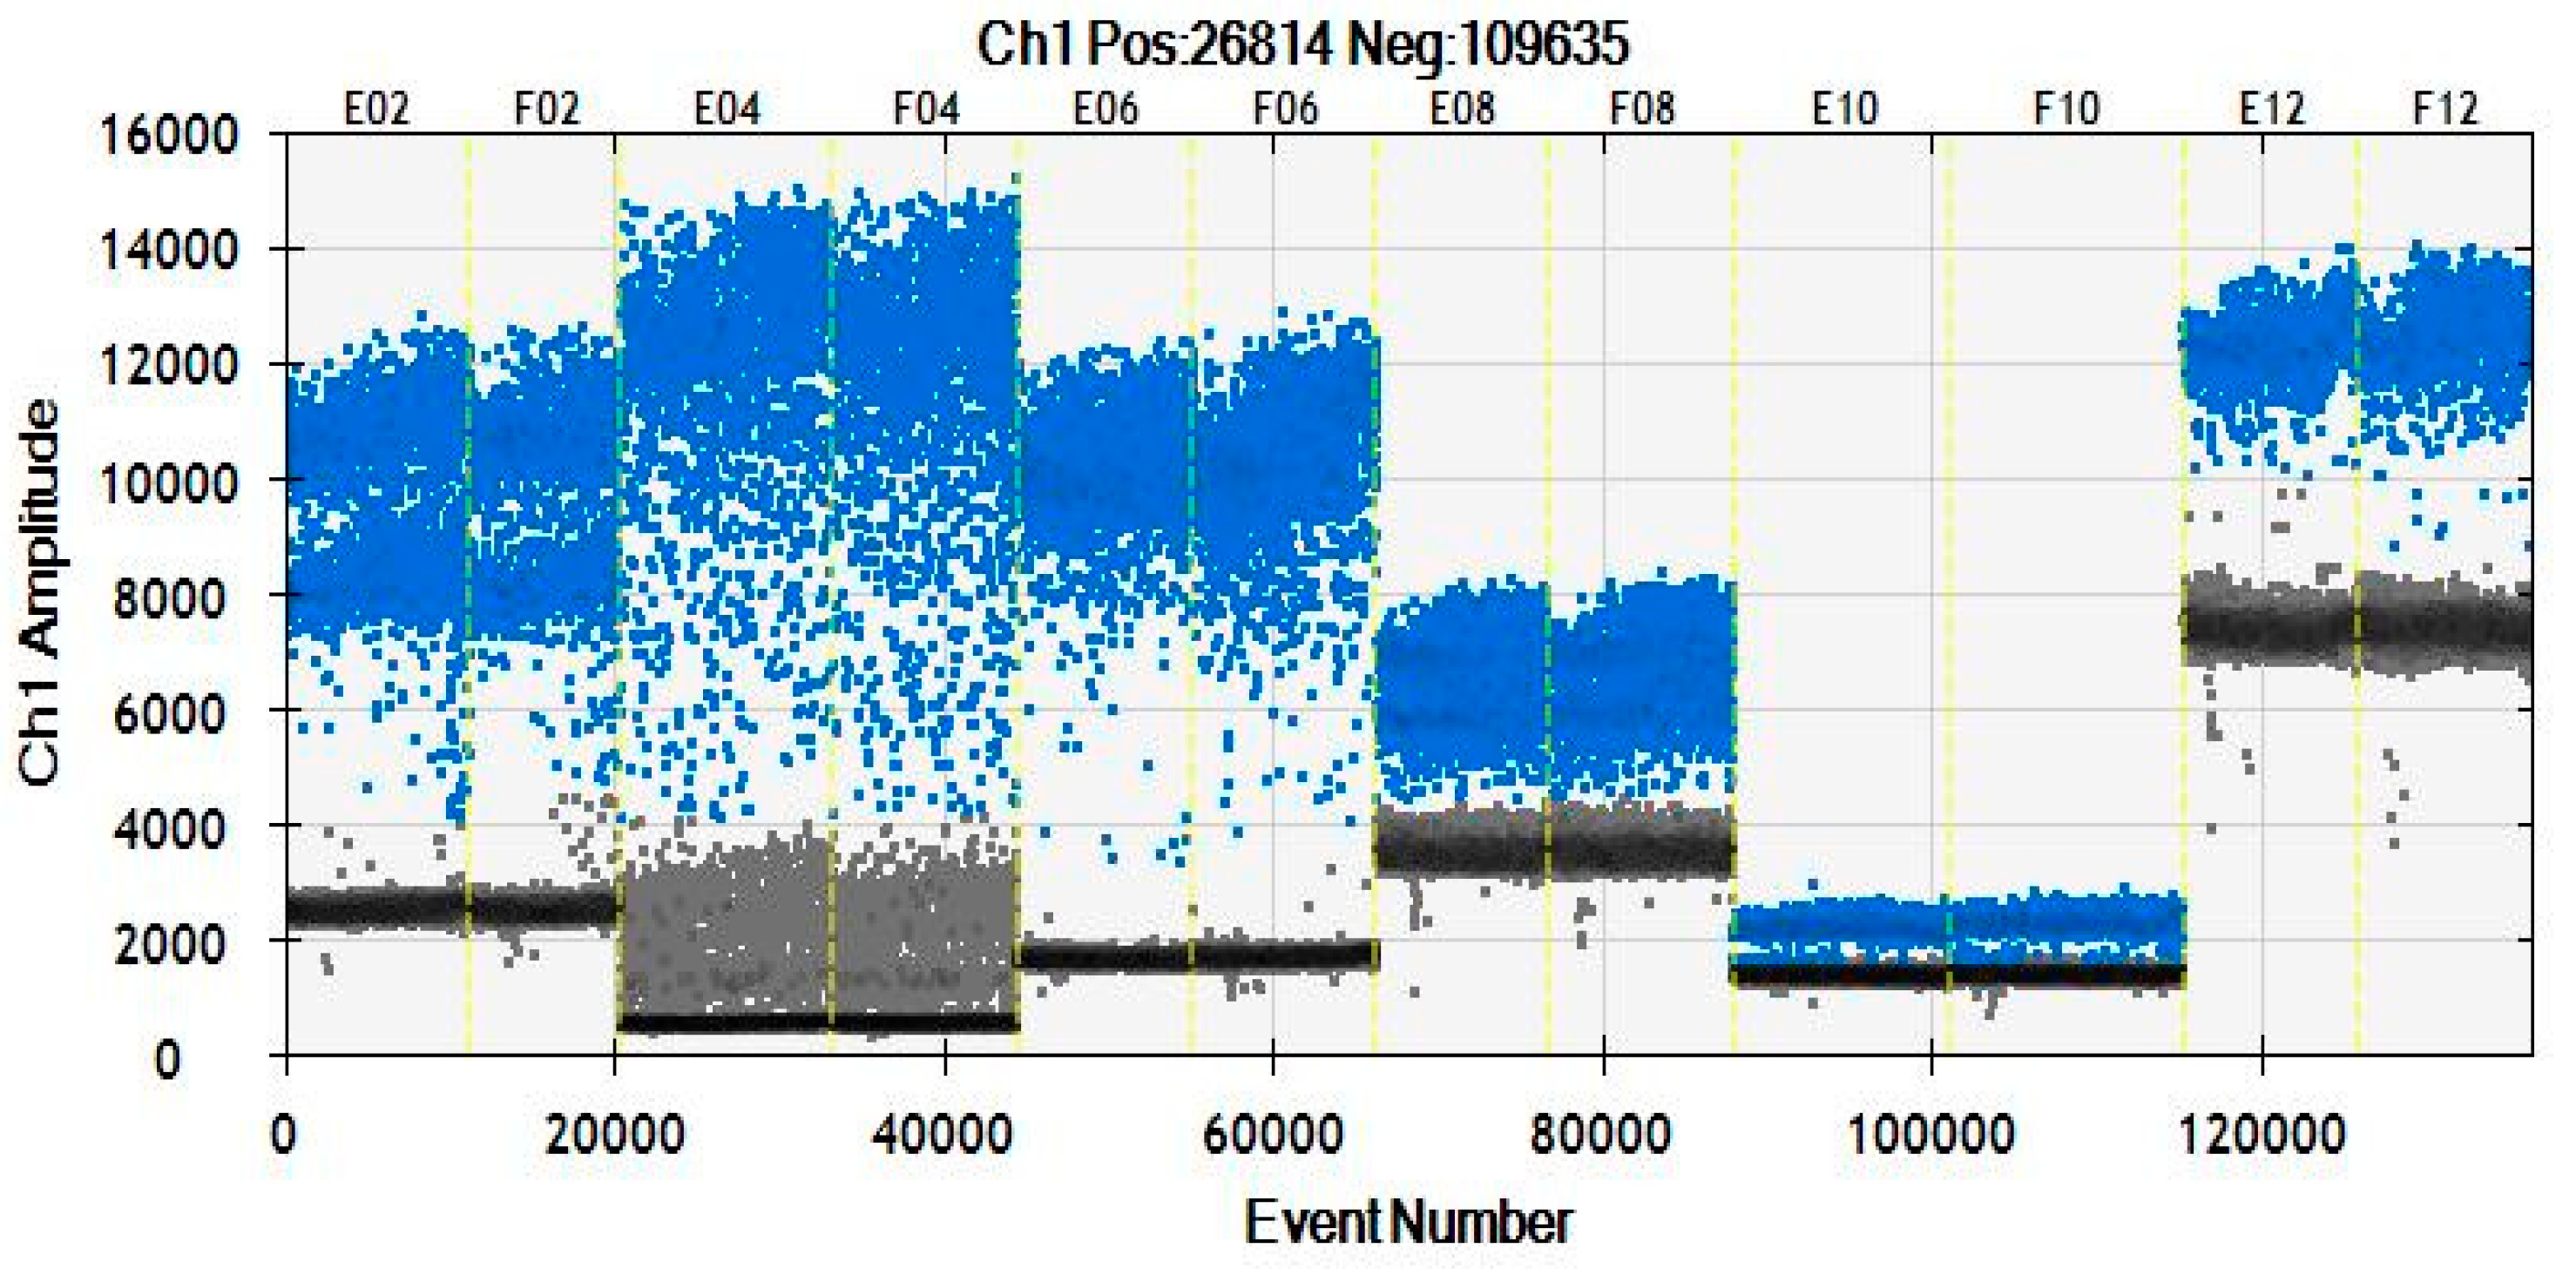
3.3.1. Selection from Observations of ddPCR

The observations of ddPCR amplitude plots for the six ERGs are shown in Figure 2. From the distribution of the droplets, the threshold limits of negative and positive droplets were not obvious for the Fat(A) assay. Setting the threshold manually may affect the accuracy of a low copy number determination. For CruA and HMG I/Y assays, there were some droplets in the amplification plot that interfered with the accuracy of the quantitative detection, whereas there was a clear separation of positive and negative clusters in the BnC1 and BnAcc gene amplification. Therefore, the analysis of copy number stability and amplification showed that BnC1 and BnAcc were accurate and reliable. They could be candidate ERG assays for the quantitative detection of GM canola using ddPCR.

3.3.2. aLOQ and aLOD of ddPCR of BnC1 and BnAcc

aLOD can be defined as the minimum amount of analyte in a test sample that can be detected reliably [33], whereas aLOQ is the lowest amount of analyte that can be determined quantitatively with accuracy and precision [31]. In the dPCR, the lowest copy number at which all replicates were detected positively was set as the aLOD. gDNA samples containing 20, 10, 5, 2, and 1 ERG copies were prepared from the Ms1 DNA, with the purpose of determining the aLOD and aLOQ. They were measured using ddPCR assays at five levels of dilution, with 15 PCR replicates targeting these ERGs. From the positive rate of amplification, all digital PCR replicates were 100% amplified in more than 10 copies (Table 4). In five copies, the positive rate of CruA, BnC1, and BnAcc was 100%; thus, these three ERGs have a lower LOD with about five copies. The LOD of Fat(A) and PEP was higher than that of the above three genes, with 10 copies. RSD analysis was performed on these low copy samples using copy number values obtained in the digital PCR. The RSD increased, whereas the copy number decreased. Thus, aLOQ can be estimated as the lowest copy where the RSD of the measurements is below 25%. When the copy number was above ten, the RSD values of each ERG were below the criteria, whereas in five copies for sample amplification, BnC1 and BnAcc exhibited 24.8% and 22.5%, respectively. That means the aLOQ of BnC1 and BnAcc could reach five copies. Considering the LOQ was for the ERGs instead of specific genes, this was a satisfactory result, as the content of the exogenous targets was not less than that of the ERGs in the GM detection. Therefore, BnC1 and BnAcc have stronger specificity in B. napus and higher sensitivity than the other four genes as ERGs for GM canola detection.

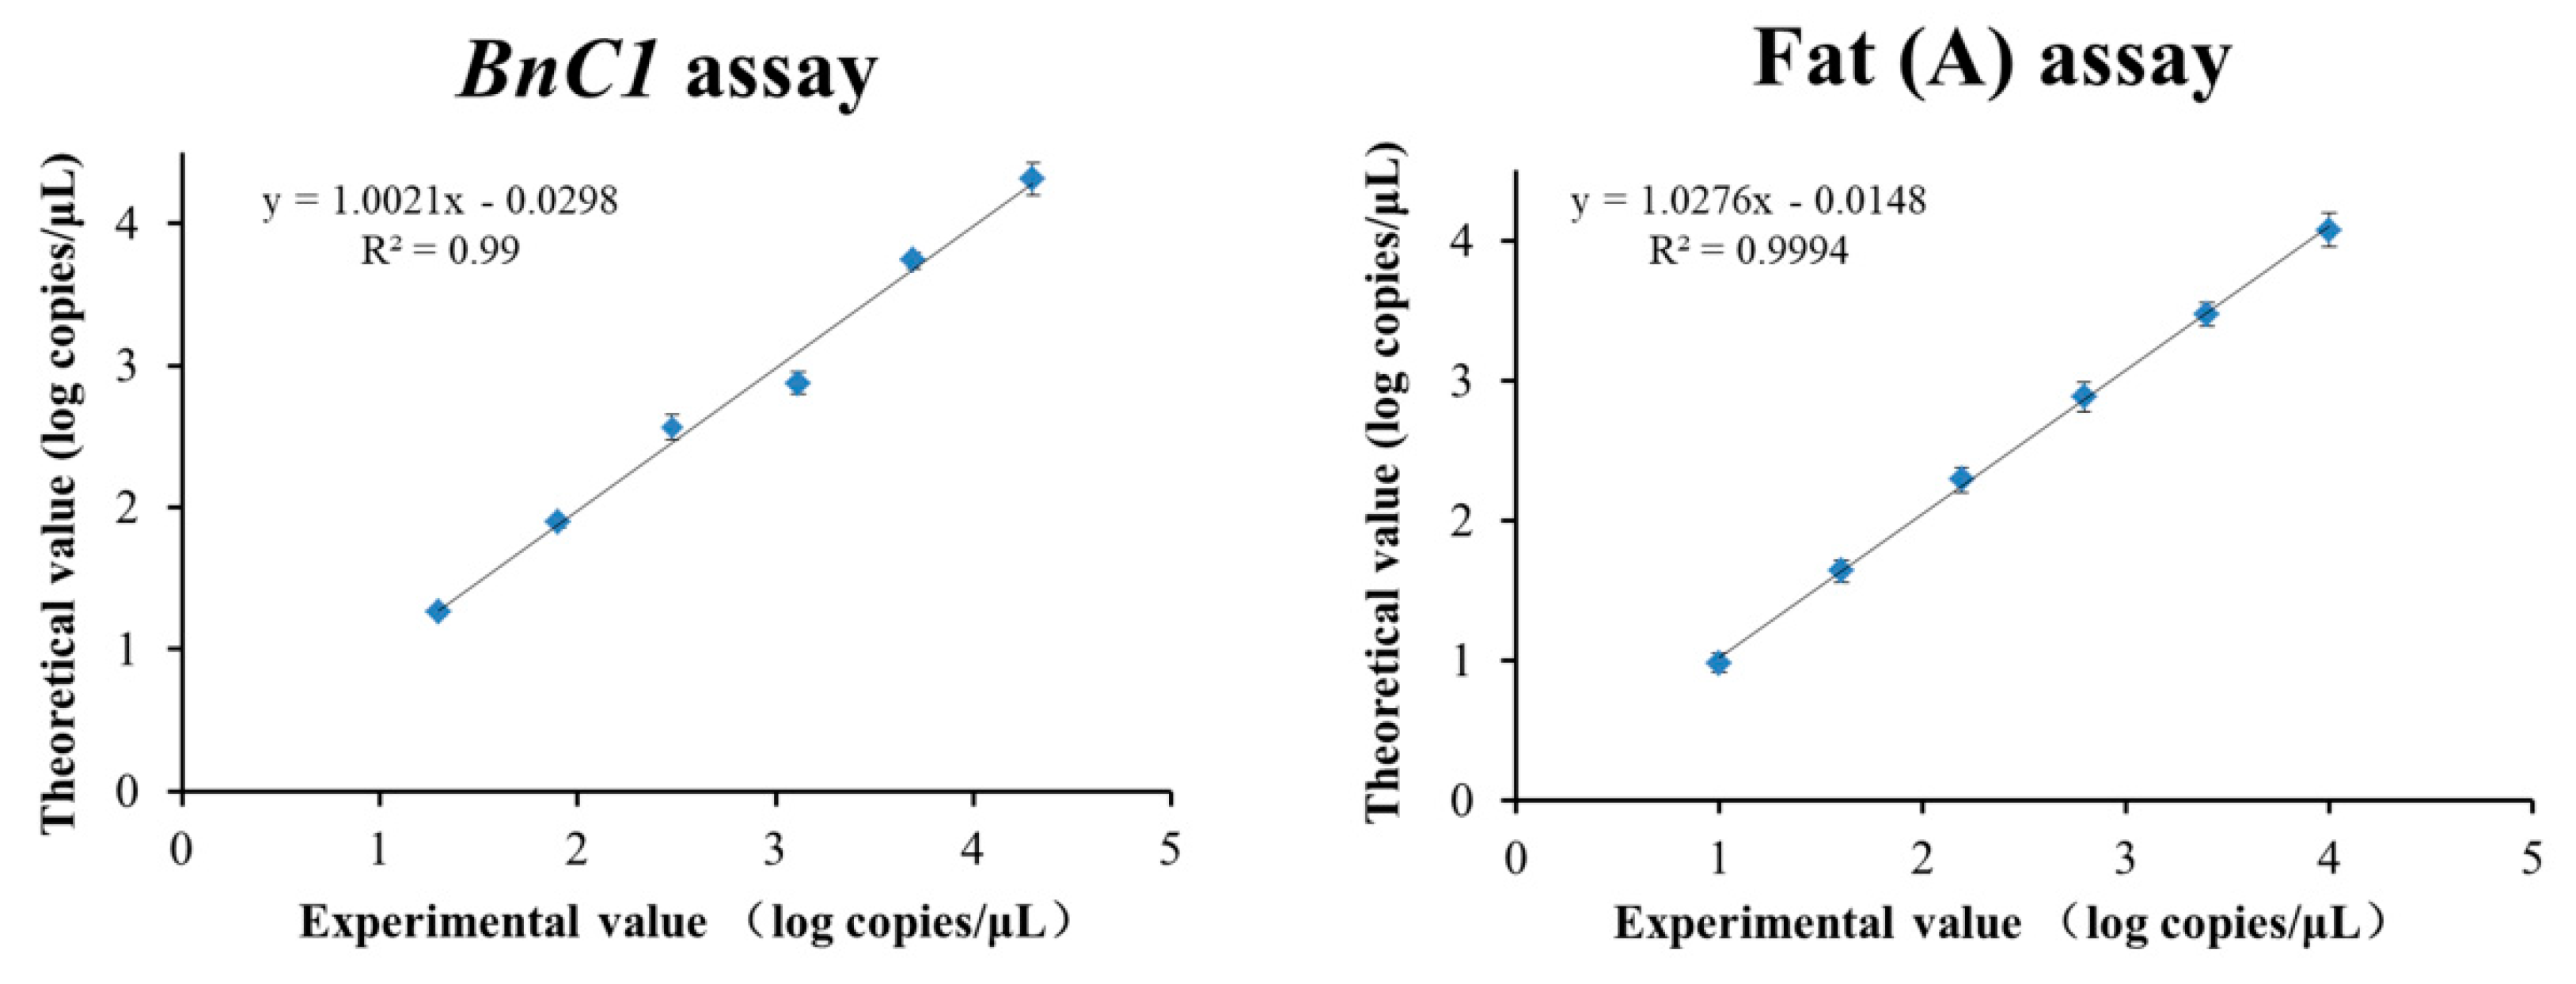
3.3.3. Dynamic Range

For the specific B. napus endogenous genes of BnAcc and BnC1, the linear relationship between the theoretical and actual copy numbers of both reference genes was evaluated using ddPCR. Rapeseed DNA samples were diluted to different concentrations in the absolute amount in the reaction system, with 10,000, 2500, 625, 156, 40, and 10 copies. The theoretical copy number of BnC1 was double that of BnAcc in the rapeseed genome. The R2 coefficient represents a measure of the estimative capacity of the linear regression line in relation to the experimental data used. The result indicated that the copy numbers of both genes were linear along the entire copy range (10,000 to 10 copies of BnAcc; 20,000 to 20 copies of BnC1), with R2 > 0.99 (Figure 3). Therefore, the linear range of the two methods can fully meet the required detection needs and can be considered as equivalent. As the content of endogenous genes in transgenic samples is often equal to or higher than the content of specific genes, this indicated that the ratio of specific genes to sample ERGs is sufficient to ensure detection. The achieved dynamic range allows for the characterization of GM rapeseed, while covering almost the entire specific concentration range that is possible in a GM sample, or the most probable concentrations.

3.3.4. Quantitative Detection of GM Canola Events by Real-Time PCR and ddPCR with BnC1 and BnAcc

To ascertain whether the ERG methods of dPCR could achieve accurate results for the practical quantification of the GM canola content, we conducted endogenous gene assays using test samples that were mixed by mass ratio. The GM contents were prepared for 10%, 5%, 1.0%, and 0.1% of MS1, Oxy-235, and Topas 19/2. For comparison, both real-time PCR and ddPCR were conducted on these samples, with event-specific genes and both BnC1 and BnAcc as ERGs. The copy number by real-time PCR was calculated using the standard curve established by reference gDNA dilutions for the MS1 gene, BnC1, and BnAcc (Figure 4A–C). Droplet digital PCR was directly used to quantify the positive droplets of the amplification of exogenous genes (Ms1 and Oxy235 as examples, Figure 4D) and endogenous genes (BnC1 and BnAcc) (Figure 4E). We assessed 10%, 5%, 1%, and 0.1% of MS1, Oxy-235, and Topas 19/2 rapeseed DNA samples using two ERGs by dPCR and real-time PCR for the quantification. The comparison and analysis of the quantitative determination results and theoretical content by the two platforms for 12 blind samples are shown in Table 5.
The dPCR amplification plot indicated that the assays could achieve the expected result with the endogenous genes (BnC1 or BnAcc). The error indicated as bias (%) of all quantitative values was within ±25% of the European Network of Transgenic Laboratories recommended values [31]. The maximum error bias of dPCR in the result was −22.24% for the Topas 19/2 samples, with 0.1% content determined by BnAcc as the ERG, whereas the maximum error bias of real-time PCR was 22.17%, as for Topas 19/2 samples, with 0.1% content determined by BnC1 as the ERG. Both RT-PCR and dPCR methods can achieve accurate results for both ERGs in transgenic samples with content as low as 0.1%. The results indicated that either the BnC1 or BnAcc gene was appropriate for the quantitative assessment of GM canola events. Moreover, real-time PCR and ddPCR methods could achieve accurate and consistent results. Compared with those of reported methods [4,14,17], the BnC1 and BnAcc assays used in ddPCR assays achieved satisfactory results in GM canola quantification. The single or double copies for reference genes did not affect the ddPCR evaluation of the GM content in these three GM canola events in B. napus. The applicability of dPCR targeting BnC1 and BnAcc genes was successfully demonstrated. Moreover, the dPCR methods using BnC1 and BnAcc as reference genes were suitable for the quantitative detection of transgenic rapeseed.
In some studies of qualitative GM detection methods in canola, some EGRs were used for the identification and quality control of extracted canola genomic DNA. CruA and HMG I/Y are reference genes used by some researchers for quantitative detection [7,28,34]; however, the specificity and copy number stability of all reference genes in B. napus have not been systematically studied. Wu et al. [13] used reference genes for GM content detection in real-time PCR, but real-time PCR detection depends on reference material, and plasmids and the homozygous genome as reference material were always unavailable. The superior characteristics of BnC1 and BnAcc determined in our study were demonstrated to be suitable for quantitative detection by digital PCR. With the advantages of the same accuracy as real-time PCR and independence of standard materials in the process of detection, the dPCR platform would be more convenient for practical application to quantify the content of GM canola and their derived products compared to real-time PCR or the other routine techniques.

4. Conclusions

The criteria of six canola genes (CruA, BnC1, Fat(A), PEP, HMG I/Y, and BnAcc) were compared and evaluated using ddPCR in this research. With their combined specificity, stability, dynamic ranges, and amplification observation, both BnC1 and BnAcc could be used as ERGs for the quantification of GM canola content in ddPCR assays. Using the ERGs, a ddPCR system was established with an aLOQ of 10 copies/reaction. This method can reliably quantify the GM content, even when it is as low as 0.1%. Different content of MS1, Topas 19/2, and Oxy235 GM canola events validated that BnC1 and BnAcc endogenous genes were reliable in both real-time PCR and ddPCR with the same primers and probes. Concluding from these results, we believe that this newly developed method will be a good candidate of using ERGs for quantifying the amount of GM canola by dPCR. These methods can provide reliable and reproductive results and perform as effective tools to implement labeling systems.

Author Contributions

F.L., as project chief, provided the ideas for this study. L.L. and Z.X. performed the main parts of the experiments and wrote the manuscript. Y.H., L.D. and W.Y. did some data collection and analysis. C.L., W.X. and N.Z. validated the experimental result. Y.M., Y.X. and N.L. checked the text of the manuscript. All authors have read and agreed to the published version of the manuscript.

Funding

Supported by the Jilin Agricultural Technological Innovation Project, China (CXGC2021TD021).

Data Availability Statement

The data are available from the corresponding author.

Acknowledgments

Y Wu (Oil Crops Research Institute of the Chinese Academy of Agricultural Sciences) is acknowledged for providing and validating the seeds of non-GM canola.

Conflicts of Interest

The authors declare that they have no conflict of interest.

References

  1. ISAAA in 2019: Accomplishment Report. 2019. Available online: https://www.isaaa.org/resources/publications/annualreport/2019/default.asp (accessed on 26 May 2022).
  2. Kumar, K.; Gambhir, G.; Dass, A.; Tripathi, A.K.; Singh, A.; Jha, A.K.; Yadava, P.; Choudhary, M.; Rakshit, S. Genetically modified crops: Current status and future prospects. Planta 2020, 251, 91. [Google Scholar] [CrossRef] [PubMed]
  3. Demeke, T.; Lee, S.-J.; Eng, M. Increasing the Efficiency of Canola and Soybean GMO Detection and Quantification Using Multiplex Droplet Digital PCR. Biology 2022, 11, 201. [Google Scholar] [CrossRef] [PubMed]
  4. Lee, D.-G.; Park, J.-E.; Kim, M.-J.; Kim, H.-J.; Kim, H.-Y. Detection of GM Canola MS11, DP-073496-4, and MON88302 events using multiplex PCR coupled with capillary electrophoresis. Food Sci. Biotechnol. 2021, 30, 565–570. [Google Scholar] [CrossRef] [PubMed]
  5. 32003R1829; Regulation (EC) No 1829/2003 of the European Parliament and of the Council. European Commission: Brussels, Belgium, 2003.
  6. Verginelli, D.; Paternò, A.; Marchis, M.L.D.; Quarchioni, C.; Vinciguerra, D.; Bonini, P.; Peddis, S.; Fusco, C.; Misto, M.; Marfoglia, C.; et al. Development and comparative study of a pat/bar real-time PCR assay for integrating the screening strategy of a GMO testing laboratory. J. Sci. Food Agric. 2020, 100, 2121–2129. [Google Scholar] [CrossRef] [PubMed] [Green Version]
  7. Yang, L.; Quan, S.; Zhang, D. Endogenous Reference Genes and Their Quantitative Real-Time PCR Assays for Genetically Modified Bread Wheat (Triticum aestivum L.) Detection. Methods Mol. Biol. 2017, 1679, 259–268. [Google Scholar]
  8. Silva, L.C.C.; Mayrink, D.B.; Bueno, R.D.; Piovesan, N.D.; Ribeiro, C.; Dal-Bianco, M. Reference Genes and Expression Analysis of Seed Desaturases Genes in Soybean Mutant Accessions. Biochem. Genet. 2022, 60, 937–952. [Google Scholar] [CrossRef]
  9. Demeke, T.; Dobnik, D. Critical assessment of digital PCR for the detection and quantification of genetically modified organisms. Anal. Bioanal. Chem. 2018, 410, 4039–4050. [Google Scholar] [CrossRef] [Green Version]
  10. Gerdes, L.; Iwobi, A.; Busch, U.; Pecoraro, S. Optimization of digital droplet polymerase chain reaction for quantification of genetically modified organisms. Biomol. Detect. Quantif. 2016, 7, 9–20. [Google Scholar] [CrossRef] [Green Version]
  11. Zeitler, R.; Pietsch, K.; Waiblinger, H.-U. Validation of real-time PCR methods for the quantification of transgenic contaminations in rape seed. Eur. Food Res. Technol. 2002, 214, 346–351. [Google Scholar] [CrossRef]
  12. Henderson, N.; Harmon, M.; Zhong, C.X. PCR-Based Detection and Quantification of a Transgenic Glyphosate-Tolerant Canola Using a Novel Reference Gene System. Food Anal. Methods 2016, 9, 353–361. [Google Scholar] [CrossRef] [Green Version]
  13. Wu, G.; Zhang, L.; Wu, Y.; Cao, Y.; Lu, C. Comparison of five endogenous reference genes for specific PCR detection and quantification of Brassica napus. J. Agric. Food Chem. 2010, 58, 2812–2817. [Google Scholar] [CrossRef]
  14. Demeke, T.; Ratnayaka, I. Multiplex qualitative PCR assay for identification of genetically modified canola events and real-time event-specific PCR assay for quantification of the GT73 canola event. Food Control. 2008, 19, 893–897. [Google Scholar] [CrossRef]
  15. Weng, H.; Yang, L.; Liu, Z.; Ding, J.; Pan, A.; Zhang, D. Novel Reference Gene, High-mobility-group protein I/Y, Usedin Qualitative and Real-Time Quantitative Polymerase Chain Reaction Detection of Transgenic Rapeseed Cultivars. J. Aoac. Int. 2005, 88, 577–584. [Google Scholar] [CrossRef] [PubMed] [Green Version]
  16. Li, Z.; Li, X.; Wang, C.; Song, G.; Pi, L.; Zheng, L.; Zhang, D.; Yang, L. One Novel Multiple-Target Plasmid Reference Molecule Targeting Eight Genetically Modified Canola Events for Genetically Modified Canola Detection. J. Agric. Food Chem. 2017, 65, 8489–8500. [Google Scholar] [CrossRef] [PubMed]
  17. Kim, J.-H.; Kim, T.-W.; Lee, W.-Y.; Park, S.-H.; Kim, H.-Y. Multiplex PCR Detection of the GT73, MS8xRF3, and T45 Varieties of GM Canola. Food Sci. Biotechnol. 2007, 16, 104–109. [Google Scholar]
  18. Demeke, T.; Eng, M. Effect of endogenous reference genes on digital PCR assessment of genetically engineered canola events. Biomol. Detect. Quantif. 2018, 15, 24–29. [Google Scholar] [CrossRef]
  19. Akiyama, H.; Makiyama, D.; Nakamura, K.; Sasaki, N.; Minegishi, Y.; Mano, J.; Kitta, K.; Ozeki, Y.; Teshima, R. A novel detection system for the genetically modified canola (Brassica rapa) line RT73. Anal. Chem. 2010, 82, 9909–9916. [Google Scholar] [CrossRef] [PubMed]
  20. Lliu, J.; Li, Z.-Y.; Gao, D.-W. A universal quantification of transgenic soybean event DAS-68416-4 using duplex digital PCR. J. Sci. Food Agric. 2021, 101, 624–630. [Google Scholar] [CrossRef]
  21. Corbisier, P.; Buttinger, G.; Savini, C.; Sacco, M.G.; Gatto, F.; Emons, H. Expression of GM content in mass fraction from digital PCR data. Food Control. 2022, 133, 108626. [Google Scholar] [CrossRef]
  22. Cottenet, G.; Blancpain, C.; Chuah, P.F. Performance assessment of digital PCR for the quantification of GM-maize and GM-soya events. Anal. Bioanal. Chem. 2019, 411, 2461–2469. [Google Scholar] [CrossRef]
  23. Bogozalec Kosir, A.; Demsar, T.; Stebih, D.; Zel, J.; Milavec, M. Digital PCR as an effective tool for GMO quantification in complex matrices. Food Chem. 2019, 294, 73–78. [Google Scholar] [CrossRef] [PubMed]
  24. Noma, S.; Kikuchi, Y.; Satou, M.; Tanaka, T.; Takiya, T.; Okusu, H.; Futo, S.; Takabatake, R.; Kitta, K.; Mano, J. Simple, Precise, and Less Biased GMO Quantification by Multiplexed Genetic Element-Specific Digital PCR. J. Aoac. Int. 2022, 105, 159–166. [Google Scholar] [CrossRef] [PubMed]
  25. Hernández, M.; Río, A.; Esteve, T.; Prat, S.; Pla, M. A rapeseed-specific gene, acetyl-CoA carboxylase, can be used as a reference for qualitative and real-time quantitative PCR detection of transgenes from mixed food samples. J. Agric. Food Chem. 2001, 49, 3622–3627. [Google Scholar] [CrossRef]
  26. Wu, Y.; Wu, G.; Xiao, L.; Lu, C. Event-specific qualitative and quantitative PCR detection methods for transgenic rapeseed hybrids MS1xRF1 and MS1xRF2. J. Agric. Food Chem. 2007, 55, 8380–8389. [Google Scholar] [CrossRef] [PubMed]
  27. Wu, G.; Wu, Y.; Xiao, L.; Lu, C. Event-specific qualitative and quantitative PCR methods for the detection of genetically modified rapeseed Oxy-235. Transgenic Res. 2008, 17, 851–862. [Google Scholar] [CrossRef] [PubMed]
  28. Wu, G.; Wu, Y.; Xiao, L.; Lu, C. Event-specific qualitative and quantitative PCR detection of genetically modified rapeseed Topas 19/2. Food Chem. 2009, 112, 232–238. [Google Scholar] [CrossRef]
  29. Arumuganathan, K.; Earle, E.D. Nuclear DNA Content of Some Important Plant Species. Plant Mol. Biol. Rep. 1991, 9, 208–218. [Google Scholar] [CrossRef]
  30. Deng, T.; Huang, W.; Ren, J.; Ma, X.; Ge, Y.; Chen, Y. Verification and applicability of endogenous reference genes for quantifying GM rice by digital PCR. Anal. Biochem. 2019, 587, 113442. [Google Scholar] [CrossRef]
  31. European Network of GMO Laboratories. Definition of Minimum Performance Requirements for Analytical Methods of GMO Testing; European Commission: Brussels, Belgium, 2008. [Google Scholar]
  32. European Network of GMO Laboratories. Verification of Analytical Methods for GMO Testing When Implementing Interlaboratory Validated Methods; European Commission: Brussels, Belgium, 2011. [Google Scholar]
  33. Paterno, A.; Marchesi, U.; Gatto, F.; Verginelli, D.; Quarchioni, C.; Fusco, C.; Zepparoni, A.; Amaddeo, D.; Ciabatti, I. Finding the joker among the maize endogenous reference genes for genetically modified organism (GMO) detection. J. Agric. Food Chem. 2009, 57, 11086–11091. [Google Scholar] [CrossRef]
  34. Yang, L.; Pan, A.; Zhang, H.; Guo, J.; Yin, C.; Zhang, D. Event-specific qualitative and quantitative polymerase chain reaction analysis for genetically modified canola T45. J. Agric. Food Chem. 2006, 54, 9735–9740. [Google Scholar] [CrossRef]
Figure 1. Average copy numbers for six ERGs (average of seven B. napus cultivars) plus standard deviation. For ddPCR, 12.5 ng DNA was used. The experimental data include all cultivars of Brassica napus, including GM canola of MS1, Oxy-235, and Topas 19/2 and four non-GM canola of AV-Jade, Zhongshuang-11, Nh No.345, and Zhongshuang–b.
Foods 11 02535 g001
Figure 2. ddPCR amplitude plots for Brassica napus cultivar of six reference genes. Amplification of CruA, HMG, BnC1, PEP, Fat(A), BnAcc genes from left to right. Blue, positive droplets; black, negative droplets. E02 and E04 to F12 are the detection positions in the 96-well PCR plate by QX2000.
Foods 11 02535 g002
Figure 3. Dynamic range and correlation between experimental copy numbers with assigned copy numbers of BnC1 and BnAcc assays. The average data of three independent experiments are represented (R2 values for BnC1 and BnAcc are 0.99 and 0.9994, respectively).
Foods 11 02535 g003
Figure 4. Validation of the RT-PCR and ddPCR methods using blinded samples with ERGs of BnAcc and BnC1 assays. The standard curves for the MS1-specific RT-PCR method using gradient-diluted MS1 genomic DNA as the template were analyzed using CFX96 System. gDNA samples with mass fractions of 10%, 5%, 1%, and 0.1% of MS1 were used as a template to quantify the specific MS1 gene (A) and reference BnC1 (B) and BnAcc (C) on the RT-PCR platform. The same samples were amplified on a ddPCR of MS1-specific gene (D); amplification of BnC1 and BnAcc genes (E).
Foods 11 02535 g004
Table 1. Primers and fluorescence probe used in this study.
GeneAccession No.Primer/Probe NameSequences
5′-3′
Amplicon (bp)Resource
CruAX14555CruA-FGGCCAGGGTTTC CGTGAT101[13]
CruA-RCCGTCGTTGTAGAACCATTGG
CruA-PFAM-AGTCCTTATGTGCTCCACTTTCTGGTGCA-TAMRA
Fat(A)AJ294419Fat(A)-FACAGATGAAGTTCGGGACGAGTAC126[7]
Fat(A)-RCAGGTTGAGATCCACATGCTTAAATAT
Fat(A)-PFAM-AAGAAGAATCATCATGCTTC-TAMRA
HMG-I/YAF127919HMG-FGGTCGTCCTCCTAAGGCGAAAG99[15]
HMG-RCTTCTTCGGCGGTCGTCCAC
HMG-PFAM-CGGAGCCACTCGGTGCCGCAACTT-TAMRA
BnC1X59294.1Ccf-FATTGGGCTACACCGGGATGTGT96[18]
Ccf-RGCTTCCGTGATATGCACC AGAAAG
Ccf-PFAM-CGATGGTGTCCCCAGTCCTTATGTGCTC-TAMRA
PEPD13987pep-FCAGTTCTTGGAGCCGCTTGAG140[12]
pep-RTGACGGATGTCGAGCTTCACA
pep-PFAM-ACAGACCTACAGCCGATGGAAGCCTGC-TAMRA
BnACCX77576Acc-FGGTGAGCTGTATAATCGAGCGA104[11]
Acc-RGGCGCAGCATCGGCT
Acc-PFAM-AACACCTATTAGACATTCGTTCCATTGGTCGA-TAMRA
MS1EU090198Ms1-FACGCTGCGGACATCTACATT187[25]
Ms1-RCTAGATCGGAAGCTGAAGATGG
Ms1-PFAM-CTCATTGCTGATCCACCTAGCCGACTT-TAMRA
OXY235KJ608141Oxy-FATTGACCATCATACTCATTGCTGA105[26]
Oxy-RAGAGAATCGTGAAATTATCTCTACCG
Oxy-PFAM-CCATGTAGATTTCCCGGACATGAAGCC-TAMRA
Topas 19/2EU124676Topas-FGTTGCGGTTCTGTCAGTTCC95[27]
Topas-RCGACCGGCGCTGATATATGA
Topas-PFAM-TCCCGCGTCATCGGCGG-TAMRA
Table 2. Specificity analysis of the endogenous reference genes.
Species/CultivarsSample NameCruAFat(A)HMG-I/YBnC1PEPBnAcc
Brassica junceaLu++++++
Simian Shanzha++++++
AB1++++++
Brassica rapaShanghai Qing++++++
Huangxin Wu++++++
10 wH008++++++
Brassica napusAV-Jade++++++
Zhongshuang-11++++++
Nh No.345++++++
Zhongshuang-b++++++
Ms1++++++
Oxy-235++++++
Topas 19/2++++++
Brassica oleraceaChinese kale+++-+-
Brassica nigrablack mustard++--+-
Brassica carinatEthiopian mustard+++-+-
Raphanus sativus L.radish++--++
Nicotiana tabacumtobacco------
Solanum tuberosumpotato------
Lycopericon esculentumtomato------
Glycine maxGM Soybean------
Zea maysGM corn------
Oryza sativaGM rice------
Gossypium hirsutumGM cotton------
Real-time PCR of these six ERG methods was performed in this test. (-) Negative result. (+) Positive result.
Table 3. Copy number variation of reference targets among seven Brassica napus cultivars.
Endogenous GenesCopy Numbers in Cultivars of Brassica napus. (12.5 ng Genome DNA)AverageRSDr a
MS1Oxy-235Topas 19/2AV-JadeZhongshuang-11Nh No.345Zhongshuang-b
HMG-I/Y904979568956746388569020785684517.90
Fat(A)969697319719968810,2108060986097097.21
CruA20,23517,15319,56015,80018,96318,93020,65018,7569.18
PEP19,24219,83420,15720,68820,26016,51019,56019,6077.13
BnC120,64320,50120,18920,43821,00021,30018,69320,5384.10
BnAcc944588629216867586579560965091524.59
a RSDr means the relative standard deviations of the average copy number of seven B. napus cultivars.
Table 4. aLOD and aLOQ of these six ERGs assays of Brassica napus.
TargetTemplate Copy No.Signal RatioMean Copy No.RSD Copy No. (%)
HMG-I/Y2015/151614.9
1015/15823.5
515/15641.4
27/15//
15/15//
Fat(A)2015/151912.2
1015/15922.6
512/15//
210/15//
14/15//
CruA2015/152219.8
1015/151324.7
515/15845.8
210/15//
15/15//
PEP2015/152313.5
1015/151320.9
513/15//
27/15//
15/15//
BnC12015/152112.1
1015/151120.3
515/15824.8
211/15//
18/18//
BnAcc2015/152214.7
1015/151018.9
515/15622.5
28/15//
16/15//
“/” means no data be calculated.
Table 5. Droplet digital PCR results obtained for GE canola samples using six reference genes.
GM Rapeseed EventMethodExogenous GeneBnAccBnC1
GM Content
by Mass Ratio
(%)
Average
Copy Numbers
Average
Copy Numbers
Experimental GM
Concentration (%)
Bias %Average
Copy Numbers
Experimental GM
Concentration (%)
Bias %
MS1Real-timePCR101056983010.747.4320,71510.201.96
555110,8405.081.6621,3855.153.06
111096871.1413.5520,3801.087.95
0.11399370.1220.7620,1500.1119.11
ddPCR1089096009.27−7.2920,9258.51−14.93
551794905.458.9620,8244.97−0.69
110291381.1211.6220,6100.99−1.02
0.1990880.10−0.9720,7000.09−13.04
Topas 19/2Real-timePCR10110010,86310.131.2620,43810.767.64
554094455.7214.3520,6975.224.36
19691601.054.8021,1040.91−9.02
0.11191000.1220.8818,0080.1222.17
ddPCR1095210,8008.81−11.8519,9388.15−18.55
540695074.27−14.5920,6805.6713.35
18510,5630.80−19.5321,1040.81−19.45
0.1810,2880.08−22.2419,0380.08−15.96
Oxy235Real-timePCR10110110,92510.080.7819,93811.0410.44
549994075.306.0918,9635.265.26
111010,5631.044.1420,6501.076.54
0.11192890.1218.4218,1300.1221.35
ddPCR1096610,9208.85−11.5417,36011.1311.29
547886575.5210.4319,0705.010.26
110092401.088.2319,8301.010.86
0.1996500.09−6.7421,0380.09−14.44
Publisher’s Note: MDPI stays neutral with regard to jurisdictional claims in published maps and institutional affiliations.

